Attached files
| file | filename |
|---|---|
| EX-31.1 - EX-31.1 - HEALTHSTREAM INC | d111635dex311.htm |
| EX-32.1 - EX-32.1 - HEALTHSTREAM INC | d111635dex321.htm |
| EX-21.1 - EX-21.1 - HEALTHSTREAM INC | d111635dex211.htm |
| EX-31.2 - EX-31.2 - HEALTHSTREAM INC | d111635dex312.htm |
| EX-10.11 - EX-10.11 - HEALTHSTREAM INC | d111635dex1011.htm |
| EX-23.1 - EX-23.1 - HEALTHSTREAM INC | d111635dex231.htm |
| EX-32.2 - EX-32.2 - HEALTHSTREAM INC | d111635dex322.htm |
Table of Contents
UNITED STATES
SECURITIES AND EXCHANGE COMMISSION
Washington, D.C. 20549
FORM 10-K
| x | ANNUAL REPORT PURSUANT TO SECTION 13 OR 15(d) OF THE SECURITIES EXCHANGE ACT OF 1934 |
FOR THE FISCAL YEAR ENDED DECEMBER 31, 2015
OR
| ¨ | TRANSITION REPORT PURSUANT TO SECTION 13 OR 15(d) OF THE SECURITIES EXCHANGE ACT OF 1934 |
FOR THE TRANSITION PERIOD FROM TO
Commission File Number 000-27701
HEALTHSTREAM, INC.
(Exact name of registrant as specified in its charter)
| Tennessee | 62-1443555 | |
| (State or other jurisdiction of incorporation or organization) |
(I.R.S. Employer Identification No.) | |
| 209 10th Avenue South, Suite 450 Nashville, Tennessee |
37203 | |
| (Address of principal executive offices) | (Zip Code) | |
(615) 301-3100
(Registrant’s telephone number, including area code)
Securities Registered Pursuant To Section 12(b) Of The Act:
| Title of each class |
Name of each Exchange on which registered | |
| Common Stock, No Par Value | NASDAQ Global Select Market |
Securities Registered Pursuant To Section 12(g) Of The Act: None
Indicate by check mark if the registrant is a well-known seasoned issuer, as defined in Rule 405 of the Securities Act. Yes ¨ No x
Indicate by check mark if the registrant is not required to file reports pursuant to Section 13 of 15(d) of the Act. Yes ¨ No x
Indicate by check mark whether the registrant (1) has filed all reports required to be filed by Section 13 or 15 (d) of the Securities Exchange Act of 1934 during the preceding 12 months (or for such shorter period that the registrant was required to file such reports), and (2) has been subject to such filing requirements for the past 90 days. Yes x No ¨
Indicate by check mark whether the registrant has submitted electronically and posted on its corporate Website, if any, every Interactive Data File required to be submitted and posted pursuant to Rule 405 of Regulation S-T during the preceding 12 months (or for such shorter period that the registrant was required to submit and post such files). Yes x No ¨
Indicate by check mark if disclosure of delinquent filers pursuant to Item 405 of Regulation S-K is not contained herein, and will not be contained, to the best of registrant’s knowledge, in definitive proxy or information statements incorporated by reference in Part III of this Form 10-K or any amendment to this Form 10-K. ¨
Indicate by check mark whether the registrant is a large accelerated filer, an accelerated filer, a non-accelerated filer, or a smaller reporting company. See the definitions of “large accelerated filer,” “accelerated filer” and “smaller reporting company” in Rule 12b-2 of the Exchange Act.
| Large accelerated filer | x | Accelerated filer | ¨ | |||
| Non-accelerated filer | ¨ | Smaller reporting company | ¨ | |||
Indicate by check mark whether the registrant is a shell company (as defined in Rule 12b-2 of the Act). Yes ¨ No x
The aggregate market value of the Common Stock issued and outstanding and held by non-affiliates of the Registrant, based upon the closing sales price for the Common Stock on the NASDAQ Global Select Market on June 30, 2015 was approximately $768.8 million. All executive officers and directors of the registrant have been deemed, solely for the purpose of the foregoing calculation, to be “affiliates” of the registrant.
As of February 23, 2016, there were 31,651,860 shares of the Registrant’s common stock outstanding.
DOCUMENTS INCORPORATED BY REFERENCE
Portions of the Registrant’s definitive Proxy Statement for its 2016 Annual Meeting of Shareholders are incorporated by reference into Part III hereof.
Table of Contents
TABLE OF CONTENTS
ANNUAL REPORT ON FORM 10-K
| Page | ||||||
| Item 1. |
1 | |||||
| Item 1A. |
10 | |||||
| Item 1B. |
18 | |||||
| Item 2. |
18 | |||||
| Item 3. |
18 | |||||
| Item 4. |
18 | |||||
| Item 5. |
19 | |||||
| Item 6. |
21 | |||||
| Item 7. |
Management’s Discussion and Analysis of Financial Condition and Results of Operations |
21 | ||||
| Item 7A. |
32 | |||||
| Item 8. |
33 | |||||
| Item 9. |
Changes in and Disagreements with Accountants on Accounting and Financial Disclosure |
58 | ||||
| Item 9A. |
58 | |||||
| Item 9B. |
58 | |||||
| Item 10. |
59 | |||||
| Item 11. |
59 | |||||
| Item 12. |
Security Ownership of Certain Beneficial Owners and Management and Related Stockholder Matters |
59 | ||||
| Item 13. |
Certain Relationships and Related Transactions, and Director Independence |
59 | ||||
| Item 14. |
59 | |||||
| Item 15. |
60 | |||||
| 61 | ||||||
Table of Contents
This Annual Report on Form 10-K contains forward-looking statements within the meaning of Section 21E of the Securities Exchange Act of 1934. Such forward-looking statements include, among others, those statements including the words “expects,” “anticipates,” “intends,” “believes,” “may,” “will,” “should,” “continue” and similar language or the negative of such terms or other comparable terminology. Although we believe that the expectations reflected in the forward-looking statements are reasonable, HealthStream’s actual results may differ significantly from those projected in the forward-looking statements. Factors that might cause or contribute to such differences include, but are not limited to, those discussed in the section “Risk Factors” in Item 1A of this Annual Report on Form 10-K and elsewhere in this document. In addition, factors that we are not currently aware of could harm our future operating results. You should carefully review the risks described in other documents HealthStream files from time to time with the Securities and Exchange Commission. You are cautioned not to place undue reliance on forward-looking statements, which speak only as of the date of this Annual Report on Form 10-K. HealthStream undertakes no obligation to publicly release any revisions to the forward-looking statements or reflect events or circumstances after the date of this document.
OVERVIEW AND HISTORY
HealthStream, Inc. (HealthStream or the Company) provides workforce, patient experience, and provider solutions for healthcare organizations—all designed to support the people that deliver patient care which, in turn, supports the improvement of business and clinical outcomes. Delivered primarily as Software-as-a-Service (“SaaS”), our solutions focus on some of the most significant challenges facing the healthcare workforce and healthcare organizations today, including the need to effectively manage, retain, engage, and develop healthcare workforce talent; meet rigorous compliance requirements; efficiently manage ongoing medical staff credentialing and privileging processes; and deliver optimal patient experiences of care in healthcare organizations.
With 26 years of experience, HealthStream is recognized as a leading innovator and thought leader in the healthcare industry for its healthcare workforce solutions. Using technology to enhance learning and productivity, HealthStream pioneered the delivery of online learning for hospitals’ required regulatory training as Internet-based training was first introduced. Stemming from that early success, demand for expanded learning solutions led the Company to build what is now a full eco-system of diverse HR and clinical-focused applications, courseware, assessments, and talent management programs. At year-end 2015—with over 4.6 million healthcare professionals subscribing to HealthStream’s platform through their respective organizations, HealthStream is a leading provider in workforce development in the healthcare industry.
With its singular healthcare focus, HealthStream understands that healthcare organizations want to provide their patients with an engaged, confident, and competent workforce that delivers optimal patient experiences. HealthStream’s solutions offer organizations a robust array of products and services that provide targeted insights to take actions that produce sustainable performance improvements. Moreover, HealthStream’s vast database of healthcare workforce benchmarks offer organizations a powerful tool to compare, assess, and fine-tune their strategies for managing initiatives to success.
HealthStream believes that the key to quality patient care is—and always has been—a result of the people who deliver care. To that end, the Company’s solutions support the recruiting, retaining, engaging, assessing, and developing the healthcare workforce, including medical staff who provide patient care in our customers’ organizations.
Headquartered in Nashville, Tennessee, the Company was incorporated in 1990 and began providing its SaaS-based workforce solutions in 1999, its survey and research solutions in 2005, and its provider solutions in 2012. Including additional offices in Laurel, Maryland; Nashville, Tennessee; Jericho, New York; Brentwood, Tennessee; San Diego, California; Boulder, Colorado; and Pensacola, Florida, HealthStream had 833 full-time and 139 part-time employees as of December 31, 2015. Our business has evolved from an initial focus on technology-based training to a company providing workforce development, patient experience, and provider solutions to the nation’s healthcare providers.
INDUSTRY BACKGROUND
According to the deputy director of the National Health Statistics Group at the Centers for Medicare and Medicaid Services (CMS), spending in the healthcare industry reached approximately $3.0 trillion in 2014, or 17.5% of the U.S. gross domestic product. Hospital care expenditures accounted for approximately 32.4% of the $3.0 trillion industry. According to the Bureau of Labor Statistics, approximately 18.9 million professionals are employed in the healthcare segment of the domestic economy, with approximately 4.8 million employed in acute-care hospitals and approximately 3.3 million employed in post-acute-care organizations, our primary target markets for our products. As of December 31, 2015, approximately 4.62 million healthcare professionals were subscribers to our SaaS-based solutions, which include 4.48 million subscribers already implemented and 142,000 subscribers in the process of implementation.
All of the 4.8 million hospital-based healthcare professionals that work in the nation’s approximately 5,000 acute-care hospitals are required by federal mandates and accrediting bodies to complete training in a number of areas. This training includes safety training mandated by both the Occupational Safety and Health Administration (OSHA) and The Joint Commission (an independent, not-for-profit organization that accredits and certifies healthcare organizations and programs in the United States), as well as training on patient information confidentiality required under the Health Insurance Portability and Accountability Act (HIPAA).
1
Table of Contents
In hospitals, staffing issues and personnel shortages have also contributed to the need for facility based workforce development as well as additional assessment and competency based training. An ongoing nursing shortage, for example, is resulting in skill gaps and rising costs. The U.S. Bureau of Labor Statistics projects the need for 525,000 replacement nurses over the next several years, bringing the total number of openings for nurses due to growth and replacements to 1.05 million by 2022. We believe that offering training and education for hospital personnel is increasingly being utilized as a retention and recruitment incentive.
Many healthcare professionals use continuing education to keep abreast of the latest developments and meet licensing and certification requirements. Continuing education is required for nurses, emergency medical services personnel, first responder personnel, radiologic personnel, and physicians. Pharmaceutical and medical device companies must also provide their medical industry sales representatives with training mandated for the healthcare industry and training for new products. Such companies also provide support and content for education and training of audiences that use their products in healthcare organizations.
A large portion of the nation’s hospitals utilize research and survey tools to gain insight about patients’ experiences, to assess workforce competency and engagement, to determine the status of physician relations, and to measure the perceptions about the hospitals in the communities they serve. Industry-wide interest is increasing in research due in part, to the CAHPS® (Consumer Assessment of Healthcare Providers and Systems) Hospital Survey launched by CMS in partnership with the Agency for Healthcare Research and Quality (AHRQ). Hospitals must submit data to CMS for certain required quality measures—which for inpatients includes the CAHPS® Hospital Survey—in order to receive the full market basket increase to their reimbursement payment rates from CMS. Hospitals that fail to submit this survey data will incur a reduction in the inpatient market basket update amount for the following federal fiscal year. We are designated as a certified vendor for and offer CAHPS® Hospital Survey services.
The healthcare education and training industry is highly fragmented, varies significantly in delivery methods (i.e., online products, live events, written materials, and manikins for simulation-based training), and is composed of a wide variety of entities competing for customers. The sheer volume of healthcare information available to satisfy continuing education needs, rapid advances in medical developments, and the time constraints that healthcare professionals face make it difficult to quickly and efficiently access the continuing education content most relevant to an individual’s practice or profession. Historically, healthcare professionals have received continuing education and training through offline publications, such as medical journals or by attending conferences and seminars. In addition, other healthcare workers and pharmaceutical and medical device manufacturers’ sales and internal regulatory personnel usually fulfill their training from external vendors or internal training departments. While these approaches satisfy the ongoing education and training requirements, they are typically costly and inconvenient. In addition, live courses are often limited in the breadth of offerings and do not provide a method for tracking training completion. The results of these traditional methods, both from a business and compliance standpoint, are difficult to track and measure. While hospitals and health systems occasionally survey their patients, physicians, and employees using their own internal resources, the practice is limited since they do not typically possess the valuable comparative benchmarking data that is available from independent survey research vendors.
Provider data management has become more complex and arduous for healthcare organizations. Spurred by the Joint Commission Medical Staff standards and other regulatory requirements, credentialing and privileging has been transformed from a periodic review to continuous, evidence-driven analysis of professional competency and provider performance. This transformation requires ongoing, automatic monitoring of licenses, sanctions, and exclusions, as well as expanding the area to review at initial and re-credentialing. In addition, provider enrollment processes have compounded in difficulty. For example, a single provider may need to enroll annually with some 30-40 payers, with each payer application often taking two to four hours to complete.
Finally, the hospital industry continues to operate under intense pressure to reduce costs as a result of reductions in government reimbursement rates and increased focus on cost containment consistent with participation of patients in managed care programs. In addition, hospitals, as well as pharmaceutical and medical device companies, continue to experience rising operating costs, coupled with increased pressure to measure and report on the outcomes of the dollars spent on training. Our products and services are designed to meet these needs by reducing healthcare organizations’ costs of training while improving learning outcomes, enhancing reporting capabilities, and supporting customers’ business objectives.
HEALTHSTREAM’S SOLUTIONS
HealthStream’s products and services are organized into three segments—Workforce Solutions, Patient Experience Solutions, and Provider Solutions—that collectively help healthcare organizations meet their ongoing talent management, training, education, assessment, competency management, compliance, provider credentialing & privileging management, and provider enrollment needs. HealthStream’s solutions are provided to a wide range of customers within the healthcare industry across the continuum of care.
HealthStream Workforce Solutions— Our workforce development solutions, which are comprised primarily of SaaS, subscription-based products, are used by healthcare organizations to meet a broad range of their talent management, training, certification, competency assessment, performance appraisal, and development needs. Our numerous content libraries allow our customers to subscribe to a wide array of additional courseware, which includes content from leading healthcare and nursing associations, medical and healthcare publishers, and other content providers. Additionally, medical device companies and other industry partners offer online training support through HealthStream’s platform for their products and they sponsor continuing education directly to healthcare workers.
2
Table of Contents
At December 31, 2015, HealthStream had approximately 4.62 million “total subscribers” to its subscription-based solutions. Each individual end-user who utilizes at least one HealthStream subscription-based solution is counted as one subscriber, regardless of the number of subscriptions contracted by or for that end-user. Our subscription-based solutions include any one or a combination of our many platform applications, plus courseware, or content. For example, we deliver courseware to our customers primarily through our learning application, the HealthStream Learning Center™ (HLC), while we deliver competency management and performance appraisal tools through our applications known as the HealthStream Competency Center (HCC) and HealthStream Performance Center (HPC), respectively, which are all on our SaaS-based platform, along with a series of other applications.
Pricing for the HLC, HCC, and HPC are subscription based, with fees based on the number of subscribers, courseware provided, and other factors. We offer training, implementation, and account management services to facilitate adoption of our subscription-based solutions. Fees for training are based on the time and efforts of the personnel involved. Implementation fees vary based on the size, scope, and complexity of the project. Our SaaS-based platform and subscription-based solutions are hosted in a central data center that allows authorized subscribers Internet access to our services, thereby eliminating the need for onsite local implementations of installed workforce development products. During 2015, 2014, and 2013, our subscription-based solutions accounted for approximately 74%, 76%, and 72% of consolidated revenues, respectively.
Other Applications on our Platform — HealthStream offers an array of other applications on our platform, each serving a unique function for hospitals and health systems. Each application on our platform has its own value proposition and revenue stream. Examples of individual applications that are offered on our platform include applications for recruiting and applicant tracking; learning; performance appraisal; compensation management; succession planning; competency management; credentialing and privileging; provider enrollment; disclosure management; clinical development; simulation-based education; and industry-sponsored training.
HealthStream Patient Experience Solutions — Our patient experience solutions complement HealthStream’s workforce solutions’ product and service offerings by providing customers with Patient Insights™, Employee Insights™, Physician Insights™, and Community Insights™ surveys, data analyses of survey results, and other research-based measurement tools. Our services are designed to provide thorough analyses with insightful recommendations for change; benchmarking capability using our comprehensive databases; and consulting services to identify solutions for our customers based on their survey results. Clients are able to access and analyze their survey results data through Insights Online™, our secure web-based reporting platform.
As a CMS-approved vendor, HealthStream offers its customers full services to meet their Consumer Assessment of Healthcare Providers and Systems, or CAHPS, program requirements. Along with the mandatory-for-hospitals CAHPS (HCAHPS), the Company offers a range of solutions for other mandated CAHPS reporting, including those for accountable care organizations, medical groups, and home health organizations. Other CAHPS survey services are offered for fulfilling voluntary reporting needs for pediatrics, emergency departments, hospice, in-center hemodialysis, and outpatient surgery.
All of our survey and research solutions focus on providing statistically valid data to assist our customers with their decision making related to their organization’s performance improvement objectives. In addition to collecting and reporting data, we provide analysis and consulting to help customers understand and improve their survey results and patient experiences and the underlying impact on their business. Pricing for these services is based on the survey type, delivery method, size of the survey instrument, sample size, frequency of survey cycles, and other factors. During 2015, 2014, and 2013, our Patient Insights™ survey product accounted for approximately 13%, 14%, and 17% of consolidated revenues, respectively.
HealthStream Provider Solutions – Our provider solutions are offered through our business segment that is branded in the marketplace as “Echo, a HealthStream Company.” Echo solutions enable healthcare organizations to launch paperless credentialing processes, reduce provider enrollment timelines, accelerate the provider onboarding process, and drive improvement through validated provider profiles. Together, more than 2,000 healthcare organizations in the U.S. use one or more Echo products.
EchoCredentialing™ is a comprehensive platform that manages medical staff credentialing and privileging processes. Healthcare organizations leverage EchoCredentialing to support enterprise-wide or regional Credentialing Verification Organizations (CVOs), unified privileging, peer review, one-click integration with CVO services, and the move to paperless processes. EchoOneApp™is a provider enrollment platform, which includes automatic form population directly from a continuously updated library of 3,500+ preformatted payer form templates as well as online form integration with CAQH, CMS, PECOS, and state-based payer enrollment sites. EchoAccess™is our enterprise class platform to support hospital call centers with physician referral, call triage, provider directories, class enrollment, and discharge planning functionalities. EchoAnalytics™ offers a wide array of validation tools and EchoOnboarding™ consists of an onboarding dashboard with a workflow functionality, along with onboarding navigator tools to facilitate coordination of the provider onboarding process.
BUSINESS COMBINATIONS
We acquired substantially all of the assets of Baptist Leadership Group (BLG) in September 2013, acquired Health Care Compliance Strategies, Inc. (HCCS) in March 2014 and acquired HealthLine Systems, LLC (HLS) in March 2015. For additional information regarding acquisitions, please see Note 5 of the Consolidated Financial Statements and Item 7, “Management’s Discussion and Analysis of Financial Condition and Results of Operations” included elsewhere in this report.
3
Table of Contents
CUSTOMERS
We provide our solutions to customers across a broad range of entities within the healthcare industry, including private, not for profit, and government entities, as well as pharmaceutical and medical device companies. We derive a substantial portion of our revenues from a relatively small number of customers, although no single customer represented more than 10 percent of our revenues during 2015, 2014, or 2013. Examples of customers that have purchased or contracted for products and services from HealthStream include: Ardent Health Services; Saint Luke’s Health System; HCA Holdings, Inc.; Community Health Systems, Inc.; McLaren Health Care Corporation; Sutter Health; and Tenet Healthcare Corporation.
SALES AND MARKETING
We market our products and services primarily through our direct sales teams, who are based at our corporate headquarters in Nashville, Tennessee and in our additional offices located in Laurel, Maryland; Jericho, New York; Brentwood, Tennessee; San Diego, California and Pensacola, Florida as well as remote home office sales locations. As of December 31, 2015, our HealthStream Workforce Development Solutions sales personnel consisted of 105 employees who carried sales quotas; our HealthStream Patient Experience Solutions sales personnel consisted of 15 employees who carried sales quotas; and our Provider Solutions sales personnel consisted of 17 employees who carried sales quotas. We also have nine employees who support our sales teams with sales force productivity and optimization, onboarding, training, and administration services.
We conduct a variety of marketing programs to promote our products and services, including product catalogs, user groups—including our annual customer Summit, trade shows, internet promotion and demonstrations, telemarketing campaigns, public relations, distribution of product-specific literature, direct mail, and advertising.
Over most of the last fourteen years, we have hosted an annual conference in Nashville, Tennessee for our customers known as the “Summit.” We have utilized this client conference to reach out to existing and potential customers and business partners, provide training and educational services, and to demonstrate our new and existing product offerings. We have marketing teams that are responsible for these initiatives and for working with and supporting our product management and sales teams. At December 31, 2015, our marketing personnel consisted of 29 employees.
OPERATIONS AND TECHNOLOGY
We believe our ability to establish and maintain long-term customer relationships, adoption of our products and services, recurring sales, and development and maintenance of new and existing products are dependent on the strength of our operations, customer service, product development and maintenance, training, and other support teams. As of December 31, 2015, our Workforce Development Solutions operations team consisted of 302 employees associated with customer support, implementation services, product development and maintenance, training, and project management; our Patient Experience Solutions operations team consisted of 352 employees (of which 205 employees worked in our interviewing centers) associated with phone interviewing, distributing and processing paper-based survey instruments, patient experience coaching and consulting, data analysis and reporting of survey results, and project management; and our Provider Solutions operations team consisted of 69 employees associated with implementation services, data integration, product development and quality assurance, credentials verification, consulting, and other services.
Our services are designed to be reliable, secure, and scalable. Our software is a combination of proprietary and commercially available software and operating systems. Our software solutions support hosting and management of content, publication of our web sites, execution of courseware, registration and tracking of users, collection, sampling, and analysis of survey data, tracking and reporting of physician credentialing and provider enrollment information, and reporting of information for both internal and external use. We designed the platforms that provide our services to allow each component to be independently scaled by adding commercially available hardware and a combination of commercially available and proprietary software components.
Our software applications, servers, and network infrastructure that deliver our services are hosted by a combination of third-party data center providers and HealthStream owned data centers. We maintain fully redundant disaster recovery data centers which are located in geographically separate locations. Our technology equipment is maintained in secure, limited access environments, supported by redundant power, environmental conditioning, and network connectivity, and we follow industry best practices for backup and disaster recovery. Company personnel monitor all servers, networks, and systems on a continuous basis, and we employ enterprise firewall systems and data abstraction to protect our databases, customer information, and courseware library from unauthorized access.
4
Table of Contents
COMPETITION
In addition to the competing healthcare education delivery methods in the industry, we also have direct competitors. In our workforce solutions business segment, a number of companies offer competitive learning management products and talent management modules to the healthcare industry. We compete with companies such as Cornerstone OnDemand, Healthcare Source, Oracle, SABA, SAP, and SumTotal Systems that provide their services to multiple industries, including healthcare. We also compete with large medical publishers that have operating units that offer learning management systems that focus on healthcare, such as Reed Elsevier Group’s MC Strategies. In our patient experience business segment, we face competition from large nationally recognized research firms such as Avatar International, Gallup, National Research Corporation, Press Ganey Associates, Studer Group, Professional Research Consultants, Inc., and others. Our patient experience business also experiences direct competition from vendors who provide research services to other industries including Kenexa, which is now owned by IBM, and Foresight, which is now owned by TNS Global. In our provider solutions business segment, we see competition primarily from several large companies, such as MD-Staff, Morissey & Associates, and Cactus Software.
We believe our workforce solutions, which include both products and services that facilitate training, assessment, and development for healthcare professionals, a wide assortment of courseware, a mechanism for measuring satisfaction and/or other results, and the ability to provide all our services on a single platform over the Internet, provide us with a competitive advantage. In our patient experience business segment, we believe our large proprietary database of survey results, technology infrastructure designed to automate the processing of survey results, proprietary core survey instruments and action plan development methodology, and our ability to quickly deliver relevant online courseware targeted at addressing survey related findings provide us with a competitive advantage. In our provider solutions business segment, we believe the scope and quality of our products, capability to connect medical staff credentialing with provider enrollment, and innovative new predictive analytics provide us with a competitive advantage. We believe that the principal competitive factors affecting the marketing of our workforce, patient experience, and provider solutions to the healthcare industry include:
| • | features of our SaaS-based platform and applications, including reporting, management functionality, ability to manage a variety of events or modalities, courseware assignment, curriculum management, documenting competency assessments and performance appraisals, scalability, and the ability to track utilization and results; |
| • | scope and variety of Internet-based learning courseware available, including mandated content for OSHA, The Joint Commission, patient safety, and HIPAA requirements, ICD-10 training, competency-based content, courseware scenarios that drive simulators, courseware that provides CPR certification, as well as the ability of our customers to create and host their own web-enabled courseware; |
| • | our singular focus on the healthcare industry and our deep healthcare expertise; |
| • | scope and quality of professional services offered, including survey execution, implementation, benchmarking, training and the expertise and technical knowledge of the customers’ employees; |
| • | competitive pricing, which supports a return on investment to customers when compared to other alternative delivery methods; |
| • | customer service and support; |
| • | effectiveness of sales and marketing efforts; and |
| • | company reputation. |
Collectively, we believe these capabilities provide us with the ability to improve the quality of healthcare by assessing and developing the people who deliver care.
GOVERNMENT REGULATION OF THE INTERNET AND THE HEALTHCARE INDUSTRY
Regulation of the Internet and the Privacy and Security of Personal Information
The laws and regulations that govern our business change rapidly. The following are some of the evolving areas of law that are relevant to our business:
| • | Privacy and Security Laws. Federal, state and foreign privacy and security regulations and other laws restricting the collection, use, security and disclosure of personal information limit our ability to collect information or use and disclose the information in our databases or derived from other sources to generate revenues. It may be costly to implement security or other measures designed to comply with any new legislation. |
| • | Content Regulation. Both foreign and domestic governments have adopted and proposed laws governing the content of material transmitted over the Internet. These include laws relating to obscenity, indecency, libel and defamation. We could be liable if content delivered by us violates these regulations. |
5
Table of Contents
| • | Information Security Accountability Regulation. As a business associate of our customers, we are required to report certain breaches of protected health information to our customers, which must in turn notify affected individuals, the U.S. Department of Health and Human Services (HHS) and, in certain situations involving large breaches, the media. All non-permitted uses or disclosures of unsecured, protected health information are presumed to be breaches unless the covered entity or business associate establishes that there is a low probability the information has been compromised. In addition, we are subject to certain state laws that relate to privacy or the reporting of security breaches. For example, California law requires notification of security breaches involving personal information and medical information. We may incur costs to comply with these privacy and security requirements. Because many of these laws are new and there is little guidance related to many of these laws, it is difficult to estimate the cost of our compliance with these laws. Further, Congress has considered bills that would require companies to engage independent third parties to audit the companies’ computer information security. If the Company is required to report a breach of security or if one of the Company’s customers is required to report a breach of security by the Company, the Company’s business could be negatively impacted. |
| • | Sales and Use Tax. Through December 31, 2015, we collected sales, use or other taxes on taxable transactions in states in which we have employees or have a significant level of sales activity. While HealthStream expects that this approach is appropriate, other states or foreign jurisdictions may seek to impose tax collection obligations on companies like us that engage in online commerce. If they do, these obligations could limit the growth of electronic commerce in general and limit our ability to profit from the sale of our services over the Internet. |
Laws and regulations directly applicable to content regulation, e-commerce, Internet communications, and the privacy and security of personal information are becoming more prevalent. Congress continues considering laws regarding Internet taxation. The dynamic nature of this regulatory environment increases the uncertainty regarding the marketplace impact of such regulation. The enactment of any additional laws or regulations may increase our cost of conducting business or otherwise harm our business, financial condition and operating results.
Regulation of Education, Training and Other Services for Healthcare Professionals
Occupational Safety and Health Administration (OSHA). OSHA regulations require employers to provide training to employees to minimize the risk of injury from various potential workplace hazards. Employers in the healthcare industry are required to provide training with respect to various topics, including blood borne pathogens exposure control, laboratory safety and tuberculosis infection control. OSHA regulations require employers to keep records of their employees’ completion of training with respect to these workplace hazards.
The Joint Commission. The Joint Commission mandates that employers in the healthcare industry provide certain workplace safety and patient interaction training to employees. Training required by The Joint Commission may include programs on infection control, patient bill of rights, radiation safety, and incident reporting. Healthcare organizations are required to provide and document training on these topics to receive accreditation from The Joint Commission. In addition, The Joint Commission imposes continuing education requirements on physicians that relate to each physician’s specific staff appointments.
Health Insurance Portability and Accountability Act (HIPAA). HIPAA regulations require certain organizations (known as covered entities), including most healthcare providers and health plans, to adopt safeguards regarding the use and disclosure of health-related information. HIPAA regulations also require these organizations to provide reasonable and appropriate safeguards to protect the privacy, integrity and confidentiality of individually identifiable healthcare information. Covered entities are required to establish, maintain and provide training with regard to their policies and procedures for protecting the integrity and confidentiality of individually identifiable healthcare information and must document training on these topics to support their compliance. Certain HIPAA privacy and security requirements apply to (entities known as business associates that handle individually identifiable healthcare information on behalf of covered entities) companies and business associates and their subcontractors may be directly subject to criminal and civil sanctions for violations of HIPAA privacy and security standards.
The American Nurses Credentialing Center (ANCC). ANCC, a subsidiary of the American Nurses Association (ANA), provides individuals and organizations throughout the nursing profession with the resources they need to achieve practice excellence. ANCC’s internationally renowned credentialing programs certify nurses in specialty practice areas; recognize healthcare organizations for promoting safe, positive work environments through the Magnet Recognition Program® and the Pathway to Excellence® Program; and accredit providers of continuing nursing education. In addition, ANCC’s Institute for Credentialing Innovation® offers an array of informational and educational services and products to support its core credentialing programs. ANCC certification exams validate nurses’ skills, knowledge, and abilities. More than a quarter million nurses have been certified by ANCC since 1990. More than 80,000 advanced practice nurses are currently certified by ANCC. The ANCC Magnet Recognition Program® recognizes healthcare organizations that provide the very best in nursing care and professionalism in nursing practice. The program also provides a vehicle for disseminating best practices and strategies among nursing systems. The ANCC Magnet Recognition Program is a highly recognized standard for nursing excellence. The Pathway to Excellence® Program recognizes the essential elements of a high standard nursing practice environment. The designation is earned by healthcare organizations that create work environments where nurses can develop professionally. The award substantiates the professional satisfaction of nurses and identifies best places to work.
6
Table of Contents
Continuing Nursing Education (CNE). State nurse practice laws are usually the source of authority for establishing the state board of nursing requirements. The state board of nursing establishes the state’s CNE requirements for professional nurses. CNE credits are provided through accredited providers that have been approved by the ANCC Commission on Accreditation and/or the state board of nursing. CNE requirements vary widely from state to state. Thirty-four states require registered nurses to certify that they have accumulated a minimum number of CNE credits in order to maintain their licenses. In some states, the CNE requirement only applies to re-licensure of advance practice nurses, or additional CNEs may be required of this category of nurses. Required CNE ranges from 12 to 45 credits annually, with reporting generally on a bi-annual basis. Board certifications (e.g., CNOR – certification of perioperative nursing) also require CNE credits, with certain percentages required in specific categories based on the certification type. We are an accredited provider of CNE by the ANCC.
Continuing Medical Education (CME). State licensing boards, professional organizations and employers require physicians to certify that they have accumulated a minimum number of continuing medical education hours to maintain their licenses. Generally, each state’s medical practice laws authorize the state’s board of medicine to establish and track CME requirements. Forty-eight state medical licensing boards currently have CME requirements, as well as Puerto Rico, Guam, and the U.S. Virgin Islands. The number of CME hours required by each state ranges from 15 to 50 hours per year. Other sources of CME requirements are state medical societies and practice specialty boards. The failure to obtain the requisite amount and type of CME could result in non-renewal of the physician’s license to practice medicine and/or membership in a medical or practice specialty society. American Medical Association (AMA) classifies continuing medical education activities as either Category 1, which includes formal CME activities, or Category 2, which includes most informal activities. Sponsors can only designate CME activities for AMA PRA Category 1 Credit™. Most agencies nationwide that require CME participation specify AMA PRA Category 1 Credit™. Only institutions and organizations accredited to provide CME can designate an activity for AMA PRA Category 1 Credit™. The Accreditation Council for Continuing Medical Education (ACCME) is responsible for awarding accreditation status to state medical societies, medical schools, and other institutions and organizations that provide CME activities for a national audience of physicians. Only institutions and organizations are accredited. State medical societies, operating under the aegis of the ACCME, accredit institutions and organizations that provide CME activities primarily for physicians within the state or bordering states. We are an accredited provider of CME by the ACCME.
Centers for Medicare & Medicaid Services (CMS). CMS has articulated a vision for health care quality—the right care for every person every time. To achieve this vision, CMS is committed to care that is safe, effective, timely, patient-centered, efficient, and equitable. Value-based purchasing (VBP), which links payment more directly to the quality of care provided, is a strategy that can help to transform the current payment system by rewarding providers for delivering high quality, efficient clinical care. Through a number of public reporting programs, demonstration projects, pilot programs, and voluntary efforts, CMS has launched VBP initiatives in hospitals, physician offices, nursing homes, home health services, and dialysis facilities. Further, pursuant to the Patient Protection and Affordable Care Act, as amended by the Healthcare and Education Reconciliation Act of 2010 (collectively, ACA), CMS is implementing a number of initiatives designed to link payments to quality and efficiency, including a VBP program for inpatient hospital services.
Consumer Assessment of Healthcare Providers and Systems (CAHPS). CMS has partnered with AHRQ to develop a standardized survey instrument and data collection methodology for measuring patients’ perspectives on hospital care. The intent of the survey is to produce comparable data on the patients’ perspectives to allow consumer-based comparisons between hospitals, align incentives to drive hospitals to improve their quality of care, and increase the transparency of hospital reporting. Hospitals must submit data for certain required quality measures—which for inpatients includes the CAHPS® Hospital Survey—in order to receive the full market basket increase to their reimbursement payment rates from CMS. While hospital participation is voluntary, hospitals that fail to submit this survey data will incur a reduction of two percentage points in the inpatient market basket update amount for the following federal fiscal year. We have received certified vendor designation and will continue to offer CAHPS® Hospital Survey services. In addition, we are a certified vendor approved to offer CAHPS® Home Health Care Survey used to measure the experiences of people receiving home health care from Medicare-certified home health agencies. We also offer CAHPS® Clinician and Group Survey used to measure patient experiences with health care providers and staff in doctor’s offices.
Medicare and Medicaid Electronic Health Records (EHR) Incentive Programs. The Medicare and Medicaid EHR Incentive Programs provide incentive payments to eligible professionals, eligible hospitals and critical access hospitals (CAHs) as they adopt, implement, upgrade or demonstrate meaningful use of certified EHR technology. By putting into action and meaningfully using an EHR system, providers will reap benefits beyond financial incentives–such as reduction in errors, availability of records and data, reminders and alerts, clinical decision support, and e-prescribing/refill automation.
Allied Disciplines. Various allied health professionals are required to obtain continuing education to maintain their licenses. For example, emergency medical services personnel may be required to acquire up to 20 continuing education hours per year, all or a portion of which can be fulfilled online. These requirements vary by state and depend on the classification of the employee.
Other Continuing Education. We are also an accredited provider of continuing education and continuing pharmacy education by the Association of Surgical Technologists, Inc. (AST) and the Accreditation Council for Pharmacy Education (ACPE), respectively.
7
Table of Contents
Regulation of Educational Program Sponsorship and Support
There are a variety of laws and regulations that affect the relationships between our medical device and pharmaceutical customers and the users of our products and services, including the sponsorship and support of educational programs. For example, the Physician Payment Sunshine Act (“Sunshine Act”) requires manufacturers of drugs, biological devices and medical devices covered by Medicare, Medicaid, or the Children’s Health Insurance Program to report annually to CMS payments and other transfers of value, including educational programs, given by such manufacturers to physicians and teaching hospitals, with limited exceptions. CMS has issued a final rule implementing the Sunshine Act. Manufacturers are required to report the physician’s name, business address and national provider identifier as well as other information including the value, date, form and nature of what is offered. CMS publishes the information on its website. Manufacturers that do not meet the reporting obligations will be subject to significant monetary penalties.
Further, the Office of Inspector General (OIG) has issued Compliance Program Guidance for Pharmaceutical Manufacturers and for the Durable Medical Equipment, Prosthetics, Orthotics, and Supply Industry (collectively, the Guidelines). The Guidelines address compliance risks raised by the support of continuing educational activities by pharmaceutical and medical device companies. The Guidelines have affected and may continue to affect the type and extent of commercial support we receive for our continuing education activities. The trade associations for the pharmaceutical and medical device industries (PhRMA and AdvaMed, respectively) have also promulgated their own codes of ethics that further restrict the interactions between industry and health care professionals. In addition, the AMA has established its own code of ethics regarding Gifts to Physicians from Industry to provide standards of conduct for the medical profession. The Company follows the rules and guidelines provided by ACCME, ANCC, and other continuing education accrediting bodies to ensure that its continuing education programming is free from commercial bias and consistent with the Guidelines.
The U.S. Food and Drug Administration (FDA) and the Federal Trade Commission (FTC)
Current FDA and FTC rules and enforcement actions and regulatory policies or those that the FDA or the FTC may develop in the future could have a material adverse effect on our ability to provide existing or future applications or services to our end users or obtain the necessary corporate sponsorship to do so. The FDA and the FTC regulate the form, content and dissemination of labeling, advertising and promotional materials, including direct-to-consumer prescription drug and medical device advertising, prepared by, or for, pharmaceutical, biotechnology or medical device companies. The FTC regulates over-the-counter drug advertising and, in some cases, medical device advertising. Generally, regulated companies must limit their advertising and promotional materials to discussions of the FDA-approved indications and, in limited circumstances, to a limited number of indications not approved by the FDA. Therefore, any truthful or untruthful information that promotes the use of pharmaceutical or medical device products that is presented with our services is subject to the FDA and FTC requirements and regulatory oversight including criminal, civil and administrative actions. We believe that banner advertisements, sponsorship links and any educational programs that lack independent editorial control that we may present with our services could be subject to FDA or FTC regulation. While the FDA and the FTC place the principal burden of compliance with advertising and promotional regulations on the advertiser, if the FDA or FTC finds that any regulated information presented with our services violates FDA or FTC regulations, they may take regulatory action against us or the advertiser or sponsor of that information. In addition, the FDA may adopt new regulatory policies that more tightly regulate the format and content of promotional information on the Internet.
INTELLECTUAL PROPERTY AND OTHER PROPRIETARY RIGHTS
To protect our proprietary rights, we rely generally on copyright, trademark and trade secret laws; confidentiality agreements and procedures with employees, consultants and other third parties; contractual provisions in license agreements with consultants, vendors and customers; and use measures designed to control access to our software, documentation and other proprietary information. We own federal trademark and service mark registrations for several marks, including without limitation “EXCELLENCE THROUGH INSIGHT’, “HEALTHSTREAM”, “HOSPITAL DIRECT”, “OR PROTOCOL”, “PATIENT INSIGHTS”, “PHYSICIAN INSIGHTS”, “INSIGHTS ONLINE”, “INSIGHT INTO ACTION”, “QUALITY CHECK”, “SIMCENTER”, “SIMMANAGER”, and “SIMSTORE.” We also have obtained registration of the “HEALTHSTREAM” mark in certain other countries. Applications for several trademarks are currently pending. However, there can be no assurance that we will be successful in obtaining registration of other trademarks for which we have applied.
The courseware that we license to our customers is developed through a combination of license agreements with publishers and authors, assignments and work-for-hire arrangements with third parties, and development by employees. We require publishers, authors and other third parties to represent and warrant that their content does not infringe on or misappropriate any third-party intellectual property rights and that they have the right to provide their content and have obtained all third-party consents necessary to do so. Our publishers, authors and other third parties also agree to indemnify us against certain liability we might sustain due to the content they provide.
If a third party asserts a claim that we have infringed its patents or other intellectual property right, we may be required to redesign our products or enter into royalty or licensing agreements. In addition, we license technologies from third parties for incorporation into our services. Royalty and licensing agreements with these third parties may not be available on terms acceptable to us, if at all. Additionally, despite the steps we have taken to protect our intellectual property and proprietary rights, our efforts may not be adequate. Third parties may infringe or misappropriate our intellectual property, and such violations of our intellectual property are difficult to detect and police. Competitors may also independently develop technologies that are substantially equivalent or superior to the technologies we employ in our products or services. If we fail to protect our proprietary rights adequately, our competitors could offer similar services, potentially significantly harming our competitive position and decreasing our revenues.
8
Table of Contents
AVAILABLE INFORMATION
The Company files reports with the SEC, including annual reports on Form 10-K, quarterly reports on Form 10-Q and other reports from time to time. The public may read and copy any materials we file with the SEC at the SEC’s Public Reference Room at 100 F Street, NE, Washington, DC 20549. The public may obtain information on the operation of the Public Reference Room by calling the SEC at 1-800-SEC-0330. The Company is an electronic filer and the SEC maintains an Internet site at http://www.sec.gov that contains the reports, proxy and information statements, and other information filed electronically. Our website address is www.healthstream.com. Please note that our website address is provided as an inactive textual reference only. We make available free of charge through our website, our annual report on Form 10-K, quarterly reports on Form 10-Q, current reports on Form 8-K, and all amendments to those reports as soon as reasonably practicable after such material is electronically filed with or furnished to the SEC. The information provided on our website is not part of this report, and is therefore not incorporated by reference unless such information is otherwise specifically referenced elsewhere in this report.
OUR EMPLOYEES
As of December 31, 2015, we employed 833 full-time and 139 part-time persons, of which 205 persons are employed in our interviewing centers. Our success will depend in large part upon our ability to attract and retain qualified employees. We face competition in this regard from other companies, but we believe that we maintain good relations with our employees. We are not subject to any collective bargaining agreements.
EXECUTIVE OFFICERS OF THE REGISTRANT
The following is a brief summary of the business experience of each of the executive officers of the Company. Executive Officers of the Company are elected by the Board of Directors and serve at the pleasure of the Board of Directors. The following table sets forth certain information regarding the executive officers of the Company:
| Name |
Age | Position | ||||
| Robert A. Frist, Jr. |
48 | Chief Executive Officer, President and Chairman of the Board of Directors | ||||
| Jeffrey S. Doster |
51 | Senior Vice President and Chief Technology Officer | ||||
| Gerard M. Hayden, Jr. |
61 | Senior Vice President and Chief Financial Officer | ||||
| J. Edward Pearson |
53 | Senior Vice President and Chief Operating Officer | ||||
| Thomas Schultz |
49 | Senior Vice President, Sales | ||||
| Michael Sousa |
47 | Senior Vice President and President, Echo, Inc. | ||||
Robert A. Frist, Jr., one of our co-founders, has served as our chief executive officer and chairman of the board of directors since 1990 and president since 2001. Mr. Frist is the company’s chief operating decision maker. He graduated with a Bachelor of Science in business with concentrations in finance, economics and marketing from Trinity University.
Jeffrey S. Doster joined the Company in May 2008 as senior vice president and chief technology officer. He earned undergraduate degrees in both Economics and Business Administration from Towson University, as well as a Master of Business Administration from Loyola College, in Maryland.
Gerard M. Hayden, Jr. joined the Company as senior vice president and chief financial officer in May 2008. He earned a Bachelor of Arts from the University of Notre Dame and a Master of Science from Northeastern University.
J. Edward Pearson joined the Company in June 2006 as senior vice president and was promoted to Chief Operating Officer in 2011. He earned a Bachelor of Business Administration in accounting from Middle Tennessee State University.
Thomas Schultz joined the Company in June 2014 as senior vice president of sales. He worked for Lawson Software, a subsidiary of Infor, Inc., in various sales leadership roles for sixteen years prior to joining the Company. He earned a Bachelor of Arts from St. Mary’s University of Minnesota.
Michael Sousa joined the Company in October 2004, and served as senior vice president of sales from January 2010 to June 2014. In June 2014, he was promoted to senior vice president of business development. In September 2015, he was named president of Echo, Inc., HealthStream’s Provider Solutions business segment, while continuing to serve as a senior vice president of the Company. He earned a Bachelor of Science degree from Boston College and a Master of Business Administration from Boston University.
9
Table of Contents
We believe that the risks and uncertainties described below and elsewhere in this document are the principal material risks facing the Company as of the date of this report. In the future, we may become subject to additional risks that are not currently known to us. Our business, financial condition or results of operations could be materially adversely affected by any of the following risks and by any unknown risks. The trading price of our common stock could decline due to any of the following risks or any unknown risks.
Risks Related to Our Business Model
We may be unable to effectively execute our growth strategy which could have an adverse effect on our business and competitive position in the industry.
Our business strategy includes increasing our market share and presence through sales to new customers, additional sales to existing customers, introductions of new products and services, and maintaining strong relationships with our existing customers. Some of the risks that we may encounter in executing our growth strategy include:
| • | expenses, delays and difficulties of identifying and developing new products or services and integrating such new products or services into our existing organization; |
| • | inability to leverage our operational and financial systems sufficiently to support our growth; |
| • | inability to generate sufficient revenue from new products to offset investment costs; |
| • | inability to effectively identify, manage and exploit existing and emerging market opportunities; |
| • | inability to maintain our existing customer relationships; |
| • | increased competition from new and existing competitors; |
| • | lengthy sales cycles, or customers delaying purchasing decisions due to economic conditions; |
| • | reduced spending within the training, information and education departments of hospitals within our target market; and |
| • | failure of the market for training, information and education in the healthcare industry to grow to a sufficient size or at a sufficient rate. |
If any of these risks are realized, our business, and our competitive position in the industry, could suffer.
We may be unable to effectively identify, complete or integrate the operations of future acquisitions, joint ventures, collaborative arrangements or other strategic investments.
As part of our growth strategy, we actively review possible acquisitions, joint ventures, collaborative arrangements or strategic investments that complement or enhance our business. We may not be able to identify, complete or integrate the operations of future acquisitions, joint ventures, collaborative arrangements or other strategic investments. In addition, if we finance acquisitions, joint ventures, collaborative arrangements or other strategic initiatives by issuing equity securities, our existing shareholders may be diluted which could affect the market price of our stock. As a result, if we fail to properly evaluate and execute acquisitions and investments, our business prospects may be seriously harmed. Some of the risks that we may encounter in implementing our acquisition, joint venture, collaborative arrangement or strategic investment strategies include:
| • | expenses, delays or difficulties in identifying and integrating acquired companies or joint venture operations, collaborative arrangements or other strategic investments into our organization; |
| • | inability to retain personnel associated with acquisitions, joint ventures, collaborative arrangements or other strategic investments; |
| • | diversion of management’s attention from other initiatives and/or day-to-day operations to effectively execute our growth strategy; and |
| • | inability to generate sufficient revenue, profit, and cash flow from acquisitions, joint ventures, collaborative arrangements or other strategic investments to offset our investment costs. |
10
Table of Contents
Our ability to accurately forecast revenue for certain products and services may be hindered by customer scheduling.
As revenues from our subscription business continue to increase, a larger portion of our revenues will be predictable; however, quarterly performance may be more subject to fluctuations. Our HealthStream Patient Experience Solutions products and services are typically contracted by healthcare organizations for multi-year terms, but the frequency, sample size, and timing of survey cycles can vary from quarter to quarter and year to year. The contract structure for some Patient Experience Solutions products gives customers latitude about when to initiate a survey, which can affect quarterly or annual revenue forecasts. Also, other project-based products, such as certain content development and professional services, are subject to the customers’ involvement in the provision of the product or service. The timing and magnitude of these project-based product and service contracts may vary widely from quarter to quarter and year to year, and thus may affect our ability to accurately forecast quarterly and annual financial performance.
Our ability to accurately forecast revenue may be affected by lengthy and widely varying sales cycles.
The period from our initial contact with a potential customer and their first purchase of our solution typically ranges from three to nine months, and in some cases has extended much further. The range in the sales cycle can be impacted by multiple factors, including an increasing trend towards more formal request for proposal processes and more competition within our industry, as well as formal budget timelines which impact timing of purchases by target customers. New products tend to have a longer and more unpredictable revenue ramp period. As a result of these factors, we have only limited ability to forecast the timing and type of initial sales. This, in turn, makes it more difficult to forecast quarterly and annual financial performance.
We may not be able to maintain our competitive position against current and potential competitors, especially those with significantly greater financial, technical, marketing, or other resources.
Several of our competitors and many potential competitors have longer operating histories and significantly greater financial, technical, marketing, or other resources than we do. We encounter direct competition from both large and small companies and other companies focused on workforce development management in the healthcare industry. We also face competition from larger survey and research companies. Given the profile and growth of the healthcare industry and the growing need for education, training, simulation, research, and information, it is likely that additional competitors will emerge. We believe we maintain a competitive advantage against our competitors by offering a comprehensive array of products and services; however, our lack of market diversification resulting from our concentration on the healthcare industry may make us susceptible to losing market share to our competitors who also offer a more robust talent management suite to a cross-section of industries. These companies may be able to respond more quickly than we can to new or changing opportunities, technologies, standards or customer requirements. Further, most of our customer agreements are for terms ranging from one to four or five years, with no obligation to renew. The short terms of these agreements may enable customers to more easily shift to one of our competitors.
The failure to maintain and strengthen our relationships with strategic partners or significant changes in the terms of the agreements we have with them may have an adverse impact on our ability to successfully market our products and services.
We have entered into contracts with strategic partners, including content, technology, and retail channel vendors. Our ability to increase the sales of our products and services depends in part upon maintaining and strengthening relationships with these current and future strategic partners. Most of these contracts are on a non-exclusive basis. Certain strategic partners may offer products and services from multiple distinct companies, including, in some instances, products or services which may compete with our products and services. Moreover, under contracts with some of our strategic partners, we may be bound by provisions that restrict our ability to market and sell our products and services to certain potential customers. The success of these contractual arrangements will depend in part upon the strategic partners’ own competitive, marketing, and strategic considerations, including the relative advantages for such strategic partners in using alternative products being developed and marketed by them or our competitors, rather than our products and services.
We cannot guarantee that we will be able to maintain and strengthen our relationships with strategic partners, that we will be successful in effectively integrating such partners’ products and technology into our own, or that such relationships will be successful in generating additional revenue. If any of these strategic partners have negative experiences with our products and services, or seek to amend the financial or other terms of the contracts we have with them, we may need to increase our organizational focus on the types of services and solutions they sell and alter our development, integration, and/or distribution strategies, which may divert our planned efforts and resources from other projects.
Lastly, we could be subject to claims and liability, as a result of the activities, products, or services of these strategic partners, and/or our acts or omissions with regard to these strategic partners. Even if these claims do not result in liability to us, investigating and defending these claims could be expensive, time-consuming and result in suspension of or interference with certain offerings to our clients and/or adverse publicity that could harm our business.
11
Table of Contents
We may not be able to retain distribution rights from our content partners, and this could affect projected growth in courseware subscription revenue.
Most of our agreements with content providers are for initial terms of two to three years. The content partners may choose not to renew their agreements with us or may terminate the agreements early if we do not fulfill our contractual obligations. If a significant number of our content providers terminate or fail to renew their agreements with us on acceptable terms, it could result in a reduction in the number of courses we are able to distribute, causing decreased revenues. Most of our agreements with our content partners are non-exclusive, and our competitors offer, or could offer, training, development and continuing education content that is similar to or the same as ours. If publishers and authors, including our current content partners offer information to users or our competitors on more favorable terms than those offered to us, or increase our license fees, our competitive position and our profit margins and prospects could be harmed. In addition, the failure by our content partners to deliver high-quality content and to revise their content in response to user demand and evolving healthcare advances and trends could result in customer dissatisfaction and inhibit our ability to attract and retain subscribers of our courseware offerings.
We may not be able to develop new products and services, or enhancements to our existing products and services, or be able to achieve widespread acceptance of new products, services or features, or keep pace with technological developments.
Our growth strategy depends in part on our ability to generate revenue growth through sales to new customers as well as increasing sales of additional courseware subscriptions and other products and services to existing customers. Our identification of additional features, content, products and services may not result in timely development of complementary products. In addition, the success of certain new products and services may be dependent on continued growth in our customer base. We are not able to accurately predict the volume or speed with which existing and new customers will adopt such new products and services. Because healthcare training continues to change and evolve, we may be unable to accurately predict and develop new products, features, content and other products to address the needs of the healthcare industry. Further, the new products, services and enhancements we develop may introduce significant defects into or otherwise negatively impact our core software platform. While all new products and services are subject to testing and quality control, all software and software-based services are subject to errors and malfunctions. If we release new products, services and/or enhancements with bugs, defects or errors or that cause bugs, defects or errors in existing products, it could result in lost revenues, reduced ability to meet contractual obligations and would be detrimental to our business and reputation. If new products, features, or content are not accepted or integrated by new or existing customers, we may not be able to recover the cost of this development and our financial performance will be harmed. Continued growth of our customer population is dependent on our ability to continue to provide relevant products and services in a timely manner. The success of our business will depend on our ability to continue providing our products and services as well as enhancing our courseware, product and service offerings that address the needs of healthcare organizations.
We may be unable to continue to license our third party software, on which a portion of our product and service offerings rely, or we may experience errors in this software, which could increase our costs and decrease our revenue.
We use technology components in some of our products that have been licensed from third parties. Future licenses to these technologies may not be available to us on commercially reasonable terms, or at all. The loss of or inability to obtain or maintain any of these licenses could result in delays in the introduction of new products and services or could force us to discontinue offering portions of our workforce development or patient experience solutions until equivalent technology, if available, is identified, licensed and integrated. The operation of our products would be impaired if errors occur in third party technology or content that we incorporate, and we may incur additional costs to repair or replace the defective technology or content. It may be difficult for us to correct any errors in third party products because the products are not within our control. Accordingly, our revenue could decrease and our costs could increase in the event of any errors in this technology. Furthermore, we may become subject to legal claims related to licensed technology based on product liability, infringement of intellectual property or other legal theories. Even if these claims do not result in liability to us, investigating and defending these claims could be expensive, time-consuming and result in suspension of or interference with certain offerings to our clients and/or adverse publicity that could harm our business.
Financial Risks
A significant portion of our revenue is generated from a relatively small number of customers.
We derive a substantial portion of our revenues from a relatively small number of customers. A termination of our agreements with any of our significant customers or a failure of these customers to renew their contracts on favorable terms, or at all, could have a material adverse effect on our business.
12
Table of Contents
A significant portion of our business is subject to renewal each year. Therefore, renewals have a significant impact on our revenue and operating results.
For the year ended December 31, 2015, approximately 74% of our net revenue was derived from our subscription-based solution products. Our subscription-based customers have no obligation to renew their subscriptions for our products or services after the expiration of the subscription agreement, and in fact, some customers have elected not to renew their subscription. In addition, our customers may renew at a lower pricing or activity level. Our customers’ renewals may decline or fluctuate as a result of a number of factors, including but not limited to their dissatisfaction with our service, a dissipation or cessation of their need for one or more of our products or services, pricing or competitive product offerings. If we are unable to renew a substantial portion of the contracts that are up for renewal or maintain our pricing, our revenue could be adversely affected, which would have a material adverse effect on our results of operations and financial position. For example, the requirement mandated by CMS for healthcare organizations to transition to the ICD-10 coding system, effective in October 2015, generated significant demand for our ICD-10 readiness training courseware from 2012 through 2015, when subscriptions for that product positively influenced the Company’s revenue and operating income. However, sales of that product have ceased and revenue and operating income from that product will significantly decline during 2016 compared to the previous year since there will not be renewals of that product. HealthStream Patient Experience Solutions product and service contracts typically range from one to three years in length, and customers are not obligated to renew their contract with us after their contract expires. If our customers do not renew their arrangements for our services, or if their activity levels decline, our revenue may decline and our business will suffer.
We may be unable to accurately predict the timing of revenue recognition from sales activity as it is often dependent on achieving certain events or performance milestones, and this inability could impact our operating results.
Our ability to recognize revenue is dependent upon several factors including the transfer of customer-specific information such as unique subscriber IDs, which are required for us to implement customers on our subscription-based platform and certain platform applications. Accordingly, if customers do not provide us with the specified information in a timely manner, our ability to recognize revenue will be delayed, which could adversely impact our operating results. In addition, implementation completion and acceptance of our subscription-based platform and certain platform applications by our customers must be achieved, survey responses must be received and tabulated, and delivery of courseware is required in connection with subscription-based products for us to recognize revenue.
Because we recognize revenue from subscriptions for our products and services over the term of the subscription period, downturns or upturns in sales may not be immediately reflected in our operating results.
During the year ended December 31, 2015, we recognized approximately 74% of our revenue from customers monthly over the terms of their subscription agreements, which have initial contract terms ranging from one to five years. As a result, much of the revenue we report in each quarter is related to subscription agreements entered into during previous quarters. Consequently, a decline in new or renewed subscription agreements in any one quarter will not necessarily be fully reflected in the revenue in that quarter and will negatively affect our revenue in future quarters. In addition, we may be unable to adjust our cost structure to reflect this reduced revenue. Accordingly, the effect of significant downturns in sales and market acceptance of our products and services may not be fully reflected in our results of operations until future periods. Additionally, our subscription model also makes it difficult for us to rapidly increase our revenue through additional sales in any period, as revenue from new customers must be recognized over the applicable subscription term. Finally, the majority of costs associated with our sales cycles are incurred up front before revenue recognition commences, and therefore periods of strong sales performance may increase our costs in the near term negatively affecting our financial performance.
We may not be able to meet our strategic business objectives unless we obtain additional financing, which may not be available to us on favorable terms, or at all.
We believe that our existing cash and cash equivalents, marketable securities, cash generated from operations, and available borrowings under our revolving credit facility will be sufficient to meet anticipated working capital needs, new product development and capital expenditures for at least the next 12 months. However, we may need to raise additional funds in order to:
| • | develop new, or enhance existing, services or products; |
| • | respond to competitive pressures; |
| • | finance working capital requirements; |
| • | acquire or invest in complementary businesses, technologies, content or products; or |
| • | otherwise effectively execute our growth strategy. |
At December 31, 2015, we had approximately $149.0 million in cash, cash equivalents, and marketable securities. We also have up to $50.0 million of availability under our Revolving Credit Facility, subject to certain covenants, which expires in November 2017. We expect to incur between $14.0 and $16.0 million of capital expenditures, software development and content purchases during 2016. We actively review possible business acquisitions to complement or enhance our products and services. We may not have adequate cash and investments or availability under our Revolving Credit Facility to consummate one or more of these acquisitions. We cannot assure you that if we
13
Table of Contents
need additional financing that it will be available on terms favorable to us, or at all. If adequate funds are not available or are not available on acceptable terms, our ability to fund expansion, take advantage of available opportunities, develop or enhance services or products or otherwise respond to competitive pressures would be significantly limited. If we raise additional funds by issuing equity or convertible debt securities, the percentage ownership of our existing shareholders may be reduced.
We have significant goodwill and identifiable intangible assets recorded on our balance sheet that may be subject to impairment losses that would reduce our reported assets and earnings.
As of December 31, 2015, our balance sheet included goodwill of $83.1 million and identifiable intangible assets of $56.0 million. There are inherent uncertainties in the estimates, judgments and assumptions used in assessing recoverability of goodwill and intangible assets. Economic, legal, regulatory, competitive, reputational, contractual, and other factors could result in future declines in the operating results of our business units or market value declines that do not support the carrying value of goodwill and identifiable intangible assets. If the value of our goodwill and/or intangible assets is impaired, accounting rules require us to reduce their carrying value and report an impairment charge, which would reduce our reported assets and earnings for the period in which an impairment is recognized.
The current uncertain economic environment may have a negative impact on our customers and us which could have a significant impact on our revenue, operating results and financial condition.
It is difficult to predict the full magnitude and duration of the current uncertain economic environment and its related impact on our customers, suppliers and our company. For example, our customers may experience fluctuations or declines in their business and as a consequence, some customers may choose to invest less in information technology assets for their business which, in turn, could have an impact on us. The potential negative effects on us include, but are not limited to, reductions in our renewal and revenue growth rates, shorter contract terms, pricing pressures, and delays in payments from customers that increase our accounts receivable resulting in a deterioration of our cash flow and working capital position. We continue to monitor general economic conditions, however, and depending on the severity and/or duration of any economic downturn, these circumstances could have a material adverse effect on our revenue, results from operations and financial condition. In addition, because our clients are concentrated in the healthcare industry, our revenue and operating results may be adversely affected by changes in regulations, a business downturn in the healthcare industry, or consolidation with respect to the healthcare industry.
We may not be able to demonstrate compliance with Sarbanes-Oxley Section 404 in a timely manner, and the correction of any deficiencies identified during annual audits may be costly and could harm our business.
Sarbanes-Oxley Section 404 requires our management to report on, and requires our independent public accounting firm to attest to, the effectiveness of our internal controls over financial reporting. The rules governing the standards to be met are complex and will require significant process review, documentation and testing, as well as possible remediation efforts for any identified deficiencies. This process of review, documentation, testing and remediation will result in increased expenses and require significant attention from management and other internal and external resources. Any material weaknesses identified during this process may preclude us from asserting the effectiveness of our internal controls. This may negatively affect our stock price if we cannot effectively remediate the issues identified in a timely manner.
Changes in generally accepted accounting principles (GAAP) and other accounting regulations and interpretations could require us to delay recognition of revenue and/or accelerate the recognition of expenses, resulting in lower earnings.
While we believe we correctly account for and recognize revenue and expenses, any changes in GAAP or other accounting regulations and interpretations concerning revenue and expense recognition could decrease our revenue or increase our expenses. Changes to regulations concerning revenue recognition could require us to alter our current revenue accounting practices and cause us to either defer revenue into a future period, or to recognize lower revenue in a current period. Likewise, changes to regulations concerning expense recognition could require us to alter our current expense accounting practices and cause us to defer recognition of expense into a future period, or to recognize increased expenses in a current period. Changes to either revenue recognition or expense recognition accounting practices could affect our financial performance.
Risks Related to Sales, Marketing and Competition
Our operating margins could be affected if our ongoing refinement to pricing models for our products and services is not accepted by our customers and the market.
We continue to make changes in our pricing and our product and service offerings to increase revenue and to meet the needs of our customers. We cannot predict whether our current pricing and products and services, or any ongoing refinements we make will be accepted by our existing customer base or by prospective customers. If our customers and potential customers decide not to accept our current or future pricing or product and service offerings, it could have a material adverse effect on our business.
14
Table of Contents
Risks Related to Operations
We may be unable to adequately develop our systems, processes and support in a manner that will enable us to meet the demand for our services.
We have provided our online products and services for over 16 years and continue to develop our ability to provide our solutions on both a subscription and transactional basis over the Internet. Our future success will depend on our ability to effectively develop and maintain the infrastructure, including procurement of additional hardware and software, and to implement the services, including customer support, necessary to meet the demand for our products and services. Our inability from time to time to successfully develop the necessary systems and implement the necessary services on a timely basis has resulted in our customers experiencing some delays, interruptions and/or errors in their service. Such delays or interruptions may cause customers to become dissatisfied with our service and move to competing providers of traditional and online training and education services. If this happens, our revenue and reputation could be adversely affected, which would have a material adverse effect on our financial condition.
Our business operations could be significantly disrupted if we lose members of, or fail to integrate, our management team.
Our future performance is substantially dependent on the continued services of our management team and our ability to retain and motivate them. The loss of the services of any of our officers or senior managers could harm our business, as we may not be able to find suitable replacements. We do not have employment agreements with any of our key personnel, other than our chief executive officer, and we do not maintain any “key person” life insurance policies.
We may not be able to hire and retain a sufficient number of qualified employees and, as a result, we may not be able to effectively execute our growth strategy or maintain the quality of our services.
Our future success will depend on our ability to attract, train, motivate, and retain other highly skilled technical, managerial, marketing, customer support, and survey personnel. Competition for certain personnel is intense, especially for developers, web designers and sales personnel, and we may be unable to successfully attract sufficiently qualified personnel. We have experienced in the past, and continue to experience, difficulty hiring qualified personnel in a timely manner for these positions. The pool of qualified technical personnel, in particular, is limited in Nashville, Tennessee, where our headquarters are located. We operate interviewing centers located in Laurel, Maryland, and Nashville, Tennessee. We may experience difficulty in maintaining and recruiting qualified individuals to perform interviewing services. We will also need to maintain or increase the size of our staff to support our anticipated growth, without compromising the quality of our offerings or customer service. Our inability to locate, attract, hire, integrate and retain qualified personnel in sufficient numbers may reduce the quality of our services and impair our ability to grow.
We may not be able to upgrade our hardware and software technology infrastructure quickly enough to effectively meet demand for our services or our operational needs.
We must continue to obtain reasonably priced, commercially available hardware and operating software as well as continue to enhance our software and systems to accommodate the increased use of our platform, the increased courseware and content in our library and the resulting increase in operational demands on our business. Decisions about hardware and software enhancements are based in part on estimated forecasts of the growth in demand for our services. This growth in demand for our services is difficult to forecast and the potential audience for our services is widespread and dynamic. If we are unable to increase the data storage and processing capacity of our systems at least as fast as the growth in demand, our customers may encounter delays or disruptions in their service. Unscheduled downtime could harm our business and also could discourage current and potential customers from using or continuing to use our services and reduce future revenue. If we are unable to acquire, update, or enhance our technology infrastructure and systems quickly enough to effectively meet increased operational demands on our business, that may also have a material adverse effect on our financial condition.
Our network infrastructure and computer systems and software may fail.
An unexpected event (including but not limited to a cyber-security incident, telecommunications failure, fire, earthquake, or other catastrophic loss) at our Internet service providers’ facilities or at our on-site data facilities could cause the loss of critical data and prevent us from offering our products and services for an unknown period of time. System downtime could negatively affect our reputation and ability to sell our products and services and may expose us to significant third-party claims. Our business interruption insurance may not adequately compensate us for losses that may occur. In addition, we rely on third parties to securely store our archived data, house our web server and network systems and connect us to the Internet. While our service providers have planned for certain contingencies, the failure by any of these third parties to provide these services satisfactorily and our inability to find suitable replacements would impair our ability to access archives and operate our systems and software, and our customers may encounter delays. Such disruptions could harm our reputation and cause customers to become dissatisfied and possibly take their business to a competing provider, which would adversely affect our revenues.
15
Table of Contents
We may lose users and lose revenue if our security measures fail.
If the security measures that we use to protect customer or personal information are ineffective, we may lose users of our services, which could reduce our revenue, tarnish our reputation, and subject us to significant liability. We rely on security and authentication technology licensed from third parties. With this technology, we perform real-time credit card authorization and verification, as well as the encryption of other selected secure customer data. We cannot predict whether these security measures could be circumvented by new technological developments. Further, the audit processes and controls used within our production platforms may not be sufficient to identify and prevent errors or deliberate misuse. In addition, our software, databases and servers may be vulnerable to computer viruses, physical or electronic attacks and similar disruptions. We may need to spend significant resources to protect against security breaches or to alleviate problems caused by any breaches. We cannot assure that we can prevent all security breaches.
A security incident could result in a loss of confidential data, give rise to remediation and other expenses, expose us to liability under the Health Insurance Portability and Accountability Act (HIPAA), the Health Information Technology for Economic and Clinical Health Act (HITECH), state privacy laws, consumer protection laws, common law theories or other laws, subject us to litigation and federal and state governmental inquiries, damage our reputation, and otherwise be disruptive to our business.
We collect and store sensitive information, including intellectual property and protected health information (“PHI”) and other personally identifiable information, on our networks. The secure maintenance of this information is critical to our business operations. We have implemented multiple layers of security measures to protect this confidential data through technology, processes, and our people; we utilize current security technologies; and our defenses are monitored and routinely tested internally and by external parties. Despite these efforts, a security breach or failure could result from a variety of circumstances and events, including third-party action, system errors, employee negligence or error, malfeasance, computer viruses, failures during the process of upgrading or replacing software, databases, or components thereof, power outages, hardware failures, telecommunication failures, user errors, catastrophic events, or threats from malicious persons and groups, new vulnerabilities, and advanced new attacks against information systems create risk of security incidents. Like many other organizations, we have experienced data incidents from time to time in the course of our business and handled these incidents in accordance with our understanding of the applicable laws.
In addition, we may experience data incidents again in the future, including incidents more significant than we have experienced to date, which could expose us and our customers to penalties under HIPAA or applicable state laws, damage our reputation, and result in plaintiff or state Attorney General litigation, especially if a large number of patients are affected or if the compromised information is highly sensitive.
We may experience errors or omissions in our software products or processes that (i) deliver provider credentialing, privileging and payer enrollment services for our hospitals and medical practice customers and (ii) administer and report on hospital performance, and these errors could result in action taken against us that could harm our business.
Hospitals and medical practices use our credentialing, privileging, and payer enrollment software to manage, validate and maintain their providers’ credentials and authorization to practice in a particular facility, and to maintain authorization to perform care covered by insurance providers. In some instances, we also rely on information from sources outside the Company that we then use in our credentialing and privileging products. If errors or omissions occur that inaccurately validate or invalidate the credentials of a provider, or improperly deny or authorize a provider to practice in a hospital or medical practice, these errors or omissions could result in litigation brought against us either by our hospital and medical practice customers, or by the provider. For example, an important element in a malpractice case brought against a hospital or other provider would often be the validation of proper credentialing for the provider, and any errors or omissions in our products that provide these services could subject us to claims. Further, a list of providers’ privileges are made available to the general public by hospitals and medical practices, and errors in credentialing and privileging may result in damage to that hospital’s or medical practice’s reputation.
Certain survey data collected and reported by us, such as the survey data included as part of our CAHPS® Hospital survey is used by CMS to determine, in part, the amount of reimbursement payments to hospitals, and any errors in data collection, survey sampling, or statistical reporting could result in reduced reimbursements to our hospital customers if we are unable to correct these errors, and this could, in turn, result in litigation against us. Further, this survey data reported to CMS is then published by CMS to the general public, and any errors we experience that result in incorrect scoring on our hospital customer may result in damage to that hospital’s reputation, and the hospital may in turn bring litigation against us.
We may be required to indemnify against such claims, and defending against any such claims could be costly, time consuming and could negatively affect our business.
16
Table of Contents
Risks Related to Government Regulation, Content and Intellectual Property
Government regulation may subject us to investigation, litigation, or liability or require us to change the way we do business.
The laws and regulations that govern our business change rapidly. Evolving areas of law that are relevant to our business include privacy and security laws, proposed encryption laws, content regulation, information security accountability regulation, sales and use tax laws and regulations and attempts to regulate activities on the Internet. In addition to being directly subject to certain requirements of the HIPAA privacy and security regulations, we are required through contracts with our customers known as “business associate agreements” to protect the privacy and security of certain personal and health related information. Our current and past privacy and security practices, including any breaches of PHI or other data, could also be subject to review or other investigation by various state and federal regulatory authorities or could become the subject of future pending or threatened litigation.
The rapidly evolving and uncertain regulatory and technology environment could require us to change how we do business or incur additional costs. Further, we cannot predict how changes to these laws and regulations might affect our business. Failure to comply with applicable laws and regulations, including those governing privacy and security, could subject us to civil and criminal penalties, subject us to contractual penalties (including termination of our customer agreements), adversely affect our ability to retain clients and attract new clients, damage our reputation and have a detrimental impact on our business.
We may not be able to maintain our certification to conduct CMS mandated surveys, and this could adversely affect our business.
Our survey product offerings include providing survey services to assist customers in their compliance with CMS regulations. We are currently designated by CMS as a certified vendor to offer CAHPS® Hospital Surveys and CAHPS® Home Health Care Surveys, including data collection and submission services. We are also a certified vendor for CG-CAHPS; ICH-CAHPS, ED-CAHPS; PCMH-CAHPS; Hospice CAHPS; and ACO-CAHPS. If we are unable to maintain these certifications, or secure certifications for future CMS mandated surveys, we would not be able to administer these survey instruments for our customers and our business may suffer.
Any reduction or change in the regulation of continuing education and training in the healthcare industry may adversely affect our business.
Our business model is dependent in part on required training and continuing education for healthcare professionals and other healthcare workers resulting from regulations of state and federal agencies, state licensing boards and professional organizations. Any change in these regulations that reduce the requirements for continuing education and training for the healthcare industry could harm our business. In addition, a portion of our business with pharmaceutical and medical device manufacturers and hospitals is predicated on our ability to maintain accreditation status with organizations such as the ACCME, ANCC, and ACPE. The failure to maintain status as an accredited provider could have a detrimental effect on our business.
We may be liable to third parties for content that is available from our online library.
We may be liable to third parties for the content in our online library if the text, graphics, software or other content in our library violates copyright, trademark, or other intellectual property rights, our content partners violate their contractual obligations to others by providing content to our library, or the content does not conform to accepted standards of care in the healthcare profession. We attempt to minimize these types of liabilities by requiring representations and warranties relating to our content partners’ ownership of the rights to distribute as well as the accuracy of their content. We also take necessary measures to review this content ourselves. Although our agreements with our content partners in most instances contain provisions providing for indemnification by the content providers in the event of inaccurate content, our content partners may not have the financial resources to meet this obligation. Alleged liability could harm our business by damaging our reputation, requiring us to incur legal costs in defense, exposing us to awards of damages and costs, and diverting management’s attention away from our business.
Protection of certain intellectual property may be difficult and costly, and our inability to protect our intellectual property could reduce the value of our products and services.
Despite our efforts to protect our intellectual proprietary rights, a third party could, without authorization, copy or otherwise misappropriate our content, information from our databases, or other intellectual property. Our agreements with employees, consultants and others who participate in development activities could be breached and result in our trade secrets becoming known, or our trade secrets and other intellectual property could be independently developed by competitors. We may not have adequate remedies for such breaches or protections against such competitor developments. In addition, the laws of some foreign countries do not protect our proprietary rights to the same extent as the laws of the United States, and effective intellectual property protection may not be available in those jurisdictions. We currently own several applications and registrations for trademarks and domain names in the United States and other countries as well as certain common law trademarks and service marks. The current system for registering, allocating and managing domain names has been the subject of litigation and proposed regulatory reform. Additionally, legislative proposals have been made by the federal government that would afford broad protection to owners of databases of information, such as stock quotes. This protection of databases already exists in the European Union.
Our business could be harmed if unauthorized parties infringe upon or misappropriate our intellectual property, proprietary systems, content, platform, services or other information. Our efforts to protect our intellectual property through copyright, trademarks and other controls may not be adequate. For instance, we may not be able to secure trademark or service mark registrations for marks in the United States or in foreign countries, or to secure patents for our proprietary products and services, and even if we are successful in obtaining patent and/or trademark registrations, these registrations may be opposed or invalidated by a third party.
17
Table of Contents
There has been substantial litigation in the computer and online industries regarding intellectual property assets, particularly patents. Third parties may claim infringement by us with respect to current and future products, trademarks or other proprietary rights, and we may counterclaim against such third parties in such actions. Any such claims or counterclaims could be time-consuming, result in costly litigation, divert management’s attention, cause product release delays, require us to redesign our products, restrict our use of the intellectual property subject to such claim, or require us to enter into royalty or licensing agreements, any of which could have a material adverse effect upon our business, financial condition and operating results. Such royalty and licensing agreements may not be available on terms acceptable to us, if at all.
We may be liable for infringing the intellectual property rights of others.
Our competitors may develop similar intellectual property, duplicate our products and/or services, or design around any patents or other intellectual property rights we hold. In the future, litigation may be necessary to enforce our intellectual property rights or to determine the validity and scope of the patents, intellectual property or other proprietary rights of third parties, which could be time consuming and costly and have an adverse effect on our business and financial condition. Intellectual property infringement claims could be made against us, especially as the number of our competitors grows. These claims, even if not meritorious, could be expensive and divert our attention from operating our company and result in a temporary inability to use the intellectual property subject to such claim. In addition, if we and/or our affiliates and customers become liable to third parties for infringing their intellectual property rights, we could be required to pay a substantial damage award and develop comparable non-infringing intellectual property, to obtain a license, or to cease providing the content or services that contain the infringing intellectual property. We may be unable to develop non-infringing intellectual property or obtain a license on commercially reasonable terms, if at all.
Item 1B. Unresolved Staff Comments
None.
Our principal office is located in Nashville, Tennessee, which is primarily used to support our workforce development operations and corporate functions. Our lease for approximately 73,000 square feet at this location expires in April 2017. The lease provides for a two-year renewal option with rates increasing during the renewal period. We also lease other facilities in Laurel, Maryland; Nashville, Tennessee; Jericho, New York; Brentwood, Tennessee; San Diego, Colorado; Boulder, Colorado; and Pensacola, Florida. The facilities in Laurel, Maryland and Nashville, Tennessee are used to support our survey operations, while the other leased locations are satellite offices for acquired businesses.
None.
Item 4. Mine Safety Disclosures
Not applicable.
18
Table of Contents
Item 5. Market for Registrant’s Common Equity, Related Stockholder Matters and Issuer Purchases of Equity Securities
Our common stock is traded on the NASDAQ Global Select Market under the symbol “HSTM”. Our common stock began trading on the NASDAQ National Market on April 14, 2000.
The following table sets forth, for each quarter of the two most recent years, the high and low closing prices per share of our common stock as reported on the NASDAQ Global Select Market:
| Common Stock Price | ||||||||||||||||
| 2015 | 2014 | |||||||||||||||
| High | Low | High | Low | |||||||||||||
| First Quarter |
$ | 30.36 | $ | 24.63 | $ | 34.43 | $ | 26.49 | ||||||||
| Second Quarter |
31.91 | 25.15 | 27.10 | 21.02 | ||||||||||||
| Third Quarter |
32.14 | 21.60 | 27.14 | 21.80 | ||||||||||||
| Fourth Quarter |
25.63 | 21.31 | 31.95 | 23.38 | ||||||||||||
As of February 17, 2016, the Company had a total of 8,086 shareholders, including 650 registered holders and 7,436 beneficial holders.
SHARE REPURCHASE PROGRAM
In February 2016, our Board of Directors authorized a share repurchase program for up to $25 million of our outstanding common stock. Repurchases will be made under the repurchase program in accordance with applicable securities laws and may be made at management’s discretion from time to time in the open market, through privately negotiated transactions, or otherwise. The share repurchase program will terminate on the earlier of December 31, 2016 or when the maximum dollar amount has been expended. The share repurchase program may be suspended or discontinued at any time.
DIVIDEND POLICY
We have never declared or paid any cash dividends on our common stock, and we do not anticipate paying cash dividends in the foreseeable future. We intend to retain earnings for use in the operation of our business.
See the table labeled “Securities Authorized for Issuance Under Equity Compensation Plans” to be contained in our 2016 Proxy Statement, incorporated by reference in Part III, Item 12 of this Annual Report on Form 10-K.
19
Table of Contents
STOCK PERFORMANCE GRAPH
The graph below compares HealthStream, Inc.’s cumulative total shareholder return on common stock with the cumulative total returns of companies on the NASDAQ Composite Index and the NASDAQ Computer & Data Processing Index for each of the last five fiscal years ended December 31, 2015, assuming an initial investment of $100. Data for the NASDAQ Composite Index and the NASDAQ Computer & Data Processing Index assume the reinvestment of dividends.
The comparisons in the graph below are based on historical data and are not necessarily indicative of future performance of our common stock.
COMPARISON OF 5 YEAR CUMULATIVE TOTAL RETURN (1)
Among HealthStream, Inc., The NASDAQ Composite Index
And The NASDAQ Computer & Data Processing Index
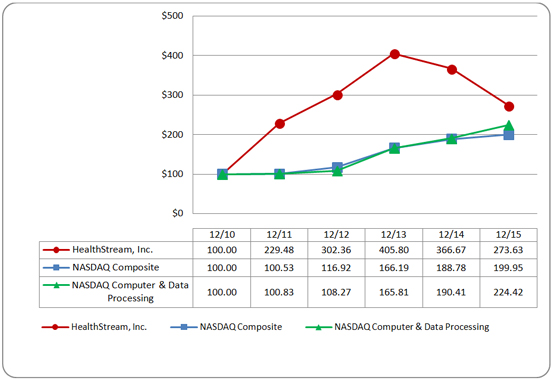
| (1) | $100 invested on 12/31/10 in stock or index, including reinvestment of dividends. Fiscal year ending December 31. |
RECENT SALES OF UNREGISTERED SECURITIES
None.
ISSUER PURCHASES OF EQUITY SECURITIES
None.
20
Table of Contents
Item 6. Selected Financial Data
The selected statement of income and balance sheet data for the past five years are derived from our audited consolidated financial statements. You should read the following selected financial data in conjunction with our consolidated financial statements and the notes to those statements and “Management’s Discussion and Analysis of Financial Condition and Results of Operations” located elsewhere in this report.
HealthStream acquired Decision Critical, Inc. on June 29, 2012, Sy.Med Development, Inc. on October 19, 2012, substantially all of the assets of BLG on September 9, 2013, HCCS on March 3, 2014 and HLS on March 16, 2015. The results of operations for these acquired companies are included within our consolidated statement of income data effective from the respective date of acquisition. Revenues may be subject to fluctuations as discussed further in “Management’s Discussion and Analysis of Financial Condition and Results of Operations” located elsewhere in this report. As a result of these factors, the annual results presented below are not comparable. The operating results for any single year are not necessarily indicative of the results to be expected in the future.
| Year Ended December 31, | ||||||||||||||||||||
| (in thousands, except per share data) | ||||||||||||||||||||
| 2015 | 2014 | 2013 | 2012 | 2011 | ||||||||||||||||
| STATEMENT OF INCOME DATA: |
||||||||||||||||||||
| Revenues, net |
$ | 209,002 | $ | 170,690 | $ | 132,274 | $ | 103,732 | $ | 82,066 | ||||||||||
| Total operating costs and expenses |
195,445 | 154,315 | 117,608 | 90,273 | 70,728 | |||||||||||||||
|
|
|
|
|
|
|
|
|
|
|
|||||||||||
| Operating income |
13,557 | 16,375 | 14,666 | 13,459 | 11,338 | |||||||||||||||
| Net income |
$ | 8,621 | $ | 10,394 | $ | 8,418 | $ | 7,645 | $ | 6,944 | ||||||||||
|
|
|
|
|
|
|
|
|
|
|
|||||||||||
| Net income per share – basic |
$ | 0.29 | $ | 0.38 | $ | 0.31 | $ | 0.29 | $ | 0.31 | ||||||||||
|
|
|
|
|
|
|
|
|
|
|
|||||||||||
| Net income per share – diluted |
$ | 0.28 | $ | 0.37 | $ | 0.30 | $ | 0.28 | $ | 0.29 | ||||||||||
|
|
|
|
|
|
|
|
|
|
|
|||||||||||
| Weighted average shares of common stock outstanding – basic |
30,057 | 27,570 | 26,853 | 26,128 | 22,445 | |||||||||||||||
|
|
|
|
|
|
|
|
|
|
|
|||||||||||
| Weighted average shares of common stock outstanding – diluted |
30,436 | 28,023 | 27,663 | 27,507 | 23,748 | |||||||||||||||
|
|
|
|
|
|
|
|
|
|
|
|||||||||||
| BALANCE SHEET DATA: |
||||||||||||||||||||
| Cash and cash equivalents |
$ | 82,010 | $ | 81,995 | $ | 59,537 | $ | 41,365 | $ | 76,904 | ||||||||||
| Marketable securities – short and long term |
66,976 | 38,973 | 48,659 | 51,952 | 12,548 | |||||||||||||||
| Accounts receivable, net |
36,348 | 33,167 | 25,314 | 15,348 | 16,014 | |||||||||||||||
| Goodwill and intangible assets |
139,039 | 56,709 | 44,616 | 38,104 | 23,104 | |||||||||||||||
| Working capital |
120,459 | 97,352 | 90,912 | 83,259 | 78,631 | |||||||||||||||
| Total assets |
379,569 | 257,262 | 212,594 | 174,528 | 154,237 | |||||||||||||||
| Deferred revenue – current and noncurrent |
69,448 | 57,373 | 38,168 | 23,146 | 22,759 | |||||||||||||||
| Shareholders’ equity |
280,320 | 167,859 | 149,433 | 132,196 | 120,915 | |||||||||||||||
Item 7. Management’s Discussion and Analysis of Financial Condition and Results of Operations
The following discussion of the financial condition and results of operations of HealthStream should be read in conjunction with “Selected Financial Data” and HealthStream’s Consolidated Financial Statements and related notes thereto included elsewhere in this report. This discussion contains forward-looking statements that involve risks and uncertainties. HealthStream’s actual results may differ significantly from the results discussed and those anticipated in these forward-looking statements as a result of many factors, including but not limited to those described under “Risk Factors” and elsewhere in this report.
OVERVIEW
HealthStream provides workforce development, patient experience, and provider solutions for healthcare organizations—all designed to assess and develop the people that deliver patient care which, in turn, supports the improvement of business and clinical outcomes. Workforce development products are used by healthcare organizations to meet a broad range of their training, certification, competency assessment, performance appraisal, and development needs. Patient experience products provide our customers information about patients’ experiences and how to improve them, workforce engagement, physician relations, and community perceptions of their services. Provider products are used by healthcare organizations for provider credentialing, privileging, call center and enrollment needs. HealthStream’s customers include healthcare organizations, pharmaceutical and medical device companies, and other participants in the healthcare industry.
21
Table of Contents
Revenues for the year ended December 31, 2015 were approximately $209.0 million compared to $170.7 million for the year ended December 31, 2014, an increase of 22%. Operating income decreased by 17% to $13.6 million for 2015, compared to $16.4 million for 2014. Net income decreased by 17% to $8.6 million for 2015, compared to $10.4 million for 2014. Earnings per share (EPS) were $0.28 per share (diluted) for 2015 compared to $0.37 per share (diluted) for 2014. Revenues from HealthStream Workforce Solutions grew by 20%, or $27.0 million; revenues from HealthStream Patient Experience Solutions grew by 7%, or $2.3 million; and revenues from HealthStream Provider Solutions grew by 197%, or $9.0 million. As of December 31, 2015, the Company had approximately 4.62 million total subscribers, of which approximately 4.48 million were fully implemented subscribers on its SaaS-based platform. Annualized revenue per implemented subscriber increased to $36.96 per subscriber at the end of 2015, up from $34.43 per subscriber at the end of 2014, representing a 7% increase. As of December 31, 2015 cash and investment balances approximated $149.0 million, and the Company maintained full availability under its $50.0 million revolving credit facility.
CRITICAL ACCOUNTING POLICIES AND ESTIMATES
Revenue Recognition
Revenues are recognized from subscription-based workforce development products and courseware subscriptions based on a per person subscription basis, and in some cases on a per license basis. Fees are based on the size of the facilities’ or organizations’ employee user population and the service offerings to which they subscribe. Subscription-based revenue is recognized ratably over the service period of the underlying contract. All other service revenues are recognized as the related services are performed or products are delivered.
Revenues from provider solutions products are predominantly related to software licensing and support/maintenance renewals. Revenues derived from the license of installed software products are recognized upon shipment or installation of the software when vendor specific objective evidence (VSOE) of fair value for the software license can be established. Software support and maintenance revenues are recognized ratably over the term of the related agreement.
Revenues from patient experience services are recognized when survey results are delivered to customers via either Internet-based reporting throughout the survey period or by providing final survey results once all services are complete. A significant portion of revenues for survey and reporting services that are provided through the use of Internet-based reporting methodologies are recognized using the proportional performance method, reflecting recognition throughout the service period which corresponds with the survey cycle and reporting access by the customer, which typically ranges from one to five months. If survey results are delivered to the customer after all services have been completed, then the corresponding revenues are recognized in full in the period such results are provided to the customer. Coaching and consulting revenues are generally recognized using the proportional performance method as these services are performed throughout the contract term. All other revenues are recognized as the related services are performed or products are delivered to the customer. Revenues for these services can be subject to seasonal factors based on customers’ requirements that can impact the timing, frequency, and volume of survey cycles.
Revenues from professional services primarily include consulting and courseware development services. Fees are based on the time and efforts involved, and revenue is recognized upon completion of performance milestones using the proportional performance method.
The Company offers training services for clients to facilitate integration of its software solutions. Fees for training are based on the time and efforts of the personnel involved. Basic online training is generally included in the initial contract; however, incremental training is fee based and revenues are generally recognized upon completion of training services.
Accounting for Income Taxes
The Company accounts for income taxes using the asset and liability method, whereby deferred tax assets and liabilities are determined based on the temporary differences between the financial statement and tax bases of assets and liabilities measured at tax rates that will be in effect for the year in which the differences are expected to affect taxable income. Management periodically assesses the realizability of its deferred tax assets, and to the extent that we believe a recovery is not likely, we establish a valuation allowance to reduce the deferred tax asset to the amount we estimate will be recoverable. The Company maintains a valuation allowance of approximately $346,000 for the portion of its deferred tax assets that are not more likely than not expected to be realized.
Software Development Costs
Capitalized software development includes costs to develop and maintain our products and applications, including our SaaS-based workforce development platform products and our survey reporting applications, which are accounted for as internal use software. For internal use software development, once planning is completed and the software development process begins, internal costs and payments to third parties associated with the software development efforts are capitalized when the life expectancy is greater than one year and the anticipated cash flows are expected to exceed the cost of the related asset. During 2015 and 2014, we capitalized approximately $7.3 million and $5.7 million, respectively, for software development. Such amounts are included in the accompanying consolidated balance sheets under the caption “capitalized software development.” The Company amortizes capitalized software development costs over their expected life, which is generally three to five years. Capitalized software development costs are subject to a periodic impairment review in accordance with our impairment review policy. In connection with capitalized software development, significant estimates involve the assessment of the development period for new products and feature enhancements, as well as the expected useful life of underlying software, feature enhancements, or product created. Once capitalized, software development costs are subject to the policies and estimates described below regarding goodwill, intangibles and other long-lived assets.
22
Table of Contents
Goodwill, Intangibles and Other Long-lived Assets
The Company evaluates goodwill for impairment at the reporting unit level by assessing whether it is more likely than not that the fair value of a reporting unit exceeds its carrying value. If this assessment concludes that is more likely than not that the fair value of a reporting unit exceeds its carrying value, then goodwill is not considered impaired and no further impairment testing is required. Conversely, if the assessment concludes that it is more likely than not that the fair value of a reporting unit is less than its carrying value, a goodwill impairment test is performed to compare the fair value of the reporting unit to its carrying value. The Company determines fair value of the reporting units using both income and market based models. Our models contain significant assumptions and accounting estimates about discount rates, future cash flows and terminal values that could materially affect our operating results or financial position if they were to change significantly in the future and could result in an impairment. We perform our goodwill impairment assessment whenever events or changes in facts or circumstances indicate that impairment may exist and also during the fourth quarter each year. Intangible assets and other long-lived assets are also reviewed for events or changes in facts and circumstances, both internally and externally, which may indicate an impairment is present. We measure any impairment using observable market values or discounted future cash flows from the related long-lived assets. The cash flow estimates and discount rates incorporate management’s best estimates, using appropriate and customary assumptions and projections at the date of evaluation.
Allowance for Doubtful Accounts
The Company estimates the allowance for doubtful accounts using both a specific and non-specific identification method. Management’s evaluation includes reviewing past due accounts on a case-by-case basis, and determining whether an account should be reserved, based on the facts and circumstances surrounding each potentially uncollectible account. An allowance is also maintained for accounts not specifically identified that may become uncollectible in the future. Uncollectible accounts are written-off in the period management believes it has exhausted every opportunity to collect payment from the customer. Bad debt expense is recorded when events or circumstances indicate an additional allowance is necessary based on our specific and non-specific identification approach. Our allowance for doubtful accounts totaled approximately $303,000 as of December 31, 2015.
Stock Based Compensation
The Company recognizes compensation expense using a fair-value based method for costs related to share based payments including stock options and restricted share units. Measurement of such compensation expense requires significant estimation and assumptions; however, we believe that the Black Scholes option pricing model used for calculating the fair value of our stock based compensation plans provides a reasonable measurement methodology using a framework that is widely adopted.
As of December 31, 2015, the Company had two stock incentive plans which qualified as stock based compensation plans. During the years ended December 31, 2015, 2014, and 2013, approximately $3.3 million, $1.6 million, and $1.5 million of stock based compensation expense was recorded, respectively. The Company has historically granted equity based awards to both its management group and members of the Company’s board of directors on an annual basis, and expects to continue providing equity awards to these groups for the foreseeable future. The Company also provides grants of equity based awards when new members of the management group begin their employment, or when new board of director members join the Company. As of December 31, 2015, total future compensation cost related to non-vested awards not yet recognized was approximately $3.0 million net of estimated forfeitures, with a weighted average expense recognition period of 2.3 years. Future compensation expense recognition for new equity based award grants will vary depending on the timing and size of new awards granted, changes in the market price or volatility of our common stock, changes in risk-free interest rates, or if actual forfeitures vary significantly from initial estimates.
23
Table of Contents
RESULTS OF OPERATIONS
Revenues and Expense Components
The following descriptions of the components of revenues and expenses apply to the comparison of results of operations.
Revenues, net. Revenues for our HealthStream Workforce Solutions business segment primarily consist of the following products and services: provision of services through our SaaS-based platform, authoring tools, a variety of courseware subscriptions, competency and performance appraisal tools, implementation and consulting services, content development, online sales training courses (RepDirect™), HospitalDirect®, SimVentures, and a variety of other educational activities to serve professionals that work within healthcare organizations. Revenues for our HealthStream Patient Experience Solutions business segment consist of quality and satisfaction surveys, data analyses of survey results, coaching/consulting services, and other research-based measurement tools focused on patients, employees, physicians, and other members of the community. Revenues for our HealthStream Provider Solutions business segment consist of proprietary software applications to help facilitate provider credentialing, privileging, call center and enrollment administration for healthcare organizations.
Cost of Revenues (excluding depreciation and amortization). Cost of revenues (excluding depreciation and amortization) consists primarily of salaries and employee benefits, stock based compensation, employee travel and lodging, materials, outsourced phone survey support, contract labor, hosting costs, and other direct expenses associated with revenues, as well as royalties paid by us to content providers based on a percentage of revenues. Personnel costs within cost of revenues are associated with individuals that facilitate product delivery, provide services, conduct, process and manage phone and paper-based surveys, handle customer support calls or inquiries, manage the technology infrastructure for our hosted applications, manage content and survey services, coordinate content maintenance services, and provide training or implementation services.
Product Development. Product development consists primarily of salaries and employee benefits, contract labor, stock based compensation, costs associated with the development of new software feature enhancements, new products, and costs associated with maintaining and developing our platform products. Personnel costs within product development include our systems, application development, and quality assurance teams, product managers, and other personnel associated with software and product development.
Sales and Marketing. Sales and marketing consists primarily of salaries, commissions and employee benefits, stock based compensation, employee travel and lodging, advertising, trade shows, promotions, and related marketing costs. We host a national customer conference in Nashville, Tennessee known as “Summit,” a significant portion of the costs of which are included in sales and marketing expenses. Personnel costs within sales and marketing include our sales teams and marketing personnel.
Other General and Administrative Expenses. Other general and administrative expenses consist primarily of salaries and employee benefits, stock based compensation, employee travel and lodging, facility costs, office expenses, fees for professional services, business development and acquisition related costs, and other operational expenses. Personnel costs within general and administrative expenses include individuals associated with normal corporate functions (accounting, legal, business development, human resources, administrative, internal information systems, and executive management).
Depreciation and Amortization. Depreciation and amortization consist of fixed asset depreciation, amortization of intangibles considered to have definite lives, and amortization of capitalized software development.
Other Income (Expense), Net. The primary component of other income is interest income related to interest earned on cash, cash equivalents and investments in marketable securities. The primary component of other expense is interest expense related to our revolving credit facility. In addition, the income or loss attributed to equity method investments is included in this category.
2015 Compared to 2014
Revenues, net. Revenues increased approximately $38.3 million, or 22%, to $209.0 million for 2015 from $170.7 million for 2014. A comparison of revenues by business segment is as follows (in thousands):
| 2015 | 2014 | Percentage Change |
||||||||||
| Revenues by Business Segment: |
||||||||||||
| Workforce |
$ | 161,289 | $ | 134,242 | 20 | % | ||||||
| Patient Experience |
34,193 | 31,901 | 7 | % | ||||||||
| Provider |
13,520 | 4,547 | 197 | % | ||||||||
|
|
|
|
|
|
|
|||||||
| Total revenues, net |
$ | 209,002 | $ | 170,690 | 22 | % | ||||||
|
|
|
|
|
|||||||||
| % of Revenues |
||||||||||||
| Workforce |
77 | % | 79 | % | ||||||||
| Patient Experience |
16 | % | 19 | % | ||||||||
| Provider |
7 | % | 2 | % | ||||||||
24
Table of Contents
Revenues for HealthStream Workforce Solutions increased approximately $27.0 million, or 20%, over 2014. Revenues from our subscription-based workforce products increased by $26.0 million, or 20% over 2014 due to a higher number of subscribers and more courseware consumption by subscribers. Annualized revenue per implemented subscriber increased by 7%, to $36.96 per subscriber at the end of 2015 compared to $34.43 per subscriber at the end of 2014. Implemented subscribers increased by 9% during 2015 to 4.48 million subscribers at the end of 2015 compared to 4.15 million subscribers at the end of 2014. Additionally, total subscribers increased by 8%, with 4.62 million total subscribers at December 31, 2015 compared to 4.28 million total subscribers at December 31, 2014.
Revenues for HealthStream Patient Experience Solutions increased approximately $2.3 million, or 7%, over 2014. Revenues from Patient Insights™ surveys, our survey research product that generates recurring revenues, increased approximately $2.8 million, or 12%, over 2014, primarily due to growth in survey volumes over the prior year. Revenues from other products, including surveys conducted on annual or bi-annual cycles and consulting/coaching services, collectively decreased by $554,000 or 7%, compared to 2014 due to fewer engagements.
Revenues for HealthStream Provider Solutions increased approximately $9.0 million, or 197%, over 2014. Revenues from the HLS acquisition, which was consummated on March 16, 2015, were approximately $8.5 million during 2015. Such revenues take into account the deferred revenue reduction noted below. Revenues from other products increased by approximately $431,000, or 9% over 2014. Revenues for HealthStream Provider Solutions during 2015 were adversely impacted by a $6.7 million reduction resulting from the deferred revenue write-down associated with the HLS acquisition.
Cost of Revenues (excluding depreciation and amortization). Cost of revenues increased approximately $15.3 million, or 21%, to $89.4 million for 2015 from $74.1 million for 2014. Cost of revenues as a percentage of revenues was approximately 43% of revenues for both 2015 and 2014. Cost of revenues for HealthStream Workforce Solutions increased approximately $10.3 million to $63.5 million and approximated 39% and 40% of revenues for HealthStream Workforce Solutions for 2015 and 2014, respectively. The increase in both amount and as a percentage of revenues is primarily associated with increased royalties paid by us resulting from growth in courseware subscription revenues, as well as increases in personnel expenses, stock based compensation, and other support costs. Cost of revenues for HealthStream Patient Experience Solutions increased approximately $2.2 million to $22.4 million and approximated 65% and 63% of revenues for HealthStream Patient Experience Solutions for 2015 and 2014, respectively. The increase in both amount and as a percentage of revenues is primarily the result of increased personnel costs, including personnel to support the growth in patient survey volume over the prior year, and increased stock based compensation. Cost of revenues for HealthStream Provider Solutions increased approximately $2.8 million to $3.5 million, and approximated 26% and 16% of revenues for HealthStream Provider Solutions for 2015 and 2014, respectively. The increase in both amount and as a percentage of revenue is primarily the result of the HLS acquisition.
Product Development. Product development expenses increased approximately $7.8 million, or 47%, to $24.2 million for 2015 from $16.5 million for 2014. Product development expenses as a percentage of revenues were approximately 12% and 10% of revenues for 2015 and 2014, respectively.
Product development expenses for HealthStream Workforce Solutions increased approximately $4.8 million and approximated 12% and 11% of revenues for HealthStream Workforce for 2015 and 2014, respectively. The increase in both amount and as a percentage of revenues is due to additional personnel expenses associated with new product development initiatives for our subscription-based products, as well as increased stock based compensation. Product development expenses for HealthStream Patient Experience Solutions increased approximately $1.0 million and approximated 7% and 4% of revenues for HealthStream Patient Experience Solutions in 2015 and 2014, respectively. The increase in both amount and as a percentage of revenues is due to additional personnel and related expenses compared to the prior year period. Product development expenses for HealthStream Provider Solutions increased approximately $2.0 million and approximated 18% and 11% of revenues for HealthStream Provider Solutions for 2015 and 2014, respectively. The increase is in both amount and as a percentage of revenues is due primarily to the HLS acquisition.
Sales and Marketing. Sales and marketing expenses, including personnel costs, increased approximately $5.7 million, or 19%, to $35.6 million for 2015 from $29.9 million for 2014. Sales and marketing expenses as a percentage of revenues were approximately 17% and 18% of revenues for 2015 and 2014, respectively.
Sales and marketing expenses for HealthStream Workforce Solutions increased approximately $5.1 million and approximated 17% and 16% of revenues for HealthStream Workforce Solutions for 2015 and 2014, respectively. The increase in both amount and as a percentage of revenues is primarily due to additional personnel and related expenses, commissions, and expenses associated with our customer Summit, increased marketing spending, and increased stock based compensation. Sales and marketing expenses for HealthStream Patient Experience Solutions decreased approximately $1.7 million, and approximated 13% and 19% of revenues for HealthStream Patient Experience Solutions for 2015 and 2014, respectively. The decrease in amount and as a percentage of revenues is primarily due to fewer account management personnel compared to the prior year. Sales and marketing expenses for HealthStream Provider Solutions increased approximately $2.2 million and approximated 26% and 30% of revenues for HealthStream Provider Solutions for 2015 and 2014, respectively. The increase in amount is primarily due to the HLS acquisition.
25
Table of Contents
Other General and Administrative Expenses. Other general and administrative expenses increased approximately $6.4 million, or 28%, to $29.3 million for 2015 from $22.9 million for 2014. Other general and administrative expenses as a percentage of revenues were approximately 14% and 13% of revenues for 2015 and 2014, respectively.
Other general and administrative expenses for HealthStream Workforce Solutions increased approximately $253,000 over the prior year. The increase is primarily due to the HCCS acquisition, additional personnel, and increased other support costs. Other general and administrative expenses for HealthStream Patient Experience Solutions increased approximately $305,000 compared to the prior year period primarily due to increased facilities costs for a new patient interview center in Nashville, Tennessee. Other general and administrative expenses for HealthStream Provider Solutions increased approximately $2.1 million compared to the prior year period primarily due to the HLS acquisition. The unallocated corporate portion of other general and administrative expenses increased approximately $3.7 million over the prior year period, primarily associated with additional personnel, professional fees, stock based compensation, and other general expenses, as well as higher acquisition costs during 2015 than in 2014. Acquisition costs during 2015 approximated $1.1 million, of which $965,000 were associated with the HLS acquisition. Acquisition costs during 2014 approximated $762,000, of which $329,000 were associated with the HLS acquisition and $365,000 were associated with the HCCS acquisition.
Depreciation and Amortization. Depreciation and amortization increased approximately $6.1 million, or 55%, to $17.0 million for 2015 from $10.9 million for 2014. The increase primarily resulted from amortization of capitalized software development, amortization of intangible assets in relation to the acquisition of HLS, and depreciation expense associated with capital expenditures.
Other Income, Net. Other income, net was approximately $162,000 for 2015 compared to $146,000 for 2014. The increase is attributable to both interest income from investments in marketable securities and a gain on disposal of long lived assets, but was partially offset by higher interest expense from borrowings under a revolving credit facility during 2015 and losses from equity method investments.
Income Tax Provision. The Company recorded a provision for income taxes of approximately $5.1 million for 2015 compared to approximately $6.1 million for 2014. The Company’s effective tax rate was approximately 37% for both 2015 and 2014. The decrease in income tax expense during 2015 is attributable to lower taxable income compared to the prior year period.
Net Income. Net income decreased approximately $1.8 million, or 17%, to $8.6 million for 2015 from $10.4 million for 2014. Earnings per diluted share were $0.28 per share for 2015, compared to $0.37 per diluted share for 2014.
Adjusted EBITDA (a non-GAAP measure which we define as net income before interest, income taxes, stock-based compensation, and depreciation and amortization) increased by 17% to approximately $33.8 million for 2015 compared to $28.9 million for 2014. This improvement is consistent with the factors mentioned above. See Reconciliation of Non-GAAP Financial Measures in Management’s Discussion and Analysis of Financial Condition and Results of Operations for a reconciliation of this calculation to measures under US GAAP and disclosure regarding why we believe Adjusted EBITDA provides useful information to investors.
2014 Compared to 2013
Revenues, net. Revenues increased approximately $38.4 million, or 29%, to $170.7 million for 2014 from $132.3 million for 2013. A comparison of revenues by business segment is as follows (in thousands):
| 2014 | 2013 | Percentage Change |
||||||||||
| Revenues by Business Segment: |
||||||||||||
| Workforce |
$ | 134,242 | $ | 99,963 | 34 | % | ||||||
| Patient Experience |
31,901 | 28,454 | 12 | % | ||||||||
| Provider |
4,547 | 3,857 | 18 | % | ||||||||
|
|
|
|
|
|
|
|||||||
| Total revenues, net |
$ | 170,690 | $ | 132,274 | 29 | % | ||||||
|
|
|
|
|
|||||||||
| % of Revenues |
||||||||||||
| Workforce |
79 | % | 75 | % | ||||||||
| Patient Experience |
19 | % | 22 | % | ||||||||
| Provider |
2 | % | 3 | % | ||||||||
Revenues for HealthStream Workforce Solutions increased approximately $34.3 million, or 34%, over 2013. Revenues from our subscription-based workforce products increased by $34.3 million, or 36% over 2013 due to a higher number of subscribers and more courseware consumption by subscribers, as well as revenue associated with the HCCS acquisition. Annualized revenue per implemented subscriber increased by 6%, to $34.43 per subscriber at the end of 2014 compared to $32.41 per subscriber at the end of 2013. Implemented subscribers increased by 22% during 2014 to 4.15 million subscribers at the end of 2014 compared to 3.39 million subscribers at the end of 2013. Additionally, total subscribers increased by 15%, with 4.28 million total subscribers at December 31, 2014 compared to 3.71 million total subscribers at December 31, 2013. Revenues in 2014 were positively influenced by courseware subscriptions associated with, among other products, ICD-10 readiness training. Revenues from ICD-10 readiness training were approximately $28.4 million in 2014, compared to $13.9 million in 2013. Revenues from the HCCS acquisition, consummated on March 3, 2014, were approximately $4.8 million during 2014.
26
Table of Contents
Revenues for HealthStream Patient Experience Solutions increased approximately $3.4 million, or 12%, over 2013. Revenues from Patient Insights™ surveys, our survey research product that generates recurring revenues, increased by $1.8 million, or 8%, over 2013, primarily due to growth in survey volumes over the prior year. Revenues from other surveys, which are conducted on annual or bi-annual cycles, declined by $72,000, or 2%, compared to 2013. Revenues from the Baptist Leadership Group (BLG) acquisition, consummated on September 9, 2013, were $2.9 million in 2014 compared to $1.2 million in 2013.
Revenues for HealthStream Provider Solutions increased approximately $690,000, or 18%, over 2013. $565,000 of the increase was due to lower revenues in 2013 associated with the deferred revenue write-down of acquired balances from the Sy.Med acquisition, which was consummated in October 2012, and $125,000 of the increase was due to growth in sales during 2014.
Cost of Revenues (excluding depreciation and amortization). Cost of revenues increased approximately $18.5 million, or 33%, to $74.1 million for 2014 from $55.6 million for 2013. Cost of revenues as a percentage of revenues was 43% of revenues for 2014 compared to 42% of revenues for 2013. Cost of revenues for HealthStream Workforce Solutions increased approximately $14.4 million to $53.2 million and approximated 40% and 39% of revenues for HealthStream Workforce Solutions for 2014 and 2013, respectively. The increase in both amount and as a percentage of revenues is primarily associated with increased royalties paid by us resulting from growth in courseware subscription revenues and increased personnel expenses. Cost of revenues for HealthStream Patient Experience Solutions increased approximately $4.0 million to $20.2 million and approximated 63% and 57% of revenues for HealthStream Patient Experience Solutions for 2014 and 2013, respectively. The increase in both amount and as a percentage of revenues is primarily the result of increased personnel costs from the BLG acquisition as well as additional costs associated with the growth in patient survey volume over the prior year. Cost of revenues for HealthStream Provider Solutions increased approximately $111,000 to $738,000, and approximated 16% of revenues for HealthStream Provider Solutions for both 2014 and 2013.
Product Development. Product development expenses increased approximately $4.7 million, or 40%, to $16.5 million for 2014 from $11.8 million for 2013. Product development expenses as a percentage of revenues were approximately 10% and 9% of revenues for 2014 and 2013, respectively.
Product development expenses for HealthStream Workforce Solutions increased approximately $4.8 million and approximated 11% and 10% of revenues for HealthStream Workforce for 2014 and 2013, respectively. The increase in both amount and as a percentage of revenues is due to additional personnel expenses associated with new product development initiatives for our subscription-based products. Product development expenses for HealthStream Patient Experience Solutions decreased approximately $137,000 and approximated 4% and 5% of revenues for HealthStream Patient Experience Solutions in 2014 and 2013, respectively. The decrease in both amount and as a percentage of revenues is due to lower personnel expenses. Product development expenses for HealthStream Provider Solutions increased approximately $35,000 and approximated 11% and 12% of revenues for HealthStream Provider Solutions for 2014 and 2013, respectively.
Sales and Marketing. Sales and marketing expenses, including personnel costs, increased approximately $5.8 million, or 24%, to $29.9 million for 2014 from $24.1 million for 2013. Sales and marketing expenses as a percentage of revenues were approximately 18% of revenues for both 2014 and 2013.
Sales and marketing expenses for HealthStream Workforce Solutions increased approximately $4.6 million and approximated 16% and 17% of revenues for HealthStream Workforce Solutions for 2014 and 2013, respectively. The expense increase is primarily due to additional personnel and related expenses, increased commissions associated with higher sales performance compared to the prior year, and increased marketing spending. Sales and marketing expenses for HealthStream Patient Experience Solutions increased approximately $768,000, and approximated 19% of revenues for HealthStream Patient Experience Solutions for both 2014 and 2013. The increase in amount and as a percentage of revenues is primarily due to additional personnel associated with the BLG acquisition and increased commissions associated with higher sales performance compared to the prior year. Sales and marketing expenses for HealthStream Provider Solutions increased approximately $259,000 and approximated 30% and 28% of revenues for HealthStream Provider Solutions for 2014 and 2013, respectively. The increase is primarily due to additional personnel and related expenses and increased commissions.
Other General and Administrative Expenses. Other general and administrative expenses increased approximately $4.6 million, or 25%, to $22.9 million for 2014 from $18.3 million for 2013. Other general and administrative expenses as a percentage of revenues were approximately 13% and 14% of revenues for 2014 and 2013, respectively.
27
Table of Contents
Other general and administrative expenses for HealthStream Workforce Solutions increased approximately $1.3 million over the prior year period primarily due to the HCCS acquisition, additional personnel, and other support costs. Other general and administrative expenses for HealthStream Patient Experience Solutions increased approximately $543,000 compared to the prior year period primarily due to the BLG acquisition. Other general and administrative expenses for HealthStream Provider Solutions decreased approximately $265,000 compared to the prior year period primarily due to fewer personnel and related expenses. The unallocated corporate portion of other general and administrative expenses increased approximately $3.0 million over the prior year period, primarily associated with additional personnel, professional fees, rent, and other general expenses, as well as expenses associated with the acquisition of HCCS. During 2014, we incurred approximately $762,000 of costs associated with both the completed acquisition of HCCS and other costs for evaluating potential transactions as part of our business development initiatives.
Depreciation and Amortization. Depreciation and amortization increased approximately $3.1 million, or 39%, to $10.9 million for 2014 from $7.8 million for 2013. The increase primarily resulted from amortization of capitalized software development, amortization of intangible assets, and depreciation expense associated with capital expenditures, including leasehold improvements to our Nashville, Tennessee office space.
Other Income, Net. Other income, net was approximately $146,000 for 2014 compared to $176,000 for 2013. The decrease is attributable to losses from equity method investments.
Income Tax Provision. The Company recorded a provision for income taxes of approximately $6.1 million for 2014 compared to approximately $6.4 million for 2013. The Company’s effective tax rate was approximately 37% for 2014 compared to approximately 43% for 2013. The decrease in the effective tax rate resulted primarily from the recognition of approximately $1.2 million in tax benefits associated with research and development tax credits during 2014.
Net Income. Net income increased approximately $2.0 million, or 23%, to $10.4 million for 2014 from $8.4 million for 2013. Earnings per diluted share were $0.37 per share for 2014, compared to $0.30 per diluted share for 2013.
Adjusted EBITDA (a non-GAAP measure which we define as net income before interest, income taxes, stock-based compensation, and depreciation and amortization) increased by 21% to approximately $28.9 million for 2014 compared to $23.9 million for 2013. This improvement is consistent with the factors mentioned above. See Reconciliation of Non-GAAP Financial Measures in Management’s Discussion and Analysis of Financial Condition and Results of Operations for a reconciliation of this calculation to measures under US GAAP.
Reconciliation of Non-GAAP Financial Measures
This report contains certain non-GAAP financial measures, including non-GAAP net income, non-GAAP operating income, non-GAAP revenue and adjusted EBITDA, which are used by management in analyzing the Company’s financial results and ongoing operational performance. These non-GAAP financial measures should not be considered as a substitute for, or superior to, measures of financial performance which are prepared in accordance with US GAAP and may be different from non-GAAP financial measures used by other companies.
In order to better assess the Company’s financial results, management believes that adjusted EBITDA is a useful measure for evaluating the operating performance of the Company because adjusted EBITDA reflects net income adjusted for certain non-cash and non-operating items. The Company believes that adjusted EBITDA is also used by many investors and securities analysts to assess the Company’s results from current operations. Adjusted EBITDA is a non-GAAP financial measure and should not be considered as a measure of financial performance under US GAAP. Because adjusted EBITDA is not a measurement determined in accordance with US GAAP, it is susceptible to varying calculations. Accordingly, adjusted EBITDA, as presented, may not be comparable to other similarly titled measures of other companies.
The Company understands that, although adjusted EBITDA is frequently used by investors and securities analysts in their evaluation of companies, this measure has limitations as an analytical tool, and should not be considered in isolation, or as a substitute for an analysis of the Company’s results as reported under US GAAP.
Management addresses these inherent limitations associated with using adjusted EBITDA through disclosure of such limitations, presentation of our financial statements in accordance with US GAAP, and reconciliation of adjusted EBITDA to net income, the most directly comparable US GAAP measure.
In recent years, the Company has acquired businesses whose net tangible assets include deferred revenue. In accordance with GAAP reporting requirements, following the completion of any such acquisition, the Company may record a write down of deferred revenue to fair value as defined in GAAP. If the Company is required to record a write-down of deferred revenue, it may result in lower recognized revenue, operating income, and net income in subsequent periods.
28
Table of Contents
As discussed elsewhere in this report, the Company completed the acquisitions of BLG in September 2013, HCCS in March 2014 and HLS in March 2015. In accordance with US GAAP reporting requirements for fair value, deferred revenue write-downs of $254,000 for BLG, $1.5 million for HCCS and $9.0 million for HLS have been recorded in periods following such acquisitions. These write-downs result in lower revenues than would have otherwise been recognized for such services.
In connection therewith, this report presents below non-GAAP revenues, non-GAAP operating income and non-GAAP net income, which in each such case reflects the corresponding GAAP figures adjusted to exclude the impact of the deferred revenue write-down associated with fair value accounting for acquired businesses as referenced above. Management believes that the presentation of these non-GAAP financial measures assists investors in understanding the Company’s performance between periods by excluding the impact of this deferred revenue write-down and provides a useful measure of the ongoing performance of the Company. Both on a quarterly and year-to-date basis, the revenue for the acquired business is deferred and typically recognized over a one-to-two year period following the completion of any particular acquisition, so our GAAP revenues for this one-to-two year period will not reflect the full amount of revenues that would have been reported if the acquired deferred revenue was not written down to fair value. A reconciliation of these non-GAAP financial measures to the corresponding GAAP measures is set forth below.
| 2015 | 2014 | 2013 | ||||||||||
| GAAP net income |
$ | 8,621 | $ | 10,394 | $ | 8,418 | ||||||
| Interest income |
(401 | ) | (265 | ) | (263 | ) | ||||||
| Interest expense |
188 | 56 | 51 | |||||||||
| Income tax provision |
5,098 | 6,127 | 6,424 | |||||||||
| Stock based compensation expense |
3,280 | 1,625 | 1,458 | |||||||||
| Depreciation and amortization |
16,997 | 10,931 | 7,852 | |||||||||
|
|
|
|
|
|
|
|||||||
| Adjusted EBITDA |
$ | 33,783 | $ | 28,868 | $ | 23,940 | ||||||
|
|
|
|
|
|
|
|||||||
| GAAP revenues |
$ | 209,002 | $ | 170,690 | $ | 132,274 | ||||||
| Adjustment for deferred revenue write-down |
6,822 | 1,465 | 839 | |||||||||
|
|
|
|
|
|
|
|||||||
| Non-GAAP revenues |
$ | 215,824 | $ | 172,155 | $ | 133,113 | ||||||
|
|
|
|
|
|
|
|||||||
| GAAP operating income |
$ | 13,557 | $ | 16,375 | $ | 14,666 | ||||||
| Adjustment for deferred revenue write-down |
6,822 | 1,465 | 839 | |||||||||
|
|
|
|
|
|
|
|||||||
| Non-GAAP operating income |
$ | 20,379 | $ | 17,840 | $ | 15,505 | ||||||
|
|
|
|
|
|
|
|||||||
| GAAP net income |
$ | 8,621 | $ | 10,394 | $ | 8,418 | ||||||
| Adjustment for deferred revenue write-down, net of tax |
4,287 | 921 | 476 | |||||||||
|
|
|
|
|
|
|
|||||||
| Non-GAAP net income |
$ | 12,908 | $ | 11,315 | $ | 8,894 | ||||||
|
|
|
|
|
|
|
|||||||
FINANCIAL OUTLOOK FOR 2016
The Company provides projections and other forward-looking information in this “Financial Outlook for 2016” section within “Management’s Discussion and Analysis of Financial Condition and Results of Operations.” This section contains many forward-looking statements, particularly relating to the Company’s future financial performance. These forward-looking statements are estimates based on information currently available to the Company, are made pursuant to the safe harbor provisions of the Private Securities Litigation Reform Act of 1995 and are subject to the precautionary statements set forth in the introduction in Part I of this Annual Report on Form 10-K and the risks and uncertainties described in Item 1A, Risk Factors and elsewhere in this document. Actual results are likely to differ, and in the past have differed, materially from those forecast by the Company, depending on the outcome of various factors, including, but not limited to, those set forth in Item 1A, Risk Factors.
For 2016, we anticipate that consolidated revenues will grow 8 to 12 percent as compared to 2015. We anticipate that revenue growth in our Workforce Solutions segment will be in the two to six percent range and approximately 8 to 12 percent in our Patient Experience Solutions segment. We anticipate our Provider Solutions segment’s revenue to grow 80 to 84 percent as compared to 2015.
Revenues from ICD-10 readiness training, which were approximately $26.8 million in 2015, are expected to decline by approximately $20 million in 2016 and are reflected in the above guidance range for Workforce Solutions.
We anticipate operating income for 2016 to increase between 10 and 14 percent as compared to 2015.
We anticipate that capital expenditures will be between $14 million and $16 million during 2016. We expect the annual effective income tax rate to range between 39 percent and 41 percent for 2016.
The aforementioned guidance does not include the impact from any acquisitions that we may complete during 2016.
29
Table of Contents
SELECTED QUARTERLY OPERATING RESULTS
The following tables set forth selected statements of income data for each of the four quarters in the periods ended December 31, 2015 and December 31, 2014, respectively. The information for each quarter has been prepared on the same basis as the audited statements included in other parts of this report and, in our opinion, includes all adjustments, consisting of only normal recurring adjustments, necessary for a fair presentation of the results of operations for these periods. You should read this information in conjunction with HealthStream’s Consolidated Financial Statements and related notes thereto included elsewhere in this report. The operating results for any quarter are not necessarily indicative of the results to be expected in the future.
Revenues from our subscription-based products are recognized ratably over the subscription term. Survey and research revenues are impacted by seasonal factors resulting from the volume, timing, and frequency of survey cycles.
| Quarter Ended | ||||||||||||||||
| March 31, 2015 |
June 30, 2015 |
September 30, 2015 |
December 31, 2015 |
|||||||||||||
| (In thousands, except per share data) | ||||||||||||||||
| STATEMENT OF INCOME DATA: |
||||||||||||||||
| Revenues, net |
$ | 47,156 | $ | 52,145 | $ | 53,835 | $ | 55,866 | ||||||||
| Total operating costs and expenses |
42,366 | 49,581 | 49,510 | 53,988 | ||||||||||||
|
|
|
|
|
|
|
|
|
|||||||||
| Income from operations |
4,790 | 2,564 | 4,325 | 1,878 | ||||||||||||
| Net income |
$ | 2,722 | $ | 1,473 | $ | 2,614 | $ | 1,811 | ||||||||
|
|
|
|
|
|
|
|
|
|||||||||
| Net income per share (1): |
||||||||||||||||
| Basic |
$ | 0.10 | $ | 0.05 | $ | 0.08 | $ | 0.06 | ||||||||
|
|
|
|
|
|
|
|
|
|||||||||
| Diluted |
$ | 0.10 | $ | 0.05 | $ | 0.08 | $ | 0.06 | ||||||||
|
|
|
|
|
|
|
|
|
|||||||||
| Weighted average shares of common stock outstanding: |
||||||||||||||||
| Basic |
27,703 | 29,234 | 31,643 | 31,646 | ||||||||||||
|
|
|
|
|
|
|
|
|
|||||||||
| Diluted |
28,068 | 29,617 | 32,029 | 32,031 | ||||||||||||
|
|
|
|
|
|
|
|
|
|||||||||
| Quarter Ended | ||||||||||||||||
| March 31, 2014 |
June 30, 2014 |
September 30, 2014 |
December 31, 2014 |
|||||||||||||
| (In thousands, except per share data) | ||||||||||||||||
| STATEMENT OF INCOME DATA: |
||||||||||||||||
| Revenues, net |
$ | 38,350 | $ | 42,476 | $ | 44,525 | $ | 45,339 | ||||||||
| Total operating costs and expenses |
35,052 | 38,366 | 39,784 | 41,113 | ||||||||||||
|
|
|
|
|
|
|
|
|
|||||||||
| Income from operations |
3,298 | 4,110 | 4,741 | 4,226 | ||||||||||||
| Net income |
$ | 1,947 | $ | 2,364 | $ | 3,436 | $ | 2,647 | ||||||||
|
|
|
|
|
|
|
|
|
|||||||||
| Net income per share (1): |
||||||||||||||||
| Basic |
$ | 0.07 | $ | 0.09 | $ | 0.12 | $ | 0.10 | ||||||||
|
|
|
|
|
|
|
|
|
|||||||||
| Diluted |
$ | 0.07 | $ | 0.08 | $ | 0.12 | $ | 0.09 | ||||||||
|
|
|
|
|
|
|
|
|
|||||||||
| Weighted average shares of common stock outstanding: |
||||||||||||||||
| Basic |
27,453 | 27,567 | 27,605 | 27,655 | ||||||||||||
|
|
|
|
|
|
|
|
|
|||||||||
| Diluted |
27,906 | 28,044 | 28,047 | 28,095 | ||||||||||||
|
|
|
|
|
|
|
|
|
|||||||||
(1) – Due to the nature of interim earnings per share calculations, the sum of quarterly earnings per share amounts may not equal the reported earnings per share for the full year.
Liquidity and Capital Resources
Net cash provided by operating activities increased by $660,000, or 2%, to $34.9 million during 2015 from $34.3 million during 2014. The primary sources of cash were generated from receipts from the sales of our products and services. The number of days sales outstanding (DSO) was 61 days for 2015 and 63 days for 2014. The Company calculates DSO by dividing the average accounts receivable balance (excluding unbilled and other receivables) by average daily revenues for the year. The primary uses of cash to fund our operations include personnel expenses, sales commissions, royalty payments, payments for contract labor and other direct expenses associated with delivery of our products and services, and general corporate expenses.
Net cash used in investing activities was approximately $134.9 million during 2015 and $15.5 million during 2014. During 2015, the Company purchased $84.2 million of marketable securities, utilized $88.1 million (net of cash acquired) for business combinations, spent $7.3 million for capitalized software development, purchased $8.1 million of property and equipment, and made $2.0 million in non-marketable equity investments. These uses of cash were partially offset by maturities of marketable securities of $54.8 million. During 2014, the Company purchased $44.3 million of marketable securities, utilized $12.3 million (net of cash acquired) for business combinations, spent $5.7 million for capitalized software development, purchased $4.5 million of property and equipment, and made $1.3 million in non-marketable equity investments. These uses of cash were partially offset by maturities of marketable securities of $52.6 million.
30
Table of Contents
Cash provided by financing activities was approximately $100.0 million during 2015 and $3.7 million during 2014. The primary sources of cash from financing activities for 2015 resulted from $98.0 million in proceeds from the issuance of 3.9 million shares of our common stock in our underwritten public offering that was completed on May 28, 2015, $3.0 million of excess tax benefits from equity awards, and $328,000 of proceeds from the exercise of employee stock options. The primary uses of cash during 2015 related to payments of payroll taxes from stock based compensation arrangements of $756,000 and earn-outs for prior business combinations of $633,000. During 2014 the primary source of cash from financing activities resulted from $1.1 million of proceeds from the exercise of employee stock options and $3.2 million of excess tax benefits from equity awards. The primary uses of cash during 2014 resulted from $424,000 for payments of earn-outs from prior business combinations and $161,000 for payments of payroll taxes from stock based compensation arrangements.
Revenues increased over the prior year, and our balance sheet reflects positive working capital of $120.4 million at December 31, 2015 compared to $97.4 million at December 31, 2014. The increase in working capital primarily resulted from increases in investment balances. At December 31, 2015, the Company’s primary source of liquidity was $149.0 million of cash and cash equivalents and marketable securities. The Company also has a $50.0 million revolving credit facility loan agreement, all of which was available at December 31, 2015.
We believe that our existing cash and cash equivalents, marketable securities, cash generated from operations, and available borrowings under our revolving credit facility will be sufficient to meet anticipated working capital needs, new product development and capital expenditures for at least the next 12 months. Over the past ten years, the Company utilized federal and state net operating loss carryforwards to offset taxable income, therefore reducing its income tax liabilities. The federal net operating loss carryforwards have been fully utilized as of December 31, 2015; therefore, actual income tax payments are expected to increase significantly in the future and will more closely approximate the provision for income taxes.
The Company’s growth strategy includes acquiring businesses that provide complementary product and services. It is anticipated that future acquisitions, if any, would be effected through cash consideration, stock consideration, or a combination of both. The issuance of our stock as consideration for an acquisition or to raise additional capital could have a dilutive effect on earnings per share and could adversely affect our stock price. The revolving credit facility contains financial covenants and availability calculations designed to set a maximum leverage ratio of outstanding debt to adjusted EBITDA and an interest coverage ratio of adjusted EBITDA to interest expense. Therefore, the maximum borrowings against the revolving credit facility would be dependent on the covenant values at the time of borrowing. As of December 31, 2015, the Company was in material compliance with all covenants. There can be no assurance that amounts available for borrowing under our revolving credit facility will be sufficient to consummate any possible acquisitions, and we cannot assure you that if we need additional financing that it will be available on terms favorable to us, or at all. Failure to generate sufficient cash flow from operations or raise additional capital when required in sufficient amounts and on terms acceptable to us could harm our business, financial condition and results of operations.
Off-Balance Sheet Arrangements and Contractual Obligations
The Company’s off-balance sheet arrangements primarily consist of operating leases, contractual obligations, and our revolving credit facility, which is described further in Note 14 to the Company’s consolidated financial statements contained elsewhere in this report.
The following table presents a summary of future anticipated payments due by the Company under contractual obligations with firm minimum commitments as of December 31, 2015, excluding amounts already recorded in the consolidated balance sheets (in thousands):
| Payments due by period | ||||||||||||||||||||
| Less than 1 year |
1-3 years | 3-5 years | More than 5 years |
Total | ||||||||||||||||
| Operating leases |
$ | 3,876 | $ | 3,990 | $ | 1,618 | $ | 2,604 | $ | 12,088 | ||||||||||
| Purchase obligations |
597 | 1,001 | — | — | 1,598 | |||||||||||||||
|
|
|
|
|
|
|
|
|
|
|
|||||||||||
| Total |
$ | 4,473 | $ | 4,991 | $ | 1,618 | $ | 2,604 | $ | 13,686 | ||||||||||
|
|
|
|
|
|
|
|
|
|
|
|||||||||||
Recent Accounting Pronouncements
In May 2014, the Financial Accounting Standards Board (“FASB”) issued Accounting Standards Update (“ASU”) 2014-09, Revenue from Contracts with Customers (Topic 606), which supersedes the revenue recognition requirements in Topic 605, Revenue Recognition, and most industry-specific revenue recognition guidance throughout the Industry Topics of the Accounting Standards Codification. The updated guidance states that an entity should recognize revenue to depict the transfer of promised goods or services to customers in an amount that reflects the consideration to which the entity expects to be entitled in exchange for those goods or services. The guidance also provides for additional disclosures with respect to revenues and cash flows arising from contracts with customers. The standard will be effective for the first interim period within annual reporting periods beginning after December 15, 2017, and early adoption is permitted for the first interim period within annual reporting periods beginning after December 15, 2016. The Company is currently reviewing this standard to determine the method of adoption and to assess the impact on its future consolidated financial statements.
31
Table of Contents
Item 7A. Quantitative and Qualitative Disclosures about Market Risk
The Company is exposed to market risk from changes in interest rates. We do not have any foreign currency exchange rate risk or commodity price risk. As of December 31, 2015, the Company had no outstanding debt. We may become subject to interest rate market risk associated with any future borrowings under our revolving credit facility. The interest rate under the revolving credit facility varies depending on the interest rate option selected by the Company plus a margin determined in accordance with a pricing grid. We are exposed to market risk with respect to our cash and investment balances, which approximated $149.0 million at December 31, 2015. Assuming a hypothetical 10% decrease in interest rates, interest income from cash and investments would decrease on an annualized basis by approximately $90,000.
The Company’s investment policy and strategy is focused on investing in highly rated securities, with the objective of minimizing the potential risk of principal loss. The Company’s policy limits the amount of credit exposure to any single issuer and sets limits on the average portfolio maturity.
The above market risk discussion and the estimated amounts presented are forward-looking statements of market risk assuming the occurrence of certain adverse market conditions. Actual results in the future may differ materially from those projected as a result of actual developments in the market.
32
Table of Contents
Item 8. Financial Statements and Supplementary Data
INDEX TO CONSOLIDATED FINANCIAL STATEMENTS
| Page | ||
| 34 | ||
| 36 | ||
| 37 | ||
| 38 | ||
| 39 | ||
| 40 | ||
| 41 | ||
33
Table of Contents
REPORT OF INDEPENDENT REGISTERED PUBLIC ACCOUNTING FIRM
The Board of Directors and Shareholders of
HealthStream, Inc.
We have audited the accompanying consolidated balance sheets of HealthStream, Inc. as of December 31, 2015 and 2014, and the related consolidated statements of income, comprehensive income, shareholders’ equity, and cash flows for each of the three years in the period ended December 31, 2015. These financial statements are the responsibility of the Company’s management. Our responsibility is to express an opinion on these financial statements based on our audits.
We conducted our audits in accordance with the standards of the Public Company Accounting Oversight Board (United States). Those standards require that we plan and perform the audit to obtain reasonable assurance about whether the financial statements are free of material misstatement. An audit includes examining, on a test basis, evidence supporting the amounts and disclosures in the financial statements. An audit also includes assessing the accounting principles used and significant estimates made by management, as well as evaluating the overall financial statement presentation. We believe that our audits provide a reasonable basis for our opinion.
In our opinion, the financial statements referred to above present fairly, in all material respects, the consolidated financial position of HealthStream, Inc. at December 31, 2015 and 2014, and the consolidated results of its operations and its cash flows for each of the three years in the period ended December 31, 2015, in conformity with U.S. generally accepted accounting principles.
As discussed in Note 1 to the consolidated financial statements, the Company changed the classification of all deferred tax assets and liabilities to noncurrent on the December 31, 2015 balance sheet as a result of the adoption of the amendments to the FASB Accounting Standards Codification resulting from Accounting Standards Update No. 2015-17, Balance Sheet Classification of Deferred Taxes, effective December 31, 2015.
We also have audited, in accordance with the standards of the Public Company Accounting Oversight Board (United States), HealthStream, Inc.’s internal control over financial reporting as of December 31, 2015, based on criteria established in Internal Control – Integrated Framework issued by the Committee of Sponsoring Organizations of the Treadway Commission (2013 framework) and our report dated February 26, 2016 expressed an unqualified opinion thereon.
| /s/ Ernst & Young LLP |
Nashville, Tennessee
February 26, 2016
34
Table of Contents
REPORT OF INDEPENDENT REGISTERED PUBLIC ACCOUNTING FIRM
The Board of Directors and Shareholders of
HealthStream, Inc.
We have audited HealthStream, Inc.’s internal control over financial reporting as of December 31, 2015, based on criteria established in Internal Control – Integrated Framework issued by the Committee of Sponsoring Organizations of the Treadway Commission (2013 framework) (the COSO criteria). HealthStream, Inc.’s management is responsible for maintaining effective internal control over financial reporting, and for its assessment of the effectiveness of internal control over financial reporting included in the accompanying Management’s Annual Report on Internal Control over Financial Reporting. Our responsibility is to express an opinion on the Company’s internal control over financial reporting based on our audit.
We conducted our audit in accordance with the standards of the Public Company Accounting Oversight Board (United States). Those standards require that we plan and perform the audit to obtain reasonable assurance about whether effective internal control over financial reporting was maintained in all material respects. Our audit included obtaining an understanding of internal control over financial reporting, assessing the risk that a material weakness exists, testing and evaluating the design and operating effectiveness of internal control based on the assessed risk, and performing such other procedures as we considered necessary in the circumstances. We believe that our audit provides a reasonable basis for our opinion.
A company’s internal control over financial reporting is a process designed to provide reasonable assurance regarding the reliability of financial reporting and the preparation of financial statements for external purposes in accordance with generally accepted accounting principles. A company’s internal control over financial reporting includes those policies and procedures that (1) pertain to the maintenance of records that, in reasonable detail, accurately and fairly reflect the transactions and dispositions of the assets of the company; (2) provide reasonable assurance that transactions are recorded as necessary to permit preparation of financial statements in accordance with generally accepted accounting principles, and that receipts and expenditures of the company are being made only in accordance with authorizations of management and directors of the company; and (3) provide reasonable assurance regarding prevention or timely detection of unauthorized acquisition, use, or disposition of the company’s assets that could have a material effect on the financial statements.
Because of its inherent limitations, internal control over financial reporting may not prevent or detect misstatements. Also, projections of any evaluation of effectiveness to future periods are subject to the risk that controls may become inadequate because of changes in conditions, or that the degree of compliance with the policies or procedures may deteriorate.
In our opinion, HealthStream, Inc. maintained, in all material respects, effective internal control over financial reporting as of December 31, 2015, based on the COSO criteria.
We also have audited, in accordance with the standards of the Public Company Accounting Oversight Board (United States), the 2015 consolidated financial statements of HealthStream, Inc. and our report dated February 26, 2016 expressed an unqualified opinion thereon.
| /s/ Ernst & Young LLP |
Nashville, Tennessee
February 26, 2016
35
Table of Contents
CONSOLIDATED BALANCE SHEETS
(In thousands)
| December 31, 2015 |
December 31, 2014 |
|||||||
| ASSETS | ||||||||
| Current assets: |
||||||||
| Cash and cash equivalents |
$ | 82,010 | $ | 81,995 | ||||
| Marketable securities |
66,976 | 38,973 | ||||||
| Accounts receivable, net of allowance for doubtful accounts of $303 and $331 at December 31, 2015 and 2014, respectively |
36,348 | 33,167 | ||||||
| Accounts receivable - unbilled |
1,998 | 1,678 | ||||||
| Prepaid royalties, net of amortization |
14,036 | 13,030 | ||||||
| Other prepaid expenses and other current assets |
8,169 | 5,768 | ||||||
|
|
|
|
|
|||||
| Total current assets |
209,537 | 174,611 | ||||||
| Property and equipment, net |
12,471 | 9,442 | ||||||
| Capitalized software development, net of accumulated amortization of $24,130 and $18,114 at December 31, 2015 and 2014, respectively |
13,955 | 12,706 | ||||||
| Goodwill |
83,073 | 41,914 | ||||||
| Intangible assets, net of accumulated amortization of $8,685 and $13,834 at December 31, 2015 and 2014, respectively |
55,966 | 14,795 | ||||||
| Non-marketable equity investments |
3,640 | 1,757 | ||||||
| Other assets |
927 | 2,037 | ||||||
|
|
|
|
|
|||||
| Total assets |
$ | 379,569 | $ | 257,262 | ||||
|
|
|
|
|
|||||
| LIABILITIES AND SHAREHOLDERS’ EQUITY | ||||||||
| Current liabilities: |
||||||||
| Accounts payable |
$ | 4,616 | $ | 4,753 | ||||
| Accrued royalties |
9,053 | 9,255 | ||||||
| Accrued liabilities |
7,003 | 7,224 | ||||||
| Accrued compensation and related expenses |
3,308 | 2,311 | ||||||
| Deferred revenue |
65,098 | 53,716 | ||||||
|
|
|
|
|
|||||
| Total current liabilities |
89,078 | 77,259 | ||||||
| Deferred tax liabilities |
4,763 | 5,838 | ||||||
| Deferred revenue, noncurrent |
4,350 | 3,657 | ||||||
| Other long term liabilities |
1,058 | 2,649 | ||||||
| Commitments and contingencies |
— | — | ||||||
| Shareholders’ equity: |
||||||||
| Common stock, no par value, 75,000 shares authorized; 31,647 and 27,677 shares issued and outstanding at December 31, 2015 and 2014, respectively |
278,799 | 174,926 | ||||||
| Retained earnings (accumulated deficit) |
1,591 | (7,030 | ) | |||||
| Accumulated other comprehensive loss |
(70 | ) | (37 | ) | ||||
|
|
|
|
|
|||||
| Total shareholders’ equity |
280,320 | 167,859 | ||||||
|
|
|
|
|
|||||
| Total liabilities and shareholders’ equity |
$ | 379,569 | $ | 257,262 | ||||
|
|
|
|
|
|||||
See accompanying notes to the consolidated financial statements.
36
Table of Contents
CONSOLIDATED STATEMENTS OF INCOME
(In thousands, except per share data)
| For the Year Ended December 31, | ||||||||||||
| 2015 | 2014 | 2013 | ||||||||||
| Revenues, net |
$ | 209,002 | $ | 170,690 | $ | 132,274 | ||||||
| Operating costs and expenses: |
||||||||||||
| Cost of revenues (excluding depreciation and amortization) |
89,386 | 74,145 | 55,605 | |||||||||
| Product development |
24,214 | 16,463 | 11,757 | |||||||||
| Sales and marketing |
35,589 | 29,867 | 24,052 | |||||||||
| Other general and administrative expenses |
29,259 | 22,909 | 18,342 | |||||||||
| Depreciation and amortization |
16,997 | 10,931 | 7,852 | |||||||||
|
|
|
|
|
|
|
|||||||
| Total operating costs and expenses |
195,445 | 154,315 | 117,608 | |||||||||
| Operating income |
13,557 | 16,375 | 14,666 | |||||||||
| Other income, net |
162 | 146 | 176 | |||||||||
|
|
|
|
|
|
|
|||||||
| Income before income tax provision |
13,719 | 16,521 | 14,842 | |||||||||
| Income tax provision |
5,098 | 6,127 | 6,424 | |||||||||
|
|
|
|
|
|
|
|||||||
| Net income |
$ | 8,621 | $ | 10,394 | $ | 8,418 | ||||||
|
|
|
|
|
|
|
|||||||
| Net income per share: |
||||||||||||
| Basic |
$ | 0.29 | $ | 0.38 | $ | 0.31 | ||||||
|
|
|
|
|
|
|
|||||||
| Diluted |
$ | 0.28 | $ | 0.37 | $ | 0.30 | ||||||
|
|
|
|
|
|
|
|||||||
| Weighted average shares of common stock outstanding: |
||||||||||||
| Basic |
30,057 | 27,570 | 26,853 | |||||||||
|
|
|
|
|
|
|
|||||||
| Diluted |
30,436 | 28,023 | 27,663 | |||||||||
|
|
|
|
|
|
|
|||||||
See accompanying notes to the consolidated financial statements.
37
Table of Contents
CONSOLIDATED STATEMENTS OF COMPREHENSIVE INCOME
(In thousands)
| For the Year Ended December 31, | ||||||||||||
| 2015 | 2014 | 2013 | ||||||||||
| Net income |
$ | 8,621 | $ | 10,394 | $ | 8,418 | ||||||
| Other comprehensive income, net of taxes: |
||||||||||||
| Unrealized loss on marketable securities |
(33 | ) | (6 | ) | (49 | ) | ||||||
|
|
|
|
|
|
|
|||||||
| Total other comprehensive loss |
(33 | ) | (6 | ) | (49 | ) | ||||||
| Comprehensive income |
$ | 8,588 | $ | 10,388 | $ | 8,369 | ||||||
|
|
|
|
|
|
|
|||||||
See accompanying notes to the consolidated financial statements.
38
Table of Contents
CONSOLIDATED STATEMENTS OF SHAREHOLDERS’ EQUITY
(In thousands)
| Retained | Accumulated | |||||||||||||||||||
| Earnings | Other | Total | ||||||||||||||||||
| Common Stock | (Accumulated | Comprehensive | Shareholders’ | |||||||||||||||||
| Shares | Amount | Deficit) | Income (Loss) | Equity | ||||||||||||||||
| Balance at December 31, 2012 |
26,233 | $ | 158,020 | $ | (25,842 | ) | $ | 18 | $ | 132,196 | ||||||||||
| Net income |
— | — | 8,418 | — | 8,418 | |||||||||||||||
| Comprehensive loss |
— | — | — | (49 | ) | (49 | ) | |||||||||||||
| Issuance of common stock in acquisition |
15 | 534 | — | — | 534 | |||||||||||||||
| Stock based compensation |
— | 1,458 | — | — | 1,458 | |||||||||||||||
| Tax benefits from equity awards |
— | 3,722 | — | — | 3,722 | |||||||||||||||
| Common stock issued under stock plans, net of shares withheld for employee taxes |
1,079 | 3,154 | — | — | 3,154 | |||||||||||||||
|
|
|
|
|
|
|
|
|
|
|
|||||||||||
| Balance at December 31, 2013 |
27,327 | 166,888 | (17,424 | ) | (31 | ) | 149,433 | |||||||||||||
| Net income |
— | — | 10,394 | — | 10,394 | |||||||||||||||
| Comprehensive loss |
— | — | — | (6 | ) | (6 | ) | |||||||||||||
| Issuance of common stock in acquisition |
82 | 2,246 | — | — | 2,246 | |||||||||||||||
| Stock based compensation |
— | 1,625 | — | — | 1,625 | |||||||||||||||
| Tax benefits from equity awards |
— | 3,234 | — | — | 3,234 | |||||||||||||||
| Common stock issued under stock plans, net of shares withheld for employee taxes |
268 | 933 | — | — | 933 | |||||||||||||||
|
|
|
|
|
|
|
|
|
|
|
|||||||||||
| Balance at December 31, 2014 |
27,677 | 174,926 | (7,030 | ) | (37 | ) | 167,859 | |||||||||||||
| Net income |
— | — | 8,621 | — | 8,621 | |||||||||||||||
| Comprehensive loss |
— | — | — | (33 | ) | (33 | ) | |||||||||||||
| Issuance of common stock |
3,870 | 98,014 | — | — | 98,014 | |||||||||||||||
| Stock donated to Company |
(54 | ) | — | — | — | — | ||||||||||||||
| Stock based compensation |
— | 3,280 | — | — | 3,280 | |||||||||||||||
| Tax benefits from equity awards |
— | 3,008 | — | — | 3,008 | |||||||||||||||
| Common stock issued under stock plans, net of shares withheld for employee taxes |
154 | (429 | ) | — | — | (429 | ) | |||||||||||||
|
|
|
|
|
|
|
|
|
|
|
|||||||||||
| Balance at December 31, 2015 |
31,647 | $ | 278,799 | $ | 1,591 | $ | (70 | ) | $ | 280,320 | ||||||||||
|
|
|
|
|
|
|
|
|
|
|
|||||||||||
See accompanying notes to the consolidated financial statements.
39
Table of Contents
CONSOLIDATED STATEMENTS OF CASH FLOWS
(In thousands)
| For the Year Ended December 31, | ||||||||||||
| 2015 | 2014 | 2013 | ||||||||||
| OPERATING ACTIVITIES: |
||||||||||||
| Net income |
$ | 8,621 | $ | 10,394 | $ | 8,418 | ||||||
| Adjustments to reconcile net income to net cash provided by operating activities: |
||||||||||||
| Depreciation and amortization |
16,997 | 10,931 | 7,852 | |||||||||
| Deferred income taxes |
392 | 1,324 | 2,506 | |||||||||
| Stock based compensation expense |
3,280 | 1,625 | 1,458 | |||||||||
| Excess tax benefits from equity awards |
(3,008 | ) | (3,234 | ) | (3,722 | ) | ||||||
| Provision for doubtful accounts |
284 | 237 | 115 | |||||||||
| Loss on non-marketable equity investments |
117 | 65 | 37 | |||||||||
| Gain on sale of long-lived assets |
(72 | ) | — | — | ||||||||
| Other |
1,401 | 1,394 | 1,660 | |||||||||
| Changes in assets and liabilities, net of business combinations: |
||||||||||||
| Accounts and unbilled receivables |
(736 | ) | (6,690 | ) | (10,056 | ) | ||||||
| Prepaid royalties |
(1,006 | ) | (4,174 | ) | (5,119 | ) | ||||||
| Other prepaid expenses and other current assets |
(1,372 | ) | (2,022 | ) | (1,207 | ) | ||||||
| Other assets |
1,110 | (1,761 | ) | 105 | ||||||||
| Accounts payable |
(137 | ) | 2,442 | 1,254 | ||||||||
| Accrued royalties |
(202 | ) | 820 | 3,399 | ||||||||
| Accrued liabilities, accrued compensation and related expenses, and other long-term liabilities |
3,075 | 5,434 | 5,593 | |||||||||
| Deferred revenue |
6,173 | 17,471 | 14,761 | |||||||||
|
|
|
|
|
|
|
|||||||
| Net cash provided by operating activities |
34,917 | 34,256 | 27,054 | |||||||||
|
|
|
|
|
|
|
|||||||
| INVESTING ACTIVITIES: |
||||||||||||
| Business combinations, net of cash acquired |
(88,075 | ) | (12,298 | ) | (7,560 | ) | ||||||
| Proceeds from sales of marketable securities |
— | — | 5,062 | |||||||||
| Proceeds from maturities of marketable securities |
54,799 | 52,625 | 82,661 | |||||||||
| Purchases of marketable securities |
(84,228 | ) | (44,341 | ) | (86,139 | ) | ||||||
| Payments to acquire equity method investments |
(1,000 | ) | (325 | ) | (300 | ) | ||||||
| Payments to acquire cost method investments |
(1,000 | ) | (1,000 | ) | — | |||||||
| Payments associated with capitalized software development |
(7,265 | ) | (5,658 | ) | (4,267 | ) | ||||||
| Purchases of property and equipment |
(8,094 | ) | (4,544 | ) | (4,444 | ) | ||||||
|
|
|
|
|
|
|
|||||||
| Net cash used in investing activities |
(134,863 | ) | (15,541 | ) | (14,987 | ) | ||||||
|
|
|
|
|
|
|
|||||||
| FINANCING ACTIVITIES: |
||||||||||||
| Proceeds from issuance of common stock |
98,014 | — | — | |||||||||
| Proceeds from exercise of stock options |
328 | 1,094 | 3,318 | |||||||||
| Proceeds from borrowings under revolving line of credit facility |
28,000 | — | — | |||||||||
| Repayments under revolving line of credit facility |
(28,000 | ) | — | — | ||||||||
| Taxes paid related to net settlement of equity awards |
(756 | ) | (161 | ) | (164 | ) | ||||||
| Excess tax benefits from equity awards |
3,008 | 3,234 | 3,722 | |||||||||
| Payment of earn-outs related to business combinations |
(633 | ) | (424 | ) | (771 | ) | ||||||
|
|
|
|
|
|
|
|||||||
| Net cash provided by financing activities |
99,961 | 3,743 | 6,105 | |||||||||
|
|
|
|
|
|
|
|||||||
| Net increase in cash and cash equivalents |
15 | 22,458 | 18,172 | |||||||||
| Cash and cash equivalents at beginning of year |
81,995 | 59,537 | 41,365 | |||||||||
|
|
|
|
|
|
|
|||||||
| Cash and cash equivalents at end of year |
$ | 82,010 | $ | 81,995 | $ | 59,537 | ||||||
|
|
|
|
|
|
|
|||||||
| SUPPLEMENTAL CASH FLOW INFORMATION: |
||||||||||||
| Interest paid |
$ | 190 | $ | 56 | $ | 51 | ||||||
|
|
|
|
|
|
|
|||||||
| Income taxes paid |
$ | 2,648 | $ | 1,641 | $ | 371 | ||||||
|
|
|
|
|
|
|
|||||||
| NON-CASH INVESTING AND FINANCING ACTIVITIES: |
||||||||||||
| Receivable from sale of long-lived assets |
$ | 975 | — | — | ||||||||
|
|
|
|
|
|
|
|||||||
| Issuance of common stock in connection with business combinations |
$ | — | $ | 2,246 | $ | 534 | ||||||
|
|
|
|
|
|
|
|||||||
See accompanying notes to the consolidated financial statements.
40
Table of Contents
NOTES TO CONSOLIDATED FINANCIAL STATEMENTS
1. SUMMARY OF SIGNIFICANT ACCOUNTING POLICIES
Reporting Entity and Segments
HealthStream, Inc. (the “Company”) was incorporated in 1990 as a Tennessee corporation and is headquartered in Nashville, Tennessee. The Company operates in three segments: HealthStream Workforce Solutions, HealthStream Patient Experience Solutions, and HealthStream Provider Solutions. Workforce Solutions products consist of SaaS-based services and subscription-based solutions to meet the ongoing training, certification, assessment and development needs of the healthcare community. These solutions provide, deliver and track computer based education for our customers in the United States through our software-as-a-service (SaaS) model. Patient Experience products offer healthcare organizations a wide range of quality and satisfaction surveys, consulting services, analyses of survey results, and other research-based services. Provider Solutions products offer healthcare organizations software applications for administering and tracking provider credentialing, privileging, call center and enrollment.
Change in Goodwill Impairment Testing Date
During the quarter ended December 31, 2015, the Company voluntarily changed its annual goodwill impairment testing date from December 31 to October 1 of each year. This change provides additional time for the completion of the annual goodwill impairment testing prior to the end of the annual reporting period and results in further alignment with the Company’s annual strategic planning process. Accordingly, management considers this accounting change preferable. The Company is unable to objectively determine, without the use of hindsight, the assumptions that would have been used in earlier periods. Therefore, the change will be applied prospectively as retrospective application to prior periods is deemed impracticable. This change does not result in the delay, acceleration or avoidance of any potential impairment charge.
Recently Adopted Accounting Standards
The Company has adopted the provisions of Accounting Standards Update (ASU) 2015-17 — Income Taxes (Topic 740): Balance Sheet Classification of Deferred Taxes, which serves to simplify the balance sheet presentation of deferred taxes. In connection with the adoption of ASU 2015-17, the Company has elected prospective application; therefore, all deferred tax assets and liabilities as of December 31, 2015 are presented as noncurrent in the accompanying consolidated balance sheet.
Recognition of Revenue
Revenues are derived from providing services through our SaaS-based workforce development platform products, courseware subscriptions, provision of survey and research services, sales of software licensing arrangements, software maintenance and support, professional services, custom courseware development and other education and training services.
The Company recognizes revenue when it is realized or realizable and earned. The Company considers revenue realized or realizable and earned when persuasive evidence of an arrangement exists, prices are fixed or determinable, services and products are provided to the customer and collectability is probable or reasonably assured.
Revenue recognized from software and other arrangements is allocated to each element of the arrangement based on the relative fair values of the elements. While elements include software products and post contract customer support, the fair value of each element is based on vendor specific objective evidence (VSOE). If fair value cannot be determined for each element of the arrangement, all revenue from the arrangement is deferred until fair value can be determined or until all elements of the arrangement are delivered and customer acceptance has occurred. Sales of the Company’s SaaS-based workforce development platform products include customer support, implementation services, and training; therefore all revenues are deferred until the SaaS-based product is implemented, at which time revenues are recognized ratably over the subscription service period. In the event that circumstances occur, which give rise to uncertainty regarding the collectibility of contracted amounts, revenue recognition is suspended until such uncertainty is resolved. Fees for these services are billed on either a monthly, quarterly, or annual basis.
Revenues derived from the delivery of services through the Company’s SaaS-based workforce development platform products and courseware subscriptions are recognized ratably over the term of the subscription service agreement or over the historical usage period, if usage typically differs from the subscription period. Other training revenues are generally recognized upon the completion of training.
Revenues derived from the license of installed software products are recognized upon shipment or installation of the software, when VSOE of the fair value of the software license can be established. Software support and maintenance revenues are recognized ratably over the term of the related agreement.
41
Table of Contents
HEALTHSTREAM, INC.
NOTES TO CONSOLIDATED FINANCIAL STATEMENTS (Continued)
1. SUMMARY OF SIGNIFICANT ACCOUNTING POLICIES (continued)
Revenues recognized from the Company’s survey and research services are determined using both the proportional performance method and the completed contract method. Revenues are generally earned over the estimated survey cycle, which typically ranges from less than one month to up to five months. The survey cycle is generally initiated based on the receipt of the first survey response and runs through provision of related survey reports to the customer. If survey results are not available to the customer during the survey fielding cycle, revenues are recognized at time of report delivery. Revenues for coaching and consulting engagements are recognized using the proportional performance method over the term of the underlying contract. Fees for survey services are billed upon initiation of the survey cycle, with progress billings made throughout the survey cycle. Fees for coaching and consulting engagements are billed upon initiation of the engagement with progress billings throughout the term of the contract.
Revenues from professional services and courseware development services are recognized upon the completion of performance milestones and deliverables using the proportional performance method. All other revenues are recognized as the related services are performed or products are delivered. Fees for these services are generally billed at project initiation and upon completion of various milestones.
Principles of Consolidation
The consolidated financial statements include the accounts of the Company and its subsidiaries, all of which are wholly-owned. All inter-company accounts and transactions have been eliminated in consolidation.
Use of Estimates
The consolidated financial statements are prepared in accordance with U.S. generally accepted accounting principles. These accounting principles require management to make estimates and assumptions that affect the amounts reported in the financial statements and accompanying notes. Actual results could differ from those estimates and such differences could be material to the consolidated financial statements.
Cash Equivalents
The Company considers cash equivalents to be unrestricted, highly liquid investments with initial maturities of less than three months.
Marketable Securities
Marketable securities are classified as available for sale and are stated at fair market value, with the unrealized gains and losses, net of tax, reported in other comprehensive income (loss) on the accompanying consolidated balance sheets. Realized gains and losses and declines in market value judged to be other than temporary on investments in marketable securities are included in interest and other income on the accompanying consolidated statements of income. The cost of securities sold is based on the specific identification method. Interest and dividends on securities classified as available for sale are included in other income (expense) on the accompanying consolidated statements of income. Premiums and discounts are amortized over the life of the related available for sale security as an adjustment to yield using the effective interest method.
Accounts Receivable-Unbilled
Accounts receivable-unbilled represents the following: 1) revenue earned and recognized on contracts accounted for using the proportional performance method for which invoices have not been generated or contractual billing dates have not been reached; and 2) the difference between billings for contracts containing escalated pricing over the term of the agreement and the recognition of revenue ratably over the subscription period.
Deferred Revenue
Deferred revenue represents amounts that have been billed or collected in advance of revenue recognition. The Company typically invoices customers in quarterly, bi-annual, or annual installments, and occasionally customers will pay for multi-year contracts in advance. Deferred revenue is recognized as the revenue recognition criteria are met.
Prepaid Royalties
Prepaid royalties represents advance payments associated with the sale of third party products, such as courseware subscriptions. Royalties are typically paid in advance at the commencement of the revenue cycle, or periodically throughout the revenue cycle, such as quarterly, bi-annual, or annual installments. Royalty payments are amortized over the term of the underlying contracts, which generally range from 12 to 36 months, in order to match the direct royalty costs to the same period the subscription revenue is recognized. Amortization of royalties is included under the caption “cost of revenues (excluding depreciation and amortization)” in the accompanying consolidated statements of income.
42
Table of Contents
HEALTHSTREAM, INC.
NOTES TO CONSOLIDATED FINANCIAL STATEMENTS (Continued)
1. SUMMARY OF SIGNIFICANT ACCOUNTING POLICIES (continued)
Allowance for Doubtful Accounts
The Company estimates its allowance for doubtful accounts using a specific identification method in which management considers the facts and circumstances surrounding each potentially uncollectible receivable. An allowance is also maintained for accounts that are not specifically identified that may become uncollectible in the future. Uncollectible receivables are written-off in the period management believes it has exhausted every opportunity to collect payment from the customer. Bad debt expense is recorded when events or circumstances indicate an additional allowance is required based on the Company’s specific identification approach.
Changes in the allowance for doubtful accounts and the amounts charged to bad debt expense for the years ended December 31, were as follows (in thousands):
| Allowance Balance at Beginning of Period |
Charged to Costs and Expenses |
Write-offs | Allowance Balance at End of Period |
|||||||||||||
| 2015 |
$ | 331 | $ | 284 | $ | (312 | ) | $ | 303 | |||||||
| 2014 |
$ | 211 | $ | 237 | $ | (117 | ) | $ | 331 | |||||||
| 2013 |
$ | 142 | $ | 115 | $ | (46 | ) | $ | 211 | |||||||
Capitalized Software Development
Capitalized software development is stated on the basis of cost, and is presented net of accumulated amortization. The Company capitalizes costs incurred during the software development phase for projects when such costs are material. These assets are amortized using the straight-line method, generally ranging between three to five years. The Company capitalized approximately $7.3 million and $5.7 million during 2015 and 2014, respectively. Amortization of capitalized software development was approximately $6.2 million and $4.3 million during 2015 and 2014, respectively. Maintenance and operating costs are expensed as incurred. As of December 31, 2015 and 2014, there were no capitalized internal development costs for computer software developed for resale.
Fair Value Measurements
Fair value is defined as the price that would be received to sell an asset or paid to transfer a liability in the principal or most advantageous market in an orderly transaction between market participants at the measurement date. The fair value hierarchy prioritizes the inputs to valuation techniques used in measuring fair value. There are three levels to the fair value hierarchy based on the reliability of inputs, as follows:
| Level 1 | – | Observable inputs that reflect quoted prices (unadjusted) for identical assets or liabilities in active markets. | ||
| Level 2 | – | Inputs other than quoted prices included in Level 1 that are observable for the asset or liability, either directly or indirectly. | ||
| Level 3 | – | Unobservable inputs in which little or no market data exists, therefore requiring the Company to develop its own assumptions. |
The Company evaluates assets and liabilities subject to fair value measurements on a recurring basis to determine the appropriate level at which to classify them for each reporting period. This determination requires significant judgments to be made by the Company. At December 31, 2015 and 2014, our assets measured at fair value on a recurring basis consisted of marketable securities, which are classified as available for sale (see Note 4 – Marketable Securities). The Company did not have any financial liabilities that were subject to fair value measurements as of such dates.
Property and Equipment
Property and equipment are stated on the basis of cost. Depreciation and amortization are provided on the straight-line method over the following estimated useful lives, except for assets under capital leases and leasehold improvements, which are amortized over the shorter of the estimated useful life or their respective lease term.
| Years | ||||
| Furniture and fixtures | 5-10 | |||
| Equipment | 3-5 | |||
43
Table of Contents
HEALTHSTREAM, INC.
NOTES TO CONSOLIDATED FINANCIAL STATEMENTS (Continued)
1. SUMMARY OF SIGNIFICANT ACCOUNTING POLICIES (continued)
Goodwill and Intangible Assets
Goodwill represents the excess of purchase price in a business combination over the fair value of the net identifiable assets acquired. The carrying amount of our goodwill is evaluated for impairment at least annually during the fourth quarter and whenever events or changes in facts or circumstances indicate that impairment may exist. In accordance with ASC 350, Intangibles – Goodwill and Other, companies may opt to first assess qualitative factors to determine whether it is more likely than not that the fair value of a reporting unit is less than its carrying amount. A qualitative assessment includes factors such as financial performance, industry and market metrics, and other factors affecting the reporting unit. If this assessment concludes that is more likely than not that the fair value of a reporting unit exceeds its carrying value, then goodwill is not considered impaired and no further impairment testing is required. Conversely, if the qualitative assessment concludes that it is more likely than not that the fair value of a reporting unit is less than its carrying value, we must then compare the fair value of the reporting unit to its carrying value. The Company determines fair value of the reporting units using both income and market based models. These models require the use of various assumptions relating to cash flow projections, growth rates, discount rates and terminal value calculations. The Company did not recognize any impairment charges for the years ended December 31, 2015, 2014 or 2013.
As of December 31, 2015, intangible assets with remaining unamortized balances include contract rights and customer relationships, internally-developed technology and patents, non-competition agreements, and trade names. These intangible assets are considered to have definite useful lives and are being amortized on a straight line basis over periods typically ranging between three and fifteen years. The weighted average amortization period for definite lived intangible assets as of December 31, 2015 was 11.3 years. Intangible assets are reviewed for impairment whenever events or changes in facts or circumstances indicate that the carrying amount of the assets may not be recoverable. There were no impairments identified or recorded for the years ended December 31, 2015, 2014, or 2013.
Long-Lived Assets
Long-lived assets to be held for use are reviewed for events or changes in facts and circumstances, both internally and externally, which may indicate that an impairment of long-lived assets held for use is present. The Company measures any impairment using observable market values or discounted future cash flows from the related long-lived assets. The cash flow estimates and discount rates incorporate management’s best estimates, using appropriate and customary assumptions and projections at the date of evaluation. Management periodically evaluates whether the carrying value of long-lived assets, including intangible assets, property and equipment, capitalized software development, and other assets will be recoverable. There were no impairments identified or recorded for the years ended December 31, 2015, 2014, or 2013.
Non-Marketable Equity Investments
Non-marketable equity investments are accounted for using the equity method when the Company can exercise significant influence over the investee. Investments for which the Company is not able to exercise significant influence over the investee are accounted for under the cost method. The proportionate share of income or loss from equity method investments are recorded under the caption “other income, net” in the accompanying consolidated statements of income.
Financial Instruments
The Company has various financial instruments, including cash and cash equivalents, accounts receivable, accounts receivable-unbilled, accounts payable, accrued liabilities, and deferred revenue. The carrying amounts of these financial instruments approximate fair value because of the short term maturity or short term nature of such instruments. The Company also has marketable securities, which are recorded at approximate fair value based on quoted market prices or alternative pricing sources (see Note 4 – Marketable Securities).
Advertising
The Company expenses the costs of advertising as incurred. Advertising expense for the years ended December 31, 2015, 2014, and 2013 was approximately $1.1 million, $0.7 million, and $0.4 million, respectively.
Shipping and Handling Costs
Shipping and handling costs that are associated with our products and services are included in cost of revenues.
44
Table of Contents
HEALTHSTREAM, INC.
NOTES TO CONSOLIDATED FINANCIAL STATEMENTS (Continued)
1. SUMMARY OF SIGNIFICANT ACCOUNTING POLICIES (continued)
Income Taxes
Income taxes are accounted for using the asset and liability method, whereby deferred tax assets and liabilities are determined based on the temporary differences between the financial statement and tax bases of assets and liabilities measured at tax rates that will be in effect for the year in which the differences are expected to affect taxable income. Management evaluates all available evidence, both positive and negative, to determine whether, based on the weight of that evidence, a valuation allowance is needed. Future realization of the tax benefit of an existing deductible temporary difference or carryforward ultimately depends on the existence of sufficient taxable income of the appropriate character within the carryback or carryforward period available under the tax law. There are four possible sources of taxable income that may be available under the tax law to realize a tax benefit for deductible temporary differences and carryforwards: 1) future reversals of existing taxable temporary differences, 2) future taxable income exclusive of reversing temporary differences and carryforwards, 3) taxable income in prior carryback year(s) if carryback is permitted under the tax law, and 4) tax-planning strategies that would, if necessary, be implemented to realize deductible temporary differences or carryforwards prior to their expiration. Management reviews the realizability of its deferred tax assets each reporting period to identify whether any significant changes in circumstances or assumptions have occurred that could materially affect the realizability of deferred tax assets. As of December 31, 2015, the Company had established a valuation allowance of $346,000 for the portion of its net deferred tax assets that are not more likely than not expected to be realized.
The Company accounts for income tax uncertainties using a more-likely-than-not recognition threshold based on the technical merits of the tax position taken. Tax positions that meet the more-likely-than-not recognition threshold are measured in order to determine the tax benefit to be recognized in the financial statements. The Company expenses any penalties or interest associated with tax obligations as general and administrative expenses and interest expense, respectively.
Earnings Per Share
Basic earnings per share is computed by dividing the net income available to common shareholders for the period by the weighted average number of common shares outstanding during the period. Diluted earnings per share is computed by dividing the net income for the period by the weighted average number of common and common equivalent shares outstanding during the period. Common equivalent shares are composed of incremental common shares issuable upon the exercise of stock options and restricted share units subject to vesting. The dilutive effect of common equivalent shares is included in diluted earnings per share by application of the treasury stock method. Common equivalent shares that have an anti-dilutive effect on diluted net income per share have been excluded from the calculation of diluted weighted average shares outstanding for the years ended December 31, 2015, 2014, and 2013.
Concentrations of Credit Risk and Significant Customers
The Company’s credit risks relate primarily to cash and cash equivalents, marketable securities and accounts receivable. The Company places its temporary excess cash investments in high quality, short-term money market instruments. At times, such investments may be in excess of the FDIC insurance limits. Marketable securities consists primarily of investment grade corporate debt securities and certificates of deposit.
The Company sells its products and services to various companies in the healthcare industry that are located in the United States. We perform ongoing credit evaluations of our customers’ financial condition and generally require no collateral from customers. An allowance for doubtful accounts is maintained for potentially uncollectible accounts receivable. The Company did not have any single customer representing over 10% of net revenues during 2015, 2014, or 2013.
Stock Based Compensation
As of December 31, 2015, the Company maintains two stock based compensation plans, which are described in Note 11. The Company accounts for stock based compensation using the fair-value based method for costs related to share-based payments, including stock options and restricted share units. The Company uses the Black Scholes option pricing model for calculating the fair value of option awards issued under its stock based compensation plan. The Company measures compensation cost of restricted share units based on the closing fair market value of the Company’s stock on the date of grant. Stock based compensation cost is measured at the grant date, based on the fair value of the award that is ultimately expected to vest, and is recognized as an expense over the requisite service period. The Company recognizes tax benefits from stock based compensation if an excess tax benefit is realized. Excess tax benefits are recorded as an increase to common stock when realized.
45
Table of Contents
HEALTHSTREAM, INC.
NOTES TO CONSOLIDATED FINANCIAL STATEMENTS (Continued)
1. SUMMARY OF SIGNIFICANT ACCOUNTING POLICIES (continued)
Newly Issued Accounting Standards
In May 2014, the Financial Accounting Standards Board (“FASB”) issued Accounting Standards Update (“ASU”) 2014-09, Revenue from Contracts with Customers (Topic 606), which supersedes the revenue recognition requirements in Topic 605, Revenue Recognition, and most industry-specific revenue recognition guidance throughout the Industry Topics of the Accounting Standards Codification. The updated guidance states that an entity should recognize revenue to depict the transfer of promised goods or services to customers in an amount that reflects the consideration to which the entity expects to be entitled in exchange for those goods or services. The guidance also provides for additional disclosures with respect to revenues and cash flows arising from contracts with customers. The standard will be effective for the first interim period within annual reporting periods beginning after December 15, 2017, and early adoption is permitted for the first interim period within annual reporting periods beginning after December 15, 2016. The Company is currently reviewing this standard to determine the method of adoption and to assess the impact on its future consolidated financial statements.
2. SHAREHOLDERS’ EQUITY
Common Stock
The Company is authorized to issue up to 75 million shares of common stock. The number of common shares issued and outstanding as of December 31, 2015 and 2014 was approximately 31.6 million and 27.7 million, respectively. The Company issued approximately 3.9 million shares of common stock in connection with an underwritten public offering, which was completed in May 2015, raising approximately $98.0 million of cash.
Preferred Stock
The Company is authorized to issue up to 10 million shares of preferred stock in one or more series, having the relative voting powers, designations, preferences, rights and qualifications, limitations or restrictions, and other terms as the Board of Directors may fix in providing for the issuance of such series, without any vote or action of the shareholders.
3. EARNINGS PER SHARE
The following table sets forth the computation of basic and diluted earnings per share for the three years ended December 31, 2015 (in thousands, except per share amounts):
| 2015 | 2014 | 2013 | ||||||||||
| Numerator: |
||||||||||||
| Net income |
$ | 8,621 | $ | 10,394 | $ | 8,418 | ||||||
|
|
|
|
|
|
|
|||||||
| Denominator: |
||||||||||||
| Weighted-average shares outstanding |
30,057 | 27,570 | 26,853 | |||||||||
| Effect of dilutive shares |
379 | 453 | 810 | |||||||||
|
|
|
|
|
|
|
|||||||
| Weighted-average diluted shares |
30,436 | 28,023 | 27,663 | |||||||||
|
|
|
|
|
|
|
|||||||
| Basic earnings per share |
$ | 0.29 | $ | 0.38 | $ | 0.31 | ||||||
|
|
|
|
|
|
|
|||||||
| Diluted earnings per share |
$ | 0.28 | $ | 0.37 | $ | 0.30 | ||||||
|
|
|
|
|
|
|
|||||||
Potentially dilutive shares representing approximately 16,000, 70,000, and 70,000 shares of common stock for 2015, 2014, and 2013, respectively, were excluded from the calculation of diluted earnings per share because their effect would have been anti-dilutive.
46
Table of Contents
HEALTHSTREAM, INC.
NOTES TO CONSOLIDATED FINANCIAL STATEMENTS (Continued)
4. MARKETABLE SECURITIES
At December 31, 2015 and 2014, the fair value of marketable securities, which were all classified as available for sale, included the following (in thousands):
| December 31, 2015 | ||||||||||||||||
| Adjusted Cost | Unrealized Gains |
Unrealized Losses |
Fair Value | |||||||||||||
| Level 2: |
||||||||||||||||
| Certificates of deposit |
$ | 1,000 | $ | — | $ | — | $ | 1,000 | ||||||||
| Corporate debt securities |
66,046 | — | (70 | ) | 65,976 | |||||||||||
|
|
|
|
|
|
|
|
|
|||||||||
| Total |
$ | 67,046 | $ | — | $ | (70 | ) | $ | 66,976 | |||||||
|
|
|
|
|
|
|
|
|
|||||||||
| December 31, 2014 | ||||||||||||||||
| Adjusted Cost | Unrealized Gains |
Unrealized Losses |
Fair Value | |||||||||||||
| Level 2: |
||||||||||||||||
| Certificates of deposit |
$ | 6,278 | $ | — | $ | — | $ | 6,278 | ||||||||
| Corporate debt securities |
32,732 | — | (37 | ) | 32,695 | |||||||||||
|
|
|
|
|
|
|
|
|
|||||||||
| Total |
$ | 39,010 | $ | — | $ | (37 | ) | $ | 38,973 | |||||||
|
|
|
|
|
|
|
|
|
|||||||||
The carrying amounts of the marketable securities reported in the consolidated balance sheets approximate fair value based on quoted market prices or alternative pricing sources and models utilizing market observable inputs. As of December 31, 2015, the Company does not consider any of its marketable securities to be other than temporarily impaired. During the years ended December 31, 2015 and 2014, the Company did not reclassify any items out of accumulated other comprehensive income to net income. All investments in marketable securities are classified as a current asset on the balance sheet because the underlying securities mature within one year from the balance sheet date.
5. BUSINESS COMBINATIONS
HealthLine Systems
On March 16, 2015, the Company acquired all of the membership interests of HealthLine Systems, LLC (HLS), a San Diego, California based company that specializes in credentialing, privileging, call center, and quality management solutions for the healthcare industry. The acquisition of HLS enables the Company to provide a comprehensive solution set for healthcare provider credentialing, privileging, enrollment, referral, onboarding, and analytics in support of HealthStream’s approach to talent management for healthcare organizations. The consideration paid for HLS consisted of approximately $88.1 million in cash (taking into account an estimated closing working capital adjustment). The Company incurred approximately $1.3 million in transaction costs associated with the acquisition, of which $965,000 were incurred during the year ended December 31, 2015 and $329,000 were incurred during the year ended December 31, 2014. The transaction costs were recorded under the caption “other general and administrative” in the consolidated statements of income. The results of operations for HLS have been included in the Company’s consolidated financial statements from the date of acquisition, and are also included in the HealthStream Provider Solutions segment.
A summary of the purchase price is as follows (in thousands):
| Cash paid at closing |
$ | 81,379 | ||
| Cash held in escrow |
6,750 | |||
|
|
|
|||
| Total consideration paid |
$ | 88,129 | ||
|
|
|
47
Table of Contents
HEALTHSTREAM, INC.
NOTES TO CONSOLIDATED FINANCIAL STATEMENTS (Continued)
5. BUSINESS COMBINATIONS (continued)
The following table summarizes the preliminary fair value of the assets acquired and liabilities assumed as of the date of acquisition (in thousands):
| Cash |
$ | 54 | ||
| Accounts receivable, net |
3,052 | |||
| Prepaid assets |
546 | |||
| Property and equipment |
200 | |||
| Deferred tax assets |
2,523 | |||
| Goodwill |
41,618 | |||
| Intangible assets |
47,200 | |||
| Accounts payable and accrued liabilities |
(1,085 | ) | ||
| Deferred revenue |
(5,979 | ) | ||
|
|
|
|||
| Preliminary net assets acquired |
$ | 88,129 | ||
|
|
|
The excess of preliminary purchase price over the preliminary fair values of net tangible and intangible assets is recorded as goodwill. The preliminary fair values of tangible and identifiable intangible assets, deferred tax assets, deferred revenue, and other liabilities are based on management’s estimates and assumptions. The preliminary fair values of assets acquired and liabilities assumed are considered preliminary and are based on the information that was available at the time of the acquisition. The preliminary fair values of assets acquired and liabilities assumed are subject to change during the measurement period (up to one year from the acquisition date) as we finalize the valuation of tax liabilities and determine final working capital adjustments. Included in the preliminary assets and liabilities is an estimated indemnification asset of $300,000 and a contingent liability of $700,000, both of which are associated with tax liabilities. The contingent liability is measured based on management’s estimate of a range of probable outcomes. During the fourth quarter of 2015, the Company reduced the preliminary fair value for accounts receivable by $115,000, prepaid assets by $200,000, and accrued liabilities by $800,000. The goodwill balance is primarily attributed to the assembled workforce, additional market opportunities from offering HLS’s products, and expected synergies from integrating HLS with other products or other combined functional areas within the Company. The goodwill balance is deductible for U.S. income tax purposes. The net tangible assets include deferred revenue, which was adjusted down from a book value at the acquisition date of $15.0 million to an estimated fair value of $6.0 million. The $9.0 million write-down of deferred revenue will result in lower revenues than would have otherwise been recognized for such services.
The following table sets forth the components of identifiable intangible assets and their estimated useful lives as of the acquisition date (in thousands):
| Preliminary fair Value |
Useful life | |||||||
| Customer relationships |
$ | 42,600 | 13 years | |||||
| Developed technology |
3,700 | 5 years | ||||||
| Trade names |
900 | 6 years | ||||||
|
|
|
|||||||
| Total preliminary intangible assets subject to amortization |
$ | 47,200 | ||||||
|
|
|
|||||||
The weighted average amortization period for the identifiable intangible assets acquired is 12.2 years.
The amounts of revenue and operating income (loss) of HLS included in the Company’s consolidated statements of income from the date of acquisition of March 16, 2015 to the period ending December 31, 2015 are as follows (in thousands):
| Total revenues |
$ | 8,543 | ||
|
|
|
|||
| Operating loss |
$ | (2,541 | ) | |
|
|
|
48
Table of Contents
HEALTHSTREAM, INC.
NOTES TO CONSOLIDATED FINANCIAL STATEMENTS (Continued)
5. BUSINESS COMBINATIONS (continued)
The following unaudited pro forma financial information summarizes the combined results of operations of the Company and HLS, which was significant for purposes of the unaudited pro forma financial information disclosure, as though the companies were combined as of January 1, 2014 (in thousands, except per share data):
| Year Ended December 31, |
||||||||
| 2015 | 2014 | |||||||
| Total revenues |
$ | 219,108 | $ | 182,548 | ||||
|
|
|
|
|
|||||
| Net income |
$ | 13,551 | $ | 8,658 | ||||
|
|
|
|
|
|||||
| Basic earnings per share |
$ | 0.45 | $ | 0.31 | ||||
|
|
|
|
|
|||||
| Diluted earnings per share |
$ | 0.44 | $ | 0.31 | ||||
|
|
|
|
|
|||||
These unaudited pro forma combined results of operations include certain adjustments arising from the acquisition such as adjustment for amortization of intangible assets, depreciation of property and equipment, fair value adjustments of acquired deferred revenue balances, and interest expense associated with borrowings under a revolving credit facility by the Company to partially fund the acquisition. The pro forma combined results for the year ended December 31, 2014 include nonrecurring adjustments of $4.2 million, which reduce net income due to the revaluation of HLS’s historic deferred revenue to fair value. The unaudited pro forma combined results of operations is for informational purposes only and is not indicative of what the Company’s results of operations would have been had such transactions occurred at the beginning of the period presented or to project the Company’s results of operations in any future period.
The unaudited pro forma financial information for the years ended December 31, 2015 and 2014 combines the historical results of the Company and HLS for the years ended December 31, 2015 and 2014 and the pro forma adjustments listed above.
Health Care Compliance Strategies
On March 3, 2014, the Company acquired all of the stock of Health Care Compliance Strategies, Inc. (HCCS), a Jericho, New York based company that specializes in healthcare compliance solutions and services. The Company acquired HCCS to further advance its suite of workforce development solutions, including its offering of compliance solutions. The consideration paid for HCCS consisted of approximately $12.8 million in cash (taking into account a post-closing working capital adjustment) and 81,614 shares of our common stock. The Company made an additional payment of $750,000 during the second quarter of 2015, upon the achievement of certain performance milestones within one year post-closing. The Company incurred approximately $515,000 in transaction costs associated with the acquisition, of which $365,000 were incurred during the year ended December 31, 2014 and $150,000 were incurred during the year ended December 31, 2013. The transaction costs were recorded under the caption “other general and administrative” in the consolidated statements of income. In allocating the purchase price, the Company recorded approximately $6.2 million of goodwill, $8.4 million of identifiable intangible assets, $2.6 million of tangible assets, $625,000 of deferred tax assets, and $2.7 million of liabilities. Included in the recorded liabilities was an accrual for contingent consideration of approximately $600,000. The goodwill balance is primarily attributed to assembled workforce, additional market opportunities of HCCS’s compliance solutions, and expected synergies from integrating HCCS’s products into our platform. The goodwill balance is deductible for U.S. income tax purposes. The net tangible assets include deferred revenue, which was adjusted down from a book value at the acquisition date of $3.2 million to an estimated fair value of $1.7 million. The $1.5 million write-down of deferred revenue resulted in lower revenues than would have otherwise been recognized for such services. The results of operations for HCCS have been included in the Company’s consolidated financial statements from the date of acquisition, and are also included in the HealthStream Workforce Development Solutions segment.
49
Table of Contents
HEALTHSTREAM, INC.
NOTES TO CONSOLIDATED FINANCIAL STATEMENTS (Continued)
5. BUSINESS COMBINATIONS (continued)
Baptist Leadership Group
On September 9, 2013, the Company acquired substantially all of the assets of Baptist Leadership Group (BLG), a Pensacola, Florida based company that provides consulting services focused on patient-centered performance excellence in healthcare. The Company acquired BLG to strengthen its Patient Experience Solutions. The consideration paid for BLG consisted of approximately $7.4 million in cash (taking into account the working capital adjustment) and 15,230 shares of our common stock. The Company incurred approximately $145,000 in transaction costs associated with the acquisition, which are included on the accompanying consolidated statements of income under the caption “other general and administrative.” In allocating the purchase price, the Company recorded approximately $6.3 million of goodwill, $1.6 million of identifiable intangible assets, and $28,000 of net tangible assets. The goodwill balance is primarily attributed to the assembled workforce, additional market opportunities from BLG’s consulting services, and expected synergies from integrating BLG into the operations of the HealthStream Patient Experience Solutions segment. The goodwill balance is deductible for U.S. income tax purposes. The net tangible assets include deferred revenue, which was adjusted down from a book value of $508,000 to an estimated fair value of $254,000. The $254,000 write-down of deferred revenue resulted in lower revenues than would have otherwise been recognized for such services. The results of operations for BLG have been included in the Company’s consolidated financial statements from the date of acquisition, and are included in the HealthStream Patient Experience Solutions segment.
6. PROPERTY AND EQUIPMENT
Property and equipment consist of the following:
| December 31, | ||||||||
| 2015 | 2014 | |||||||
| Equipment |
$ | 23,057 | $ | 25,133 | ||||
| Leasehold improvements |
4,435 | 5,860 | ||||||
| Furniture and fixtures |
4,338 | 4,554 | ||||||
|
|
|
|
|
|||||
| Gross property and equipment |
31,830 | 35,547 | ||||||
| Accumulated depreciation and amortization |
(19,359 | ) | (26,105 | ) | ||||
|
|
|
|
|
|||||
| Property and equipment, net |
$ | 12,471 | $ | 9,442 | ||||
|
|
|
|
|
|||||
Depreciation of property and equipment totaled approximately $5.3 million and $4.1 million for the years ended December 31, 2015 and 2014, respectively.
7. GOODWILL
The changes in the carrying amount of goodwill for the years ended December 31, 2015 and 2014 are as follows (in thousands):
| Workforce | Patient Experience |
Provider | Total | |||||||||||||
| Balance at January 1, 2015 |
$ | 12,336 | $ | 24,154 | $ | 5,424 | $ | 41,914 | ||||||||
| Acquisition of HealthLine Systems, LLC |
— | — | 41,618 | 41,618 | ||||||||||||
| Disposal of long lived assets |
— | — | (459 | ) | (459 | ) | ||||||||||
|
|
|
|
|
|
|
|
|
|||||||||
| Balance at December 31, 2015 |
$ | 12,336 | $ | 24,154 | $ | 46,583 | $ | 83,073 | ||||||||
|
|
|
|
|
|
|
|
|
|||||||||
| Workforce | Patient Experience |
Provider | Total | |||||||||||||
| Balance at January 1, 2014 |
$ | 6,168 | $ | 24,154 | $ | 5,424 | $ | 35,746 | ||||||||
| Acquisition of Health Care Compliance Strategies, Inc. |
6,168 | — | — | 6,168 | ||||||||||||
|
|
|
|
|
|
|
|
|
|||||||||
| Balance at December 31, 2014 |
$ | 12,336 | $ | 24,154 | $ | 5,424 | $ | 41,914 | ||||||||
|
|
|
|
|
|
|
|
|
|||||||||
During the quarter ended December 31, 2015, the Company disposed of certain long lived assets meeting the definition of a business. Accordingly, we have allocated approximately $459,000 of reporting unit goodwill to this disposition of assets pursuant to ASC 350, Intangibles – Goodwill and other.
50
Table of Contents
HEALTHSTREAM, INC.
NOTES TO CONSOLIDATED FINANCIAL STATEMENTS (Continued)
8. INTANGIBLE ASSETS
Intangible assets other than goodwill are considered to have finite useful lives. Customer related intangibles are amortized over their estimated useful lives ranging from five to thirteen years. Other intangible assets include non-competition agreements, technology and patents, and trade names, and are being amortized over periods ranging from three to nine years. During the quarter ended December 31, 2015, the Company retired approximately $10.7 million of fully amortized identifiable intangible assets. Gross amounts and related accumulated amortization presented below as of December 31, 2015 are reflective of such retirements. Such amounts are also inclusive of identifiable intangible assets recorded in relation to our acquisition of HealthLine Systems, LLC (see Note 5 – Business Combinations). Amortization of intangible assets was approximately $5.6 million and $2.4 million for the years ended December 31, 2015 and 2014, respectively.
Identifiable intangible assets are comprised of the following (in thousands):
| As of December 31, 2015 | As of December 31, 2014 | |||||||||||||||||||||||
| Gross Amount | Accumulated Amortization |
Net | Gross Amount | Accumulated Amortization |
Net | |||||||||||||||||||
| Customer related |
$ | 55,571 | $ | (6,068 | ) | $ | 49,503 | $ | 23,329 | $ | (11,880 | ) | $ | 11,449 | ||||||||||
| Other |
9,080 | (2,617 | ) | 6,463 | 5,300 | (1,954 | ) | 3,346 | ||||||||||||||||
|
|
|
|
|
|
|
|
|
|
|
|
|
|||||||||||||
| Total |
$ | 64,651 | $ | (8,685 | ) | $ | 55,966 | $ | 28,629 | $ | (13,834 | ) | $ | 14,795 | ||||||||||
|
|
|
|
|
|
|
|
|
|
|
|
|
|||||||||||||
The expected future annual amortization expense for the years ending December 31, is as follows (in thousands):
| 2016 |
$ | 6,400 | ||
| 2017 |
6,323 | |||
| 2018 |
6,211 | |||
| 2019 |
5,566 | |||
| 2020 |
4,913 | |||
| Thereafter |
26,553 | |||
|
|
|
|||
| Total |
$ | 55,966 | ||
|
|
|
9. BUSINESS SEGMENTS
The Company provides services to healthcare organizations and other members within the healthcare industry. The Company’s services are focused on the delivery of workforce development products and services (HealthStream Workforce Solutions), survey and research services (HealthStream Patient Experience Solutions), and provider credentialing, privileging, call center and enrollment products and services (HealthStream Provider Solutions).
The Company measures segment performance based on operating income before income taxes and prior to the allocation of certain corporate overhead expenses, interest income, interest expense, gains and losses from equity investments, and depreciation. The Unallocated component below includes corporate functions, such as accounting, human resources, legal, investor relations, administrative and executive personnel, depreciation, a portion of amortization, and certain other expenses, which are not currently allocated in measuring segment performance. The following is the Company’s business segment information as of and for the years ended December 31, 2015, 2014 and 2013 (in thousands).
51
Table of Contents
HEALTHSTREAM, INC.
NOTES TO CONSOLIDATED FINANCIAL STATEMENTS (Continued)
9. BUSINESS SEGMENTS (continued)
| Revenues, net: | 2015 | 2014 | 2013 | |||||||||
| Workforce |
$ | 161,289 | $ | 134,242 | $ | 99,963 | ||||||
| Patient Experience |
34,193 | 31,901 | 28,454 | |||||||||
| Provider |
13,520 | 4,547 | 3,857 | |||||||||
|
|
|
|
|
|
|
|||||||
| Total revenues, net |
$ | 209,002 | $ | 170,690 | $ | 132,274 | ||||||
|
|
|
|
|
|
|
|||||||
| Operating income: | 2015 | 2014 | 2013 | |||||||||
| Workforce |
$ | 39,986 | $ | 35,374 | $ | 28,203 | ||||||
| Patient Experience |
1,548 | 810 | 2,819 | |||||||||
| Provider |
(2,559 | ) | 826 | 277 | ||||||||
| Unallocated |
(25,418 | ) | (20,635 | ) | (16,633 | ) | ||||||
|
|
|
|
|
|
|
|||||||
| Total operating income |
$ | 13,557 | $ | 16,375 | $ | 14,666 | ||||||
|
|
|
|
|
|
|
|||||||
| Assets * | Purchases of long-lived assets | Depreciation and amortization | ||||||||||||||||||||||||||||||||||
| 2015 | 2014 | 2013 | 2015 | 2014 | 2013 | 2015 | 2014 | 2013 | ||||||||||||||||||||||||||||
| Workforce |
$ | 82,375 | $ | 81,116 | $ | 48,514 | $ | 11,403 | $ | 7,179 | $ | 6,243 | $ | 6,693 | $ | 4,813 | $ | 2,829 | ||||||||||||||||||
| Patient Experience |
34,902 | 34,536 | 34,727 | 2,007 | 1,277 | 726 | 1,061 | 1,272 | 1,068 | |||||||||||||||||||||||||||
| Provider |
100,948 | 10,976 | 11,499 | 332 | 200 | 67 | 3,986 | 683 | 683 | |||||||||||||||||||||||||||
| Unallocated |
161,344 | 130,634 | 117,854 | 1,617 | 1,546 | 1,675 | 5,257 | 4,163 | 3,272 | |||||||||||||||||||||||||||
|
|
|
|
|
|
|
|
|
|
|
|
|
|
|
|
|
|
|
|||||||||||||||||||
| Total |
$ | 379,569 | $ | 257,262 | $ | 212,594 | $ | 15,359 | $ | 10,202 | $ | 8,711 | $ | 16,997 | $ | 10,931 | $ | 7,852 | ||||||||||||||||||
|
|
|
|
|
|
|
|
|
|
|
|
|
|
|
|
|
|
|
|||||||||||||||||||
| * | Segment assets include accounts and unbilled receivables, prepaid royalties, prepaid and other current assets, other assets, capitalized software development, certain property and equipment, and intangible assets. Cash and cash equivalents and marketable securities are not allocated to individual segments, and are included within Unallocated. A significant portion of property and equipment assets are included within Unallocated. |
10. INCOME TAXES
The provision (benefit) for income taxes is comprised of the following (in thousands):
| Year Ended December 31, | ||||||||||||
| 2015 | 2014 | 2013 | ||||||||||
| Current federal |
$ | 3,608 | $ | 3,198 | $ | 2,474 | ||||||
| Current state |
1,098 | 1,605 | 1,444 | |||||||||
| Deferred federal |
501 | 1,092 | 2,315 | |||||||||
| Deferred state |
(109 | ) | 232 | 191 | ||||||||
|
|
|
|
|
|
|
|||||||
| Provision for income taxes |
$ | 5,098 | $ | 6,127 | $ | 6,424 | ||||||
|
|
|
|
|
|
|
|||||||
A reconciliation of income taxes at the statutory federal income tax rate to the provision for income taxes included in the accompanying consolidated statements of income is as follows (in thousands):
| Year Ended December 31, | ||||||||||||
| 2015 | 2014 | 2013 | ||||||||||
| Federal tax provision at the statutory rate |
$ | 4,802 | $ | 5,782 | $ | 5,194 | ||||||
| State income tax provision, net of federal benefit |
673 | 1,350 | 898 | |||||||||
| Tax credits |
(425 | ) | (1,160 | ) | (54 | ) | ||||||
| Change in state valuation allowance |
(8 | ) | 37 | 231 | ||||||||
| Other |
56 | 118 | 155 | |||||||||
|
|
|
|
|
|
|
|||||||
| Provision for income taxes |
$ | 5,098 | $ | 6,127 | $ | 6,424 | ||||||
|
|
|
|
|
|
|
|||||||
Management periodically evaluates the realizability of its deferred tax assets, and to the extent that a recovery is not likely, a valuation allowance is established to reduce the deferred tax asset to the amount estimated to be recoverable. At December 31, 2015, a valuation allowance of $346,000 exists. The Company adjusts deferred tax liabilities and assets in the period of enactment for the effect of an enacted change in tax laws or rates. Accordingly, the state income tax provision for the period ended December 31, 2015 is inclusive of a deferred tax benefit of $188,000 related to a change in state tax law that will be effective for the Company’s tax year beginning on or after January 1, 2017.
52
Table of Contents
HEALTHSTREAM, INC.
NOTES TO CONSOLIDATED FINANCIAL STATEMENTS (Continued)
10. INCOME TAXES (continued)
As of December 31, 2015, the Company had state net operating loss carryforwards of $13.0 million. These loss carryforwards will expire in years 2016 through 2025. The Company is subject to income taxation at the federal and various state levels. The Company is subject to U.S. federal tax examinations for tax years 2012 through 2015. Loss carryforwards and credit carryforwards generated or utilized in years earlier than 2012 are also subject to examination and adjustment. The Company has examinations in process with the Internal Revenue Service for tax years 2013 and 2014. The Company has research and development tax credit carryforwards of $1.9 million that expire in varying amounts through 2035. As of December 31, 2015, the Company had alternative minimum tax credit carryforwards of $816,000 that are available to offset future regular tax liabilities and they do not expire.
A reconciliation of the beginning and ending liability for gross unrecognized tax benefits at December 31, 2015 and 2014, are as follows (in thousands):
| December 31, | ||||||||
| 2015 | 2014 | |||||||
| Balance at beginning of year |
$ | 2,168 | $ | 167 | ||||
| Additions for tax positions in the current year |
351 | 2,168 | ||||||
| Reductions for tax positions of prior years |
(1,861 | ) | (167 | ) | ||||
|
|
|
|
|
|||||
| Balance at end of year |
$ | 658 | $ | 2,168 | ||||
|
|
|
|
|
|||||
The Company recognized approximately $14,000 and $125,000 for interest and penalties related to unrecognized tax benefits within the provision for income taxes during the years ended December 31, 2015 and 2014, respectively. Unrecognized tax benefits included tax positions of approximately $278,000 at both December 31, 2015 and 2014 that if recognized would impact the Company’s effective tax rate. The reduction for tax positions of prior years reflected in the table above as of December 31, 2015 relates to a change in tax accounting method filed with the IRS for tangible property and deferred revenue. The Company estimates that it is reasonably possible the liability for unrecognized tax benefits could decrease up to $0.3 million within the next 12 months.
Deferred federal and state income taxes reflect the net tax effects of temporary differences between the carrying amounts of assets and liabilities for financial reporting purposes and the amounts used for income tax purposes. Significant components of deferred tax assets and deferred tax liabilities are as follows (in thousands):
| December 31, | ||||||||
| 2015 | 2014 | |||||||
| Deferred tax assets: |
||||||||
| Allowance for doubtful accounts |
$ | 122 | $ | 134 | ||||
| Accrued liabilities |
2,062 | 1,565 | ||||||
| Tax credits |
816 | 791 | ||||||
| Stock based compensation |
1,107 | 1,015 | ||||||
| Deferred revenue |
1,563 | 616 | ||||||
| Depreciation |
348 | 715 | ||||||
| Basis difference on investments |
80 | — | ||||||
| Net operating loss carryforwards |
407 | 355 | ||||||
|
|
|
|
|
|||||
| Total deferred tax assets |
6,505 | 5,191 | ||||||
| Less: Valuation allowance |
(346 | ) | (355 | ) | ||||
|
|
|
|
|
|||||
| Deferred tax assets, net of valuation allowance |
6,159 | 4,836 | ||||||
| Deferred tax liabilities: |
||||||||
| Deductible goodwill |
2,646 | 2,369 | ||||||
| Nondeductible intangible assets |
1,806 | 2,171 | ||||||
| Prepaid assets |
1,911 | 1,602 | ||||||
| Capitalized software development |
4,559 | 3,836 | ||||||
| Basis difference on investments |
— | 343 | ||||||
|
|
|
|
|
|||||
| Total deferred tax liabilities |
10,922 | 10,321 | ||||||
|
|
|
|
|
|||||
| Net deferred tax liabilities |
$ | (4,763 | ) | $ | (5,485 | ) | ||
|
|
|
|
|
|||||
53
Table of Contents
HEALTHSTREAM, INC.
NOTES TO CONSOLIDATED FINANCIAL STATEMENTS (Continued)
11. STOCK BASED COMPENSATION
Stock Incentive Plans
The Company’s 2010 Stock Incentive Plan (2010 Plan) and 2000 Stock Incentive Plan (2000 Plan; collectively, the 2010 Plan and the 2000 Plan referred to as the Plan) authorize the grant of options, restricted share units (RSU), or other forms of stock based compensation to employees, officers, directors and others, and such grants must be approved by the Compensation Committee of the Board of Directors. Options granted under the Plan have terms of no more than ten years, with certain restrictions. The Plan allows the Compensation Committee of the Board of Directors to determine the vesting period and parameters of each grant. The vesting period of the options and RSUs granted has historically ranged from immediate vesting to annual vesting up to four years, generally beginning one year after the grant date. As of December 31, 2015, approximately 487,000 shares of unissued common stock remained reserved for future stock incentive grants under the Plan. The Company issues new shares of common stock when options are exercised or when RSUs become vested.
Stock Option Activity
A summary of activity and various other information relative to stock options for the year ended December 31, 2015 is presented in the tables below (in thousands, except exercise price).
| Common Shares |
Weighted- Average Exercise Price |
Aggregate Intrinsic Value |
||||||||||
| Outstanding at beginning of period |
596 | $ | 6.18 | |||||||||
| Granted |
— | — | ||||||||||
| Exercised |
(76 | ) | 4.29 | |||||||||
| Expired |
— | — | ||||||||||
| Forfeited |
— | — | ||||||||||
|
|
|
|
|
|||||||||
| Outstanding at end of period |
520 | $ | 6.45 | $ | 8,081 | |||||||
|
|
|
|
|
|
|
|||||||
| Exercisable at end of period. |
520 | $ | 6.45 | $ | 8,081 | |||||||
|
|
|
|
|
|
|
|||||||
The aggregate intrinsic value for stock options in the table above represents the total difference between the Company’s closing stock price on December 31, 2015 (the last trading day of the year) of $22.00 per share and the option exercise price, multiplied by the number of in-the-money options as of December 31, 2015. The weighted average remaining contractual term of options outstanding at December 31, 2015 was 2.5 years. Options exercisable at December 31, 2015 have a weighted average remaining contractual term of 2.5 years.
Other information relative to option activity during the three years ended December 31, 2015 is as follows (in thousands):
| 2015 | 2014 | 2013 | ||||||||||
| Total grant date fair value of stock options vested |
$ | 232 | $ | 630 | $ | 723 | ||||||
|
|
|
|
|
|
|
|||||||
| Total intrinsic value of stock options exercised |
$ | 1,662 | $ | 5,912 | $ | 25,846 | ||||||
|
|
|
|
|
|
|
|||||||
| Cash proceeds from exercise of stock options |
$ | 328 | $ | 1,094 | $ | 3,318 | ||||||
|
|
|
|
|
|
|
|||||||
Restricted Share Unit Activity
A summary of activity relative to RSUs for the year ended December 31, 2015 is follows (in thousands, except weighted average grant date fair value):
| Number of RSU’s |
Weighted- Average Grant Date Fair Value |
Aggregate Intrinsic Value |
||||||||||
| Outstanding at beginning of period |
164 | $ | 25.04 | |||||||||
| Granted |
110 | 24.97 | ||||||||||
| Vested |
(54 | ) | 24.17 | |||||||||
| Forfeited |
(2 | ) | 26.03 | |||||||||
|
|
|
|
|
|||||||||
| Outstanding at end of period |
218 | $ | 25.21 | $ | 4,793 | |||||||
|
|
|
|
|
|
|
|||||||
54
Table of Contents
HEALTHSTREAM, INC.
NOTES TO CONSOLIDATED FINANCIAL STATEMENTS (Continued)
11. STOCK BASED COMPENSATION (continued)
The aggregate fair value of RSU awards that vested in 2015 and 2014, as of the respective vesting dates, was approximately $1.4 million and $1.1 million, respectively. A portion of RSUs that vested in 2015 and 2014 were net-share settled such that the Company withheld shares with value equivalent to the employees’ minimum statutory obligation for the applicable income and other employment taxes, and remitted the cash to the appropriate taxing authorities. The total shares withheld for RSUs during 2015 and 2014 were 8,922 and 5,327, respectively, and were based on the value of the RSUs on their respective settlement dates as determined by the Company’s closing stock price. Total payments related to RSUs for the employees’ tax obligations to taxing authorities were approximately $230,000 in 2015 and $161,000 in 2014, and are reflected as a financing activity within the consolidated statements of cash flows. These net-share settlements had the effect of share repurchases by the Company as they reduced and retired the number of shares that would have otherwise been issued as a result of the vesting and did not represent an expense to the Company.
Stock Based Compensation
Total stock based compensation expense, which is recorded in our consolidated statements of income, recorded for the years ended December 31, is as follows (in thousands):
| Years Ended December 31, | ||||||||||||
| 2015 | 2014 | 2013 | ||||||||||
| Cost of revenues (excluding depreciation and amortization) |
$ | 824 | $ | 86 | $ | 81 | ||||||
| Product development |
569 | 201 | 144 | |||||||||
| Sales and marketing |
547 | 224 | 175 | |||||||||
| Other general and administrative |
1,340 | 1,114 | 1,058 | |||||||||
|
|
|
|
|
|
|
|||||||
| Total stock based compensation expense |
$ | 3,280 | $ | 1,625 | $ | 1,458 | ||||||
|
|
|
|
|
|
|
|||||||
The Company amortizes the fair value of all stock based awards, net of estimated forfeitures, on a straight-line basis over the requisite service period, which generally is the vesting period. As of December 31, 2015, total unrecognized compensation expense related to non-vested stock options and RSUs was approximately $3.0 million, net of estimated forfeitures, with a weighted average expense recognition period remaining of 2.3 years. The Company realized approximately $3.0 million of excess tax benefits related to stock based awards during the year ended December 31, 2015, which was recorded as an increase to common stock.
Stock based compensation cost for RSUs is measured based on the closing fair market value of the Company’s stock on the date of grant. Stock based compensation cost for stock options is estimated at the grant date based on the fair value calculated using the Black-Scholes method. The Company did not grant any stock options during 2015, 2014, or 2013.
Stock Awards
During June 2015, the Company’s CEO, Robert A. Frist, Jr., entered into an agreement with the Company pursuant to which he contributed 54,241 of his personally owned shares of HealthStream, Inc. common stock to the Company, without any consideration paid to him. In connection with this contribution, the Company approved the grant of 49,310 shares of HealthStream, Inc. common stock to over 600 employees who were not otherwise eligible to receive equity awards and had at least one year of service with the Company. The Company recognized approximately $1.5 million of stock based compensation expense for these stock awards during the three months ended June 30, 2015 based on the closing fair market value of the Company’s stock on the date of the Company’s approval of these grants. In connection with these equity awards, effective in the second quarter of 2015, the Company withheld shares with value equivalent to the employees’ minimum statutory obligation for the applicable income and other employment taxes, and remitted the cash to the appropriate taxing authorities. The total shares withheld were 17,279, and were based on the value of the stock awards on the date of the Company’s approval of these grants, as determined by the Company’s closing stock price on that date. Total payments related to the employees’ tax obligations to taxing authorities for these stock awards were approximately $526,000 and are reflected as a financing activity within the consolidated statements of cash flows for the year ended December 31, 2015. These share withholdings had the effect of share repurchases by the Company as they reduced and retired the number of shares otherwise issuable as a result of the stock awards and did not represent an expense to the Company.
55
Table of Contents
HEALTHSTREAM, INC.
NOTES TO CONSOLIDATED FINANCIAL STATEMENTS (Continued)
12. EMPLOYEE BENEFIT PLAN
401(k) Plan
The Company has a defined-contribution employee benefit plan (401(k) Plan) incorporating provisions of Section 401(k) of the Internal Revenue Code. Employees must have attained the age of 21 and have completed thirty days of service to be eligible to participate in the 401(k) Plan. Under the provisions of the 401(k) Plan, a plan member may make contributions, on a tax-deferred basis, subject to IRS limitations. The Company elected to provide eligible employees with matching contributions totaling approximately $645,000 and $274,000 for the years ended December 31, 2015 and 2014, respectively.
13. DEBT
At December 31, 2015 and 2014, the Company had no debt outstanding.
Revolving Credit Facility
The Company maintains a Loan Agreement (the “Revolving Credit Facility”) with SunTrust Bank (“SunTrust”) in the aggregate principal amount of $50.0 million, which matures on November 24, 2017. Under the Revolving Credit Facility, the Company may borrow up to $50.0 million, which includes a $5.0 million swing line subfacility, as well as an accordion feature that allows the Company to increase the Revolving Credit Facility by a total of up to $25.0 million, subject to securing additional commitments from existing lenders or new lending institutions. The Revolving Credit Facility includes a $5.0 million letter of credit subfacility. The obligations under the Revolving Credit Facility are guaranteed by each of the Company’s subsidiaries. At the Company’s election, the borrowings under the Revolving Credit Facility bear interest at either (1) a rate per annum equal to the highest of SunTrust’s prime rate or 0.5% in excess of the Federal Funds Rate or 1.0% in excess of one-month LIBOR (the “Base Rate”), plus an applicable margin, or (2) the one, two, three, or six-month per annum LIBOR for deposits in the applicable currency (the “Eurocurrency Rate”), as selected by the Company, plus an applicable margin. The applicable margin for Eurocurrency Rate loans depends on the Company’s funded debt leverage ratio and varies from 1.50% to 2.00%. The applicable margin for Base Rate loans depends on the Company’s funded debt leverage ratio and varies from 0.50% to 1.50%. Commitment fees and letter of credit fees are also payable under the Revolving Credit Facility. Principal is payable in full at maturity on November 24, 2017, and there are no scheduled principal payments prior to maturity. The Company is required to pay a commitment fee ranging between 20 and 30 basis points per annum of the average daily unused portion of the Revolving Credit Facility, depending on the Company’s funded debt leverage ratio.
The purpose of the Revolving Credit Facility is for general working capital needs, permitted acquisitions (as defined in the Loan Agreement), and for stock repurchase and/or redemption transactions that the Company may authorize.
The Revolving Credit Facility contains certain covenants that, among other things, restrict additional indebtedness, liens and encumbrances, changes to the character of the Company’s business, acquisitions, asset dispositions, mergers and consolidations, sale or discount of receivables, creation or acquisitions of additional subsidiaries, and other matters customarily restricted in such agreements.
As of December 31, 2015, the Company was in material compliance with all covenants. There were no balances outstanding on the Revolving Credit Facility as of December 31, 2015. During the three months ended March 31, 2015, the Company borrowed approximately $28.0 million under the Revolving Credit Facility. During the three months ended June 30, 2015, the Company repaid approximately $28.0 million of balances previously outstanding under the Revolving Credit Facility from proceeds received in the Company’s public offering of 3,869,750 shares which closed on May 28, 2015. The weighted average interest rate was 1.68% for borrowings under Revolving Credit Facility during the year ended December 31, 2015.
56
Table of Contents
HEALTHSTREAM, INC.
NOTES TO CONSOLIDATED FINANCIAL STATEMENTS (Continued)
14. LEASES
The Company has non-cancellable operating leases primarily for office space, hosting facilities, and office equipment. Some lease agreements contain provisions for escalating rent payments over the initial terms of the lease. The Company accounts for these leases by recognizing rent expense on a straight-line basis and adjusting the deferred rent expense liability for the difference between the straight-line rent expense and the amount of rent paid. The terms of the lease agreements generally provide the Company the option to renew. The Company also leases certain office equipment under operating leases. Total rent expense under all operating leases was approximately $4.3 million, $3.1 million, and $2.4 million, for the years ended December 31, 2015, 2014, and 2013, respectively.
Future rental payment commitments at December 31, 2015 under non-cancelable operating leases, with initial terms of one year or more, are as follows (in thousands):
| 2016 |
$ | 3,876 | ||
| 2017 |
2,625 | |||
| 2018 |
1,365 | |||
| 2019 |
808 | |||
| 2020 |
810 | |||
| Thereafter |
2,604 | |||
|
|
|
|||
| Total minimum lease payments |
$ | 12,088 | ||
|
|
|
15. LITIGATION
In connection with its business, the Company is from time to time involved in various legal actions. The litigation process is inherently uncertain and it is possible that the resolution of such matters might have a material adverse effect upon the financial condition and/or results of operations of the Company. However, in the opinion of the Company’s management, matters currently pending or threatened against the Company are not expected to have a material adverse effect on the financial position or results of operations of the Company.
16. RELATED PARTY TRANSACTIONS
During the three months ended June 30, 2015, the Company’s CEO, Robert A. Frist, Jr., entered into an agreement with the Company pursuant to which he contributed 54,241 of his personally owned shares of HealthStream, Inc. common stock to the Company, without any consideration paid to him. In connection with this contribution, the Company approved the grant of 49,310 shares of common stock to over 600 employees, with a fair market value of approximately $1.5 million. Mr. Frist contributed 4,931 of the contributed shares noted above to take into account the estimated Company costs, such as administrative expenses and employer payroll taxes associated with the grants. (See Note 11).
17. SUBSEQUENT EVENTS
In February 2016, the Board of Directors authorized a share repurchase program for up to $25 million of the Company’s outstanding common stock. Repurchases will be made under the repurchase program in accordance with applicable securities laws and may be made at management’s discretion from time to time in the open market, through privately negotiated transactions, or otherwise. The share repurchase program will terminate on the earlier of December 31, 2016 or when the maximum dollar amount has been expended. The share repurchase program may be suspended or discontinued at any time.
57
Table of Contents
Item 9. Changes in and Disagreements with Accountants on Accounting and Financial Disclosure
None.
Item 9A. Controls and Procedures
Evaluation of Disclosure Controls and Procedures
HealthStream’s chief executive officer and principal financial officer have reviewed and evaluated the effectiveness of the Company’s disclosure controls and procedures (as defined in Rules 13a-15(e) and 15d-15(e) promulgated under the Securities Exchange Act of 1934 (the “Exchange Act”)) as of December 31, 2015. Based on that evaluation, the chief executive officer and principal financial officer have concluded that HealthStream’s disclosure controls and procedures were effective to ensure that the information required to be disclosed by the Company in the reports the Company files or submits under the Exchange Act is recorded, processed, summarized and reported within the time periods specified in the Securities and Exchange Commission’s rules and forms, and the information required to be disclosed in the reports the Company files or submits under the Exchange Act was accumulated and communicated to the Company’s management, including its principal executive and principal financial officer, or persons performing similar functions, as appropriate to allow timely decisions regarding required disclosure.
Management’s Annual Report On Internal Control Over Financial Reporting
Our management is responsible for establishing and maintaining adequate internal control over financial reporting as defined in Rules 13a-15(f) and 15d-15(f) under the Exchange Act, and for assessing the effectiveness of internal control over financial reporting. The Company’s internal control over financial reporting is designed to provide reasonable assurance regarding the reliability of financial reporting and the preparation of financial statements for external purposes in accordance with GAAP. The Company’s internal control over financial reporting includes those policies and procedures that: (1) pertain to the maintenance of records that, in reasonable detail, accurately and fairly reflect the transactions and dispositions of the assets of the Company; (2) provide reasonable assurance that transactions are recorded as necessary to permit preparation of financial statements in accordance with GAAP, and that receipts and expenditures of the Company are being made only in accordance with authorizations of management and directors of the Company; and (3) provide reasonable assurance regarding prevention or timely detection of unauthorized acquisition, use, or disposition of the Company’s assets that could have a material effect on the financial statements.
Because of its inherent limitations, internal control over financial reporting may not prevent or detect misstatements. Also, projections of any evaluation of effectiveness to future periods are subject to the risk that controls may become inadequate because of changes in conditions, or that the degree of compliance with the policies or procedures may deteriorate.
Management assessed the effectiveness of the Company’s internal control over financial reporting as of December 31, 2015. In making this assessment, management used the criteria set forth by the Committee of Sponsoring Organizations of the Treadway Commission in Internal Control-Integrated Framework (2013 Framework). Management’s assessment included an evaluation of the design of our internal control over financial reporting and testing of the operational effectiveness of our internal control over financial reporting. Management believes that, as of December 31, 2015, the Company’s internal control over financial reporting was effective based on those criteria. The Company’s independent registered public accounting firm, Ernst & Young LLP, has issued an audit report on the Company’s internal control over financial reporting, which appears in Item 8 of this Annual Report on Form 10-K.
Changes in Internal Control Over Financial Reporting
There were no changes in HealthStream’s internal control over financial reporting that occurred during the fourth quarter of 2015 that have materially affected, or that are reasonably likely to materially affect, HealthStream’s internal control over financial reporting.
None.
58
Table of Contents
Item 10. Directors, Executive Officers and Corporate Governance
Information as to directors of the Company and corporate governance is incorporated by reference from the information contained in our 2016 proxy statement for the 2016 Annual Meeting of Shareholders (2016 Proxy Statement) that we will file with the Securities and Exchange Commission within 120 days of the end of the fiscal year to which this report relates. Pursuant to General Instruction G(3), certain information concerning executive officers of the Company is included in Part I of this Form 10-K, under the caption “Executive Officers of the Registrant.”
Item 11. Executive Compensation
Incorporated by reference from the information contained in the Company’s 2016 Proxy Statement.
Item 12. Security Ownership of Certain Beneficial Owners and Management and Related Stockholder Matters
Incorporated by reference from the information contained in the Company’s 2016 Proxy Statement.
Item 13. Certain Relationships and Related Transactions, and Director Independence
Incorporated by reference from the information contained in the Company’s 2016 Proxy Statement.
Item 14. Principal Accounting Fees and Services
Incorporated by reference from the information contained in the Company’s 2016 Proxy Statement.
59
Table of Contents
Item 15. Exhibits, Financial Statement Schedules
(a)(1) Financial Statements
Reference is made to the financial statements included in Item 8 to this Report on Form 10-K.
(a)(2) Financial Statement Schedules
All schedules are omitted because they are not applicable or the required information is shown in the Consolidated Financial Statements or the notes thereto.
(a)(3) Exhibits
| Number |
Description | |
| 2.1 (1) | Membership Interest Purchase Agreement, dated as of February 12, 2015, between HealthStream, Inc., Littrell Holdings, Inc., HealthLine Systems, Inc., the Shareholders of HealthLine Systems, Inc., and Dan Littrell in his individual capacity and as the Shareholders Representative. | |
| 3.1* | Form of Fourth Amended and Restated Charter of HealthStream, Inc. | |
| 3.2(7)* | Form of Second Amended and Restated Bylaws of HealthStream, Inc. | |
| 4.1* | Form of certificate representing the common stock, no par value per share, of HealthStream, Inc. | |
| 4.2* | Reference is made to Exhibits 3.1 and 3.2. | |
| 10.1^* | 2000 Stock Incentive Plan, effective as of April 10, 2000 | |
| 10.2^ (5) | 2010 Stock Incentive Plan, effective as of May 27, 2010 | |
| 10.3^* | Form of Indemnification Agreement | |
| 10.4^ (2) | Executive Employment Agreement, dated July 21, 2005, between HealthStream, Inc. and Robert A. Frist, Jr. | |
| 10.5^ (3) | Form of HealthStream, Inc. Non-Qualified Stock Option Agreement (Employees) | |
| 10.6^ (3) | Form of HealthStream, Inc. Incentive Stock Option Agreement (Employees) | |
| 10.7^ (3) | Form of HealthStream, Inc. Non-Qualified Stock Option Agreement (Directors) | |
| 10.8^ (4) | Form of HealthStream, Inc. Restricted Share Unit Agreement (Officers) | |
| 10.9^ (4) | Form of HealthStream, Inc. Restricted Share Unit Agreement (Non-Employee Director) | |
| 10.10 (6) | Revolving Credit Agreement, dated November 24, 2014, by and among HealthStream, Inc., the several banks and other financial institutions and lenders from time to time party thereto and SunTrust Bank, as administrative agent, issuing bank, and swingline lender | |
| 10.11^ | Summary of Director and Executive Officer Compensation | |
| 10.12^(8) | HealthStream, Inc. 2015 Cash Incentive Bonus Plan | |
| 10.13 (8) | Contribution Agreement, dated as of June 30, 2015, between HealthStream, Inc. and Robert A. Frist, Jr. | |
| 10.14^(9) | Letter Agreement, dated as of September 24, 2015, between HealthStream, Inc. and Michael Sousa. | |
| 10.15^ (9) | Form of HealthStream, Inc. Restricted Share Unit Agreement (Performance) between HealthStream, Inc. and Michael Sousa. | |
| 10.16^ (9) | Form of HealthStream, Inc. Restricted Share Unit Agreement (Cumulative) between HealthStream, Inc. and Michael Sousa. | |
| 10.17^ (9) | 2015 Provider Solutions Cash Incentive Bonus Plan. | |
| 21.1 | Subsidiaries of HealthStream, Inc. | |
| 23.1 | Consent of Independent Registered Public Accounting Firm | |
| 31.1 | Certification of the Chief Executive Officer Pursuant to Section 302 of the Sarbanes-Oxley Act of 2002 | |
| 31.2 | Certification of the Chief Financial Officer Pursuant to Section 302 of the Sarbanes-Oxley Act of 2002 | |
| 32.1 | Certification Pursuant to 18 U.S.C. Section 1350, as Adopted Pursuant to Section 906 of the Sarbanes-Oxley Act of 2002 | |
| 32.2 | Certification Pursuant to 18 U.S.C. Section 1350, as Adopted Pursuant to Section 906 of the Sarbanes-Oxley Act of 2002 | |
| 101.1 INS | XBRL Instance Document | |
| 101.1 SCH | XBRL Taxonomy Extension Schema | |
| 101.1 CAL | XBRL Taxonomy Extension Calculation Linkbase | |
| 101.1 DEF | XBRL Taxonomy Extension Definition Linkbase | |
| 101.1 LAB | XBRL Taxonomy Extension Label Linkbase | |
| 101.1 PRE | XBRL Taxonomy Extension Presentation Linkbase | |
| * | Incorporated by reference to Registrant’s Registration Statement on Form S-1, as amended (Reg. No. 333-88939). |
| ^ | Management contract or compensatory plan or arrangement |
| (1) | Incorporated by reference from exhibit filed on our Current Report on Form 8-K, dated February 13, 2015. |
| (2) | Incorporated by reference from exhibit filed on our Current Report on Form 8-K, dated July 25, 2005. |
| (3) | Incorporated by reference from exhibit filed on our Current Report on Form 8-K, dated June 1, 2010. |
| (4) | Incorporated by reference from exhibit filed on our Quarterly Report on Form 10-Q, for the quarterly period ended March 31, 2012 filed with the SEC on April 30, 2012. |
| (5) | Incorporated by reference to Appendix B of the Company’s Definitive Proxy Statement filed with the SEC on April 29, 2010. |
| (6) | Incorporated by reference from exhibit filed on our Current Report on Form 8-K, dated November 25, 2014. |
| (7) | Incorporated by reference from exhibit filed on our Current Report on Form 8-K, dated October 23, 2015. |
| (8) | Incorporated by reference from exhibit filed on our Quarterly Report on Form 10-Q, for the quarterly period ended June 30, 2015, filed with the SEC on July 31, 2015. |
| (9) | Incorporated by reference from exhibit filed on our Quarterly Report on Form 10-Q, for the quarterly period ended September 30, 2015, filed with the SEC on October 30, 2015. |
60
Table of Contents
Pursuant to the requirements of Section 13 or 15(d) of the Securities Exchange Act of 1934, the Registrant has duly caused this report to be signed on its behalf by the undersigned, thereunto duly authorized on this 26th day of February, 2016.
| HEALTHSTREAM, INC. | ||
| By: | /s/ ROBERT A. FRIST, JR. | |
| Robert A. Frist, Jr. | ||
| Chief Executive Officer | ||
Pursuant to the requirements of the Securities Exchange Act of 1934, this report has been signed by the following persons on behalf of the registrant and in the capacities and on the dates indicated:
| Signature |
Title(s) |
Date | ||
| /s/ ROBERT A. FRIST, JR. Robert A. Frist, Jr. |
President, Chief Executive Officer and Chairman (Principal Executive Officer) |
February 26, 2016 | ||
| /s/ GERARD M. HAYDEN, JR. Gerard M. Hayden, Jr. |
Chief Financial Officer and Senior Vice President (Principal Financial and Accounting Officer) |
February 26, 2016 | ||
| /s/ THOMPSON DENT Thompson Dent |
Director |
February 26, 2016 | ||
| /s/ FRANK GORDON Frank Gordon |
Director |
February 26, 2016 | ||
| /s/ C. MARTIN HARRIS C. Martin Harris |
Director |
February 26, 2016 | ||
| /s/ JEFFREY L. MCLAREN Jeffrey L. McLaren |
Director |
February 26, 2016 | ||
| /s/ DALE POLLEY Dale Polley |
Director |
February 26, 2016 | ||
| /s/ LINDA REBROVICK Linda Rebrovick |
Director |
February 26, 2016 | ||
| /s/ MICHAEL SHMERLING Michael Shmerling |
Director |
February 26, 2016 | ||
| /s/ WILLIAM STEAD William Stead |
Director |
February 26, 2016 | ||
| /s/ DEBORAH TAYLOR TATE Deborah Taylor Tate |
Director |
February 26, 2016 | ||
61
Table of Contents
INDEX TO EXHIBITS
| Exhibit |
Description | |
| 2.1 (1) | Membership Interest Purchase Agreement, dated as of February 12, 2015, between HealthStream, Inc., Littrell Holdings, Inc., HealthLine Systems, Inc., the Shareholders of HealthLine Systems, Inc., and Dan Littrell in his individual capacity and as the Shareholders Representative. | |
| 3.1* | Form of Fourth Amended and Restated Charter of HealthStream, Inc. | |
| 3.2(7)* | Form of Second Amended and Restated Bylaws of HealthStream, Inc. | |
| 4.1* | Form of certificate representing the common stock, no par value per share, of HealthStream, Inc. | |
| 4.2* | Reference is made to Exhibits 3.1 and 3.2. | |
| 10.1^* | 2000 Stock Incentive Plan, effective as of April 10, 2000 | |
| 10.2^ (5) | 2010 Stock Incentive Plan, effective as of May 27, 2010 | |
| 10.3^* | Form of Indemnification Agreement | |
| 10.4^ (2) | Executive Employment Agreement, dated July 21, 2005, between HealthStream, Inc. and Robert A. Frist, Jr. | |
| 10.5^ (3) | Form of HealthStream, Inc. Non-Qualified Stock Option Agreement (Employees) | |
| 10.6^ (3) | Form of HealthStream, Inc. Incentive Stock Option Agreement (Employees) | |
| 10.7^ (3) | Form of HealthStream, Inc. Non-Qualified Stock Option Agreement (Directors) | |
| 10.8^ (4) | Form of HealthStream, Inc. Restricted Share Unit Agreement (Officers) | |
| 10.9^ (4) | Form of HealthStream, Inc. Restricted Share Unit Agreement (Non-Employee Director) | |
| 10.10 (6) | Revolving Credit Agreement, dated November 24, 2014, by and among HealthStream, Inc., the several banks and other financial institutions and lenders from time to time party thereto and SunTrust Bank, as administrative agent, issuing bank, and swingline lender | |
| 10.11^ | Summary of Director and Executive Officer Compensation | |
| 10.12^(8) | HealthStream, Inc. 2015 Cash Incentive Bonus Plan | |
| 10.13 (8) | Contribution Agreement, dated as of June 30, 2015, between HealthStream, Inc. and Robert A. Frist, Jr. | |
| 10.14^(9) | Letter Agreement, dated as of September 24, 2015, between HealthStream, Inc. and Michael Sousa. | |
| 10.15^ (9) | Form of HealthStream, Inc. Restricted Share Unit Agreement (Performance) between HealthStream, Inc. and Michael Sousa. | |
| 10.16^ (9) | Form of HealthStream, Inc. Restricted Share Unit Agreement (Cumulative) between HealthStream, Inc. and Michael Sousa. | |
| 10.17^ (9) | 2015 Provider Solutions Cash Incentive Bonus Plan. | |
| 21.1 | Subsidiaries of HealthStream, Inc. | |
| 23.1 | Consent of Independent Registered Public Accounting Firm | |
| 31.1 | Certification of the Chief Executive Officer Pursuant to Section 302 of the Sarbanes-Oxley Act of 2002 | |
| 31.2 | Certification of the Chief Financial Officer Pursuant to Section 302 of the Sarbanes-Oxley Act of 2002 | |
| 32.1 | Certification Pursuant to 18 U.S.C. Section 1350, as Adopted Pursuant to Section 906 of the Sarbanes-Oxley Act of 2002 | |
| 32.2 | Certification Pursuant to 18 U.S.C. Section 1350, as Adopted Pursuant to Section 906 of the Sarbanes-Oxley Act of 2002 | |
| 101.1 INS | XBRL Instance Document | |
| 101.1 SCH | XBRL Taxonomy Extension Schema | |
| 101.1 CAL | XBRL Taxonomy Extension Calculation Linkbase | |
| 101.2 DEF | XBRL Taxonomy Extension Definition Linkbase | |
| 101.1 LAB | XBRL Taxonomy Extension Label Linkbase | |
| 101.1 PRE | XBRL Taxonomy Extension Presentation Linkbase | |
| * | Incorporated by reference to Registrant’s Registration Statement on Form S-1, as amended (Reg. No. 333-88939). |
| ^ | Management contract or compensatory plan or arrangement |
| (1) | Incorporated by reference from exhibit filed on our Current Report on Form 8-K, dated February 13, 2015. |
| (2) | Incorporated by reference from exhibit filed on our Current Report on Form 8-K, dated July 25, 2005. |
| (3) | Incorporated by reference from exhibit filed on our Current Report on Form 8-K, dated June 1, 2010. |
| (4) | Incorporated by reference from exhibit filed on our Quarterly Report on Form 10-Q, for the quarterly period ended March 31, 2012 filed with the SEC on April 30, 2012. |
| (5) | Incorporated by reference to Appendix B of the Company’s Definitive Proxy Statement filed with the SEC on April 29, 2010. |
| (6) | Incorporated by reference from exhibit filed on our Current Report on Form 8-K, dated November 25, 2014. |
| (7) | Incorporated by reference from exhibit filed on our Current Report on Form 8-K, dated October 23, 2015. |
| (8) | Incorporated by reference from exhibit filed on our Quarterly Report on Form 10-Q, for the quarterly period ended June 30, 2015, filed with the SEC on July 31, 2015. |
| (9) | Incorporated by reference from exhibit filed on our Quarterly Report on Form 10-Q, for the quarterly period ended September 30, 2015, filed with the SEC on October 30, 2015. |