Attached files
| file | filename |
|---|---|
| EX-32 - EXHIBIT 32 - HANDY & HARMAN LTD. | hnh12312015ex32.htm |
| EX-21.1 - EXHIBIT 21.1 - HANDY & HARMAN LTD. | hnh12312015ex211.htm |
| EX-23.2 - EXHIBIT 23.2 - HANDY & HARMAN LTD. | hnh12312015ex232.htm |
| EX-99.1 - EXHIBIT 99.1 - HANDY & HARMAN LTD. | ex991financialstatementsof.htm |
| EX-23.3 - EXHIBIT 23.3 - HANDY & HARMAN LTD. | hnh12312015ex233.htm |
| EX-31.1 - EXHIBIT 31.1 - HANDY & HARMAN LTD. | hnh12312015ex311.htm |
| EX-23.1 - EXHIBIT 23.1 - HANDY & HARMAN LTD. | hnh12312015ex231.htm |
| EX-31.2 - EXHIBIT 31.2 - HANDY & HARMAN LTD. | hnh12312015ex312.htm |
UNITED STATES
SECURITIES AND EXCHANGE COMMISSION
Washington, D.C. 20549
FORM 10-K
(Mark One)
þ | ANNUAL REPORT PURSUANT TO SECTION 13 OR 15(d) OF THE SECURITIES EXCHANGE ACT OF 1934 |
For the fiscal year ended December 31, 2015
OR
o | TRANSITION REPORT PURSUANT TO SECTION 13 OR 15(d) OF THE SECURITIES EXCHANGE ACT OF 1934 |
For the Transition Period from to
Commission File Number 1-2394
HANDY & HARMAN LTD. |
(Exact name of registrant as specified in its charter) |
DELAWARE | 13-3768097 |
(State or other jurisdiction of incorporation or organization) | (I.R.S. Employer Identification No.) |
1133 Westchester Avenue, Suite N222 White Plains, New York | 10604 |
(Address of principal executive offices) | (Zip Code) |
914-461-1300 | |
(Registrant's telephone number, including area code) | |
Securities registered pursuant to Section 12(b) of the Act: | |
Title of each class | Name of each exchange on which registered |
Common stock, $.01 par value | NASDAQ Capital Market |
Securities registered pursuant to Section 12(g) of the Act: None
Indicate by check mark if the registrant is a well-known seasoned issuer, as defined in Rule 405 of the Securities Act. Yes ¨ No þ
Indicate by check mark if the registrant is not required to file reports pursuant to Section 13 or Section 15(d) of the Act. Yes ¨ No þ
Indicate by check mark whether the registrant: (1) has filed all reports required to be filed by Section 13 or 15(d) of the Securities Exchange Act of 1934 during the preceding 12 months (or for such shorter period that the registrant was required to file such reports), and (2) has been subject to such filing requirements for the past 90 days. Yes þ No ¨
Indicate by check mark whether the registrant has submitted electronically and posted on its corporate Web site, if any, every Interactive Data File required to be submitted and posted pursuant to Rule 405 of Regulation S-T (§232.405 of this chapter) during the preceding 12 months (or for such shorter period that the registrant was required to submit and post such files). Yes þ No ¨
Indicate by check mark if disclosure of delinquent filers pursuant to Item 405 of Regulation S-K (§229.405 of this chapter) is not contained herein, and will not be contained, to the best of registrant's knowledge, in definitive proxy or information statements incorporated by reference in Part III of this Form 10-K or any amendment to this Form 10-K. þ
Indicate by check mark whether the registrant is a large accelerated filer, an accelerated filer, a non-accelerated filer, or a smaller reporting company. See the definitions of "large accelerated filer," "accelerated filer" and "smaller reporting company" in Rule 12b-2 of the Exchange Act. (Check one):
Large accelerated filer o | Accelerated filer x |
Non-accelerated filer o | Smaller reporting company o |
Indicate by check mark whether the registrant is a shell company (as defined in Rule 12b-2 of the Exchange Act). Yes ¨ No þ
The aggregate market value of the voting and non-voting common equity held by non-affiliates of registrant as of June 30, 2015 totaled approximately $98.5 million based on the then-closing stock price.
On February 25, 2016, there were 12,208,016 shares of common stock outstanding, par value $0.01 per share.
DOCUMENTS INCORPORATED BY REFERENCE
The information required by Items 10, 11, 12, 13 and 14 of Part III will be incorporated by reference to certain portions of a definitive proxy statement, which is expected to be filed by the Registrant within 120 days after the close of its fiscal year.
HANDY & HARMAN LTD.
FORM 10-K
December 31, 2015
Page | 1
PART I
Item 1. | Business |
The Company
Handy & Harman Ltd. ("HNH") is a diversified manufacturer of engineered niche industrial products with leading market positions in many of the markets it serves. Through its wholly-owned operating subsidiaries, HNH focuses on high margin products and innovative technology and serves customers across a wide range of end markets. HNH sells its products and services through direct sales forces, distributors and manufacturer's representatives. It serves a diverse customer base, including the construction, electrical, electronics, transportation, utility, medical, oil and gas exploration, aerospace and defense, and food industries. As of December 31, 2015, HNH and its subsidiaries employed over 2,100 people at 33 locations in eight countries. All references herein to "we," "our," "its" or the "Company" refer to HNH together with all of its subsidiaries.
HNH's diverse product offerings are marketed throughout the United States and internationally. HNH owns Handy & Harman Group Ltd. ("H&H Group"), which owns Handy & Harman ("H&H") and Bairnco, LLC, formerly Bairnco Corporation. HNH manages its group of businesses on a decentralized basis with operations principally in North America. HNH's business units encompass the following segments: Joining Materials, Tubing, Building Materials, Performance Materials and Kasco Blades and Route Repair Services ("Kasco"). Financial information for our reportable segments is contained in Note 21 to our consolidated financial statements included in "Item 8 - Financial Statements and Supplementary Data."
We manage our portfolio of businesses on a continuous basis. In 2015, we acquired certain assets and assumed certain liabilities of ITW Polymers Sealants North America Inc. ("ITW"), which are used in the business of manufacturing two-component polyurethane adhesive for the roofing industry, and also acquired JPS Industries, Inc. ("JPS"), a manufacturer of mechanically formed glass and aramid substrate materials for specialty applications in a wide expanse of markets requiring highly engineered components. In 2014, we entered into an agreement to sell Arlon, LLC, which operations comprised substantially all of the Company's former Arlon Electronic Materials ("Arlon") segment. The sale was finalized in January 2015. In 2013, we acquired substantially all of the assets of Wolverine Joining Technologies, LLC ("Wolverine Joining") used for the development, manufacturing and sale of brazing, flux and soldering products, and the alloys for electrical, catalyst and other industrial specialties, and also acquired PAM Fastening Technology, Inc. ("PAM"), a distributor of screw guns, collated screws and hot melt systems. Also during 2013, we divested substantially all of the assets and existing operations of our Continental Industries, Inc. ("Continental") and Canfield Metal Coating Corporation business units, and sold substantially all of the equipment owned or utilized by Indiana Tube de México, S. De R.L. de C.V. Further discussion of our acquisitions and divestitures is contained in Notes 4 and 5, respectively, to our consolidated financial statements included in "Item 8 - Financial Statements and Supplementary Data."
Products and Product Mix
Joining Materials Segment
Joining Materials segment primarily fabricates precious metals and their alloys into brazing alloys. Brazing alloys are used to join similar and dissimilar metals, as well as specialty metals and some ceramics, with strong, hermetic joints. Joining Materials segment offers these metal joining products in a wide variety of alloys, including gold, silver, palladium, copper, nickel, aluminum and tin. These brazing alloys are fabricated into a variety of engineered forms and are used in many industries, including electrical, appliance, transportation, construction and general industrial, where dissimilar material and metal joining applications are required. Operating income from precious metal products is principally derived from the "value added" of processing and fabricating and not from the direct purchase and resale of precious metals. Joining Materials segment enters into commodity futures and forward contracts to mitigate the impact of price fluctuations on its precious and certain non-precious metal inventories that are not subject to fixed price contracts. We believe that the business unit that comprises our Joining Materials segment is the North American market leader in many of the markets that it serves.
Tubing Segment
Tubing segment manufactures a wide variety of steel tubing products. We believe that the Tubing segment manufactures the world's longest continuous seamless stainless steel tubing coils, in excess of 5,000 feet, serving the petrochemical infrastructure and shipbuilding markets. In addition, we believe it is the number one supplier of small diameter (less than 3 mm) coil tubing to industry leading specifications serving the aerospace, defense and semiconductor fabrication markets. This segment also manufactures welded carbon steel tubing in coiled and straight lengths with a primary focus on products for the transportation,
Page | 2
appliance and heating, and oil and gas industries. In addition to producing bulk tubing, it produces value added fabrications for several of these industries.
Building Materials Segment
Building Materials segment manufactures and supplies products primarily to the commercial construction and building industries. It manufactures fasteners and fastening systems for the U.S. commercial low slope roofing industry, which are sold to building and roofing material wholesalers, roofing contractors and private label roofing system manufacturers, and a line of engineered specialty fasteners for the building products industry for fastening applications in the remodeling and construction of homes, decking and landscaping. We believe that our primary business unit in the Building Materials segment is the market leader in fasteners and accessories for commercial low-slope roofing applications and that the majority of the net sales for the segment are for the commercial construction repair and replacement market. The results of the Building Materials segment include the operations of ITW from its acquisition on March 31, 2015.
Performance Materials Segment
Performance Materials segment manufactures sheet and mechanically formed glass and aramid materials for specialty applications in a wide expanse of markets requiring highly engineered components. Its products are used in a wide range of advanced composite applications, such as civilian and military aerospace components, printed electronic circuit boards, filtration and insulation products, specialty commercial construction substrates, automotive and industrial components, and soft body armor for civilian and military applications. The Performance Materials segment is currently comprised solely of the operations of JPS, which was acquired on July 2, 2015.
Kasco Blades and Route Repair Services Segment
Kasco provides meat-room blade products, repair services and resale products for the meat and deli departments of supermarkets, restaurants, meat and fish processing plants, and for distributors of electrical saws and cutting equipment, principally in North America and Europe. Kasco also provides wood cutting blade products for the pallet manufacturing, pallet recycler and portable saw mill industries in North America.
Business Strategy
Our business strategy is to enhance the growth and profitability of the HNH business units and to build upon their strengths through internal growth and strategic acquisitions. We expect HNH to continue to focus on high margin products and innovative technology. We also will continue to evaluate, from time to time, the sale of certain businesses and assets, as well as strategic and opportunistic acquisitions.
HNH uses a set of tools and processes called the Steel Business System to drive operational and sales efficiencies across each of its business units. The Steel Business System is designed to drive strategy deployment and sales and marketing based on lean principles. HNH pursues a number of ongoing strategic initiatives intended to improve its performance, including objectives relating to manufacturing improvement, idea generation, product development, and global sourcing of materials and services. HNH utilizes lean tools and philosophies in operations and commercialization activities to increase sales, improve business processes, and reduce and eliminate waste, coupled with the tools targeted at variation reduction.
Customers
HNH is diversified across industrial markets and customers. HNH sells to customers in the construction, electrical, electronics, transportation, utility, medical, oil and gas exploration, aerospace and defense, and food industries.
No customer accounted for more than 10% of consolidated net sales in 2015, 2014 or 2013. The Company's 15 largest customers accounted for approximately 33% of consolidated HNH net sales in 2015.
Foreign Revenue
The following table presents foreign revenue for the years ended December 31.
Page | 3
Revenue | ||||||||||||
(in thousands) | 2015 | 2014 | 2013 | |||||||||
United States | $ | 603,079 | $ | 550,071 | $ | 518,631 | ||||||
Foreign | 46,389 | 50,397 | 52,533 | |||||||||
Total | $ | 649,468 | $ | 600,468 | $ | 571,164 | ||||||
Foreign revenue is based on the country in which the legal subsidiary generating the revenue is domiciled.
Raw Materials
Besides precious metals, the raw materials used in the operations of the Joining Materials, Tubing, Building Materials and Kasco segments consist principally of stainless, galvanized and carbon steel, copper, tin, nickel alloys, a variety of high-performance alloys and various plastic compositions. The raw materials used in the operations of the Performance Materials segment consist principally of fiberglass, quartz and aramid yarns. HNH purchases all such raw materials at open market prices from domestic and foreign suppliers. HNH has not experienced any significant problem in obtaining the necessary quantities of raw materials. Prices and availability, particularly of raw materials purchased from foreign suppliers, are affected by world market conditions and government policies. The raw materials used by HNH in its non-precious metal products are generally readily available from more than one source.
Capital Investments
The Company believes that in order to be and remain competitive, its businesses must continuously strive to improve productivity and product quality, and control and/or reduce manufacturing costs. Accordingly, HNH's segments expect to continue to incur capital investments that reduce overall manufacturing costs, improve the quality of products produced and broaden the array of products offered to the industries HNH serves, as well as replace equipment as necessary to maintain compliance with environmental, health and safety laws and regulations. HNH's capital expenditures for 2015, 2014 and 2013 for continuing operations were $15.2 million, $12.7 million and $11.7 million, respectively. HNH anticipates funding its capital expenditures in 2016 from funds generated by operations and borrowed funds. HNH anticipates its capital expenditures to range between $17 and $27 million per year for the next several years.
Energy Requirements
HNH requires significant amounts of electricity and natural gas to operate its facilities and is subject to price changes in these commodities. A shortage of electricity or natural gas, or a government allocation of supplies resulting in a general reduction in supplies, could increase costs of production and could cause some curtailment of production.
Employment
As of December 31, 2015, the Company employed 2,125 employees worldwide. Of these employees, 355 were sales employees, 466 were office employees, 79 were covered by collective bargaining agreements and 1,225 were non-union operating employees.
Competition
There are many companies, both domestic and foreign, which manufacture products of the type the Company manufactures. Some of these competitors are larger than the Company and have financial resources greater than it does. Some of these competitors enjoy certain other competitive advantages, including greater name recognition, greater financial, technical, marketing and other resources, a larger installed base of customers, and well-established relationships with current and potential customers. Competition is based on quality, technology, service, and price, and in some industries, new product introduction. The Company may not be able to compete successfully, and competition may have a negative impact on its business, operating results or financial condition by reducing volume of products sold and/or selling prices, and accordingly reducing sales and profits.
In its served markets, the Company competes against large, as well as smaller-sized private and public companies. This results in intense competition in a number of markets in which it operates. Significant competition could in turn lead to lower prices, lower levels of shipments and/or higher costs in some markets that could have a negative effect on results of operations.
Sales Channels
Page | 4
HNH distributes products to customers through Company sales personnel, outside sales representatives and distributors in North and South America, Europe, Australia, Asia and several other international markets.
Patents and Trademarks
The Company owns patents and registered trademarks under which certain of its products are sold. In addition, the Company owns a number of U.S. and foreign utility patents and utility models related to certain of its products, as well as a number of design patents. The Company does not believe that the loss of any or all of these patents or trademarks would have a material adverse effect on its businesses. The Company's patents have remaining durations ranging from less-than-one year to 18 years, with expiration dates occurring at various times in 2016 through 2034.
Environmental Regulation
The Company is subject to laws and regulations relating to the protection of the environment. The Company does not presently anticipate that compliance with currently applicable environmental regulations and controls will significantly change its competitive position, capital spending or earnings during 2016. The Company believes it is in compliance with all orders and decrees consented to by the Company with environmental regulatory agencies. Please see "Item 1A - Risk Factors," "Item 3 - Legal Proceedings" and Note 19 to our consolidated financial statements included in "Item 8 - Financial Statements and Supplementary Data."
Other Information
Our internet website address is www.handyharman.com. Copies of the following reports are available free of charge through the internet website, as soon as reasonably practicable after they have been filed with or furnished to the Securities and Exchange Commission ("SEC") pursuant to Section 13(a) or 15(d) of the Securities Exchange Act of 1934, as amended ("Exchange Act"): annual reports on Form 10-K; quarterly reports on Form 10-Q; current reports on Form 8-K; any amendments to such reports; and proxy statements. Information on the website does not constitute part of this or any other report filed with or furnished to the SEC.
Item 1A. | Risk Factors |
This report includes "forward-looking statements" within the meaning of Section 27A of the Securities Act of 1933, as amended ("Securities Act"), and Section 21E of the Exchange Act, including, in particular, forward-looking statements under the headings "Item 7 - Management's Discussion and Analysis of Financial Condition and Results of Operations" and "Item 8 - Financial Statements and Supplementary Data." These statements appear in a number of places in this report and include statements regarding the Company's intent, belief or current expectations, such as those relating to future business, future results of operations or financial condition, new or planned products or services, or management strategies, including those with respect to (i) the Company's financing plans, (ii) trends affecting its financial condition or results of operations and (iii) the impact of competition. The words "expect," "anticipate," "intend," "plan," "believe," "seek," "estimate" and similar expressions are intended to identify such forward-looking statements; however, this report also contains other forward-looking statements in addition to historical information.
These forward-looking statements involve risks and uncertainties that could cause our actual results to differ materially from those expressed or implied in our forward-looking statements. Such risks and uncertainties include, among others, those discussed in "Item 1A - Risk Factors" of this Annual Report on Form 10-K, as well as in our consolidated financial statements, related notes, and the other information appearing elsewhere in this report and our other filings with the SEC. We do not intend, and undertake no obligation, to update any of our forward-looking statements after the date of this report to reflect actual results or future events or circumstances. Given these risks and uncertainties, readers are cautioned not to place undue reliance on such forward-looking statements.
Factors that could cause the actual results of the Company in future periods to differ materially include, but are not limited to, the following:
Risks Relating to Our Business
HNH sponsors defined benefit pension plans, which could subject it to substantial cash funding requirements in the future and could have a substantial adverse effect on cash flow and financial viability.
Page | 5
HNH's ongoing operating cash flow requirements include arranging for the funding of the minimum requirements of the WHX Corporation Pension Plan ("WHX Pension Plan") and the Retirement Plan for Employees of JPS Industries, Inc. ("JPS Pension Plan"). The performance of the financial markets and interest rates, as well as health care trends and associated mortality rates, impact our defined benefit pension plan expense and funding obligations. Significant changes in these factors, including adverse changes in discount rates, investment losses on plan assets and increases in participant life expectancy, may increase our funding obligations and adversely impact our financial condition. HNH expects to have required minimum pension plan contributions to the WHX Pension Plan and the JPS Pension Plan for 2016, 2017, 2018, 2019, 2020 and for the five years thereafter totaling $16.5 million, $34.3 million, $42.0 million, $38.8 million, $35.3 million and $92.5 million, respectively. Such required future contributions are estimated based upon assumptions regarding such matters as discount rates on future obligations, assumed rates of return on plan assets and legislative changes. Actual future pension costs and required funding obligations will be affected by changes in the factors and assumptions described above, as well as other changes such as any plan termination or other acceleration events, and could have a substantial adverse effect on cash flow and financial viability.
HNH, the parent company, has ongoing requirements to fund its pension plan obligations and meet other administrative expenses. However, H&H Group's debt facilities contain covenants that limit HNH's access to cash. If HNH is unable to access funds generated by its subsidiaries, it may not be able to meet its financial obligations.
As of December 31, 2015, HNH, the parent company, had cash and cash equivalents of approximately $16.1 million and current liabilities of approximately $0.2 million. Because HNH is a holding company that conducts operations through its subsidiaries, it depends on those entities for dividends, distributions and other payments to generate the funds necessary to meet its financial obligations. H&H Group's credit facilities restrict H&H Group's ability to transfer any cash or other assets to HNH, subject to certain exceptions including required pension payments to the WHX Pension Plan, but these exceptions are subject to the satisfaction of certain conditions and financial covenants. Failure by one or more of its subsidiaries to generate sufficient cash flow or meet the requirements of H&H Group's credit facilities, restricting future dividends or distributions to HNH, could have a material adverse effect on HNH's business, financial condition and results of operations.
HNH holds a significant investment in the common stock of another public company, and fluctuations in the value of this investment may adversely impact the Company's financial condition and results of operations.
HNH owned 8,436,715 and 6,383,005 shares of the common stock of ModusLink Global Solutions, Inc. ("ModusLink") at December 31, 2015 and December 31, 2014, respectively, and has elected the option to value its investment in ModusLink using fair value, calculated based on the closing market price for ModusLink common stock. The value of this investment decreased from $23.9 million at December 31, 2014 to $20.9 million at December 31, 2015 due to a decrease in the share price of ModusLink's common stock, partially offset by the additional shares of ModusLink common stock purchased by the Company during 2015. ModusLink primarily provides supply chain and logistics services to companies in consumer electronics, communications, computing, medical devices, software and retail. Fluctuations in the price of ModusLink common stock are subject to market fluctuations and other factors outside our control, which are not directly linked to the financial and operational performance of the Company.
Future cash flows from operations or through financings may not be sufficient to enable the Company to meet its obligations, and this would likely have a material adverse effect on its businesses, financial condition and results of operations.
The Company's debt is principally held by H&H Group, which is a wholly-owned subsidiary of HNH. The Company's ability to meet its cash requirements to fund its activities in the ordinary course of business is dependent, in part, upon its ability to access cash from H&H Group's credit facilities, and also on the Company's continuing ability to materially meet its business plans. There can be no assurance that the funds available from operations and under the Company's credit facilities will be sufficient to fund its debt service costs, working capital demands, pension plan contributions, environmental remediation costs or any of the Company's other existing or future obligations. As of December 31, 2015, H&H Group's availability under its senior secured revolving credit facility was $183.2 million, and as of January 31, 2016, it was $181.8 million.
There can be no assurances that H&H Group will continue to have access to its lines of credit if the financial performance of its subsidiaries does not satisfy the financial covenants set forth in the applicable financing agreements. If H&H Group does not meet certain of its financial covenants , and if it is unable to secure necessary waivers or other amendments from the respective lenders on terms acceptable to management, its ability to access available lines of credit could be limited, its debt obligations could be accelerated by the respective lenders, liquidity could be adversely affected for H&H Group, and H&H Group might not be able to provide funds to HNH, its parent, to enable HNH to meet its own financial obligations.
If the Company's cash needs are significantly greater than anticipated or the Company does not materially meet its business plans, the Company may be required to seek additional or alternative financing sources. There can be no assurance that such
Page | 6
financing will be available or available on terms acceptable to the Company. The Company's inability to generate sufficient cash flows from its operations or through financing could impair its liquidity and would likely have a material adverse effect on its businesses, financial condition and results of operations.
Credit market volatility may affect our ability to refinance our existing debt, borrow funds under our existing lines of credit or incur additional debt.
Future disruption and volatility in credit market conditions could have a material adverse impact on our ability to refinance our debt when it comes due on terms similar to our current credit facilities, or to draw upon our existing lines of credit or incur additional debt if needed as a result of unanticipated downturns in the markets for our products and services, which may require us to seek other funding sources to meet our cash requirements. We cannot be certain that alternative sources of financing would be available to the Company in the future on terms and conditions acceptable to us, or at all.
Economic downturns could disrupt and materially harm our business.
Negative trends in the general economy could cause a downturn in the market for our products and services. A significant portion of our revenues are received from customers in transportation, oil and gas exploration, and construction related industries, which have experienced significant financial downturns in the past. These industries are cyclical and demand for their products tends to fluctuate due to changes in national and global economic conditions, availability of credit and other factors. A worsening of consumer demand in these industries would adversely affect our revenues, profitability, operating results and cash flows. We may also experience a slowdown if some customers experience difficulty in obtaining adequate financing due to tightness in the credit markets. Furthermore, the financial stability of our customers or suppliers may be compromised, which could result in additional bad debts for us or non-performance by suppliers. Our assets may also be impaired or subject to write-down or write-off as a result of these conditions. These adverse effects would likely be exacerbated if global economic conditions worsen, resulting in wide-ranging, adverse and prolonged effects on general business conditions, and materially and adversely affect our operations, financial results and liquidity.
In many cases, our competitors are larger than us and have manufacturing and financial resources greater than we do, which may have a negative impact on our business, operating results or financial condition.
In our served markets, we compete against foreign and domestic private and public companies that manufacture products of the type we manufacture. Some of these competitors are larger than we are and have financial resources greater than we do. This results in intense competition in a number of markets in which we operate. Some of these competitors enjoy certain other competitive advantages, including greater name recognition, greater financial, technical, marketing and other resources, a larger installed base of customers, and well-established relationships with current and potential customers. Competition is based on quality, technology, service, and price, and in some industries, new product introduction. We may not be able to compete successfully, and competition may have a negative impact on our business, operating results or financial condition by reducing volume of products sold and/or selling prices, and accordingly reducing our sales and profits.
Our sales and profitability may be adversely affected by fluctuations in the cost and supply of raw materials and commodities.
In our production and distribution processes, we consume significant amounts of electricity, natural gas, fuel and petroleum-based commodities, including adhesives, and other products, such as yarns, precious metals, steel products and certain non-ferrous metals used as raw materials. The availability and pricing of these commodities are subject to market forces that are beyond our control. Our suppliers contract separately for the purchase of such commodities, and our sources of supply could be interrupted should our suppliers not be able to obtain these materials due to higher demand or other factors interrupting their availability. Our results of operations may be adversely affected during periods in which either the prices of such commodities are unusually high, or their availability is restricted, or if we are unable to pass through the unfavorable impact of raw material price fluctuations to our customers, including any change associated with the margins we generate from the material portion of our products. In addition, we hold precious metal positions that are subject to market fluctuations. We enter into precious metal forward or futures contracts with major financial institutions to attempt to mitigate the economic risk of these price fluctuations, however, the Company's hedging strategy is designed to protect it against normal volatility; therefore, abnormal price changes in these commodities or markets could negatively impact HNH's earnings.
We do not have long-term contracts with all of our customers, the loss of which customers could materially adversely affect our financial condition, business and results of operations.
Our businesses are based primarily upon individual orders and sales with our customers and not long-term supply contracts. As such, our customers could cease buying products at any time and for any reason, and we will have no recourse in the event a
Page | 7
customer no longer wants to purchase products from us. If a significant number of our customers elect not to purchase products, it could materially adversely affect our financial condition, business and results of operations. No single customer accounted for more than 10% of HNH's consolidated net sales in 2015. However, the Company's 15 largest customers accounted for approximately 33% of consolidated net sales in 2015. If we were to lose our relationship with several of these customers, revenues and profitability could fall significantly.
Some of our businesses are subject to certain risks associated with the movement of businesses offshore.
Some of our businesses are potentially at risk of losing business to competitors operating in lower cost countries. An additional risk is the movement offshore of some of our businesses' customers, leading them to procure products from more closely located companies. Either of these factors could negatively impact our financial condition, business and results of operations.
Our business strategy includes acquisitions, and acquisitions entail numerous risks, including the risk of management diversion and increased costs and expenses, all of which could negatively affect the Company's profitability.
Our business strategy includes, among other things, strategic acquisitions, as well as potential opportunistic acquisitions. This element of our strategy entails several risks, including the diversion of management's attention from other business concerns and the need to finance such acquisitions with additional equity and/or debt.
In addition, once completed, acquisitions entail further risks, including: unanticipated costs and liabilities of the acquired businesses, including environmental liabilities that could materially adversely affect our results of operations; difficulties in assimilating acquired businesses; negative effects on existing business relationships with suppliers and customers; and losing key employees of the acquired businesses. If our acquisition strategy is not successful or if acquisitions are not well integrated into our existing operations, the Company's profitability could be negatively affected.
Divestitures could negatively impact our business, and contingent liabilities from businesses that we have sold could adversely affect our financial condition.
We continually assess the strategic fit of our existing businesses and may divest businesses that are deemed not to fit with our strategic plans or are not achieving the desired return on investment. Divestitures pose risks and challenges that could negatively impact our business. For example, when we decide to sell a business or assets, we may be unable to do so on satisfactory terms and within our anticipated timeframe, and even after reaching a definitive agreement to sell a business, the sale is typically subject to satisfaction of pre-closing conditions, which may not become satisfied. In addition, divestitures may dilute the Company's earnings per share, have other adverse accounting impacts and distract management, and disputes may arise with buyers. In addition, we have retained responsibility for and/or have agreed to indemnify buyers against some known and unknown contingent liabilities related to a number of businesses we have sold. The resolution of these contingencies has not had a material effect on our consolidated financial statements, but we cannot be certain that this favorable pattern will continue.
Our competitive advantage could be reduced if our intellectual property or related proprietary manufacturing processes become known by our competitors or if technological changes reduce our customers' need for our products.
We own a number of trademarks and patents in the United States and other jurisdictions on our products and related proprietary manufacturing processes. In addition to trademark and patent protection, we rely on trade secrets, proprietary know-how and technological advances that we seek to protect. If our intellectual property is not properly protected by us or is independently discovered by others or otherwise becomes known or if technological changes reduce our customers' need for our proprietary products, our protection against competitive products could be diminished, and our profitability could be substantially impaired.
We could incur significant costs, including remediation costs, as a result of complying with environmental laws.
Our facilities and operations are subject to extensive environmental laws and regulations imposed by federal, state, foreign and local authorities relating to the protection of the environment. Although we maintain insurance coverage for certain environmental matters, we could incur substantial costs, including cleanup costs, fines or sanctions, and third-party claims for property damage or personal injury, as a result of violations of, or liabilities under, environmental laws. We have incurred, and in the future may continue to incur, liability under environmental statutes and regulations with respect to the contamination detected at sites owned or operated by the Company (including contamination caused by prior owners and operators of such sites, abutters or other persons) and the sites at which we have disposed of hazardous substances. As of December 31, 2015, we have established reserves totaling $2.5 million with respect to certain presently estimated environmental remediation costs. These reserves may not be adequate to cover the ultimate costs of remediation, including discovery of additional contaminants or the imposition of additional cleanup obligations, which could result in significant additional costs. In addition, we expect that future regulations,
Page | 8
and changes in the text or interpretation of existing regulations, may subject us to increasingly stringent standards. Compliance with such requirements may make it necessary for us to retrofit existing facilities with additional pollution-control equipment, undertake new measures in connection with the storage, transportation, treatment and disposal of by-products and wastes or take other steps, which may be at a substantial cost to us.
Our future success depends greatly upon attracting and retaining qualified personnel, which could increase our labor costs and impair our profitability.
A significant factor in our future profitability is our ability to attract, develop and retain qualified personnel. We receive certain executive and corporate services, including, without limitation, legal, tax, accounting, treasury, consulting, auditing, administrative, compliance, environmental health and safety, human resources, marketing, investor relations, operating group management and other similar services under a management agreement with a related party. Our success in attracting qualified personnel is affected by changing demographics of the available pool of workers with the training and skills necessary to fill available positions, the impact on the labor supply due to general economic conditions, and our ability to offer competitive compensation and benefit packages.
If we suffer loss to our facilities, supply chains or distribution systems to catastrophe or other events, our operations could be seriously harmed.
Our facilities, supply chains, distribution systems and information technology systems are subject to catastrophic loss due to fire, flood, earthquake, hurricane, terrorism or other natural or man-made disasters. If any of these facilities, supply chains or systems were to experience a catastrophic loss, it could disrupt our operations, delay production and shipments, result in defective products or services, damage customer relationships and our reputation and result in legal exposure and large repair or replacement expenses. The third-party insurance coverage that we maintain with respect to these and other risks will vary from time to time in both type and amount depending on cost, availability and our decisions regarding risk retention, and may be insufficient or unavailable to protect us against losses.
A significant disruption in, or breach in security of, our information technology systems could adversely affect our business.
We rely on information technology systems, some of which are managed by third parties, to process, transmit and store electronic information, and to manage or support a variety of critical business processes and activities. We also collect and store sensitive data, including confidential business information and personal data. These systems may be susceptible to damage, disruptions or shutdowns due to attacks by computer hackers, computer viruses, employee error or malfeasance, power outages, hardware failures, telecommunication or utility failures, catastrophes or other unforeseen events. Upgrading our information technology systems is costly and subject to delay, and there is no assurance new systems will provide the benefits expected. In addition, security breaches of our systems could result in the misappropriation or unauthorized disclosure of confidential information or personal data belonging to us or to our employees, partners, customers or suppliers. Any such events could disrupt our operations, delay production and shipments, result in defective products or services, damage customer relationships and our reputation and result in legal claims or proceedings, liability or penalties under privacy laws, each of which could adversely affect our business and our financial condition.
Litigation or compliance failures could adversely affect our profitability.
The nature of our businesses expose us to various litigation matters, including product liability claims, employment, health and safety matters, intellectual property infringement claims, commercial disputes, or acquisition or divestiture-related matters. We contest these matters vigorously and make insurance claims where appropriate. However, litigation is inherently costly and unpredictable, making it difficult to accurately estimate the outcome of any litigation. These lawsuits may include claims for compensatory damages, punitive and consequential damages and/or injunctive relief. The defense of these lawsuits may divert our management's attention, we may incur significant expenses in defending these lawsuits, and we may be required to pay damage awards or settlements or become subject to equitable remedies that could adversely affect our operations and financial condition. Moreover, any insurance or indemnification rights that we may have may be insufficient or unavailable to protect us against such losses. In addition, developments in legal proceedings in any given period may require us to adjust the loss contingency estimates that we have recorded in our consolidated financial statements, record estimates or reserves for liabilities or assets previously not susceptible of reasonable estimates or pay cash settlements or judgments. Any of these developments could adversely affect our financial condition in any particular period. Although we make accruals as we believe warranted, the amounts that we accrue could vary significantly from any amounts we actually pay due to the inherent uncertainties in the estimation process.
Our businesses are subject to extensive regulation; failure to comply with those regulations could adversely affect our financial condition and reputation.
Page | 9
Our businesses are subject to extensive regulation by U.S. and non-U.S. governmental and self-regulatory entities at the federal, state and local levels, including laws related to anti-corruption, environmental matters, health and safety, import laws and export control and economic sanctions, and the sale of products and services to government entities.
In addition, the Dodd-Frank Wall Street Reform and Consumer Protection Act contains provisions to improve transparency and accountability concerning the supply of certain minerals, known as conflict minerals, originating from the Democratic Republic of Congo ("DRC") and adjoining countries. As a result, the SEC has adopted annual disclosure and reporting requirements for those companies who use conflict minerals mined from the DRC and adjoining countries in their products. The implementation of these rules could adversely affect the sourcing, supply and pricing of materials used in our products. As there may be only a limited number of suppliers offering "conflict free" conflict minerals, we cannot be sure that we will be able to obtain necessary conflict minerals from such suppliers in sufficient quantities or at competitive prices. Also, we may face reputational challenges if we determine that certain of our products contain minerals not determined to be conflict free or if we are unable to sufficiently verify the origins for all conflict minerals used in our products through the procedures we may implement.
These are not the only regulations that our businesses must comply with. Failure to comply with these or any other regulations could result in civil and criminal, monetary and non-monetary penalties, damage to our reputation, disruptions to our business, limitations on our ability to manufacture, import, export and sell products and services, disbarment from selling to certain federal agencies, damage to our reputation and loss of customers and could cause us to incur significant legal and investigatory fees. Compliance with these and other regulations may also require us to incur significant expenses. Our products and operations are also often subject to the rules of industrial standards bodies such as the International Organization for Standardization (ISO), and failure to comply with these rules could result in withdrawal of certifications needed to sell our products and services and otherwise adversely impact our financial condition.
Our internal controls over financial reporting may not be effective, and our independent auditors may not be able to certify as to their effectiveness, which could have a significant and adverse effect on our business and reputation.
We are subject to the requirements of Section 404 of the Sarbanes-Oxley Act of 2002 and the rules and regulations of the SEC thereunder ("Section 404"). Section 404 requires us to report on the design and effectiveness of our internal controls over financial reporting. Section 404 also requires an independent registered public accounting firm to test our internal controls over financial reporting and report on the effectiveness of such controls. There can be no assurance that our auditors will issue an unqualified report attesting to our internal controls over financial reporting. As a result, there could be a negative reaction in the financial markets due to a loss of confidence in the reliability of our consolidated financial statements or our consolidated financial statements could change. Further, we completed the acquisition of JPS on July 2, 2015, and we have excluded the operations of this business from our evaluation of, and conclusion on, the effectiveness of our internal control over financial reporting as of December 31, 2015. Any failure to maintain or implement new or improved controls, or any difficulties we encounter in their implementation, could result in significant deficiencies or material weaknesses, and cause us to fail to meet our periodic reporting obligations, or result in material misstatements in our consolidated financial statements. We may also be required to incur costs to improve our internal control system and hire additional personnel. This could negatively impact our results of operations.
Risk Relating to Our Ownership Structure
Warren G. Lichtenstein, our Chairman, and certain other Officers and Directors, through their affiliation with Steel Partners Holdings GP Inc., have the ability to exert significant influence over our operations.
Steel Partners Holdings L.P. ("SPLP") owns directly or indirectly through its subsidiaries 8,560,592 shares of the Company's common stock, representing approximately 70.1% of the outstanding shares at December 31, 2015. SPLP may increase its ownership position in the Company's common stock in the future. The power to vote and dispose of the securities held by SPLP is controlled by Steel Partners Holdings GP Inc. ("SPH GP"). Warren G. Lichtenstein, our Chairman of the Board of Directors, is also the Executive Chairman of SPH GP. As Executive Chairman of our majority owner, Mr. Lichtenstein has the ability to exert significant influence over our policies and affairs and over the outcome of any action requiring a stockholder vote, including the election of our Board of Directors, the approval of amendments to our amended and restated certificate of incorporation, and the approval of mergers or sales of substantially all of our assets. The interests of Mr. Lichtenstein and SPH GP in such matters may differ from the interests of our other stockholders in some respects. In addition, certain other affiliates of SPH GP hold positions with HNH, including Jack L. Howard as Vice Chairman and Principal Executive Officer, John H. McNamara Jr., as Director, James F. McCabe, Jr., as Senior Vice President and Chief Financial Officer and Leonard J. McGill as Senior Vice President and Chief Legal Officer.
Factors Affecting the Value of Our Common Stock
Page | 10
Transfer restrictions contained in our charter and other factors could hinder the development of an active market for our common stock.
There can be no assurance as to the volume of shares of our common stock or the degree of price volatility for our common stock traded on the NASDAQ Capital Market. There are transfer restrictions contained in our charter to help preserve our net operating tax loss carryforwards that will generally prevent any person from acquiring amounts of our common stock such that such person would hold 5% or more of our common stock, for up to three years after July 29, 2015, as specifically provided in our charter. The transfer restrictions could hinder development of an active market for our common stock.
We do not anticipate paying dividends on our common stock in the foreseeable future, which may limit investor demand.
We do not anticipate paying any dividends on our common stock in the foreseeable future. Such lack of dividend prospects may have an adverse impact on the market demand for our common stock as certain institutional investors may invest only in dividend-paying equity securities or may operate under other restrictions that may prohibit or limit their ability to invest in our common stock.
Future offerings of our equity securities may result in dilution of our common stock and a reduction in the price of our common stock.
We are authorized to issue 180,000,000 shares of common stock. On February 25, 2016, 12,208,016 shares of common stock were outstanding. In addition, we are authorized to issue 5,000,000 shares of preferred stock. On February 25, 2016, no shares of our preferred stock were outstanding. Although our Board of Directors is expressly authorized to fix the designations, preferences and rights, limitations or restrictions of the preferred stock by adoption of a Preferred Stock Designation resolution, our Board of Directors has not yet done so. Our Board of Directors may elect to issue shares of common stock or preferred stock in the future to raise capital or for other financial needs. Any future issuances of equity may be at prices below the market price of our stock, and our stockholders may suffer significant dilution, and the terms of any preferred stock issuance may adversely affect the rights of our common stockholders.
Item 1B. | Unresolved Staff Comments |
There are no unresolved SEC Staff comments.
Item 2. | Properties |
As of December 31, 2015, the Company had 23 active operating plants in the United States, Canada, China, United Kingdom, Germany, France, Poland and Mexico, with a total area of approximately 2,676,389 square feet, including warehouse, office, sales, service and laboratory space. The Company also owns or leases sales, service, office and warehouse facilities at 10 other locations in the United States, which have a total area of approximately 290,828 square feet, and owns or leases 5 non-operating locations with a total area of approximately 535,350 square feet. Manufacturing facilities are located in: Camden, Delaware; Addison, Illinois; Evansville, Indiana; Agawam, Massachusetts; Rockford, Minnesota; Middlesex, New Jersey; Arden and Statesville, North Carolina; St. Louis, Missouri; Anderson and Slater, South Carolina; Cudahy, Wisconsin; Warwick, Rhode Island; Toronto and Montreal, Canada; Matamoros, Mexico; Gwent, Wales, United Kingdom; Pansdorf, Germany; Riberac, France; Gliwice, Poland; and Suzhou, China. All plants are owned except for the Addison, Middlesex, Arden, Rockford, Montreal, Suzhou and one of two Gliwice plants, which are leased.
The Company considers its manufacturing plants and service facilities to be well maintained and efficiently equipped, and therefore suitable for the work being done. The productive capacity and extent of utilization of its facilities is dependent in some cases on general business conditions and in other cases on the seasonality of the utilization of its products. Capacity can be expanded at some locations.
Item 3. | Legal Proceedings |
In the ordinary course of our business, we are subject to periodic lawsuits, investigations, claims and proceedings, including, but not limited to, contractual disputes, employment, environmental, health and safety matters, as well as claims associated with our historical acquisitions and divestitures. Although we cannot predict with certainty the ultimate resolution of lawsuits, investigations, claims and proceedings asserted against us, we do not believe any currently pending legal proceeding to
Page | 11
which we are a party will have a material adverse effect on our business, prospects, financial condition, cash flows, results of operations or liquidity. Additional discussion of certain pending legal matters is included in Note 19 to our consolidated financial statements included in "Item 8 - Financial Statements and Supplementary Data" and is incorporated in its entirety into this Part 1, Item 3 by this reference.
Item 4. | Mine Safety Disclosures |
Not applicable.
Page | 12
PART II
Item 5. | Market for Registrant's Common Equity, Related Stockholder Matters and Issuer Purchases of Equity Securities |
Market Price of Our Common Stock
The Company's common stock is listed on the NASDAQ Capital Market under the symbol "HNH." The price range per share reflected in the table below is the highest and lowest per share sales price for our stock as reported by the NASDAQ Capital Market during each quarter of the two most recent years.
2015 | HIGH | LOW | ||||||
First Quarter | $ | 48.17 | $ | 39.21 | ||||
Second Quarter | $ | 42.32 | $ | 30.95 | ||||
Third Quarter | $ | 34.54 | $ | 23.77 | ||||
Fourth Quarter | $ | 26.85 | $ | 19.00 | ||||
2014 | HIGH | LOW | ||||||
First Quarter | $ | 23.68 | $ | 18.02 | ||||
Second Quarter | $ | 26.77 | $ | 20.66 | ||||
Third Quarter | $ | 27.14 | $ | 21.66 | ||||
Fourth Quarter | $ | 46.51 | $ | 27.89 | ||||
The number of shares of common stock outstanding on February 25, 2016 was 12,208,016. Also, on February 25, 2016, there were approximately 122 holders of record of common stock, and the closing price per share of our common stock was $17.67.
Dividend Policy
The Company has never declared or paid any cash dividends on its common stock. The Company intends to retain any future earnings and does not expect to pay any dividends in the foreseeable future. H&H Group is restricted by the terms of its financing agreements in making dividends to HNH.
Securities Authorized for Issuance Under Equity Compensation Plans
The following table details information regarding our existing equity compensation plans as of December 31, 2015.
Equity Compensation Plan Information | ||||||||||
Plan Category | Number of securities to be issued upon exercise of outstanding options, warrants and rights | Weighted-average exercise price of outstanding options, warrants and rights | Number of securities remaining available for future issuance under equity compensation plans (excluding securities reflected in first column) | |||||||
Equity compensation plans approved by security holders | 13,000 | $ | 90.00 | 661,594 | ||||||
Equity compensation plans not approved by security holders | — | — | — | |||||||
Total | 13,000 | $ | 90.00 | 661,594 | ||||||
Stock Performance Graph
The line graph below compares the cumulative total stockholder return on our common stock with the cumulative total return of the Russell 3000 Index and a peer group of five companies, which operate in similar industries to the Company's five operating segments, that includes: AK Steel Holding Corporation, Materion Corporation, Quanex Building Products Corporation, Shiloh Industries Inc. and Core Molding Technologies, Inc. for the five years ended December 31, 2015. The graph and table assume that $100 was invested on December 31, 2010 in each of our common stock, the Russell 3000 index and the peer group, and that all dividends were reinvested. We did not declare or pay any dividends during the comparison period. Core Molding
Page | 13
Technologies, Inc. was added to our peer group in 2015 in connection with the acquisition of JPS and our associated new Performance Materials segment.
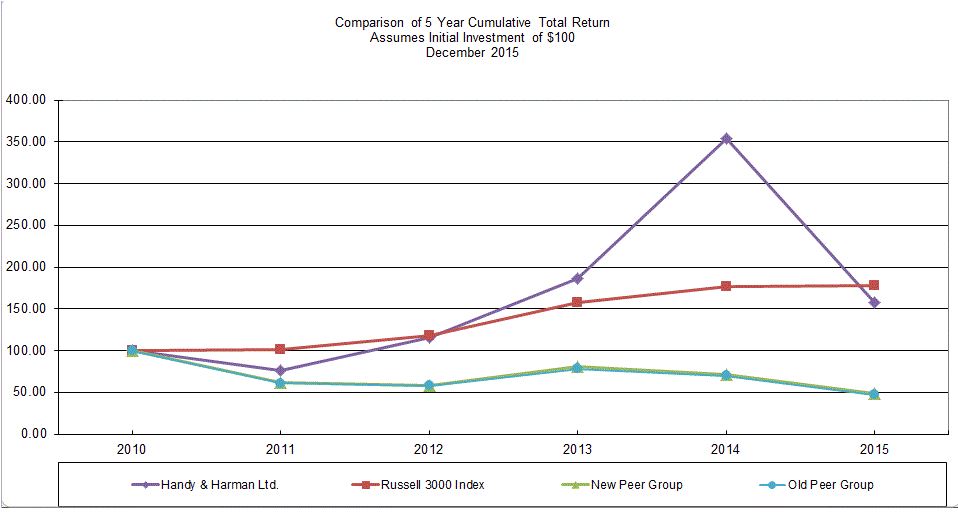
2010 | 2011 | 2012 | 2013 | 2014 | 2015 | |||||||||||||||||||
HNH | $ | 100.00 | $ | 76.04 | $ | 115.75 | $ | 185.94 | $ | 353.53 | $ | 157.53 | ||||||||||||
Russell 3000 Index | $ | 100.00 | $ | 101.03 | $ | 117.61 | $ | 157.07 | $ | 176.79 | $ | 177.64 | ||||||||||||
New Peer Group | $ | 100.00 | $ | 61.81 | $ | 58.57 | $ | 80.26 | $ | 71.80 | $ | 49.08 | ||||||||||||
Old Peer Group | $ | 100.00 | $ | 60.89 | $ | 57.92 | $ | 78.42 | $ | 69.80 | $ | 47.07 | ||||||||||||
The unit price performance included in this graph is not necessarily indicative of future unit price performance.
The stock performance graph shall not be deemed to be incorporated by reference by means of any general statement incorporating by reference this Form 10-K into any filing under the Securities Act or the Exchange Act, except to the extent that we specifically incorporate such information by reference, and shall not otherwise be deemed filed under such acts.
Issuer Purchases of Equity Securities
There were no issuer purchases of its equity securities during the three months ended December 31, 2015.
Item 6. | Selected Financial Data |
The following table summarizes certain selected consolidated financial data, which should be read in conjunction with our consolidated financial statements and the notes thereto and with "Item 7 - Management's Discussion and Analysis of Financial Condition and Results of Operations" included elsewhere in this Annual Report on Form 10-K. The selected consolidated financial data has been derived from our annual consolidated financial statements.
Page | 14
(in thousands, except per share amounts) | 2015 (a) | 2014 (b) | 2013 (c) | 2012 | 2011 (d) | |||||||||||||||
Consolidated Income Statement Data: | ||||||||||||||||||||
Net sales | $ | 649,468 | $ | 600,468 | $ | 571,164 | $ | 498,713 | $ | 498,842 | ||||||||||
Operating income | $ | 45,914 | $ | 45,720 | $ | 40,203 | $ | 38,401 | $ | 37,230 | ||||||||||
Income from continuing operations before tax and equity investment | $ | 41,520 | $ | 39,302 | $ | 27,496 | $ | 23,861 | $ | 20,092 | ||||||||||
Income from continuing operations, net of tax | $ | 16,991 | $ | 15,193 | $ | 21,341 | $ | 14,224 | $ | 128,371 | ||||||||||
Income from continuing operations, net of tax, per share-basic and diluted | $ | 1.49 | $ | 1.23 | $ | 1.61 | $ | 1.09 | $ | 10.22 | ||||||||||
Consolidated Balance Sheet Data: | ||||||||||||||||||||
Total assets | $ | 624,673 | $ | 538,759 | $ | 509,723 | $ | 512,361 | $ | 493,190 | ||||||||||
Total debt | $ | 99,568 | $ | 203,403 | $ | 157,191 | $ | 158,444 | $ | 163,281 | ||||||||||
(a) | 2015 operating income includes an asset impairment charge of $1.4 million associated with certain unused, real property located in Norristown, Pennsylvania. 2015 income from continuing operations, net of tax includes a $6.5 million loss from our investment in ModusLink. |
(b) | 2014 operating income includes asset impairment charges totaling $1.2 million associated with certain equipment owned by the Company's Joining Materials segment located in Toronto, Canada and certain unused, real property owned by the Company's Kasco segment located in Atlanta, Georgia. 2014 income from continuing operations, net of tax includes a $7.1 million loss from our investment in ModusLink. |
(c) | 2013 income from continuing operations before tax and equity investment includes expenses totaling $6.5 million associated with the Company's redemption of its outstanding 10% subordinated secured notes due 2017 ("Subordinated Notes"). Income from continuing operations, net of tax in 2013 includes a $6.0 million gain from our investment in ModusLink. |
(d) | Income from continuing operations, net of tax in 2011 reflects a tax benefit of $108.3 million, primarily due to the reversal of a deferred income tax valuation allowance. |
Item 7. | Management's Discussion and Analysis of Financial Condition and Results of Operations |
The following discussion and analysis of our financial condition and results of operations should be read in conjunction with our consolidated financial statements and related notes thereto that are available elsewhere in this Annual Report on Form 10-K. The following is a discussion and analysis of HNH's consolidated results of operations for the years ended December 31, 2015, 2014 and 2013. In addition to historical consolidated financial information, the following discussion contains forward-looking statements that reflect our plans, estimates and beliefs. Our actual results could differ materially from those discussed in the forward-looking statements. Factors that could cause or contribute to these differences include those discussed below and elsewhere in this Annual Report on Form 10-K, particularly in "Item 1A - Risk Factors."
Business Segments
HNH's business units encompass the following segments: Joining Materials, Tubing, Building Materials, Performance Materials and Kasco. Management has determined that certain operating companies should be aggregated and presented within a single segment on the basis that such segments have similar economic characteristics and share other qualitative characteristics. Management reviews net sales, gross profit and operating income to evaluate segment performance. Operating income for the segments generally includes costs directly attributable to the segment and excludes other unallocated general corporate expenses. Interest expense, other income and expense, and income taxes are not presented by segment since they are excluded from the measures of segment profitability reviewed by the Company's management. For a more complete description of the Company's business segments, see "Item 1 - Business - Products and Product Mix."
Recent Developments
During 2015, we entered into a series of transactions to improve liquidity, enhance our product offerings and position us for growth in our niche markets.
• | We completed the sale of Arlon, LLC, which operations comprised substantially all of the Company's former Arlon segment, for $155.5 million in cash, reflecting transaction fees, a final working capital adjustment and certain reductions as provided in the stock purchase agreement. |
Page | 15
• | We acquired ITW for $27.4 million in cash, including a final working capital adjustment. ITW was the exclusive supplier of certain adhesive products to our Building Materials segment, and the acquisition will provide us with greater control of our supply chain and allow us to expand our product development initiatives. |
• | We acquired all of the outstanding shares of common stock of JPS not already owned by HNH's affiliates for $11.00 per share in cash, with the remaining JPS shares acquired from HNH's affiliates through the issuance of 1,429,407 HNH common shares, for a total purchase price of $114.5 million. The Performance Materials segment is currently comprised solely of the operations of JPS. |
• | We made investments in capital projects totaling $15.2 million. |
• | We purchased an additional 2,053,710 shares of ModusLink common stock, increasing the Company's and its affiliates' combined ownership percentage in ModusLink to 31.5%. |
Results of Operations
Comparison of the Years Ended December 31, 2015 and 2014
The Company's consolidated operating results for the years ended December 31, 2015 and 2014 are summarized in the following table:
Year Ended | ||||||||
December 31, | ||||||||
(in thousands) | 2015 | 2014 | ||||||
Net sales | $ | 649,468 | $ | 600,468 | ||||
Gross profit | 178,214 | 164,779 | ||||||
Gross profit margin | 27.4 | % | 27.4 | % | ||||
Selling, general and administrative expenses | 123,422 | 114,141 | ||||||
Pension expense | 7,480 | 3,739 | ||||||
Asset impairment charges | 1,398 | 1,179 | ||||||
Operating income | 45,914 | 45,720 | ||||||
Other: | ||||||||
Interest expense | 4,598 | 7,544 | ||||||
Realized and unrealized gain on derivatives | (588 | ) | (1,307 | ) | ||||
Other expense | 384 | 181 | ||||||
Income from continuing operations before tax and equity investment | 41,520 | 39,302 | ||||||
Tax provision | 17,997 | 17,008 | ||||||
Loss from associated company, net of tax | 6,532 | 7,101 | ||||||
Income from continuing operations, net of tax | $ | 16,991 | $ | 15,193 | ||||
Net Sales
Net sales for the year ended December 31, 2015 increased by $49.0 million, or 8.2%, to $649.5 million, as compared to $600.5 million in 2014. The change in net sales reflects approximately $59.5 million in incremental sales associated with our acquisition of JPS and a net increase from core growth of approximately $6.5 million, which was partially offset by a reduction of approximately $17.1 million in net sales due to lower average silver prices. Excluding the impact of the JPS acquisition, our value added sales, defined as net sales less revenue from the direct purchase and resale of precious metals, increased by approximately $6.5 million on higher volume, primarily from the Building Materials segment. The average silver market price was approximately $15.70 per troy ounce during 2015, as compared to $19.05 per troy ounce in 2014.
Gross Profit
Gross profit for the year ended December 31, 2015 increased to $178.2 million, as compared to $164.8 million in 2014, and was consistent with 2014 as a percentage of net sales. The change in gross profit reflects a net increase from core growth of approximately $5.5 million, and the incremental gross profit and lower manufacturing costs resulting from the JPS and ITW acquisitions, which were partially offset by a reduction of approximately $2.3 million in gross profit due to lower average silver prices. Higher sales volume from the Building Materials segment and Kasco segment led to the increase in gross profit from our
Page | 16
core business. Gross profit in the 2015 period also reflects $3.4 million of nonrecurring expense associated with the amortization of the fair value adjustment to acquisition-date inventories associated with the JPS acquisition.
Selling, General and Administrative Expenses
Selling, general and administrative expenses ("SG&A") for the year ended December 31, 2015 were $123.4 million, as compared to $114.1 million in 2014. SG&A expenses from the Performance Materials segment were approximately $4.9 million during 2015. Excluding the impact of the JPS acquisition, the increased SG&A during 2015 was driven by higher personnel costs and business development expenses, primarily associated with our 2015 acquisitions, which were partially offset by lower stock-based compensation charges.
Pension Expense
Pension expense was $7.5 million for the year ended December 31, 2015, which was $3.7 million higher than 2014. The increased pension expense was due to a decline in discount rates based on changes in corporate bond yields, an increase in participant life expectancy reflected in revised mortality assumptions, and also due to the fact that the investment returns on the assets of the WHX Pension Plan were lower than actuarial assumptions during 2014, which were partially offset by income of $0.5 million from the JPS Pension Plan from the date of acquisition to December 31, 2015. We currently expect pension expense to be approximately $8.8 million in 2016.
Asset Impairment Charges
In the fourth quarter of 2015, a non-cash asset impairment charge of $1.4 million was recorded related to certain unused, real property located in Norristown, Pennsylvania to reflect its current market value.
In the fourth quarter of 2014, a non-cash asset impairment charge of $0.6 million was recorded related to certain equipment owned by the Company's Joining Materials segment located in Toronto, Canada to be sold or scrapped as part of the Company's integration activities associated with the Wolverine Joining acquisition. In addition, the Company recorded a $0.6 million non-cash asset impairment charge associated with certain unused, real property owned by the Company's Kasco segment located in Atlanta, Georgia in the fourth quarter of 2014.
Interest Expense
Interest expense for the year ended December 31, 2015 was $4.6 million, as compared to $7.5 million in 2014. The lower interest expense was primarily due to lower borrowing levels and lower average interest rates in 2015.
Realized and Unrealized Gain on Derivatives
H&H utilizes commodity forward and futures contracts to mitigate the impact of price fluctuations on its precious metal and certain non-precious metal inventories. The factors that affect the gain or loss on these derivative instruments are changes in the price of the associated metals and the amount of ounces hedged.
Tax Provision
For the years ended December 31, 2015 and 2014, tax provisions from continuing operations of $18.0 million and $17.0 million, respectively, were recorded. The effective tax rates in the years ended December 31, 2015 and 2014 were 43.3% and 43.3%, respectively. Changes in the effective tax rate arise principally from differences in the mix of income between taxable jurisdictions, including the impact of foreign sourced income, as well as changes in estimates associated with our state tax rates.
Loss from Associated Company
The Company carries its investment in ModusLink at fair value, calculated based on the closing market price for ModusLink common stock, and the losses recorded during the years ended December 31, 2015 and 2014 are due entirely to changes in the share price of ModusLink's common stock.
Segment Analysis
The following table summarizes information about HNH's segment operating results for the years ended December 31, 2015 and 2014:
Page | 17
Year Ended | |||||||||||||||
December 31, | |||||||||||||||
(in thousands) | 2015 | 2014 | Inc./(Decr.) | % Change | |||||||||||
Net sales: | |||||||||||||||
Joining Materials | $ | 182,702 | $ | 207,320 | $ | (24,618 | ) | (11.9 | )% | ||||||
Tubing | 79,539 | 81,264 | (1,725 | ) | (2.1 | )% | |||||||||
Building Materials | 266,859 | 253,644 | 13,215 | 5.2 | % | ||||||||||
Performance Materials | 59,535 | — | 59,535 | N/A | |||||||||||
Kasco | 60,833 | 58,240 | 2,593 | 4.5 | % | ||||||||||
Total net sales | $ | 649,468 | $ | 600,468 | $ | 49,000 | 8.2 | % | |||||||
Segment operating income (loss): | |||||||||||||||
Joining Materials (a) | $ | 19,906 | $ | 19,428 | $ | 478 | 2.5 | % | |||||||
Tubing | 13,081 | 13,340 | (259 | ) | (1.9 | )% | |||||||||
Building Materials | 37,480 | 30,217 | 7,263 | 24.0 | % | ||||||||||
Performance Materials | (2,212 | ) | — | (2,212 | ) | N/A | |||||||||
Kasco (b) | 4,336 | 3,176 | 1,160 | 36.5 | % | ||||||||||
Total segment operating income | $ | 72,591 | $ | 66,161 | $ | 6,430 | 9.7 | % | |||||||
(a) | The results of the Joining Materials segment in 2014 include a non-cash impairment charge of $0.6 million related to certain equipment located in Toronto, Canada to be sold or scrapped as part of the Company's integration activities associated with the Wolverine Joining acquisition. |
(b) | The results of the Kasco segment in 2014 include a non-cash impairment charge of $0.6 million related to certain unused, real property located in Atlanta, Georgia. |
Joining Materials
For the year ended December 31, 2015, the Joining Materials segment net sales decreased by $24.6 million, or 11.9%, to $182.7 million, as compared to net sales of $207.3 million in 2014. The change in net sales reflects a reduction of approximately $17.1 million in net sales due to a $3.35 per troy ounce decline in the average market price of silver and lower value added sales volume, primarily in North America, due to reduced demand from the oil and gas markets.
Segment operating income for the year ended December 31, 2015 increased by $0.5 million, or 2.5%, to $19.9 million, as compared to $19.4 million in 2014. Higher operating income in 2015 was principally due to improved product mix, lower plant overhead costs and reduced SG&A due to higher severance and recruitment costs incurred during 2014, partially offset by the reduced sales volume and lower silver prices. The effect of lower average silver prices reduced operating income by approximately $2.3 million in 2015.
Tubing
For the year ended December 31, 2015, the Tubing segment net sales decreased by $1.7 million, or 2.1%, to $79.5 million, as compared to $81.3 million in 2014. The decrease was primarily driven by reduced demand for our welded carbon and stainless steel products in the energy services, oil and gas, and chemical processing markets, due to historically low crude oil prices in 2015.
Segment operating income for the year ended December 31, 2015 decreased by $0.3 million, or 1.9%, to $13.1 million, as compared to $13.3 million in 2014. Lower operating income for the year ended December 31, 2015, as compared to 2014, was primarily driven by lower sales volume and higher SG&A, as a result of higher personnel costs, partially offset by lower plant overhead and operating costs.
Building Materials
For the year ended December 31, 2015, the Building Materials segment net sales increased by $13.2 million, or 5.2%, to $266.9 million, as compared to $253.6 million in 2014. Sales of both our roofing and FastenMaster products were higher, as compared to 2014, due to growth from our company branded and roof edge roofing products and strong demand from home centers and lumberyards for our FastenMaster products.
Page | 18
Segment operating income increased by $7.3 million, or 24.0%, to $37.5 million for the year ended December 31, 2015, as compared to $30.2 million in 2014, reflecting higher sales volume and lower manufacturing costs. Gross profit margin in 2015 was higher, as compared to 2014, primarily due to lower manufacturing costs as a result of the ITW acquisition and favorable overhead absorption, partially offset by higher freight costs, in part due to the West Coast port slowdown in early 2015, as well as costs associated with the consolidation of our Midwest manufacturing and warehouse facilities into a single location. SG&A also increased, reflecting increased employee headcount and benefit costs.
Performance Materials
As indicated above, the Performance Materials segment is currently comprised solely of the operations of JPS, which were acquired on July 2, 2015.
For the year ended December 31, 2015, the Performance Materials segment net sales were $59.5 million, driven by continued strong demand for fiberglass fabrics from the aerospace sector, partially offset by weakness in a number of industrial markets, including power generation, oil and gas, and electronics. Decreased domestic defense spending and troop drawdowns have also reduced demand for military ballistic materials.
Segment operating loss was $2.2 million for the year ended December 31, 2015, primarily due to $3.4 million of nonrecurring expense recorded during the year associated with the amortization of the fair value adjustment to acquisition-date inventories, as well as the impact of integration costs totaling $0.4 million recorded in 2015. Segment operating loss also includes depreciation and amortization expense totaling $4.9 million, reflecting the fair value of acquired assets recognized at the acquisition date of JPS.
Kasco
Kasco segment net sales increased by $2.6 million, or 4.5%, to $60.8 million in 2015, as compared to $58.2 million in 2014, due to higher sales from its domestic route business, partially offset by lower sales from its Canadian and European operations, primarily due to a negative impact from changes in foreign currency exchange rates.
Segment operating income increased by $1.2 million, or 36.5%, to $4.3 million in 2015, as compared to $3.2 million in 2014. Gross profit increased in 2015 primarily due to the higher net sales, as well as lower fuel costs, as compared with 2014. These improvements were partially offset by increased personnel costs to support the higher sales. Kasco also recorded a $0.6 million asset impairment charge associated with certain unused, real property located in Atlanta, Georgia in 2014.
Comparison of the Years Ended December 31, 2014 and 2013
The Company's consolidated operating results for the years ended December 31, 2014 and 2013 are summarized in the following table:
Page | 19
Year Ended | ||||||||
December 31, | ||||||||
(in thousands) | 2014 | 2013 | ||||||
Net sales | $ | 600,468 | $ | 571,164 | ||||
Gross profit | 164,779 | 159,822 | ||||||
Gross profit margin | 27.4 | % | 28.0 | % | ||||
Selling, general and administrative expenses | 114,141 | 114,413 | ||||||
Pension expense | 3,739 | 5,206 | ||||||
Asset impairment charges | 1,179 | — | ||||||
Operating income | 45,720 | 40,203 | ||||||
Other: | ||||||||
Interest expense | 7,544 | 13,662 | ||||||
Realized and unrealized gain on derivatives | (1,307 | ) | (1,195 | ) | ||||
Other expense | 181 | 240 | ||||||
Income from continuing operations before tax and equity investment | 39,302 | 27,496 | ||||||
Tax provision | 17,008 | 12,161 | ||||||
Loss (gain) from associated company, net of tax | 7,101 | (6,006 | ) | |||||
Income from continuing operations, net of tax | $ | 15,193 | $ | 21,341 | ||||
Net Sales
Net sales for the year ended December 31, 2014 increased by $29.3 million, or 5.1%, to $600.5 million, as compared to $571.2 million in 2013. The change in net sales reflects approximately $26.7 million in incremental sales associated with our historical acquisitions and a net increase from core growth of approximately $27.8 million, which were partially offset by a reduction of approximately $25.2 million in net sales due to lower average precious metal prices, principally due to silver. The acquisitions of Wolverine Joining and PAM, net of sales volume transferred to or from the acquired business units as part of the Company's integration activities, provided incremental net sales of approximately $16.7 million and $10.0 million, respectively, during the year ended December 31, 2014. Excluding the impact of these acquisitions, value added sales increased by approximately $27.8 million on higher volume, primarily from the Building Materials and Joining Materials segments, which were partially offset by lower sales volume from the Tubing segment. The average silver market price was approximately $19.05 per troy ounce during 2014, as compared to $23.79 per troy ounce in 2013.
Gross Profit
Gross profit for the year ended December 31, 2014 increased to $164.8 million, as compared to $159.8 million in 2013. Gross profit as a percentage of net sales decreased to 27.4%, as compared to 28.0% in 2013. The decrease of 0.6% was principally due to unfavorable production variances in the Tubing segment driven by lower sales volume, along with higher international freight costs and a change in product mix in the Building Materials segment, which were partially offset by favorable sales mix in the Joining Materials segment. The change in gross profit reflects approximately $4.0 million in incremental gross profit associated with our historical acquisitions and a net increase from core growth of approximately $4.0 million, which were partially offset by a reduction of approximately $3.0 million in gross profit due to lower average precious metal prices. The acquisitions of Wolverine Joining and PAM, net of sales volume transferred to or from the acquired business units as part of the Company's integration activities, provided incremental gross profit of approximately $1.2 million and $2.8 million, respectively, for the year ended December 31, 2014. Higher sales volume from the Building Materials and Joining Materials segments led to the increase in gross profit from our core business, which was partially offset by unfavorable production variances, leading to a decline in gross profit margin, in the Tubing segment due to lower sales volume.
Selling, General and Administrative Expenses
SG&A for the year ended December 31, 2014 was $114.1 million, as compared to $114.4 million in 2013. The $0.3 million reduction in 2014 was driven by a decrease of approximately $3.4 million from our core business in 2014, primarily due to the recording of insurance reimbursements totaling $3.1 million, as compared to similar reimbursements of $1.1 million in
Page | 20
2013, as well as lower benefit costs and reduced business development expenses, which were partially offset by approximately $3.1 million in incremental expenses from the Wolverine Joining and PAM acquisitions.
Pension Expense
Pension expense was $3.7 million for the year ended December 31, 2014, which was $1.5 million lower than 2013. The decrease in pension expense was primarily due to an increase in the discount rate utilized to determine net periodic pension costs, based on rising interest rates, as well as strong returns on pension plan assets during 2013.
Asset Impairment Charges
In the fourth quarter of 2014, a non-cash asset impairment charge of $0.6 million was recorded related to certain equipment owned by the Company's Joining Materials segment located in Toronto, Canada to be sold or scrapped as part of the Company's integration activities associated with the Wolverine Joining acquisition. In addition, the Company recorded a $0.6 million asset impairment charge associated with certain unused, real property owned by the Company's Kasco segment located in Atlanta, Georgia in the fourth quarter of 2014.
Interest Expense
Interest expense for the year ended December 31, 2014 was $7.5 million, as compared to $13.7 million in 2013. Interest expense for the year ended December 31, 2013 included a $5.7 million loss associated with the Company's redemption of its Subordinated Notes, including the redemption premium and the write-off of remaining deferred finance costs and unamortized debt discounts. The Company's average interest rate was also lower for the year ended December 31, 2014, principally due to the Company's redemption of the Subordinated Notes and a decrease in the applicable interest rate margin associated with the Company's new senior credit facility, but was offset by increased average borrowing levels in the second half of 2014.
Realized and Unrealized Gain on Derivatives
Realized and unrealized gain (loss) on derivatives for the years ended December 31, 2014 and 2013 were as follows:
(in thousands) | Year Ended | |||||||
December 31, | ||||||||
Derivative | 2014 | 2013 | ||||||
Commodity contracts (economic hedges) | $ | 1,307 | $ | 1,988 | ||||
Derivative features of Subordinated Notes | — | (793 | ) | |||||
Total realized and unrealized gain on derivatives | $ | 1,307 | $ | 1,195 | ||||
H&H utilizes commodity forward and futures contracts to mitigate the impact of price fluctuations on its precious metal and certain non-precious metal inventories. The factors that affect the gain or loss on these derivative instruments are changes in the price of the associated metals and the amount of ounces hedged. In addition, the Company's Subordinated Notes had embedded call premiums and warrants associated with them. The Company treated the fair value of these features together as both a discount on the debt and a derivative liability prior to the redemption of the Subordinated Notes and warrants in the first quarter of 2013. Upon redemption, the value of the derivative was removed from the balance sheet and such write-off is included in the $0.8 million loss noted above.
Tax Provision
For the years ended December 31, 2014 and 2013, tax provisions from continuing operations of $17.0 million and $12.2 million, respectively, were recorded. The effective tax rates in the years ended December 31, 2014 and 2013 were 43.3% and 44.2%, respectively. Changes in the effective tax rate arise principally from differences in the mix of income between taxable jurisdictions, including the impact of foreign sourced income.
Loss (Gain) from Associated Company
As described in Note 10 to its consolidated financial statements included in "Item 8 - Financial Statements and Supplementary Data," the Company concluded that it gained significant influence over the operating and financial policies of ModusLink during the first quarter of 2013. The $6.0 million gain from associated company, net of tax, for the year ended
Page | 21
December 31, 2013 includes the impact of the reclassification of the Company's historical unrealized loss associated with this investment from accumulated other comprehensive loss to earnings. HNH has elected the option to value its investment in ModusLink using fair value in order to more appropriately reflect the value of the investment in its consolidated financial statements, and the loss recorded during the year ended December 31, 2014 is due entirely to changes in the share price of ModusLink's common stock.
Segment Analysis
The following table summarizes information about HNH's segment operating results for the years ended December 31, 2014 and 2013:
Year Ended | |||||||||||||||
December 31, | |||||||||||||||
(in thousands) | 2014 | 2013 | Inc./(Decr.) | % Change | |||||||||||
Net sales: | |||||||||||||||
Joining Materials | $ | 207,320 | $ | 195,187 | $ | 12,133 | 6.2 | % | |||||||
Tubing | 81,264 | 91,002 | (9,738 | ) | (10.7 | )% | |||||||||
Building Materials | 253,644 | 226,806 | 26,838 | 11.8 | % | ||||||||||
Kasco | 58,240 | 58,169 | 71 | 0.1 | % | ||||||||||
Total net sales | $ | 600,468 | $ | 571,164 | $ | 29,304 | 5.1 | % | |||||||
Segment operating income: | |||||||||||||||
Joining Materials (a) | $ | 19,428 | $ | 16,624 | $ | 2,804 | 16.9 | % | |||||||
Tubing | 13,340 | 17,434 | (4,094 | ) | (23.5 | )% | |||||||||
Building Materials | 30,217 | 27,789 | 2,428 | 8.7 | % | ||||||||||
Kasco (b) | 3,176 | 4,496 | (1,320 | ) | (29.4 | )% | |||||||||
Total segment operating income | $ | 66,161 | $ | 66,343 | $ | (182 | ) | (0.3 | )% | ||||||
(a) | The results of the Joining Materials segment in 2014 include a non-cash impairment charge of $0.6 million related to certain equipment located in Toronto, Canada to be sold or scrapped as part of the Company's integration activities associated with the Wolverine Joining acquisition. |
(b) | The results of the Kasco segment in 2014 include a non-cash impairment charge of $0.6 million related to certain unused, real property located in Atlanta, Georgia. |
Joining Materials
For the year ended December 31, 2014, the Joining Materials segment net sales increased by $12.1 million, or 6.2%, to $207.3 million, as compared to net sales of $195.2 million in 2013. The change in net sales reflects approximately $16.7 million in incremental sales associated with the acquisition of Wolverine Joining and a net increase from core growth of approximately $20.6 million, which were partially offset by a reduction of approximately $25.2 million in net sales due to lower average precious metal prices, primarily due to a $4.74 per troy ounce decline in the average market price of silver. The core growth of approximately $20.6 million was due to overall higher sales volume, including increased sales for our distributed product and aluminum product lines, partially offset by softness from the European and refining markets.
Segment operating income for the year ended December 31, 2014 increased by $2.8 million, or 16.9%, to $19.4 million, as compared to $16.6 million in 2013, as a result of higher sales volume and favorable product mix, which were partially offset by reduced profit generated on the material portion of our products in the Joining Materials segment, due principally to lower average precious metal prices, as well as due to higher severance and recruitment costs incurred in the year ended December 31, 2014. The effect of lower average precious metal prices reduced operating income by approximately $3.0 million versus 2013.
Tubing
For the year ended December 31, 2014, the Tubing segment net sales decreased by $9.7 million, or 10.7%, to $81.3 million, as compared to $91.0 million in 2013. The decrease was primarily driven by lower sales volume of our seamless stainless steel tubing products in the chemical processing and oil and gas markets, partially offset by increased seamless stainless steel tubing sales in our precision materials product line and higher welded carbon steel tubing sales for the transportation market.
Page | 22
Segment operating income for the year ended December 31, 2014 decreased by $4.1 million, or 23.5%, to $13.3 million, as compared to $17.4 million in 2013. Gross profit was lower for the year ended December 31, 2014, as compared 2013, driven by the lower sales volume and associated unfavorable production variances.
Building Materials
For the year ended December 31, 2014, the Building Materials segment net sales increased by $26.8 million, or 11.8%, to $253.6 million, as compared to $226.8 million in 2013. The acquisition of PAM provided incremental net sales of approximately $10.0 million within the Building Materials segment for the year ended December 31, 2014, and sales of both roofing and FastenMaster products were higher, as compared to 2013, due to strong demand for roofing products in the private label sales channel and FastenMaster products from home centers and lumberyards.
Segment operating income increased by $2.4 million, or 8.7%, to $30.2 million for the year ended December 31, 2014, as compared to $27.8 million in 2013. Gross profit margin for the year ended December 31, 2014 was lower as compared to 2013, primarily due to higher international freight costs and a change in product mix. Higher SG&A reflected increased employee headcount and product development expenses. The acquisition of PAM provided incremental operating income of approximately $1.0 million within the Building Materials segment for the year ended December 31, 2014.
Kasco
Kasco segment net sales were $58.2 million for both the years ended December 31, 2014 and 2013, as sales improvements from its domestic operations were offset by lower sales from its Canadian operations.
Segment operating income decreased by $1.3 million, or 29.4%, to $3.2 million for the year ended December 31, 2014, as compared to $4.5 million in 2013. The reduced operating income was primarily due to higher overhead and severance costs, as compared with 2013, and reduced route productivity in the first quarter of 2014 due to adverse weather conditions. Kasco also recorded a $0.6 million asset impairment charge associated with certain unused, real property located in Atlanta, Georgia in the fourth quarter of 2014.
Discussion of Consolidated Cash Flows
Comparison of the Years Ended December 31, 2015 and 2014
The following table provides a summary of the Company's consolidated cash flows for the years ended December 31, 2015 and 2014:
Year Ended | ||||||||
(in thousands) | 2015 | 2014 | ||||||
Net cash provided by operating activities | $ | 58,335 | $ | 50,689 | ||||
Net cash provided by (used in) investing activities | 40,788 | (11,902 | ) | |||||
Net cash used in financing activities | (106,696 | ) | (17,143 | ) | ||||
Net change for the year | $ | (7,573 | ) | $ | 21,644 | |||
Operating Activities
Operating cash flows for the year ended December 31, 2015 provided $58.3 million, as compared to $50.7 million provided in 2014, primarily due to improvements in working capital levels. Trade and other receivables provided $5.4 million during 2015, as compared to a use of $0.8 million in 2014, and inventories provided $9.6 million during 2015, as compared to a use of $5.4 million in 2014. These improvements were primarily driven by lower fourth quarter sales volume and improved working capital management in the Performance Materials segment, as well as lower silver prices in the Joining Materials segment, partially offset by strong sales volume in the Building Materials segment during the fourth quarter of 2015, as compared to the fourth quarter of 2014. Discontinued operations used $2.3 million during 2015, as compared to a source of $18.6 million in 2014.
Investing Activities
Page | 23
Investing activities provided $40.8 million of cash for the year ended December 31, 2015 and used $11.9 million in 2014. Investing activities for the year ended December 31, 2015 included net proceeds of $155.5 million from the sale of Arlon, LLC, partially offset by acquisition costs of $92.9 million primarily related to the JPS and ITW acquisitions. During the third quarter of 2014, the Company received $3.7 million from the 2013 sale of Continental, which was previously held in escrow pending resolution of certain indemnification provisions contained in the sales agreement. Capital spending was $15.2 million in 2015, as compared with $12.7 million in 2014. The Company also invested approximately $7.6 million, including brokerage commissions, in the common stock of ModusLink in 2015, as compared with $1.5 million in 2014. Discontinued operations used $0.1 million in 2015, as compared to $2.9 million in 2014.
Financing Activities
For the year ended December 31, 2015, the Company's financing activities used $106.7 million of cash. Borrowings under the Company's revolving credit facility decreased by $104.3 million for the year ended December 31, 2015, primarily driven by cash proceeds from the sale of Arlon, LLC, partially offset by borrowings to fund the JPS and ITW acquisitions.
For the year ended December 31, 2014, the Company's financing activities used $17.1 million of cash. Net term loan repayments totaled $116.3 million, and the Company used $60.6 million for the repurchase of its common stock. Borrowings under the Company's revolving credit facilities increased by $162.4 million. The Company also initiated $12.6 million in borrowings on its new WHX CS Loan facility during the third quarter of 2014, which were fully repaid during the same quarter. The changes in the Company's financing structure during 2014 were primarily the result of the Company's entry into an amended and restated senior credit agreement on August 29, 2014, which also resulted in payments of approximately $3.2 million for deferred finance charges.
Comparison of the Years Ended December 31, 2014 and 2013
The following table provides a summary of the Company's consolidated cash flows for the years ended December 31, 2014 and 2013:
Year Ended | ||||||||
(in thousands) | 2014 | 2013 | ||||||
Net cash provided by operating activities | $ | 50,689 | $ | 49,163 | ||||
Net cash used in investing activities | (11,902 | ) | (36,875 | ) | ||||
Net cash used in financing activities | (17,143 | ) | (17,422 | ) | ||||
Net change for the year | $ | 21,644 | $ | (5,134 | ) | |||
Operating Activities
Operating cash flows for the year ended December 31, 2014 provided $50.7 million, as compared to $49.2 million in 2013, reflecting an increase in operating income of $5.5 million, which was partially offset by an increase in working capital. Trade and other receivables used $0.8 million during 2014, as compared to a source of $6.0 million in 2013, and inventories used $5.4 million during 2014, as compared to a source of $2.4 million in 2013. Such usages from both trade and other receivables and inventories reflect higher net sales in the fourth quarter of 2014, as compared to the fourth quarter in 2013. Other current liabilities used $18.6 million during 2014, as compared to $14.4 million in 2013, primarily due to higher pension contributions of $20.5 million during 2014, as compared to $13.1 million in 2013. Prepaid and other current assets provided $2.2 million during 2014, as compared to a use of $3.3 million in 2013, primarily due to the Company's precious metal hedging activities. Discontinued operations provided $18.6 million during 2014, as compared to $11.8 million in 2013.
Investing Activities
Investing activities used $11.9 million of cash for the year ended December 31, 2014 and used $36.9 million during 2013. Capital spending of $12.7 million in 2014 was comparable with $11.7 million in 2013. Investing activities included acquisition costs of $68.6 million, primarily related to Wolverine Joining and PAM in 2013, and also included proceeds from sale of discontinued operations of $45.3 million. The Company received $3.7 million during the third quarter of 2014 from the prior year sale of Continental, which was previously held in escrow pending resolution of certain indemnification provisions contained in the sales agreement. During 2014, the Company also invested approximately $1.5 million, including brokerage commissions, in the common stock of ModusLink.
Page | 24
Financing Activities
For the year ended December 31, 2014, the Company's financing activities used $17.1 million of cash. Net term loan repayments totaled $116.3 million, and the Company used $60.6 million for the repurchase of its common stock. Borrowings under the Company's revolving credit facilities increased by $162.4 million. The Company also initiated $12.6 million in borrowings on its new WHX CS Loan facility during the third quarter of 2014, which were fully repaid during the same quarter. The changes in the Company's financing structure during 2014 were primarily the result of the Company's entry into an amended and restated senior credit agreement on August 29, 2014, which also resulted in payments of approximately $3.2 million for deferred finance charges.
During 2013, the Company increased net borrowings on its revolving credit facility by $31.0 million and borrowed an additional $10.0 million on its senior term loan. These increases were offset by $36.3 million used for the repurchase of the Company's remaining Subordinated Notes and repayments of $9.3 million on its domestic term loans. The Company also used $9.8 million for the repurchase of its common stock during the year ended December 31, 2013.
Liquidity and Capital Resources
The Company's principal source of liquidity is its cash flows from operations. As of December 31, 2015, the Company's current assets totaled $190.2 million, its current liabilities totaled $71.0 million and its net working capital was $119.2 million, as compared to net working capital of $154.6 million as of December 31, 2014. The Company's debt is principally held by H&H Group, a wholly-owned subsidiary of HNH. HNH's subsidiaries borrow funds in order to finance capital expansion programs and for working capital needs. The terms of certain of those financing arrangements place restrictions on distributions of funds to HNH, the parent company, subject to certain exceptions including required pension payments to the WHX Pension Plan. The Company does not expect these restrictions to have an impact on its ability to meet its cash obligations. HNH's ongoing operating cash flow requirements consist primarily of arranging for the funding of the minimum requirements of the WHX Pension Plan and paying HNH's administrative costs. The Company expects to have required minimum contributions to the WHX Pension Plan of $16.1 million, $27.5 million, $32.9 million, $33.2 million, $32.0 million and $82.9 million in 2016, 2017, 2018, 2019, 2020 and for the five years thereafter, respectively. For the JPS Pension Plan, the Company expects to have required minimum pension plan contributions of $0.4 million, $6.8 million, $9.1 million, $5.6 million, $3.3 million and $9.6 million in 2016, 2017, 2018, 2019, 2020 and for the five years thereafter, respectively, which will be made by H&H Group. Such required future contributions are estimated based upon assumptions regarding such matters as discount rates on future obligations, assumed rates of return on plan assets and legislative changes. Actual future pension costs and required funding obligations will be affected by changes in the factors and assumptions described above, as well as other changes such as any plan termination or other acceleration events.
The Company believes it has access to adequate resources to meet its needs for normal operating costs, capital expenditures, mandatory debt redemptions and working capital for its existing business. These resources include cash and cash equivalents, cash provided by operating activities and unused lines of credit. On August 29, 2014, H&H Group entered into an amended and restated senior credit agreement, which provides for an up to $365.0 million senior secured revolving credit facility. As of December 31, 2015, H&H Group's availability under its senior secured revolving credit facility was $183.2 million, and as of January 31, 2016, it was $181.8 million. On October 5, 2015, a subsidiary of H&H refinanced an outstanding mortgage note, which had an original maturity in October 2015. Under the terms of the revised agreement, the subsidiary paid down $0.7 million of the original outstanding principal balance. The remaining outstanding principal balance of $5.4 million was refinanced and will be repaid in equal monthly installments totaling $0.4 million per year over the next five years, with a final principal payment of $3.6 million due at maturity of the loan in October 2020. The Company's ability to satisfy its debt service obligations, to fund planned capital expenditures and required pension payments, and to make acquisitions will depend upon its future operating performance, which will be affected by prevailing economic conditions in the markets in which it operates, as well as financial, business and other factors, some of which are beyond its control. In addition, the Company's senior secured revolving credit facility is subject to certain mandatory prepayment provisions and restrictive and financial covenants. There can be no assurances that H&H Group will continue to have access to its lines of credit if its financial performance does not satisfy the financial covenants set forth in the financing agreements. If H&H Group does not meet certain of its financial covenants, and if it is unable to secure necessary waivers or other amendments from the respective lenders on terms acceptable to management, its ability to access available lines of credit could be limited, its debt obligations could be accelerated by the respective lenders and liquidity could be adversely affected.
Management is utilizing the following strategies to continue to enhance liquidity: (1) continuing to implement improvements, using the Steel Business System, throughout all of the Company's operations to increase sales and operating efficiencies, (2) supporting profitable sales growth both internally and potentially through acquisitions and (3) evaluating from time to time and as appropriate, strategic alternatives with respect to its businesses and/or assets. The Company continues to examine all of its options and strategies, including acquisitions, divestitures and other corporate transactions, to increase cash flow and stockholder value. On February 5, 2016, HNH delivered a letter to SL Industries, Inc. ("SLI") formally proposing to acquire
Page | 25
all the outstanding shares of SLI for a cash purchase price of $35.50 per share, or approximately $140.6 million in total, subject to limited confirmatory due diligence. SLI designs, manufactures and markets power electronics, motion control, power protection, and power quality electromagnetic equipment that are used in a variety of medical, commercial and military aerospace, computer, datacom, industrial, and telecom applications.
Contractual Obligations
The following table summarizes the Company's contractual obligations at December 31, 2015 and the effects such obligations are expected to have on liquidity and cash flows in future periods:
Payments due by period | ||||||||||||||||||||
(in thousands) | Total | Less than 1 year | 1-3 years | 3-5 years | More than 5 years | |||||||||||||||
Long-term debt (a) | $ | 98,826 | $ | 1,720 | $ | 2,264 | $ | 94,842 | $ | — | ||||||||||
Estimated interest expense (a)(b) | $ | 8,819 | $ | 2,431 | $ | 4,726 | $ | 1,662 | $ | — | ||||||||||
Minimum pension contributions (c) | $ | 259,400 | $ | 16,500 | $ | 76,300 | $ | 74,100 | $ | 92,500 | ||||||||||
Lease commitments | $ | 11,299 | $ | 4,294 | $ | 4,159 | $ | 1,989 | $ | 857 | ||||||||||
(a) | Assumes repayment of the $90.6 million balance outstanding on H&H Group's senior secured revolving credit facility on its August 29, 2019 contractual maturity date. |
(b) | Estimated interest expense does not include non-cash amortization of debt issuance costs, which is included in interest expense in the Company's consolidated financial statements. The interest rates used to estimate future interest expense were based on interest rates at December 31, 2015. As the majority of the Company's long-term debt bears interest at variable rates, any future interest rate fluctuations will impact future cash payments. |
(c) | Represents total expected required minimum pension plan contributions to the WHX Pension Plan and the JPS Pension Plan for 2016, 2017, 2018, 2019, 2020 and for the five years thereafter. Actual future pension costs and required funding obligations will be affected by changes in the factors and assumptions described elsewhere in this Annual Report on Form 10-K, as well as other changes such as any plan termination or other acceleration events. |
The Company's facilities and operations are subject to extensive environmental laws and regulations imposed by federal, state, foreign and local authorities relating to the protection of the environment. Although it maintains insurance coverage for certain environmental matters, the Company could incur substantial costs, including cleanup costs, fines or sanctions, and third-party claims for property damage or personal injury, as a result of violations of, or liabilities under, environmental laws. The Company has incurred, and in the future may continue to incur, liability under environmental statutes and regulations with respect to the contamination detected at sites owned or operated by the Company (including contamination caused by prior owners and operators of such sites, abutters or other persons) and the sites at which it has disposed of hazardous substances. As of December 31, 2015, the Company established reserves totaling $2.5 million with respect to certain presently estimated environmental remediation costs. These reserves may not be adequate to cover the ultimate costs of remediation, including discovery of additional contaminants or the imposition of additional cleanup obligations, which could result in significant additional costs. In addition, the Company expects that future regulations, and changes in the text or interpretation of existing regulations, may subject it to increasingly stringent standards. Compliance with such requirements may make it necessary for the Company to retrofit existing facilities with additional pollution-control equipment, undertake new measures in connection with the storage, transportation, treatment and disposal of by-products and wastes or take other steps, which may be at a substantial cost to it.
Off-Balance Sheet Arrangements
It is not the Company's usual business practice to enter into off-balance sheet arrangements such as guarantees on loans and financial commitments, indemnification arrangements and retained interests in assets transferred to an unconsolidated entity for securitization purposes. Certain customers and suppliers of the Joining Materials segment choose to do business on a "pool" basis. Such customers or suppliers furnish precious metal to subsidiaries of H&H for return in fabricated form or for purchase from or return to the supplier. When the customer's precious metal is returned in fabricated form, the customer is charged a fabrication charge. The value of pooled precious metal is not included on the Company's consolidated balance sheet. As of December 31, 2015, customer metal in H&H's custody consisted of 160,363 ounces of silver, 535 ounces of gold and 1,391 ounces of palladium. The market value per ounce of silver, gold and palladium as of December 31, 2015 was $13.86, $1,062.25, and $547.00, respectively.
Critical Accounting Policies
Page | 26
The Company's discussion and analysis of financial condition and results of operations is based upon its consolidated financial statements, which have been prepared in conformity with accounting principles generally accepted in the United States of America ("U.S. GAAP"). Preparation of these financial statements requires the Company to make estimates and judgments that affect the reported amounts of assets, liabilities, revenues and expenses, and related disclosure of contingent assets and liabilities. Estimates are based on historical experience, expected future cash flows and various other assumptions that are believed to be reasonable under the circumstances, the results of which form the basis for making judgments about the carrying values of assets and liabilities that are not readily apparent from other sources. Actual results may differ from these estimates.
U.S. GAAP requires all companies to include a discussion of critical accounting policies or methods used in the preparation of financial statements. Note 2 to the Company's consolidated financial statements, included elsewhere in this Annual Report on Form 10-K, includes a summary of the significant accounting policies and methods used in the preparation of the consolidated financial statements. The following is a discussion of the critical accounting policies and methods used by the Company.
Goodwill, Other Intangibles and Long-Lived Assets
Goodwill represents the difference between the purchase price and the fair value of net assets acquired in a business combination. At December 31, 2015, the Company had recorded goodwill totaling $121.8 million. Goodwill is reviewed annually for impairment in accordance with U.S. GAAP as of the end of the fourth quarter. Goodwill impairment testing consists of a two-step process. Step 1 of the goodwill impairment test involves comparing the fair values of the applicable reporting units with their carrying values, including goodwill. If the carrying amount of a reporting unit exceeds the reporting unit's fair value, Step 2 of the goodwill impairment test is performed to determine the amount of impairment loss. An entity has the option to first assess qualitative factors to determine whether the existence of events or circumstances leads to a determination that it is more likely than not (more than 50%) that the estimated fair value of a reporting unit is less than its carrying amount. If an entity elects to perform a qualitative assessment and determines that an impairment is more likely than not, the entity is then required to perform the two-step quantitative impairment test; otherwise no further analysis is required. An entity also may elect not to perform the qualitative assessment and, instead, proceed directly to the two-step quantitative impairment test. The ultimate outcome of the goodwill impairment review for a reporting unit should be the same whether an entity chooses to perform the qualitative assessment or proceeds directly to the two-step quantitative impairment test. The Company utilized a qualitative approach to assess its goodwill as of its most recent assessment date.
The testing of goodwill for impairment is performed at a level referred to as a reporting unit. Goodwill is allocated to each reporting unit based on the goodwill valued in connection with each business combination consummated within each reporting unit. Four reporting units of the Company have goodwill assigned to them. The results of the Company's goodwill impairment testing indicated no impairment for all periods presented, and, based on its most recent assessment, the Company does not believe that any of its reporting units is at risk of failing Step 1 of the goodwill impairment test.
In evaluating whether it is more likely than not that the fair value of a reporting unit is less than its carrying amount, the Company assesses relevant events and circumstances, including: macroeconomic conditions; industry and market considerations; cost factors; overall financial performance; and other entity-specific events. The Company's current expectations associated with such factors could differ from future results, and the recoverability of goodwill may be impacted if the Company's estimated future operating cash flows are not achieved. The Company also uses judgment in assessing whether assets may have become impaired between annual impairment tests. Circumstances that could trigger an interim impairment test include, but are not limited to: the occurrence of a significant change in circumstances, such as continuing adverse business conditions or legal factors; an adverse action or assessment by a regulator; unanticipated competition; loss of key personnel; the likelihood that a reporting unit or significant portion of a reporting unit will be sold or otherwise disposed; or results of testing for recoverability of a significant asset group within a reporting unit.
Intangible assets with finite lives are amortized over their estimated useful lives. The Company also estimates the depreciable lives of property, plant and equipment, and reviews long-lived assets for impairment whenever events, or changes in circumstances, indicate the carrying amount of such assets may not be recoverable. The Company performs such assessments at the lowest level for which identifiable cash flows are largely independent of the cash flows of other assets and liabilities, which is generally at the plant level or the reporting unit level, dependent on the level of interdependencies in the Company's operations. Impairment losses are recorded on long-lived assets when indicators of impairment are present and the undiscounted cash flows estimated to be generated by those assets are less than the assets' carrying amounts. The impairment loss is measured by comparing the fair value of the asset to its carrying amount. The Company considers various factors in determining whether an impairment test is necessary, including among other things: a significant or prolonged deterioration in operating results and projected cash flows; significant changes in the extent or manner in which assets are used; technological advances with respect to assets which would potentially render them obsolete; the Company's strategy and capital planning; and the economic climate in the markets it
Page | 27
serves. When estimating future cash flows and if necessary, fair value, the Company makes judgments as to the expected utilization of assets and estimated future cash flows related to those assets. The Company considers historical and anticipated future results, general economic and market conditions, the impact of planned business and operational strategies and other information available at the time the estimates are made. The Company believes these estimates are reasonable; however, changes in circumstances or conditions could have a significant impact on its estimates, which might result in material impairment charges in the future.
Long-lived assets consisting of land and buildings used in previously operating businesses are carried at the lower of cost or fair value less cost to sell and are included primarily in other non-current assets in the Company's consolidated balance sheet. A reduction in the carrying value of such long-lived assets used in previously operating businesses is recorded as an asset impairment charge in the consolidated income statement.
Pension and Other Post-Retirement Benefit Costs
The Company maintains qualified and non-qualified pension plans and other post-retirement benefit plans. The Company recorded pension expense of $7.5 million for the year ended December 31, 2015, and, at December 31, 2015, the Company had recorded pension liabilities totaling $265.6 million. Pension benefits are generally based on years of service and the amount of compensation at the time of retirement. However, the qualified pension benefits have been frozen for all participants.
The Company's pension and other post-retirement benefit costs are developed from actuarial valuations. Inherent in these valuations are key assumptions, including discount and mortality rates, and expected long-term rates of return on plan assets. Material changes in the Company's pension and other post-retirement benefit costs may occur in the future due to changes in these assumptions, changes in the number of plan participants, changes in the level of benefits provided, changes to the level of contributions to these plans and other factors.
The Company determines its actuarial assumptions for its pension and other post-retirement plans on December 31 of each year to calculate liability information as of that date and pension and other post-retirement expense for the following year. The discount rate assumption is derived from the rate of return on high quality bonds as of December 31 of each year.
The Company's pension plan assets are diversified as to type of assets, investment strategies employed and number of investment managers used. Investments may include equities, fixed income, cash equivalents, convertible securities and private investment funds. Derivatives may be used as part of the investment strategy. The Company may direct the transfer of assets between investment managers in order to rebalance the portfolio in accordance with asset allocation guidelines established by the Company. The private investment funds, or the investment funds they are invested in, own marketable and non-marketable securities and other investment instruments. Such investments are valued by the private investment funds, underlying investment managers or the underlying investment funds at fair value, as described in their respective financial statements and offering memorandums. The Company utilizes these values in quantifying the value of the assets of its pension plans, which are then used in the determination of the unfunded pension liability on the consolidated balance sheet. Because of the inherent uncertainty of valuation of some of the pension plans' investments in private investment funds and the nature of some of the underlying investments held by the investment funds, the recorded value may differ from the value that would have been used had a ready market existed for some of these investments for which market quotations are not readily available.
Management uses judgment to make assumptions on which its employee benefit liabilities and expenses are based. The effect of a 1% change in two key assumptions for the Company's pension plans is summarized as follows:
Page | 28
Assumptions | Income Statement Impact (1) | Balance Sheet Impact (2) | ||||||
(in millions) | ||||||||
Discount rate: | ||||||||
+1% increase | $ | 1.7 | $ | (53.8 | ) | |||
-1% decrease | $ | (2.0 | ) | $ | 62.8 | |||
Expected return on assets: | ||||||||
+1% increase | $ | (3.4 | ) | N/A | ||||
-1% decrease | $ | 3.4 | N/A | |||||
(1) Estimated impact on 2016 annual net periodic benefit costs. | ||||||||
(2) Estimated impact on December 31, 2015 pension liability. | ||||||||
Income Taxes
The Company recorded a tax provision from continuing operations of $18.0 million for the year ended December 31, 2015, and deferred income tax assets, after valuation allowances, totaling $120.1 million at December 31, 2015. As part of the process of preparing its consolidated financial statements, the Company is required to estimate income taxes in each of the jurisdictions in which it conducts business. This process involves estimating actual current tax expense and temporary differences between tax and financial reporting. Temporary differences result in deferred income tax assets and liabilities, which are included on the consolidated balance sheet. The Company must assess the likelihood that deferred income tax assets will be realized. A valuation allowance is recognized to reduce deferred income tax assets if, and to the extent that, it is more likely than not that all or some portion of the deferred income tax assets will not be realized. The determination of the need for a valuation allowance is based on an on-going evaluation of current information including, among other things, estimates of future earnings in different tax jurisdictions and the expected timing of deferred income tax asset and liability reversals. The Company believes that the determination to record a valuation allowance to reduce deferred income tax assets is a critical accounting estimate because it is based, in part, on an estimate of future taxable income in the various tax jurisdictions in which it does business, which is susceptible to change and may or may not occur, as well as on the estimated timing of the reversal of temporary differences, which give rise to its deferred income tax assets, and because the impact of adjusting a valuation allowance may be material. In the event that actual results differ from estimates in future periods, and depending on the tax strategies that the Company may be able to implement, changes to the valuation allowance could impact its financial position and results of operations.
The Company recognizes an uncertain tax position only if it is more likely than not that the tax position will be sustained upon examination by the relevant taxing authority that has full knowledge of all relevant information, based on the technical merits of the position. The income tax position is measured at the largest amount of benefit that is more than 50% likely of being realized upon settlement with a taxing authority. The determination of an uncertain tax position and the likelihood of it being realized requires critical judgment and estimates. The Company carefully assesses each of the uncertain tax positions in order to determine the tax benefit that can be recognized in the consolidated financial statements. It records and/or discloses such potential tax liabilities, as appropriate, and reasonably estimates its income tax liabilities and recoverable tax assets. If new information becomes available, adjustments will be charged against income at that time. The Company does not anticipate that such adjustments would have a material adverse effect on its consolidated financial position or liquidity; however, it is possible that the final outcomes could have a material impact on its reported results of operations.
Environmental Remediation
The Company's facilities and operations are subject to extensive environmental laws and regulations imposed by federal, state, foreign and local authorities relating to the protection of the environment. The Company accrues for losses associated with environmental remediation obligations when such losses are probable and reasonably estimable, which is a critical accounting estimate. Accruals for estimated losses from environmental remediation obligations generally are recognized no later than completion of the remedial feasibility study. Such accruals are adjusted as further information develops or circumstances change. Costs of future expenditures for environmental remediation obligations are not discounted to their present value. Recoveries of environmental remediation costs from other parties are recorded as assets when their receipt is deemed probable. At December 31, 2015, total accruals for environmental remediation were $2.5 million. These reserves may not be adequate to cover the ultimate
Page | 29
costs of remediation, including discovery of additional contaminants or the imposition of additional cleanup obligations, which could result in significant additional costs, unfavorably impacting the Company's financial position and results of operations.
New or Recently Adopted Accounting Pronouncements
For a discussion of the Company's new or recently adopted accounting pronouncements, see Note 3 to our consolidated financial statements included in "Item 8 - Financial Statements and Supplementary Data."
Item 7A. | Quantitative and Qualitative Disclosures About Market Risk |
Market risk is the risk of loss arising from adverse changes in market rates and prices. Our significant market risks are primarily associated with commodity prices, interest rates, equity prices and foreign currency exchange rates. In the normal course of business, we manage these risks through a variety of strategies. We enter into derivative instruments to mitigate certain commodity price and interest rate risks. We do not engage in commodity, interest rate, investment or currency speculation, and no derivatives are held for trading purposes. No credit loss is anticipated on our derivative agreements as the counterparties are major financial institutions that are highly rated, or the derivatives are exchange traded contracts.
HNH's quantitative and qualitative disclosures about market risk include forward-looking statements. These statements are based on certain assumptions with respect to market prices, interest rates and other industry-specific risk factors. To the extent these assumptions prove to be inaccurate, future outcomes may differ materially from those discussed herein.
Commodity Prices:
In the normal course of business, HNH and its subsidiaries are exposed to market risk or price fluctuations related to the purchase of electricity, natural gas, fuel and petroleum-based commodities, including adhesives, and other products, such as yarns, precious metals, steel products and certain non-ferrous metals used as raw materials. HNH is also exposed to the effects of price fluctuations on the value of its commodity inventories, in particular, its precious metal inventory. The raw materials and energy which we use are largely commodities, subject to price volatility caused by changes in global supply and demand and governmental controls.
HNH's market risk strategy has generally been to obtain competitive prices for its products and services, sourced from more than one vendor, and to allow operating results to reflect market price movements dictated by supply and demand.
HNH enters into commodity futures and forward contracts to mitigate the impact of price fluctuations on its precious and certain non-precious metal inventories that are not subject to fixed price contracts. The Company's hedging strategy is designed to protect it against normal volatility; therefore, abnormal price changes in these commodities or markets could negatively impact HNH's earnings. Certain of these derivatives are not designated as accounting hedges under Accounting Standards Codification 815, Derivatives and Hedging. As of December 31, 2015, HNH had entered into forward contracts with settlement dates through January 2016, for silver with a total value of $8.9 million, for gold with a total value of $0.5 million, for copper with a total value of $0.8 million and for tin with a total value of $0.5 million. There were no futures contracts outstanding at December 31, 2015.
Certain customers and suppliers of HNH's subsidiary, H&H, choose to do business on a "pool" basis. Such customers or suppliers furnish precious metal to subsidiaries of H&H for return in fabricated form or for purchase from or return to the supplier. When the customer's precious metal is returned in fabricated form, the customer is charged a fabrication charge. The value of pooled precious metal is not included on the Company's consolidated balance sheet. As of December 31, 2015, customer metal in H&H's custody consisted of 160,363 ounces of silver, 535 ounces of gold and 1,391 ounces of palladium.
To the extent that we have not mitigated our exposure to changing raw material and energy prices, we may not be able to increase our prices to our customers to offset such potential raw material or energy price fluctuations, which could have a material adverse effect on our results of operations and operating cash flows.
Interest Rates:
The fair value of the Company's cash and cash equivalents, trade and other receivables, trade payables and short-term borrowings approximate their carrying values and are relatively insensitive to changes in interest rates due to the short-term maturities of these instruments or the variable nature of the associated interest rates.
At December 31, 2015, HNH's portfolio of long-term debt was comprised primarily of variable rate instruments. Accordingly, these instruments may be relatively sensitive to the effects of interest rate fluctuations. An increase or decrease in
Page | 30
interest expense from a 1% change in interest rates would be approximately $1.0 million on an annual basis based on total debt outstanding at December 31, 2015. In addition, the fair value of such instruments is also affected by investors' assessments of the risks associated with industries in which HNH operates, as well as its overall creditworthiness and ability to satisfy such obligations upon their maturity. To manage our interest rate risk exposure, we entered into two interest rate swap agreements to reduce our exposure to interest rate fluctuations. The terms of these agreements are described in Note 11 to our consolidated financial statements included in "Item 8 - Financial Statements and Supplementary Data." The swap agreements expired in February 2016.
A reduction in long-term interest rates could also materially increase HNH's cash funding obligations to its pension and other post-retirement benefit plans.
Investments:
The Company holds an investment in the common stock of ModusLink and has elected the option to value its investment in ModusLink using fair value, calculated based on the closing market price for ModusLink common stock. The value of this investment decreased from $23.9 million at December 31, 2014 to $20.9 million at December 31, 2015 due primarily to changes in the share price of ModusLink's common stock, partially offset by the additional shares of ModusLink common stock purchased by the Company during 2015. Fluctuations in the price of ModusLink common stock are subject to market fluctuations and other factors outside of our control, which are not directly linked to the financial and operational performance of the Company.
Foreign Currency Exchange Rates:
HNH manufactures and sells its products in a number of countries throughout the world and, as a result, is exposed to movements in foreign currency exchange rates. Most of its operating costs for its non-U.S. operations are denominated in local currencies. The Company's major foreign currency exposures involve the markets in Asia, Europe, Canada and Mexico. The Company is subject to the risk of price fluctuations related to anticipated revenues and operating costs, firm commitments for capital expenditures and existing assets or liabilities denominated in currencies other than the U.S. dollar. The Company has not generally used derivative instruments to manage these specific risks. During the years ended December 31, 2015, 2014 and 2013, the Company incurred losses from foreign currency fluctuations totaling $0.4 million, $0.3 million and $0.3 million, respectively.
Page | 31
Item 8. | Financial Statements and Supplementary Data |
INDEX TO CONSOLIDATED FINANCIAL STATEMENTS
Consolidated Financial Statements: | |
Page | 32
REPORT OF INDEPENDENT REGISTERED PUBLIC ACCOUNTING FIRM
Board of Directors and Stockholders
Handy & Harman Ltd.
White Plains, New York
We have audited the accompanying consolidated balance sheets of Handy & Harman Ltd. and subsidiaries (the "Company") as of December 31, 2015 and 2014 and the related consolidated statements of income, comprehensive income (loss), changes in stockholders' equity and cash flows for each of the three years in the period ended December 31, 2015. These financial statements are the responsibility of the Company's management. Our responsibility is to express an opinion on these financial statements based on our audits.
We conducted our audits in accordance with the standards of the Public Company Accounting Oversight Board (United States). Those standards require that we plan and perform the audit to obtain reasonable assurance about whether the financial statements are free of material misstatement. An audit also includes examining, on a test basis, evidence supporting the amounts and disclosures in the financial statements, assessing the accounting principles used and significant estimates made by management, as well as evaluating the overall financial statement presentation. We believe that our audits provide a reasonable basis for our opinion.
In our opinion, the consolidated financial statements referred to above present fairly, in all material respects, the financial position of Handy & Harman Ltd. and subsidiaries at December 31, 2015 and 2014, and the results of its operations and its cash flows for each of the three years in the period ended December 31, 2015, in conformity with accounting principles generally accepted in the United States of America.
We also have audited, in accordance with the standards of the Public Company Accounting Oversight Board (United States), Handy & Harman Ltd.'s internal control over financial reporting as of December 31, 2015, based on criteria established in Internal Control - Integrated Framework (2013) issued by the Committee of Sponsoring Organizations of the Treadway Commission (COSO), and our report dated February 26, 2016 expressed an unqualified opinion thereon.
/s/ BDO USA, LLP
New York, New York
February 26, 2016
Page | 33
REPORT OF INDEPENDENT REGISTERED PUBLIC ACCOUNTING FIRM ON INTERNAL CONTROL OVER FINANCIAL REPORTING
Board of Directors and Stockholders
Handy & Harman Ltd.
White Plains, New York
We have audited Handy & Harman Ltd. and subsidiaries' (the "Company") internal control over financial reporting as of December 31, 2015, based on criteria established in Internal Control - Integrated Framework (2013) issued by the Committee of Sponsoring Organizations of the Treadway Commission (the COSO criteria). Handy & Harman Ltd.'s management is responsible for maintaining effective internal control over financial reporting and for its assessment of the effectiveness of internal control over financial reporting, included in the accompanying Item 9A, "Management's Report on Internal Control Over Financial Reporting." Our responsibility is to express an opinion on the Company's internal control over financial reporting based on our audit.
We conducted our audit in accordance with the standards of the Public Company Accounting Oversight Board (United States). Those standards require that we plan and perform the audit to obtain reasonable assurance about whether effective internal control over financial reporting was maintained in all material respects. Our audit included obtaining an understanding of internal control over financial reporting, assessing the risk that a material weakness exists, and testing and evaluating the design and operating effectiveness of internal control based on the assessed risk. Our audit also included performing such other procedures as we considered necessary in the circumstances. We believe that our audit provides a reasonable basis for our opinion.
A company's internal control over financial reporting is a process designed to provide reasonable assurance regarding the reliability of financial reporting and the preparation of financial statements for external purposes in accordance with generally accepted accounting principles. A company's internal control over financial reporting includes those policies and procedures that (1) pertain to the maintenance of records that, in reasonable detail, accurately and fairly reflect the transactions and dispositions of the assets of the company; (2) provide reasonable assurance that transactions are recorded as necessary to permit preparation of financial statements in accordance with generally accepted accounting principles, and that receipts and expenditures of the company are being made only in accordance with authorizations of management and directors of the company; and (3) provide reasonable assurance regarding prevention or timely detection of unauthorized acquisition, use, or disposition of the company's assets that could have a material effect on the financial statements.
Because of its inherent limitations, internal control over financial reporting may not prevent or detect misstatements. Also, projections of any evaluation of effectiveness to future periods are subject to the risk that controls may become inadequate because of changes in conditions, or that the degree of compliance with the policies or procedures may deteriorate.
As indicated in the accompanying Item 9A, "Management's Report on Internal Control Over Financial Reporting", management's assessment of and conclusion on the effectiveness of internal control over financial reporting did not include the internal controls of JPS Industries, Inc., which was acquired on July 2, 2015, and which is included in the consolidated balance sheet of Handy & Harman Ltd. as of December 31, 2015, and the related consolidated statements of income, comprehensive income (loss), changes in stockholders' equity and cash flows for the year then ended. JPS Industries, Inc. constituted 20% of total assets as of December 31, 2015 and 9% of net sales for the year then ended. Management did not assess the effectiveness of internal control over financial reporting of JPS Industries, Inc. because of the timing of the acquisition which was completed on July 2, 2015. Our audit of internal control over financial reporting of Handy & Harman Ltd. also did not include an evaluation of the internal control over financial reporting of JPS Industries, Inc.
In our opinion, Handy & Harman Ltd. maintained, in all material respects, effective internal control over financial reporting as of December 31, 2015, based on the COSO criteria.
We also have audited, in accordance with the standards of the Public Company Accounting Oversight Board (United States), the consolidated balance sheets of Handy & Harman Ltd. as of December 31, 2015 and 2014 and the related consolidated statements of income, comprehensive income (loss), changes in stockholders' equity and cash flows for each of the three years in the period ended December 31, 2015 and our report dated February 26, 2016 expressed an unqualified opinion thereon.
/s/ BDO USA, LLP
New York, New York
February 26, 2016
Page | 34
HANDY & HARMAN LTD.
Consolidated Balance Sheets
December 31, | December 31, | |||||||
(in thousands, except par value) | 2015 | 2014 | ||||||
ASSETS | ||||||||
Current Assets: | ||||||||
Cash and cash equivalents | $ | 23,728 | $ | 31,649 | ||||
Trade and other receivables - net of allowance for doubtful accounts of $1,451 and $1,742, respectively | 74,375 | 59,463 | ||||||
Inventories, net | 82,804 | 63,929 | ||||||
Prepaid and other current assets | 9,295 | 7,111 | ||||||
Assets of discontinued operations | — | 69,673 | ||||||
Total current assets | 190,202 | 231,825 | ||||||
Property, plant and equipment at cost, less accumulated depreciation | 112,686 | 67,621 | ||||||
Goodwill | 121,829 | 68,253 | ||||||
Other intangibles, net | 43,117 | 33,338 | ||||||
Investment in associated company | 20,923 | 23,936 | ||||||
Deferred income tax assets | 120,149 | 98,429 | ||||||
Other non-current assets | 15,767 | 15,357 | ||||||
Total assets | $ | 624,673 | $ | 538,759 | ||||
LIABILITIES AND STOCKHOLDERS' EQUITY | ||||||||
Current Liabilities: | ||||||||
Trade payables | $ | 34,466 | $ | 30,805 | ||||
Accrued liabilities | 31,497 | 23,368 | ||||||
Accrued environmental liabilities | 2,531 | 2,424 | ||||||
Short-term debt | 742 | 602 | ||||||
Current portion of long-term debt | 1,720 | 6,378 | ||||||
Liabilities of discontinued operations | — | 13,698 | ||||||
Total current liabilities | 70,956 | 77,275 | ||||||
Long-term debt | 97,106 | 196,423 | ||||||
Accrued pension liability | 265,566 | 208,388 | ||||||
Other post-retirement benefit obligations | 2,624 | 2,914 | ||||||
Deferred income tax liabilities | 402 | 186 | ||||||
Other liabilities | 3,479 | 4,184 | ||||||
Total liabilities | 440,133 | 489,370 | ||||||
Commitments and Contingencies | ||||||||
Stockholders' Equity: | ||||||||
Common stock - $.01 par value; authorized 180,000 shares; issued 13,579 and 13,580 shares, respectively | 136 | 136 | ||||||
Accumulated other comprehensive loss | (259,392 | ) | (235,822 | ) | ||||
Additional paid-in capital | 586,693 | 570,256 | ||||||
Treasury stock, at cost - 1,371 and 2,800 shares, respectively | (34,454 | ) | (70,375 | ) | ||||
Accumulated deficit | (108,443 | ) | (214,806 | ) | ||||
Total stockholders' equity | 184,540 | 49,389 | ||||||
Total liabilities and stockholders' equity | $ | 624,673 | $ | 538,759 | ||||
SEE NOTES TO CONSOLIDATED FINANCIAL STATEMENTS
Page | 35
HANDY & HARMAN LTD.
Consolidated Income Statements
Year Ended December 31, | ||||||||||||
(in thousands, except per share) | 2015 | 2014 | 2013 | |||||||||
Net sales | $ | 649,468 | $ | 600,468 | $ | 571,164 | ||||||
Cost of goods sold | 471,254 | 435,689 | 411,342 | |||||||||
Gross profit | 178,214 | 164,779 | 159,822 | |||||||||
Selling, general and administrative expenses | 123,422 | 114,141 | 114,413 | |||||||||
Pension expense | 7,480 | 3,739 | 5,206 | |||||||||
Asset impairment charges | 1,398 | 1,179 | — | |||||||||
Operating income | 45,914 | 45,720 | 40,203 | |||||||||
Other: | ||||||||||||
Interest expense | 4,598 | 7,544 | 13,662 | |||||||||
Realized and unrealized gain on derivatives | (588 | ) | (1,307 | ) | (1,195 | ) | ||||||
Other expense | 384 | 181 | 240 | |||||||||
Income from continuing operations before tax and equity investment | 41,520 | 39,302 | 27,496 | |||||||||
Tax provision | 17,997 | 17,008 | 12,161 | |||||||||
Loss (gain) from associated company, net of tax | 6,532 | 7,101 | (6,006 | ) | ||||||||
Income from continuing operations, net of tax | 16,991 | 15,193 | 21,341 | |||||||||
Discontinued operations: | ||||||||||||
Income from discontinued operations, net of tax | 565 | 9,935 | 5,789 | |||||||||
Gain on disposal of assets, net of tax | 88,807 | 42 | 14,899 | |||||||||
Net income from discontinued operations | 89,372 | 9,977 | 20,688 | |||||||||
Net income | $ | 106,363 | $ | 25,170 | $ | 42,029 | ||||||
Basic and diluted income per share of common stock | ||||||||||||
Income from continuing operations, net of tax, per share | $ | 1.49 | $ | 1.23 | $ | 1.61 | ||||||
Discontinued operations, net of tax, per share | 7.86 | 0.81 | 1.56 | |||||||||
Net income per share | $ | 9.35 | $ | 2.04 | $ | 3.17 | ||||||
Weighted-average number of common shares outstanding | 11,380 | 12,334 | 13,251 | |||||||||
SEE NOTES TO CONSOLIDATED FINANCIAL STATEMENTS
Page | 36
HANDY & HARMAN LTD.
Consolidated Statements of Comprehensive Income (Loss)
Year Ended December 31, | ||||||||||||
(in thousands) | 2015 | 2014 | 2013 | |||||||||
Net income | $ | 106,363 | $ | 25,170 | $ | 42,029 | ||||||
Other comprehensive (loss) income, net of tax: | ||||||||||||
Changes in pension liability and other post-retirement benefit obligations | (35,521 | ) | (83,887 | ) | 68,328 | |||||||
Tax effect of changes in pension liability and other post-retirement benefit obligations | 13,571 | 31,924 | (25,653 | ) | ||||||||
Change in market value of securities | — | — | 7,113 | |||||||||
Tax effect of change in market value of securities | — | — | (3,041 | ) | ||||||||
Foreign currency translation adjustments | (1,855 | ) | (1,928 | ) | (2,510 | ) | ||||||
Tax effect of changes in foreign currency translation adjustments | 235 | — | — | |||||||||
Other comprehensive (loss) income | (23,570 | ) | (53,891 | ) | 44,237 | |||||||
Comprehensive income (loss) | $ | 82,793 | $ | (28,721 | ) | $ | 86,266 | |||||
SEE NOTES TO CONSOLIDATED FINANCIAL STATEMENTS
Page | 37
HANDY & HARMAN LTD.
Consolidated Statements of Changes in Stockholders' Equity
Common Stock | Accumulated Other Comprehensive | Additional Paid-In | Treasury Stock, | Accumulated | Total Stockholders' | ||||||||||||||||||||||
(in thousands) | Shares | Amount | Loss | Capital | at Cost | Deficit | Equity | ||||||||||||||||||||
Balance, January 1, 2013 | 13,140 | $ | 131 | $ | (226,168 | ) | $ | 559,970 | $ | — | $ | (282,005 | ) | $ | 51,928 | ||||||||||||
Amortization, issuance and forfeitures of restricted stock grants | 304 | 3 | — | 5,471 | — | — | 5,474 | ||||||||||||||||||||
Unrealized gain on available-for-sale investments, net of tax | — | — | 1,710 | — | — | — | 1,710 | ||||||||||||||||||||
Reclassification of unrealized loss on available-for-sale investments, net of tax | — | — | 2,362 | — | — | — | 2,362 | ||||||||||||||||||||
Changes in pension liability and other post-retirement benefit obligations, net of tax | — | — | 42,675 | — | — | — | 42,675 | ||||||||||||||||||||
Foreign currency translation adjustments, net of tax | — | — | (2,510 | ) | — | — | — | (2,510 | ) | ||||||||||||||||||
Purchases of treasury stock | — | — | — | — | (9,796 | ) | — | (9,796 | ) | ||||||||||||||||||
Net income | — | — | — | — | — | 42,029 | 42,029 | ||||||||||||||||||||
Balance, December 31, 2013 | 13,444 | 134 | (181,931 | ) | 565,441 | (9,796 | ) | (239,976 | ) | 133,872 | |||||||||||||||||
Amortization, issuance and forfeitures of restricted stock grants | 136 | 2 | — | 4,815 | — | — | 4,817 | ||||||||||||||||||||
Changes in pension liability and other post-retirement benefit obligations, net of tax | — | — | (51,963 | ) | — | — | — | (51,963 | ) | ||||||||||||||||||
Foreign currency translation adjustments, net of tax | — | — | (1,928 | ) | — | — | — | (1,928 | ) | ||||||||||||||||||
Purchases of treasury stock | — | — | — | — | (60,579 | ) | — | (60,579 | ) | ||||||||||||||||||
Net income | — | — | — | — | — | 25,170 | 25,170 | ||||||||||||||||||||
Balance, December 31, 2014 | 13,580 | 136 | (235,822 | ) | 570,256 | (70,375 | ) | (214,806 | ) | 49,389 | |||||||||||||||||
Amortization, issuance and forfeitures of restricted stock grants | (1 | ) | — | — | 3,610 | — | — | 3,610 | |||||||||||||||||||
Changes in pension liability and other post-retirement benefit obligations, net of tax | — | — | (21,950 | ) | — | — | — | (21,950 | ) | ||||||||||||||||||
Foreign currency translation adjustments, net of tax | — | — | (1,620 | ) | — | — | — | (1,620 | ) | ||||||||||||||||||
Treasury shares issued in JPS acquisition | — | — | — | 12,827 | 35,921 | — | 48,748 | ||||||||||||||||||||
Net income | — | — | — | — | — | 106,363 | 106,363 | ||||||||||||||||||||
Balance, December 31, 2015 | 13,579 | $ | 136 | $ | (259,392 | ) | $ | 586,693 | $ | (34,454 | ) | $ | (108,443 | ) | $ | 184,540 | |||||||||||
SEE NOTES TO CONSOLIDATED FINANCIAL STATEMENTS
Page | 38
HANDY & HARMAN LTD.
Consolidated Statements of Cash Flows
Year Ended December 31, | ||||||||||||
(in thousands) | 2015 | 2014 | 2013 | |||||||||
Cash flows from operating activities: | ||||||||||||
Net income | $ | 106,363 | $ | 25,170 | $ | 42,029 | ||||||
Net income from discontinued operations | (89,372 | ) | (9,977 | ) | (20,688 | ) | ||||||
Adjustments to reconcile net income to net cash provided by operating activities: | ||||||||||||
Depreciation and amortization | 18,380 | 13,137 | 11,927 | |||||||||
Non-cash stock-based compensation | 3,373 | 5,105 | 4,860 | |||||||||
Non-cash loss (gain) from investment in associated company, net of tax | 6,532 | 7,101 | (6,006 | ) | ||||||||
Amortization of debt issuance costs | 1,088 | 1,480 | 852 | |||||||||
Loss on early retirement of debt | — | — | 5,662 | |||||||||
Accrued interest not paid in cash | — | — | 93 | |||||||||
Deferred income taxes | 15,130 | 13,414 | 10,482 | |||||||||
Gain from asset dispositions | (62 | ) | (176 | ) | (63 | ) | ||||||
Asset impairment charges | 1,398 | 1,179 | — | |||||||||
Non-cash loss (gain) from derivatives | 37 | (213 | ) | 1,051 | ||||||||
Reclassification of net cash settlements on precious metal contracts to investing activities | (625 | ) | (1,093 | ) | (2,346 | ) | ||||||
Change in operating assets and liabilities, net of acquisitions: | ||||||||||||
Trade and other receivables | 5,402 | (817 | ) | 5,960 | ||||||||
Inventories | 9,578 | (5,431 | ) | 2,408 | ||||||||
Prepaid and other current assets | 2,674 | 2,192 | (3,263 | ) | ||||||||
Other current liabilities | (19,011 | ) | (18,642 | ) | (14,395 | ) | ||||||
Other items, net | (296 | ) | (328 | ) | (1,194 | ) | ||||||
Net cash provided by continuing operations | 60,589 | 32,101 | 37,369 | |||||||||
Net cash (used in) provided by discontinued operations | (2,254 | ) | 18,588 | 11,794 | ||||||||
Net cash provided by operating activities | 58,335 | 50,689 | 49,163 | |||||||||
Cash flows from investing activities: | ||||||||||||
Additions to property, plant and equipment | (15,225 | ) | (12,658 | ) | (11,744 | ) | ||||||
Net cash settlements on precious metal contracts | 625 | 1,093 | 2,346 | |||||||||
Acquisitions, net of cash acquired | (92,913 | ) | — | (68,640 | ) | |||||||
Proceeds from sale of assets | 466 | 332 | 413 | |||||||||
Investments in associated company | (7,607 | ) | (1,499 | ) | — | |||||||
Proceeds from sale of discontinued operations | 155,517 | 3,732 | 45,334 | |||||||||
Net cash used in investing activities of discontinued operations | (75 | ) | (2,902 | ) | (4,584 | ) | ||||||
Net cash provided by (used in) investing activities | 40,788 | (11,902 | ) | (36,875 | ) | |||||||
Page | 39
Year Ended December 31, | ||||||||||||
(in thousands) | 2015 | 2014 | 2013 | |||||||||
Cash flows from financing activities: | ||||||||||||
Proceeds from term loans - domestic | — | 40,000 | 10,000 | |||||||||
Proceeds from WHX CS Loan | — | 12,600 | — | |||||||||
Repayment of WHX CS Loan | — | (12,600 | ) | — | ||||||||
Net revolver (repayments) borrowings | (104,262 | ) | 162,425 | 30,950 | ||||||||
Repayments of term loans - domestic | (1,078 | ) | (156,265 | ) | (9,318 | ) | ||||||
Net borrowings (repayments) on loans - foreign | 240 | 315 | (424 | ) | ||||||||
Repurchases of Subordinated Notes | — | — | (36,307 | ) | ||||||||
Deferred finance charges | (477 | ) | (3,175 | ) | (771 | ) | ||||||
Net change in overdrafts | (1,190 | ) | 186 | 1,761 | ||||||||
Purchases of treasury stock | — | (60,579 | ) | (9,796 | ) | |||||||
Other financing activities | 71 | (50 | ) | (424 | ) | |||||||
Net cash used in financing activities of discontinued operations | — | — | (3,093 | ) | ||||||||
Net cash used in financing activities | (106,696 | ) | (17,143 | ) | (17,422 | ) | ||||||
Net change for the year | (7,573 | ) | 21,644 | (5,134 | ) | |||||||
Effect of exchange rate changes on cash and cash equivalents | (348 | ) | (295 | ) | 133 | |||||||
Cash and cash equivalents at beginning of year | 31,649 | 10,300 | 15,301 | |||||||||
Cash and cash equivalents at end of year | $ | 23,728 | $ | 31,649 | $ | 10,300 | ||||||
Cash paid during the year for: | ||||||||||||
Interest | $ | 3,598 | $ | 6,634 | $ | 8,704 | ||||||
Taxes | $ | 5,032 | $ | 5,497 | $ | 7,519 | ||||||
Non-cash investing activities: | ||||||||||||
Exchange of treasury stock for shares of JPS Industries, Inc. | $ | 48,748 | $ | — | $ | — | ||||||
SEE NOTES TO CONSOLIDATED FINANCIAL STATEMENTS
Page | 40
NOTES TO CONSOLIDATED FINANCIAL STATEMENTS
Note 1 – The Company and Nature of Operations
Handy & Harman Ltd. ("HNH") is a diversified manufacturer of engineered niche industrial products. HNH's diverse product offerings are marketed throughout the United States and internationally. HNH owns Handy & Harman Group Ltd. ("H&H Group"), which owns Handy & Harman ("H&H") and Bairnco, LLC ("Bairnco"), formerly Bairnco Corporation. HNH manages its group of businesses on a decentralized basis with operations principally in North America. HNH's business units encompass the following segments: Joining Materials, Tubing, Building Materials, Performance Materials and Kasco Blades and Route Repair Services ("Kasco"). The Performance Materials segment is currently comprised solely of the operations of JPS Industries, Inc. ("JPS"), which was acquired on July 2, 2015 as discussed in Note 4 - "Acquisitions." All references herein to "we," "our" or the "Company" refer to HNH together with all of its subsidiaries.
Note 2 – Summary of Accounting Policies
Basis of Presentation
The consolidated financial statements include the accounts of HNH and its subsidiaries. All material intercompany transactions and balances have been eliminated.
Discontinued Operations
The results of operations for businesses that have been disposed of or classified as held-for-sale are segregated from the results of the Company's continuing operations and classified as discontinued operations for each period presented in the Company's consolidated income statement. Similarly, the assets and liabilities of such businesses are reclassified from continuing operations and presented as discontinued operations for each period presented on the Company's consolidated balance sheet.
Use of Estimates
The preparation of financial statements in conformity with accounting principles generally accepted in the United States of America ("U.S. GAAP") requires the Company to make estimates and judgments that affect the reported amounts of assets, liabilities, revenues and expenses, and related disclosure of contingent assets and liabilities. On an on-going basis, the Company evaluates its estimates, including those related to bad debts, inventories, long-lived assets, intangibles, accrued liabilities, income taxes, pension and other post-retirement benefit obligations, and contingencies and litigation. Estimates are based on historical experience, expected future cash flows and various other assumptions that are believed to be reasonable under the circumstances, the results of which form the basis for making judgments about the carrying values of assets and liabilities that are not readily apparent from other sources. Actual results may differ from these estimates.
Revenue Recognition
Revenues are recognized when title and risk of loss has passed to the customer. This condition is normally met when product has been shipped or the service performed. An allowance is provided for estimated returns and discounts based on experience. Cash received by the Company from customers prior to shipment of goods, or otherwise not yet earned, is recorded as deferred revenue. Rental revenues are derived from the rental of certain equipment to the food industry where customers prepay for the rental period, usually three to six month periods. For prepaid rental contracts, sales revenue is recognized on a straight-line basis over the term of the contract. Service revenues consist of repair and maintenance work performed on equipment used at mass merchants, supermarkets and restaurants.
The Company experiences a certain degree of sales returns that varies over time, but is able to make a reasonable estimation of expected sales returns based upon history. The Company records all shipping and handling fees billed to customers as revenue, and related costs are charged principally to cost of goods sold when incurred. The Company has also entered into agreements with certain customers under which the Company has agreed to pay rebates to such customers. These programs are typically structured to incentivize the customers to increase their annual purchases from the Company. The rebates are usually calculated as a percentage of the purchase amount, and such percentages may increase as the customer's level of purchases rise. Rebates are recorded as a reduction of net sales in the consolidated income statement and are accounted for on an accrual basis. As of December 31, 2015 and 2014, accrued rebates payable totaled $7.6 million and $6.1 million, respectively, and are included in accrued liabilities on the consolidated balance sheet. In limited circumstances, the Company is required to collect and remit sales tax on certain of its sales. The Company accounts for sales taxes on a net basis, and such sales taxes are not included in net sales in the consolidated income statement.
Page | 41
Cash and Cash Equivalents
Cash and cash equivalents include cash on hand and on deposit and highly liquid debt instruments with original maturities of three months or less. As of December 31, 2015 and 2014, the Company had cash held in foreign banks of $4.5 million and $8.6 million, respectively. The Company's credit risk arising from cash deposits held in U.S. banks in excess of insured amounts is reduced given that cash balances in U.S. banks are generally utilized to pay down the Company's revolving credit loans (see Note 11 - "Debt"). At December 31, 2015, the Company held cash and cash equivalents which exceeded federally-insured limits by approximately $18.6 million.
Trade Receivables and Allowance for Doubtful Accounts
The Company extends credit to customers based on its evaluation of the customer's financial condition. The Company does not typically require that any collateral be provided by its customers. The Company has established an allowance for accounts that are expected to be uncollectible in the future. This estimated allowance is based primarily on management's evaluation of the financial condition of the customer and historical experience. The Company monitors its trade receivables and charges to expense an amount equal to its estimate of expected credit losses. Accounts that are outstanding longer than contractual payment terms are considered past due. The Company considers a number of factors in determining its estimates, including the length of time its trade receivables are past due, the Company's previous loss history and the customer's current ability to pay its obligation. Trade receivable balances are charged off against the allowance when it is determined that the receivables will not be recovered, and payments subsequently received on such receivables are credited to recovery of accounts written-off. The Company does not typically charge interest on past due receivables.
The Company believes that the credit risk with respect to trade receivables is limited due to the Company's credit evaluation process, the allowance for doubtful accounts that has been established and the diversified nature of its customer base. There were no customers which accounted for more than 10% of consolidated net sales in 2015, 2014 or 2013. In 2015, 2014 and 2013, the 15 largest customers accounted for approximately 33%, 31% and 30% of consolidated net sales, respectively.
Inventories
Inventories are generally stated at the lower of cost (determined by the first-in, first-out method or average cost method) or market. Cost is determined by the last-in, first-out ("LIFO") method for certain precious metal inventory held in the United States, and remaining precious metal inventory is primarily carried at fair value. For precious metal inventory, no segregation among raw materials, work in process and finished products is practicable.
Non-precious metal inventories are evaluated for estimated excess and obsolescence based upon assumptions about future demand and market conditions and are adjusted accordingly. If actual market conditions are less favorable than those projected, future write-downs may be required.
Derivatives and Risks
Precious Metal and Commodity Risk
H&H's precious metal and commodity inventories are subject to market price fluctuations. H&H enters into commodity futures and forward contracts to mitigate the impact of price fluctuations on its precious and certain non-precious metal inventories that are not subject to fixed price contracts. The Company's hedging strategy is designed to protect it against normal volatility; therefore, abnormal price changes in these commodities or markets could negatively impact HNH's earnings. The Company does not enter into derivatives or other financial instruments for trading or speculative purposes. H&H accounts for these contracts as either fair value hedges or economic hedges under the guidance in Accounting Standards Codification ("ASC") 815, Derivatives and Hedging.
Fair Value Hedges. The fair values of these derivatives are recognized as derivative assets and liabilities on the consolidated balance sheet. The net change in fair value of the derivative assets and liabilities and the change in the fair value of the underlying hedged inventory are recognized in the consolidated income statement, and such amounts principally offset each other due to the effectiveness of the hedges. The fair value hedges are associated primarily with the Company's precious metal inventory carried at fair value.
Economic Hedges. As these derivatives are not designated as accounting hedges under ASC 815, they are accounted for as derivatives with no hedge designation. The derivatives are marked to market and both realized and unrealized gains and losses
Page | 42
are recorded in current period earnings in the consolidated income statement. The economic hedges are associated primarily with the Company's precious metal inventory valued using the LIFO method.
Interest Rate Risk
HNH has entered into interest rate swap agreements in order to economically hedge a portion of its debt, which is subject to variable interest rates. As these derivatives are not designated as accounting hedges under U.S. GAAP, they are accounted for as derivatives with no hedge designation. The Company records the gains and losses both from the mark-to-market adjustments and net settlements in interest expense in the consolidated income statement as the hedges are intended to offset interest rate movements.
Foreign Currency Exchange Rate Risk
The Company is subject to the risk of price fluctuations related to anticipated revenues and operating costs, firm commitments for capital expenditures and existing assets or liabilities denominated in currencies other than the U.S. dollar. The Company has not generally used derivative instruments to manage this risk.
Property, Plant and Equipment
Property, plant and equipment is recorded at historical cost. Depreciation of property, plant and equipment is provided principally on the straight line method over the estimated useful lives of the assets, which range as follows: machinery and equipment 3 – 15 years and buildings and improvements 10 – 30 years. Interest cost is capitalized for qualifying assets during the asset's acquisition period. Maintenance and repairs are charged to expense, and renewals and betterments are capitalized. Gain or loss on dispositions is recorded in operating income.
Goodwill, Other Intangibles and Long-Lived Assets
Goodwill represents the difference between the purchase price and the fair value of net assets acquired in a business combination. Goodwill is reviewed annually for impairment in accordance with U.S. GAAP as of the end of the fourth quarter. The Company uses judgment in assessing whether assets may have become impaired between annual impairment tests. Circumstances that could trigger an interim impairment test include, but are not limited to: the occurrence of a significant change in circumstances, such as continuing adverse business conditions or legal factors; an adverse action or assessment by a regulator; unanticipated competition; loss of key personnel; the likelihood that a reporting unit or significant portion of a reporting unit will be sold or otherwise disposed; or results of testing for recoverability of a significant asset group within a reporting unit.
The testing of goodwill for impairment is performed at a level referred to as a reporting unit. Goodwill is allocated to each reporting unit based on the goodwill valued in connection with each business combination consummated within each reporting unit. Four reporting units of the Company have goodwill assigned to them.
Goodwill impairment testing consists of a two-step process. Step 1 of the goodwill impairment test involves comparing the fair values of the applicable reporting units with their carrying values, including goodwill. If the carrying amount of a reporting unit exceeds the reporting unit's fair value, Step 2 of the goodwill impairment test is performed to determine the amount of impairment loss. Step 2 of the goodwill impairment test involves comparing the implied fair value of the affected reporting unit's goodwill against the carrying value of that goodwill.
An entity has the option to first assess qualitative factors to determine whether the existence of events or circumstances leads to a determination that it is more likely than not (more than 50%) that the estimated fair value of a reporting unit is less than its carrying amount. If an entity elects to perform a qualitative assessment and determines that an impairment is more likely than not, the entity is then required to perform the two-step quantitative impairment test discussed above; otherwise no further analysis is required. An entity also may elect not to perform the qualitative assessment and, instead, proceed directly to the two-step quantitative impairment test. The ultimate outcome of the goodwill impairment review for a reporting unit should be the same whether an entity chooses to perform the qualitative assessment or proceeds directly to the two-step quantitative impairment test. The Company utilized a qualitative approach to assess its goodwill as of its most recent assessment date.
Intangible assets with finite lives are amortized over their estimated useful lives. The Company also estimates the depreciable lives of property, plant and equipment, and reviews long-lived assets for impairment whenever events, or changes in circumstances, indicate the carrying amount of such assets may not be recoverable. Long-lived assets consisting of land and buildings used in previously operating businesses are carried at the lower of cost or fair value less cost to sell and are included
Page | 43
primarily in other non-current assets on the consolidated balance sheet. A reduction in the carrying value of such long-lived assets used in previously operating businesses is recorded as an asset impairment charge in the consolidated income statement.
Investment In Associated Company
The Company elected to account for its investment in ModusLink Global Solutions, Inc. ("ModusLink") at fair value effective March 12, 2013, the date it obtained significant influence over the operating and financial policies of ModusLink.
Stock-Based Compensation
The Company accounts for stock options and restricted stock granted to employees, directors and service providers as compensation expense, which is recognized in exchange for the services received. The compensation expense is based on the fair value of the equity instruments on the grant-date and is recognized as an expense over the service period of the recipients.
Income Taxes
Income taxes currently payable or tax refunds receivable are recorded on a net basis and included in accrued liabilities on the consolidated balance sheet. Deferred income taxes reflect the tax effect of net operating loss carryforwards ("NOLs"), capital loss or tax credit carryforwards, and the net tax effects of temporary differences between the carrying amount of assets and liabilities for financial reporting and income tax purposes, as determined under enacted tax laws and rates. Valuation allowances are established if, based on the weight of available evidence, it is more likely than not that some portion or the entire deferred income tax asset will not be realized. The financial effect of changes in tax laws or rates is accounted for in the period of enactment.
Earnings Per Share
Basic earnings per share is calculated based on the weighted-average number of shares of common stock outstanding during each year. Diluted earnings per share gives effect to dilutive potential common shares outstanding during each year.
Foreign Currency Translation
Assets and liabilities of foreign subsidiaries are translated at current exchange rates and related revenues and expenses are translated at average rates of exchange in effect during the year. Resulting cumulative translation adjustments are recorded as a separate component of accumulated other comprehensive income (loss).
Advertising Costs
Advertising costs consist of sales promotion literature, samples, cost of trade shows and general advertising costs, and are included in selling, general and administrative expenses in the consolidated income statement. Advertising, promotion and trade show costs totaled approximately $2.9 million, $3.0 million and $2.6 million in 2015, 2014 and 2013, respectively.
Legal Contingencies
The Company provides for legal contingencies when the liability is probable and the amount of the associated costs is reasonably estimable. The Company regularly monitors the progress of legal contingencies and revises the amounts recorded in the period in which a change in estimate occurs.
Environmental Liabilities
The Company accrues for losses associated with environmental remediation obligations when such losses are probable and reasonably estimable. Accruals for estimated losses from environmental remediation obligations generally are recognized no later than completion of the remedial feasibility study. Such accruals are adjusted as further information develops or circumstances change. Costs of future expenditures for environmental remediation obligations are not discounted to their present value. Recoveries of environmental remediation costs from other parties are recorded as assets when their receipt is deemed probable.
Reclassifications
Certain amounts for prior years have been reclassified to conform to the current year presentation. In particular, all current deferred income tax assets and liabilities have been reclassified to non-current, resulting in one net non-current deferred tax asset or liability for each tax jurisdiction (see Note 3 - "New or Recently Adopted Accounting Pronouncements").
Page | 44
Note 3 – New or Recently Adopted Accounting Pronouncements
In May 2014, the Financial Accounting Standards Board ("FASB") issued Accounting Standards Update ("ASU") No. 2014-09, Revenue from Contracts with Customers (Topic 606). The core principle of the guidance is that an entity should recognize revenue to depict the transfer of promised goods or services to customers in an amount that reflects the consideration to which the entity expects to be entitled in exchange for those goods or services, and the guidance defines a five step process to achieve this core principle. In August 2015, the FASB issued ASU No. 2015-14, which deferred the effective date of ASU 2014-09 by one year. The ASU, as amended, is effective for the Company's 2018 fiscal year and may be applied either (i) retrospectively to each prior reporting period presented with an election for certain specified practical expedients, or (ii) retrospectively with the cumulative effect of initially applying the ASU recognized at the date of initial application, with additional disclosure requirements. The Company is evaluating the potential impact of this new guidance, but does not currently anticipate that the application of ASU No. 2014-09 will have a significant effect on its financial condition, results of operations or its cash flows. We have not yet determined the method by which we will adopt the standard.
In May 2015, the FASB issued ASU No. 2015-07, Fair Value Measurement (Topic 820): Disclosures for Investments in Certain Entities That Calculate Net Asset Value per Share (or Its Equivalent), which removes the requirement to categorize within the fair value hierarchy all investments for which fair value is measured using the net asset value per share practical expedient. The Company adopted ASU No. 2015-07 retrospectively as of December 31, 2015, since it believes that the adoption of this ASU provides more consistency in the classification of investments within the fair value hierarchy. ASU No. 2015-07 applies to certain of the Company's pension plan assets disclosed in Note 13 - "Pension and Other Post-Retirement Benefits". Pension plan assets totaling $164.5 million, which were previously categorized as Level 2 measurements, are no longer categorized in the fair value hierarchy based on the adoption of ASU No. 2015-07, but are reflected in the tables in Note 13 in order to reconcile the total pension plan assets.
In July 2015, the FASB issued ASU No. 2015-11, Inventory (Topic 330): Simplifying the Measurement of Inventory, which requires an entity to measure inventory at the lower of cost and net realizable value. Net realizable value is the estimated selling prices in the ordinary course of business, less reasonably predictable costs of completion, disposal and transportation. The amendments do not apply to inventory that is measured using the LIFO method. The Company is currently evaluating the potential impact of this new guidance, which is effective for the Company's 2017 fiscal year.
In September 2015, the FASB issued ASU No. 2015-16, Business Combinations (Topic 805): Simplifying the Accounting for Measurement-Period Adjustments, which eliminates the requirement to restate prior-period financial statements for measurement-period adjustments following a business combination. The new guidance requires that the cumulative impact of a measurement-period adjustment (including the impact on prior periods) be recognized in the reporting period in which the adjustment is identified. The prior-period impact of the adjustment should either be presented separately on the face of the income statement or disclosed in the notes. This new guidance is effective for the Company's 2016 fiscal year. The amendments in this ASU will be applied prospectively to adjustments to provisional amounts that occur after the effective date of this ASU.
In November 2015, the FASB issued ASU No. 2015-17, Income Taxes (Topic 740): Balance Sheet Classification of Deferred Taxes, which requires that deferred income tax assets and liabilities be classified as non-current on a classified statement of financial position. The ASU retains the requirement that the deferred income taxes of each tax jurisdiction be presented separately. The Company adopted ASU No. 2015-17 retrospectively as of December 31, 2015, since it believes that the adoption provides simplicity and consistency to the presentation of deferred income taxes. As a result of adopting ASU 2015-17, the Company reclassified certain amounts on its December 31, 2014 balance sheet. Specifically, the Company reclassified $26.7 million of deferred income tax assets - current to deferred income tax assets - non-current, and reclassified $0.2 million of deferred income tax liabilities - current to deferred income tax liabilities - non-current.
In February 2016, the FASB issued ASU No. 2016-02, Leases (Topic 842). The new standard establishes a right-of-use ("ROU") model that requires a lessee to record a ROU asset and a lease liability, measured on a discounted basis, on the balance sheet for all leases with terms longer than 12 months. Leases will be classified as either finance or operating, with classification affecting the pattern of expense recognition in the income statement. A modified retrospective transition approach is required for capital and operating leases existing at the date of adoption, with certain practical expedients available. The Company is currently evaluating the potential impact of this new guidance, which is effective for the Company's 2019 fiscal year.
Note 4 – Acquisitions
ITW
Page | 45
On March 31, 2015, the Company, through its indirect subsidiary, OMG, Inc. ("OMG"), acquired certain assets and assumed certain liabilities of ITW Polymers Sealants North America Inc. ("ITW"), which are used in the business of manufacturing two-component polyurethane adhesive for the roofing industry, for a cash purchase price of $27.4 million, reflecting a final working capital adjustment of $0.4 million. The assets acquired and liabilities assumed primarily include net working capital of inventories and accrued liabilities; property, plant and equipment; and intangible assets, primarily unpatented technology, valued at $1.7 million, $0.1 million and $4.4 million, respectively. ITW was the exclusive supplier of certain adhesive products to OMG, and this acquisition will provide OMG with greater control of its supply chain and allow OMG to expand its product development initiatives. The results of operations of the acquired business are reported within the Company's Building Materials segment. In connection with the ITW acquisition, the Company has recorded goodwill totaling approximately $21.3 million, which is expected to be deductible for income tax purposes.
JPS
Effective July 2, 2015, H&H Group completed the acquisition of JPS pursuant to an agreement and plan of merger, dated as of May 31, 2015, by and among the Company, H&H Group, HNH Group Acquisition LLC, a Delaware limited liability company and a subsidiary of H&H Group ("H&H Acquisition Sub"), HNH Group Acquisition Sub LLC, a Delaware limited liability company and a wholly owned subsidiary of H&H Acquisition Sub ("Sub"), and JPS. JPS is a manufacturer of mechanically formed glass and aramid substrate materials for specialty applications in a wide expanse of markets requiring highly engineered components. At the effective time of the Merger (as defined below), Sub was merged with and into JPS ("Merger"), with JPS being the surviving corporation in the Merger, and each outstanding share of JPS common stock (other than shares held by the Company and its affiliates, including SPH Group Holdings LLC ("SPH Group Holdings"), a subsidiary of Steel Partners Holdings L.P. ("SPLP"), the parent company of the Company, and a significant stockholder of JPS), was converted into the right to receive $11.00 in cash. The aggregate merger consideration of $70.3 million was funded primarily by H&H Group and also by SPH Group Holdings. H&H Group's funding of the aggregate merger consideration totaled approximately $65.7 million, which was financed through additional borrowings under the Company's senior secured revolving credit facility.
As a result of the closing of the Merger, JPS was indirectly owned by both H&H Group and SPH Group Holdings. Following the expiration of the 20-day period provided in Section 262(d)(2) of the Delaware General Corporation Law for JPS stockholders to exercise appraisal rights in connection with the Merger, and in accordance with an exchange agreement, dated as of May 31, 2015, by and between H&H Group and SPH Group Holdings, on July 31, 2015, the Company issued ("Issuance") to H&H Group 1,429,407 shares of the Company's common stock with a value of $48.7 million and, following the Issuance, H&H Group exchanged ("Exchange") those shares of Company common stock for all shares of JPS common stock held by SPH Group Holdings. As a result of the Exchange, H&H Group owned 100% of JPS and merged JPS with and into its wholly-owned subsidiary, HNH Acquisition LLC, a Delaware limited liability company, which was the surviving entity in the merger and was renamed JPS Industries Holdings LLC.
The following table summarizes the amounts of the assets acquired and liabilities assumed at the acquisition date on a preliminary basis (in thousands):
Cash and cash equivalents | $ | 22 | |
Trade and other receivables | 21,201 | ||
Inventories | 27,126 | ||
Prepaid and other current assets | 4,961 | ||
Property, plant and equipment | 45,384 | ||
Goodwill | 32,336 | ||
Other intangibles | 9,120 | ||
Deferred income tax assets | 19,286 | ||
Other non-current assets | 3,280 | ||
Total assets acquired | 162,716 | ||
Trade payables | (10,674 | ) | |
Accrued liabilities | (5,533 | ) | |
Long-term debt | (1,500 | ) | |
Accrued pension liability | (30,367 | ) | |
Other liabilities | (149 | ) | |
Net assets acquired | $ | 114,493 | |
Page | 46
The preliminary purchase price allocation is subject to finalization of valuations of certain acquired assets and liabilities. The goodwill of $32.3 million arising from the acquisition consists largely of the synergies expected from combining the operations of HNH and JPS. All of the goodwill is assigned to the Company's Performance Materials segment and is not expected to be deductible for income tax purposes. Other intangibles consist primarily of acquired trade names of $4.3 million, customer relationships of $3.1 million and unpatented technology of $1.7 million. These intangible assets have been assigned useful lives ranging from 10 to 15 years based on the long operating history, broad market recognition and continued demand for the associated brands, and the limited turnover and long-standing relationships JPS has with its existing customer base. The valuations of acquired trade names and unpatented technology were performed utilizing a relief from royalty method, and significant assumptions used in the valuation included the royalty rate assumed and the expected level of future sales, as well as the rate of technical obsolescence for the unpatented technology. The acquired customer relationships were valued using an excess earnings approach, and significant assumptions used in the valuation included the customer attrition rate assumed and the expected level of future sales.
The amount of net sales and operating loss of the acquired business included in the consolidated income statement for the year ended December 31, 2015 were approximately $59.5 million and $(2.2) million, respectively, which include $3.4 million of nonrecurring expense related to the fair value adjustment to acquisition-date inventories, as well as the impact of integration costs totaling $0.4 million recorded in 2015. The results of operations of the acquired business are reported within the Company's Performance Materials segment. Unaudited pro forma net sales and income from continuing operations, net of tax, of the combined entity had the acquisition date been January 1, 2014 are as follows:
Year Ended | ||||||||
December 31, | ||||||||
(in thousands, except per share) | 2015 | 2014 | ||||||
Net sales | $ | 732,567 | $ | 759,578 | ||||
Income from continuing operations, net of tax | $ | 20,228 | $ | 13,228 | ||||
Income from continuing operations, net of tax, per share | $ | 1.66 | $ | 0.96 | ||||
Weighted-average number of common shares outstanding | 12,214 | 13,763 | ||||||
This unaudited pro forma data is presented for informational purposes only and does not purport to be indicative of the results of future operations or of the results that would have occurred had the acquisition taken place on January 1, 2014. The information for the years ended December 31, 2015 and 2014 is based on historical financial information with respect to the acquisition and does not include operational or other changes which might have been effected by the Company. Both the 2015 and 2014 periods reflect incremental depreciation and amortization expense based on the fair value adjustments for the acquired property, plant and equipment and intangible assets. The 2015 supplemental unaudited pro forma earnings reflect adjustments to exclude a total of $7.3 million of acquisition-related costs incurred by both the Company and JPS during the year ended December 31, 2015 and $3.4 million of nonrecurring expense related to the fair value adjustment to acquisition-date inventories. The 2014 supplemental unaudited pro forma earnings were adjusted to include the fair value adjustment to acquisition-date inventories.
Wolverine Joining Technologies, LLC
On April 16, 2013, the Company and its indirect subsidiary, Lucas-Milhaupt Warwick LLC (together with the Company, "Buyer"), entered into an asset purchase agreement ("Purchase Agreement") with Wolverine Tube, Inc. ("Wolverine") and its subsidiary, Wolverine Joining Technologies, LLC ("Wolverine Joining" and, together with Wolverine, "Seller"), pursuant to which the Buyer agreed to purchase substantially all of the assets of the Seller used in the business of Wolverine Joining, consisting of assets used for the development, manufacturing and sale of brazing, flux and soldering products, and the alloys for electrical, catalyst and other industrial specialties, other than certain leased real property, and to assume certain liabilities related to such business. By acquiring Wolverine Joining, the Company increased its capacity to produce brazing filler metals and fluxes, and broadened its platform for continued global expansion. The purchase price for the acquisition was approximately $59.7 million, reflecting a final working capital adjustment and certain other reductions totaling approximately $0.3 million as provided in the Purchase Agreement. The closing of this transaction occurred on April 26, 2013. Funding of the purchase price for the acquisition was from cash on hand and borrowings under the Company's then existing senior secured credit facility, which was amended in connection with the acquisition. The results of operations of the acquired business are reported within the Company's Joining Materials segment.
In connection with the acquisition of Wolverine Joining, the Company incurred employee severance charges totaling approximately $0.4 million associated with the Company's integration activities, which were primarily recorded and paid in 2013
Page | 47
and reflected in selling, general and administrative expenses.
PAM Fastening Technology, Inc.
On November 7, 2013, the Company, through its indirect subsidiary, OMG, acquired 100% of the stock of PAM Fastening Technology, Inc. ("PAM") for a cash purchase price of $9.2 million, net of cash acquired. PAM is a distributor of screw guns, collated screws and hot melt systems to the manufacturing and building industries in North America. The results of operations of the acquired business are reported within the Company's Building Materials segment. This acquisition provided the Company with an add on product category to its existing fastening system product line.
Note 5 – Discontinued Operations
The following businesses are classified as discontinued operations in the consolidated financial statements.
Arlon, LLC
On December 18, 2014, H&H Group and Bairnco entered into a stock purchase agreement to sell all of the issued and outstanding equity interests of Arlon, LLC, a Delaware limited liability company and a wholly-owned subsidiary of Bairnco, and its subsidiaries (other than Arlon India (Pvt) Limited) for $157.0 million in cash, less transaction fees, subject to a final working capital adjustment and certain potential reductions as provided in the stock purchase agreement, which are reflected in proceeds from sale of discontinued operations in the consolidated statement of cash flows. The closing of the sale occurred in January 2015. The operations of Arlon, LLC comprised substantially all of the Company's former Arlon Electronic Materials segment, which manufactured high performance materials for the printed circuit board industry and silicone rubber-based materials.
Continental Industries
In January 2013, the Company divested substantially all of the assets and existing operations of its Continental Industries, Inc. ("Continental") business unit for a cash sales price totaling approximately $37.4 million, less transaction fees, reflecting a working capital adjustment of approximately $0.1 million paid in the third quarter of 2013. Proceeds of $3.7 million were held in escrow as of December 31, 2013 pending resolution of certain indemnification provisions contained in the sales agreement and were included in other receivables on the consolidated balance sheet. This escrow balance was released and received by the Company in July 2014. Continental manufactured plastic and steel fittings and connectors for natural gas, propane and water distribution service lines, along with exothermic welding products for electrical grounding, cathodic protection and lightning protection. It was part of the Company's Building Materials segment.
Canfield Metal Coating Corporation
In June 2013, the Company divested substantially all of the assets and existing operations of its Canfield Metal Coating Corporation ("CMCC") business unit for a cash sales price totaling approximately $9.5 million, less transaction fees, reflecting a final working capital adjustment of approximately $0.5 million. CMCC manufactured electro-galvanized and painted cold rolled sheet steel products primarily for the construction, entry door, container and appliance industries. It was part of the Company's Building Materials segment.
Indiana Tube Mexico
In July 2013, the Company divested substantially all of the equipment owned or utilized by Indiana Tube de México, S. De R.L. de C.V. ("ITM") for the manufacture of refrigeration condensers for a cash sales price totaling $3.7 million, less transaction fees. ITM's operations were part of the Company's Tubing segment.
In connection with the shut-down of ITM's operations, the Company initiated a series of restructuring activities, which included the termination of all of ITM's employees and certain building lease termination costs. The total cost of these restructuring activities was $0.9 million. Payment for the majority of these costs occurred during the third quarter of 2013, and the remaining restructuring payments were completed by the end of 2013.
Indiana Tube Denmark
In 2008, the Company decided to exit the welded specialty tubing market in Europe and close its Indiana Tube Danmark A/S subsidiary ("ITD"). The Company completed the final liquidation of ITD in July 2013 and recognized $2.6 million in foreign
Page | 48
currency translation gains in earnings during the third quarter of 2013, which were previously reported in accumulated other comprehensive loss on the consolidated balance sheet.
The assets and liabilities of discontinued operations were segregated on the consolidated balance sheet as of December 31, 2014. No balances from discontinued operations remain at December 31, 2015.
December 31, | ||||||
(in thousands) | 2014 | |||||
Assets of Discontinued Operations: | ||||||
Trade and other receivables, net | $ | 16,044 | ||||
Inventories, net | 8,294 | |||||
Prepaid and other current assets | 811 | |||||
Property, plant and equipment, net | 24,754 | |||||
Goodwill | 9,298 | |||||
Other intangibles, net | 10,472 | |||||
Total assets of discontinued operations | $ | 69,673 | ||||
Liabilities of Discontinued Operations: | ||||||
Trade payables | $ | 6,252 | ||||
Accrued liabilities | 3,986 | |||||
Accrued pension liability | 1,794 | |||||
Other liabilities | 1,666 | |||||
Total liabilities of discontinued operations | $ | 13,698 | ||||
The net income from discontinued operations includes the following:
Year Ended December 31, | ||||||||||||
(in thousands) | 2015 | 2014 | 2013 | |||||||||
Net sales | $ | 5,952 | $ | 103,392 | $ | 104,154 | ||||||
Operating income | 920 | 16,423 | 9,188 | |||||||||
Interest expense and other income (expense) | 10 | (9 | ) | (141 | ) | |||||||
Tax provision | (365 | ) | (6,479 | ) | (3,258 | ) | ||||||
Income from discontinued operations, net of tax | 565 | 9,935 | 5,789 | |||||||||
Gain on disposal of assets | 93,859 | 71 | 27,573 | |||||||||
Tax provision | (5,052 | ) | (29 | ) | (12,674 | ) | ||||||
Gain on disposal of assets, net of tax | 88,807 | 42 | 14,899 | |||||||||
Net income from discontinued operations | $ | 89,372 | $ | 9,977 | $ | 20,688 | ||||||
Based on a tax reorganization completed in anticipation of the sale of Arlon, LLC, as well as the release of Arlon, LLC's net deferred tax liabilities totaling $7.6 million, the effective tax rate on the gain on disposal of Arlon, LLC in 2015 was 5.4%.
Note 6 – Asset Impairment Charges
In the fourth quarter of 2015, a non-cash asset impairment charge of $1.4 million was recorded related to certain unused, real property located in Norristown, Pennsylvania to reflect its current market value.
In the fourth quarter of 2014, a non-cash asset impairment charge of $0.6 million was recorded related to certain equipment owned by the Company's Joining Materials segment located in Toronto, Canada to be sold or scrapped as part of the Company's integration activities associated with the Wolverine Joining acquisition. In addition, the Company recorded a $0.6 million non-cash asset impairment charge associated with certain unused, real property owned by the Company's Kasco segment located in Atlanta, Georgia in the fourth quarter of 2014.
Page | 49
Note 7 – Inventories
Inventories, net at December 31, 2015 and 2014 were comprised of:
December 31, | December 31, | |||||||
(in thousands) | 2015 | 2014 | ||||||
Finished products | $ | 31,355 | $ | 24,424 | ||||
In-process | 19,873 | 10,310 | ||||||
Raw materials | 18,451 | 12,346 | ||||||
Fine and fabricated precious metals in various stages of completion | 13,155 | 17,094 | ||||||
82,834 | 64,174 | |||||||
LIFO reserve | (30 | ) | (245 | ) | ||||
Total | $ | 82,804 | $ | 63,929 | ||||
In order to produce certain of its products, H&H purchases, maintains and utilizes precious metal inventory. H&H records certain of its precious metal inventory at the lower of LIFO cost or market, with any adjustments recorded through cost of goods sold. Remaining precious metal inventory is accounted for primarily at fair value.
Certain customers and suppliers of H&H choose to do business on a "pool" basis. Such customers or suppliers furnish precious metal to H&H for return in fabricated form or for purchase from or return to the supplier. When the customer's precious metal is returned in fabricated form, the customer is charged a fabrication charge. The value of pooled precious metal is not included on the Company's consolidated balance sheet. To the extent H&H is able to utilize customer precious metal in its production processes, such customer metal replaces the need for H&H to purchase its own inventory. As of December 31, 2015, customer metal in H&H's custody consisted of 160,363 ounces of silver, 535 ounces of gold and 1,391 ounces of palladium.
Supplemental inventory information: | December 31, | December 31, | ||||||
(in thousands, except per ounce) | 2015 | 2014 | ||||||
Precious metals stated at LIFO cost | $ | 3,506 | $ | 4,684 | ||||
Precious metals stated under non-LIFO cost methods, primarily at fair value | $ | 9,619 | $ | 12,165 | ||||
Market value per ounce: | ||||||||
Silver | $ | 13.86 | $ | 15.75 | ||||
Gold | $ | 1,062.25 | $ | 1,199.25 | ||||
Palladium | $ | 547.00 | $ | 798.00 | ||||
Note 8 – Property, Plant and Equipment
Property, plant and equipment, net at December 31, 2015 and 2014 was comprised of:
December 31, | December 31, | |||||||
(in thousands) | 2015 | 2014 | ||||||
Land | $ | 7,841 | $ | 6,416 | ||||
Buildings, machinery and equipment | 180,519 | 136,360 | ||||||
Construction in progress | 10,273 | 5,080 | ||||||
198,633 | 147,856 | |||||||
Accumulated depreciation | 85,947 | 80,235 | ||||||
Total | $ | 112,686 | $ | 67,621 | ||||
Depreciation expense for the years ended 2015, 2014 and 2013 was $14.4 million, $9.9 million and $9.2 million, respectively.
Note 9 – Goodwill and Other Intangibles
Page | 50
The changes in the net carrying amount of goodwill by reportable segment for the years ended December 31, 2015 and 2014 were as follows (in thousands):
Segment | Balance at January 1, 2015 | Foreign Currency Translation Adjustments | Additions | Adjustments | Balance at December 31, 2015 | Accumulated Impairment Losses | ||||||||||||||||||
Joining Materials | $ | 16,238 | $ | (28 | ) | $ | — | $ | — | $ | 16,210 | $ | — | |||||||||||
Tubing | 1,895 | — | — | — | 1,895 | — | ||||||||||||||||||
Building Materials | 50,120 | — | 21,268 | — | 71,388 | — | ||||||||||||||||||
Performance Materials | — | — | 32,336 | — | 32,336 | — | ||||||||||||||||||
Total | $ | 68,253 | $ | (28 | ) | $ | 53,604 | $ | — | $ | 121,829 | $ | — | |||||||||||
Segment | Balance at January 1, 2014 | Foreign Currency Translation Adjustments | Additions | Adjustments | Balance at December 31, 2014 | Accumulated Impairment Losses | ||||||||||||||||||
Joining Materials | $ | 16,275 | $ | (37 | ) | $ | — | $ | — | $ | 16,238 | $ | — | |||||||||||
Tubing | 1,895 | — | — | — | 1,895 | — | ||||||||||||||||||
Building Materials | 50,044 | — | — | 76 | 50,120 | — | ||||||||||||||||||
Total | $ | 68,214 | $ | (37 | ) | $ | — | $ | 76 | $ | 68,253 | $ | — | |||||||||||
The $21.3 million and $32.3 million additions to goodwill within the Building Materials and Performance Materials segments, respectively, during the year ended December 31, 2015 were due to the Company's ITW and JPS acquisitions discussed in Note 4 - "Acquisitions." Other intangible assets at cost as of December 31, 2015 include $4.4 million in intangible assets, primarily unpatented technology, associated with the ITW acquisition and $9.1 million in intangible assets, primarily trades names, customer relationships, and unpatented technology, associated with the JPS acquisition. The goodwill and intangible asset balances associated with the JPS acquisition are subject to adjustment during the finalization of the purchase price allocation.
Other intangible assets as of December 31, 2015 and 2014 consisted of:
(in thousands) | December 31, 2015 | December 31, 2014 | Weighted-Average Amortization Life (in Years) | ||||||||||||||||||
Cost | Accumulated Amortization | Net | Cost | Accumulated Amortization | Net | ||||||||||||||||
Customer relationships | $ | 35,077 | $ | (10,702 | ) | $ | 24,375 | $ | 31,977 | $ | (8,524 | ) | $ | 23,453 | 19.3 | ||||||
Trademarks, trade names and brand names | 12,739 | (2,649 | ) | 10,090 | 8,419 | (2,004 | ) | 6,415 | 15.8 | ||||||||||||
Patents and patent applications | 5,591 | (2,591 | ) | 3,000 | 5,354 | (2,229 | ) | 3,125 | 16.0 | ||||||||||||
Non-compete agreements | 774 | (714 | ) | 60 | 709 | (671 | ) | 38 | 8.3 | ||||||||||||
Other | 7,331 | (1,739 | ) | 5,592 | 1,358 | (1,051 | ) | 307 | 7.6 | ||||||||||||
Total | $ | 61,512 | $ | (18,395 | ) | $ | 43,117 | $ | 47,817 | $ | (14,479 | ) | $ | 33,338 | |||||||
Amortization expense totaled $4.0 million, $3.2 million and $2.7 million for the years ended December 31, 2015, 2014 and 2013, respectively. The increase in amortization expense during 2015 was principally due to the Company's acquisitions of ITW and JPS. The estimated amortization expense for each of the five succeeding years and thereafter is as follows:
Page | 51
(in thousands) | Customer Relationships | Trademarks, Trade Names and Brand Names | Patents and Patent Applications | Non-Compete Agreements | Other | Total | ||||||||||||||||||
2016 | $ | 2,306 | $ | 792 | $ | 291 | $ | 24 | $ | 828 | $ | 4,241 | ||||||||||||
2017 | 2,255 | 792 | 291 | 16 | 716 | 4,070 | ||||||||||||||||||
2018 | 2,180 | 672 | 291 | 16 | 740 | 3,899 | ||||||||||||||||||
2019 | 2,149 | 672 | 291 | 4 | 730 | 3,846 | ||||||||||||||||||
2020 | 2,136 | 672 | 291 | — | 730 | 3,829 | ||||||||||||||||||
Thereafter | 13,349 | 6,490 | 1,545 | — | 1,848 | 23,232 | ||||||||||||||||||
Total | $ | 24,375 | $ | 10,090 | $ | 3,000 | $ | 60 | $ | 5,592 | $ | 43,117 | ||||||||||||
Note 10 – Investment
The Company holds an investment in the common stock of a public company, ModusLink, which is classified as an investment in associated company on the consolidated balance sheet. HNH owned 8,436,715 and 6,383,005 shares of common stock of ModusLink at December 31, 2015 and December 31, 2014, respectively, and the value of this investment decreased from $23.9 million at December 31, 2014 to $20.9 million at December 31, 2015 due primarily to changes in the share price of ModusLink's common stock, partially offset by the additional shares of ModusLink common stock purchased by the Company during 2015.
As of March 11, 2013, SPLP and its associated companies, which include the Company, owned a combined total of 6,481,185 ModusLink common shares, which represented 14.7% of ModusLink's outstanding shares. SPLP is a majority shareholder of HNH, owning directly or indirectly through its subsidiaries in excess of 50% of HNH's common shares. The power to vote and dispose of the securities held by SPLP is controlled by Steel Partners Holdings GP Inc. ("SPH GP"). On February 11, 2013, SPLP entered into an agreement ("Investment Agreement") whereby, under certain conditions, it agreed to purchase 7,500,000 shares of ModusLink common stock at a price of $4.00 per share and receive warrants to purchase 2,000,000 additional shares of ModusLink common stock at an exercise price of $5.00 per share.
At its annual meeting held on March 12, 2013, ModusLink's stockholders voted to approve the Investment Agreement with SPLP and also to elect Warren G. Lichtenstein and Glen M. Kassan to the ModusLink Board of Directors, both of whom are current or former directors of HNH, and Mr. Lichtenstein is Executive Chairman of SPH GP. Mr. Lichtenstein was also designated Chairman of the Board of ModusLink. Also on March 12, 2013, pursuant to the terms and conditions of the Investment Agreement, SPLP purchased the 7,500,000 shares of ModusLink's common stock. As of December 31, 2015, SPLP and HNH owned approximately 15.4% and 16.1% of ModusLink's common stock, respectively, for an aggregate ownership of 31.5%. The outstanding warrants to purchase 2,000,000 additional shares of ModusLink common stock held by SPLP will expire on the date that is five years following the closing of the Investment Agreement.
As a result of the board representation described above, together with SPLP's direct ownership of an additional 15.4% of ModusLink common stock, HNH has concluded that it has significant influence over the operating and financial policies of ModusLink. The Company's investment in ModusLink became subject to the equity method of accounting as of March 12, 2013. HNH has elected the option to value its investment in ModusLink using fair value effective March 12, 2013 in order to more appropriately reflect the value of this investment in its consolidated financial statements. As a result, the Company now carries its ModusLink investment on the consolidated balance sheet at fair value, calculated based on the closing market price for ModusLink common stock, with unrealized gains and losses on the investment reported in net income.
HNH had historically accounted for its investment in ModusLink as an available-for-sale security in non-current assets on the consolidated balance sheet. The unrealized gain or loss associated with this security was included in accumulated other comprehensive loss on the consolidated balance sheet and also in the consolidated statement of changes in stockholders' equity, net of tax. The change in the unrealized gain or loss was included in other comprehensive income or loss. On March 12, 2013, the accumulated unrealized loss of $2.4 million, net of tax, related to our ModusLink investment that was recorded in accumulated other comprehensive loss was reclassified to earnings. Prior to March 12, 2013, there had been no sales or realized gains or losses from this marketable security, and no impairments, whether other-than-temporary or not, recognized in the consolidated income statement.
ModusLink's fiscal year ends on July 31. Summarized unaudited information as to assets, liabilities and results of operations of ModusLink for the quarter ended October 31, 2015, its most recently completed fiscal quarter, as well as for the years ended
Page | 52
October 31, 2015 and 2014, and for the nine months ended October 31, 2013, the nearest practicable period corresponding to the period the Company has accounted for its investment in ModusLink under the equity method of accounting, are as follows:
October 31, | July 31, | ||||||||||||||||||
(in thousands) | 2015 | 2015 | |||||||||||||||||
Current assets | $ | 464,956 | $ | 413,642 | |||||||||||||||
Non-current assets | $ | 32,656 | $ | 32,860 | |||||||||||||||
Current liabilities | $ | 275,700 | $ | 211,353 | |||||||||||||||
Non-current liabilities | $ | 92,459 | $ | 90,548 | |||||||||||||||
Stockholders' equity | $ | 129,453 | $ | 144,601 | |||||||||||||||
Three Months Ended | Year Ended | Nine Months Ended | |||||||||||||||||
October 31, | October 31, | October 31, | |||||||||||||||||
(in thousands) | 2015 | 2014 | 2015 | 2014 | 2013 | ||||||||||||||
Net revenue | $ | 141,089 | $ | 187,444 | $ | 515,318 | $ | 719,429 | $ | 545,432 | |||||||||
Gross profit | $ | 12,452 | $ | 18,838 | $ | 48,099 | $ | 71,568 | $ | 57,463 | |||||||||
(Loss) income from continuing operations | $ | (14,773 | ) | $ | 222 | $ | (33,424 | ) | $ | (16,678 | ) | $ | (16,544 | ) | |||||
Net (loss) income | $ | (14,773 | ) | $ | 222 | $ | (33,424 | ) | $ | (16,677 | ) | $ | (16,530 | ) | |||||
Note 11 – Debt
Debt at December 31, 2015 and 2014 was as follows:
December 31, | December 31, | |||||||
(in thousands) | 2015 | 2014 | ||||||
Short-term debt | ||||||||
Foreign | $ | 742 | $ | 602 | ||||
Long-term debt | ||||||||
Revolving facilities | 90,613 | 193,375 | ||||||
Other H&H debt - domestic | 6,936 | 8,014 | ||||||
Foreign loan facilities | 1,277 | 1,412 | ||||||
Sub total | 98,826 | 202,801 | ||||||
Less portion due within one year | 1,720 | 6,378 | ||||||
Total long-term debt | 97,106 | 196,423 | ||||||
Total debt | $ | 99,568 | $ | 203,403 | ||||
Long-term debt at December 31, 2015 matures in each of the next five years as follows:
(in thousands) | Total | 2016 | 2017 | 2018 | 2019 | 2020 | Thereafter | ||||||||||||||||||||
Long-term debt (a) | $ | 98,826 | $ | 1,720 | $ | 1,907 | $ | 357 | $ | 90,971 | $ | 3,871 | $ | — | |||||||||||||
(a) | Assumes repayment of the Company's senior secured revolving credit facility on its contractual maturity date. |
Senior Credit Facilities
On August 29, 2014, H&H Group entered into an amended and restated senior credit agreement ("Senior Credit Facility"), which provides for an up to $365.0 million senior secured revolving credit facility, including a $20.0 million sublimit for the issuance of letters of credit and a $20.0 million sublimit for the issuance of swing loans. Borrowings under the Senior Credit Facility bear interest, at H&H Group's option, at either LIBOR or the Base Rate, as defined, plus an applicable margin as set forth in the loan agreement (2.00% and 1.00%, respectively, for LIBOR and Base Rate borrowings at December 31, 2015), and the revolving facility provides for a commitment fee to be paid on unused borrowings. The weighted-average interest rate on the revolving facility was 2.47% at December 31, 2015. At December 31, 2015, letters of credit totaling $4.8 million had been issued
Page | 53
under the Senior Credit Facility, including $3.4 million of the letters of credit guaranteeing various insurance activities, and $1.4 million for environmental and other matters. H&H Group's availability under the Senior Credit Facility was $183.2 million as of December 31, 2015.
On January 22, 2015, H&H Group, and certain subsidiaries of H&H Group, entered into an amendment to its Senior Credit Facility to, among other things, provide for the consent of the administrative agent and the lenders, subject to compliance with certain conditions, for the tender offer by H&H Acquisition Sub for the shares of JPS, including the use of up to $71.0 million under the Senior Credit Facility to purchase such shares, and certain transactions related thereto. In addition, H&H Acquisition Sub and HNH Acquisition LLC became guarantors under the Senior Credit Facility pursuant to the amendment. See further discussion regarding the JPS transaction in Note 4 - "Acquisitions."
The Senior Credit Facility will expire, with all amounts outstanding due and payable, on August 29, 2019. The Senior Credit Facility is guaranteed by substantially all existing and thereafter acquired or created domestic and Canadian wholly-owned subsidiaries of H&H Group, and obligations under the Senior Credit Facility are collateralized by first priority security interests in and liens upon all present and future assets of H&H Group and these subsidiaries. The Senior Credit Facility restricts H&H Group's ability to transfer cash or other assets to HNH, subject to certain exceptions, including required pension payments to the WHX Corporation Pension Plan ("WHX Pension Plan"). The Senior Credit Facility is subject to certain mandatory prepayment provisions and restrictive and financial covenants, which include a maximum ratio limit on Total Leverage and a minimum ratio limit on Fixed Charge Coverage, as defined, as well as a minimum liquidity level. The Company was in compliance with all debt covenants at December 31, 2015.
The Company's prior senior credit facility, as amended, consisted of a revolving credit facility in an aggregate principal amount not to exceed $110.0 million and a senior term loan. On August 5, 2014, this agreement was further amended to, among other things, permit a new $40.0 million term loan and permit H&H Group to make a distribution to HNH of up to $80.0 million. The revolving facility provided for a commitment fee to be paid on unused borrowings. Borrowings under the prior senior credit facility bore interest, at H&H Group's option, at a rate based on LIBOR or the Base Rate, as defined, plus an applicable margin as set forth in the loan agreement. On August 29, 2014, all amounts outstanding under this agreement were repaid.
Interest Rate Swap Agreements
H&H Group entered into an interest rate swap agreement in February 2013 to reduce its exposure to interest rate fluctuations. Under the interest rate swap, the Company received one-month LIBOR in exchange for a fixed interest rate of 0.569% over the life of the agreement on an initial $56.4 million notional amount of debt, with the notional amount decreasing by $1.1 million, $1.8 million and $2.2 million per quarter in 2013, 2014 and 2015, respectively. The agreement expired in February 2016. H&H Group entered into a second interest rate swap agreement in June 2013, also to reduce its exposure to interest rate fluctuations. Under the interest rate swap, the Company received one-month LIBOR in exchange for a fixed interest rate of 0.598% over the life of the agreement on an initial $5.0 million notional amount of debt, with the notional amount decreasing by $0.1 million, $0.2 million and $0.2 million per quarter in 2013, 2014 and 2015, respectively. The agreement expired in February 2016.
WHX CS Loan
On June 3, 2014, WHX CS Corp., a wholly-owned subsidiary of the Company, entered into a credit agreement ("WHX CS Loan"), which provided for a term loan facility with borrowing availability of up to a maximum aggregate principal amount of $15.0 million. The amounts outstanding under the WHX CS Loan bore interest at LIBOR plus 1.25%. On August 29, 2014, the WHX CS Loan was terminated and all outstanding amounts thereunder were repaid.
Subordinated Notes
On March 26, 2013, H&H Group instructed Wells Fargo Bank, National Association ("Wells Fargo"), as trustee and collateral agent, to deliver an irrevocable notice of H&H Group's election to redeem all of its outstanding 10% subordinated secured notes due 2017 ("Subordinated Notes") to the holders of the Subordinated Notes. Pursuant to the terms of that certain amended and restated indenture, dated as of December 13, 2010, as amended ("Indenture"), by and among H&H Group, the guarantors named therein and Wells Fargo, as trustee and collateral agent, H&H Group also instructed Wells Fargo to redeem, on April 25, 2013, approximately $31.8 million principal amount of Subordinated Notes, representing all of the remaining outstanding Subordinated Notes, at a redemption price equal to 112.6% of the principal amount and accrued but unpaid payment-in-kind-interest thereof, plus accrued and unpaid cash interest. The Subordinated Notes were part of a unit ("Unit"), and each Unit consisted of (i) Subordinated Notes and (ii) warrants to purchase shares of common stock of the Company ("Warrants"). The Subordinated Notes and Warrants which comprised the Unit were not detachable until October 14, 2013. Accordingly, all Units were also redeemed. On March 26, 2013, H&H Group irrevocably deposited with Wells Fargo funds totaling $36.9 million for such redemption
Page | 54
and interest payment in order to satisfy and discharge its obligations under the Indenture from both a legal and accounting perspective. Interest expense for the three months ended March 31, 2013 included a $5.7 million loss associated with the redemption of the Subordinated Notes, including the redemption premium and the write-off of remaining deferred finance costs and unamortized debt discounts. The obligations outstanding under the Subordinated Notes bore interest at a rate of 10% per annum, 6% of which was payable in cash and 4% of which was payable in-kind.
Other Debt
A subsidiary of H&H has two mortgage agreements, each collateralized by real property. On October 5, 2015, this subsidiary refinanced one of its outstanding mortgage notes, which had an original maturity in October 2015. Under the terms of the revised agreement, the subsidiary paid down $0.7 million of the original outstanding principal balance. The remaining outstanding principal balance of $5.4 million was refinanced and will be repaid in equal monthly installments totaling $0.4 million per year over the next 5 years, with a final principal payment of $3.6 million due at maturity of the loan in October 2020. The mortgage bears interest at LIBOR plus a margin of 2.00%, or 2.28% at December 31, 2015. The mortgage on the second facility was approximately $1.6 million and $1.7 million at December 31, 2015 and 2014, respectively. This mortgage bears interest at LIBOR plus a margin of 2.70%, or 3.12% at December 31, 2015, and matures in 2017.
Note 12 – Derivative Instruments
Precious Metal and Commodity Inventories
As of December 31, 2015, the Company had the following outstanding forward contracts with settlement dates through January 2016. There were no futures contracts outstanding at December 31, 2015.
Notional Value | |||||||||
Commodity | Amount | ($ in millions) | |||||||
Silver | 635,000 | ounces | $ | 8.9 | |||||
Gold | 500 | ounces | $ | 0.5 | |||||
Copper | 350,000 | pounds | $ | 0.8 | |||||
Tin | 35 | metric tons | $ | 0.5 | |||||
Fair Value Hedges. Of the total forward contracts outstanding, 575,000 ounces of silver and substantially all of the copper contracts are designated and accounted for as fair value hedges.
Economic Hedges. The remaining outstanding forward contracts for silver, and all of the contracts for gold and tin, are accounted for as economic hedges.
The forward contracts were made with a counter party rated A+ by Standard & Poors. Accordingly, the Company has determined that there is minimal credit risk of default. The Company estimates the fair value of its derivative contracts through the use of market quotes or with the assistance of brokers when market information is not available. The Company maintains collateral on account with the third-party broker. Such collateral consists of both cash that varies in amount depending on the value of open contracts, as well as ounces of precious metal held on account by the broker.
Debt Agreements
H&H Group entered into two interest rate swap agreements to reduce its exposure to interest rate fluctuations. See Note 11 - "Debt" for further discussion of the terms of these arrangements.
The Company's Subordinated Notes had call premiums as well as Warrants associated with them. The Company treated the fair value of these features together as both a discount on the debt and a derivative liability at inception of the loan agreement. The discount was being amortized over the life of the notes as an adjustment to interest expense, and the derivative was marked to market at each balance sheet date. As discussed in Note 11 - "Debt," on March 26, 2013, the Company discharged its obligations associated with the Subordinated Notes and Warrants.
Effect of Derivative Instruments in the Consolidated Income Statements - Income/(Expense)
Page | 55
(in thousands) | Year Ended | |||||||||||||
December 31, | ||||||||||||||
Derivative | Income Statement Line | 2015 | 2014 | 2013 | ||||||||||
Commodity contracts | Cost of goods sold | $ | 1,467 | $ | 2,655 | $ | 2,620 | |||||||
Total derivatives designated as hedging instruments | 1,467 | 2,655 | 2,620 | |||||||||||
Commodity contracts | Cost of goods sold | 246 | 131 | (92 | ) | |||||||||
Commodity contracts | Realized and unrealized gain on derivatives | 588 | 1,307 | 1,988 | ||||||||||
Interest rate swap agreements | Interest expense | (77 | ) | (156 | ) | (328 | ) | |||||||
Derivative features of Subordinated Notes | Realized and unrealized loss on derivatives | — | — | (793 | ) | |||||||||
Total derivatives not designated as hedging instruments | 757 | 1,282 | 775 | |||||||||||
Total derivatives | $ | 2,224 | $ | 3,937 | $ | 3,395 | ||||||||
Fair Value of Derivative Instruments on the Consolidated Balance Sheets - Asset/(Liability)
(in thousands) | December 31, | December 31, | ||||||||
Derivative | Balance Sheet Location | 2015 | 2014 | |||||||
Commodity contracts | Prepaid and other current assets | $ | 197 | $ | 667 | |||||
Total derivatives designated as hedging instruments | 197 | 667 | ||||||||
Commodity contracts | Prepaid and other current assets | 18 | 97 | |||||||
Interest rate swap agreements | Other liabilities | (30 | ) | (138 | ) | |||||
Total derivatives not designated as hedging instruments | (12 | ) | (41 | ) | ||||||
Total derivatives | $ | 185 | $ | 626 | ||||||
Note 13 – Pension and Other Post-Retirement Benefits
The Company maintains several qualified and non-qualified pension and other post-retirement benefit plans. The Company's significant pension, post-retirement health care benefit and defined contribution plans are discussed below. The Company's other pension and post-retirement plans are not significant individually or in the aggregate.
Qualified Plans
HNH sponsors a defined benefit pension plan, the WHX Pension Plan, covering many of H&H's employees and certain employees of H&H's former subsidiary, Wheeling-Pittsburgh Corporation ("WPC"). The WHX Pension Plan was established in May 1998 as a result of the merger of the former H&H plans, which covered substantially all H&H employees, and the WPC plan. The WPC plan, covering most United Steel Workers of America-represented employees of WPC, was created pursuant to a collective bargaining agreement ratified on August 12, 1997. Prior to that date, benefits were provided through a defined contribution plan, the Wheeling-Pittsburgh Steel Corporation Retirement Security Plan ("RSP Plan"). The assets of the RSP Plan were merged into the WPC plan as of December 1, 1997. Under the terms of the WHX Pension Plan, the benefit formula and provisions for the WPC and H&H participants continued as they were designed under each of the respective plans prior to the merger.
The qualified pension benefits under the WHX Pension Plan were frozen as of December 31, 2005 and April 30, 2006 for hourly and salaried non-bargaining participants, respectively, with the exception of a single operating unit. In 2011, the benefits were frozen for the remainder of the participants. WPC employees ceased to be active participants in the WHX Pension Plan effective July 31, 2003, and as a result, such employees no longer accrue benefits under the WHX Pension Plan.
JPS sponsors a defined benefit pension plan ("JPS Pension Plan"), which was assumed in connection with the JPS acquisition. Under the JPS Pension Plan, substantially all of JPS's employees who were employed prior to April 1, 2005 have benefits. The JPS Pension Plan was frozen effective December 31, 2005. Employees no longer earned additional benefits after that date. Benefits earned prior to December 31, 2005 will be paid out to eligible participants following retirement. The JPS Pension Plan was "unfrozen" for employees who were active employees on or after June 1, 2012. This new benefit, calculated based on years of service and a capped average salary, will be added to the amount of any pre-2005 benefit. The JPS Pension Plan was again
Page | 56
frozen for all future accruals effective December 31, 2015, although unvested participants may still vest in accrued but unvested benefits.
Bairnco had several pension plans, which covered substantially all of its employees. In 2006, Bairnco froze the Bairnco Corporation Retirement Plan and initiated employer contributions to its 401(k) plan. On June 2, 2008, two Bairnco plans (Salaried and Kasco) were merged into the WHX Pension Plan.
Some of the Company's foreign subsidiaries provide retirement benefits for their employees through defined contribution plans or otherwise provide retirement benefits for employees consistent with local practices. The foreign plans are not significant in the aggregate and, therefore, are not included in the following disclosures.
Pension benefits under the WHX Pension Plan are based on years of service and the amount of compensation earned during the participants' employment. However, as noted above, the qualified pension benefits have been frozen for all participants.
Pension benefits for the WPC bargained participants include both defined benefit and defined contribution features, since the plan includes the account balances from the RSP Plan. The gross benefit, before offsets, is calculated based on years of service and the benefit multiplier under the plan. The net defined benefit pension plan benefit is the gross amount offset for the benefits payable from the RSP Plan and benefits payable by the Pension Benefit Guaranty Corporation from previously terminated plans. Individual employee accounts established under the RSP Plan are maintained until retirement. Upon retirement, participants who are eligible for the WHX Pension Plan and maintain RSP Plan account balances will normally receive benefits from the WHX Pension Plan. When these participants become eligible for benefits under the WHX Pension Plan, their vested balances in the RSP Plan become assets of the WHX Pension Plan. Although these RSP Plan assets cannot be used to fund any of the net benefit that is the basis for determining the defined benefit plan's net benefit obligation at the end of the year, the Company has included the amount of the RSP Plan accounts of $13.3 million and $17.7 million on a gross-basis as both assets and liabilities of the plan as of December 31, 2015 and December 31, 2014, respectively.
Certain current and retired employees of H&H are covered by post-retirement medical benefit plans, which provide benefits for medical expenses and prescription drugs. Contributions from a majority of the participants are required, and for those retirees and spouses, the Company's payments are capped.
Actuarial losses for the WHX Pension Plan are being amortized over the average future lifetime of the participants, which is expected to be approximately 20 years. The Company believes that use of the future lifetime of the participants is appropriate because the WHX Pension Plan is completely inactive.
The components of pension expense and other post-retirement benefit (income) expense for the Company's benefit plans included the following:
Pension Benefits | Other Post-Retirement Benefits | |||||||||||||||||||||||
(in thousands) | 2015 | 2014 | 2013 | 2015 | 2014 | 2013 | ||||||||||||||||||
Service cost | $ | 54 | $ | — | $ | — | $ | — | $ | — | $ | — | ||||||||||||
Interest cost | 21,286 | 20,518 | 18,447 | 46 | 49 | 98 | ||||||||||||||||||
Expected return on plan assets | (25,046 | ) | (24,157 | ) | (23,900 | ) | — | — | — | |||||||||||||||
Amortization of prior service cost | — | — | 32 | (103 | ) | (103 | ) | — | ||||||||||||||||
Amortization of actuarial loss | 11,186 | 7,378 | 10,627 | 37 | 34 | 8 | ||||||||||||||||||
Total | $ | 7,480 | $ | 3,739 | $ | 5,206 | $ | (20 | ) | $ | (20 | ) | $ | 106 | ||||||||||
Actuarial assumptions used to develop the components of pension expense and other post-retirement benefit (income) expense were as follows:
Page | 57
Pension Benefits | Other Post-Retirement Benefits | |||||||||||||||||
2015 | 2014 | 2013 | 2015 | 2014 | 2013 | |||||||||||||
Discount rates: | ||||||||||||||||||
WHX Pension Plan | 3.70 | % | 4.40 | % | 3.50 | % | N/A | N/A | N/A | |||||||||
JPS Pension Plan | 4.00 | % | N/A | N/A | N/A | N/A | N/A | |||||||||||
Other post-retirement benefit plans | N/A | N/A | N/A | 3.55 | % | 4.10 | % | 3.65 | % | |||||||||
Expected return on assets | 7.00 | % | 7.00 | % | 7.50 | % | N/A | N/A | N/A | |||||||||
Rate of compensation increase | N/A | N/A | N/A | N/A | N/A | N/A | ||||||||||||
Health care cost trend rate - initial | N/A | N/A | N/A | 6.75 | % | 7.00 | % | 7.25 | % | |||||||||
Health care cost trend rate - ultimate | N/A | N/A | N/A | 5.00 | % | 5.00 | % | 5.00 | % | |||||||||
Year ultimate reached | N/A | N/A | N/A | 2022 | 2022 | 2022 | ||||||||||||
The measurement date for plan obligations is December 31. The discount rate is the rate at which the plans' obligations could be effectively settled and is based on high quality bond yields as of the measurement date.
Summarized below is a reconciliation of the funded status for the Company's qualified defined benefit pension plans and post-retirement benefit plan:
Page | 58
Pension Benefits | Other Post-Retirement Benefits | |||||||||||||||
(in thousands) | 2015 | 2014 | 2015 | 2014 | ||||||||||||
Change in benefit obligation: | ||||||||||||||||
Benefit obligation at January 1 | $ | 531,824 | $ | 494,272 | $ | 1,356 | $ | 1,084 | ||||||||
JPS Pension Plan acquisition | 117,688 | — | — | — | ||||||||||||
Service cost | 54 | — | — | — | ||||||||||||
Interest cost | 21,286 | 20,518 | 46 | 49 | ||||||||||||
Actuarial (gain) loss | (19,814 | ) | 51,274 | 159 | 293 | |||||||||||
Participant contributions | — | — | 1 | 1 | ||||||||||||
Benefits paid | (37,644 | ) | (34,276 | ) | (349 | ) | (71 | ) | ||||||||
Transfer from Canfield Salaried SEPP | — | 36 | — | — | ||||||||||||
Benefit obligation at December 31 | $ | 613,394 | $ | 531,824 | $ | 1,213 | $ | 1,356 | ||||||||
Change in plan assets: | ||||||||||||||||
Fair value of plan assets at January 1 | $ | 323,493 | $ | 351,869 | $ | — | $ | — | ||||||||
JPS Pension Plan acquisition | 87,321 | — | — | — | ||||||||||||
Actual returns on plan assets | (43,273 | ) | (14,676 | ) | — | — | ||||||||||
Participant contributions | — | — | 1 | 1 | ||||||||||||
Benefits paid | (37,644 | ) | (34,276 | ) | (349 | ) | (71 | ) | ||||||||
Company contributions | 18,024 | 20,540 | 348 | 70 | ||||||||||||
Transfer from Canfield Salaried SEPP | — | 36 | — | — | ||||||||||||
Fair value of plan assets at December 31 | 347,921 | 323,493 | — | — | ||||||||||||
Funded status | $ | (265,473 | ) | $ | (208,331 | ) | $ | (1,213 | ) | $ | (1,356 | ) | ||||
Accumulated benefit obligation ("ABO") for qualified defined benefit plans: | ||||||||||||||||
ABO at January 1 | $ | 531,824 | $ | 494,272 | $ | 1,356 | $ | 1,084 | ||||||||
ABO at December 31 | $ | 613,394 | $ | 531,824 | $ | 1,213 | $ | 1,356 | ||||||||
Amounts recognized on the consolidated balance sheet: | ||||||||||||||||
Current liability | $ | — | $ | — | $ | (119 | ) | $ | (124 | ) | ||||||
Non-current liability | (265,473 | ) | (208,331 | ) | (1,094 | ) | (1,232 | ) | ||||||||
Total | $ | (265,473 | ) | $ | (208,331 | ) | $ | (1,213 | ) | $ | (1,356 | ) | ||||
The weighted-average assumptions used in the valuations at December 31 were as follows:
Pension Benefits | Other Post-Retirement Benefits | |||||||||||
2015 | 2014 | 2015 | 2014 | |||||||||
Discount rates: | ||||||||||||
WHX Pension Plan | 4.01 | % | 3.70 | % | N/A | N/A | ||||||
JPS Pension Plan | 3.93 | % | N/A | N/A | N/A | |||||||
Other post-retirement benefit plans | N/A | N/A | 3.89 | % | 3.55 | % | ||||||
Rate of compensation increase | N/A | N/A | N/A | N/A | ||||||||
Health care cost trend rate - initial | N/A | N/A | 6.50 | % | 6.75 | % | ||||||
Health care cost trend rate - ultimate | N/A | N/A | 5.00 | % | 5.00 | % | ||||||
Year ultimate reached | N/A | N/A | 2022 | 2022 | ||||||||
Page | 59
The effect of a 1% increase (decrease) in health care cost trend rates on benefit expense and on other post-retirement benefit obligations is not significant.
Pretax amounts included in accumulated other comprehensive loss (income) at December 31, 2015 and 2014 were as follows:
Pension Benefits | Other Post-Retirement Benefits | |||||||||||||||
(in thousands) | 2015 | 2014 | 2015 | 2014 | ||||||||||||
Prior service cost (credit) | $ | — | $ | — | $ | (1,299 | ) | $ | (1,402 | ) | ||||||
Net actuarial loss | 322,451 | 285,132 | 820 | 698 | ||||||||||||
Accumulated other comprehensive loss (income) | $ | 322,451 | $ | 285,132 | $ | (479 | ) | $ | (704 | ) | ||||||
The pretax amount of actuarial losses and prior service cost (credit) included in accumulated other comprehensive loss (income) at December 31, 2015 that is expected to be recognized in net periodic benefit cost (income) in 2016 is $13.3 million and $0.0 million, respectively, for the defined benefit pension plans, and $0.0 million and $(0.1) million, respectively, for the other post-retirement benefit plan.
Other changes in plan assets and benefit obligations recognized in comprehensive (loss) income are as follows:
Pension Benefits | Other Post-Retirement Benefits | |||||||||||||||||||||||
(in thousands) | 2015 | 2014 | 2013 | 2015 | 2014 | 2013 | ||||||||||||||||||
Current year actuarial (loss) gain | $ | (48,505 | ) | $ | (90,106 | ) | $ | 54,111 | $ | (159 | ) | $ | (293 | ) | $ | 1,403 | ||||||||
Amortization of actuarial loss | 11,186 | 7,378 | 10,627 | 37 | 34 | 8 | ||||||||||||||||||
Current year prior service credit | — | — | — | — | — | 1,506 | ||||||||||||||||||
Amortization of prior service cost (credit) | — | — | 32 | (103 | ) | (103 | ) | — | ||||||||||||||||
Total recognized in comprehensive (loss) income | $ | (37,319 | ) | $ | (82,728 | ) | $ | 64,770 | $ | (225 | ) | $ | (362 | ) | $ | 2,917 | ||||||||
The actuarial loss in 2015 occurred principally because the investment returns on the assets of the WHX Pension Plan were lower than actuarial assumptions, partially offset by an increase in discount rates based on changes in corporate bond yields.
Benefit obligations were in excess of plan assets for both the pension plans and the other post-retirement benefit plan at both December 31, 2015 and 2014. Additional information for the plans with accumulated benefit obligations in excess of plan assets:
Pension Benefits | Other Post-Retirement Benefits | |||||||||||||||
(in thousands) | 2015 | 2014 | 2015 | 2014 | ||||||||||||
Projected benefit obligation | $ | 613,394 | $ | 531,824 | $ | 1,213 | $ | 1,356 | ||||||||
Accumulated benefit obligation | $ | 613,394 | $ | 531,824 | $ | 1,213 | $ | 1,356 | ||||||||
Fair value of plan assets | $ | 347,921 | $ | 323,493 | $ | — | $ | — | ||||||||
In determining the expected long-term rate of return on plan assets, the Company evaluated input from various investment professionals. In addition, the Company considered its historical compound returns, as well as the Company's forward-looking expectations. The Company determines its actuarial assumptions for its pension and other post-retirement benefit plans on December 31 of each year to calculate liability information as of that date and pension and other post-retirement benefit expense for the following year. The discount rate assumption is derived from the rate of return on high-quality bonds as of December 31 of each year.
The Company's investment policy is to maximize the total rate of return with a view to long-term funding objectives of the pension plans to ensure that funds are available to meet benefit obligations when due. Pension plan assets are diversified to the extent necessary to minimize risk and to achieve an optimal balance between risk and return. There are no target allocations. The pension plans' assets are diversified as to type of assets, investment strategies employed and number of investment managers used. Investments may include equities, fixed income, cash equivalents, convertible securities and private investment funds. Derivatives may be used as part of the investment strategy. The Company may direct the transfer of assets between investment managers in order to rebalance the portfolio in accordance with asset allocation guidelines established by the Company.
Page | 60
The fair value of pension investments is defined by reference to one of three categories (Level 1, Level 2 or Level 3) based on the reliability of inputs, as such terms are defined in Note 18 - "Fair Value Measurements."
The pension plan assets at December 31, 2015 and 2014, by asset category, are as follows (in thousands):
Fair Value Measurements as of December 31, 2015: | ||||||||||||||||
Assets at Fair Value as of December 31, 2015 | ||||||||||||||||
Asset Class | Level 1 | Level 2 | Level 3 | Total | ||||||||||||
Fixed income security: | ||||||||||||||||
Credit contract | $ | — | $ | 3,100 | $ | — | $ | 3,100 | ||||||||
Pension assets subject to leveling | $ | — | $ | 3,100 | $ | — | 3,100 | |||||||||
Pension assets measured at net asset value (1) | ||||||||||||||||
Hedge funds: (2) | ||||||||||||||||
Equity long/short | 2,706 | |||||||||||||||
Event driven | 45,660 | |||||||||||||||
Fund of funds - international large cap growth (3) | 4,531 | |||||||||||||||
Common trust funds: (2) | ||||||||||||||||
Large cap equity | 35,081 | |||||||||||||||
Mid-cap equity | 9,040 | |||||||||||||||
Small-cap equity | 5,158 | |||||||||||||||
International equity | 4,664 | |||||||||||||||
Intermediate bond fund | 6,492 | |||||||||||||||
Other | 662 | |||||||||||||||
Insurance separate account (4) | 15,013 | |||||||||||||||
Total pension assets measured at net asset value | 129,007 | |||||||||||||||
Cash and cash equivalents | 166,503 | |||||||||||||||
Net receivables | 49,311 | |||||||||||||||
Total pension assets | $ | 347,921 | ||||||||||||||
Fair Value Measurements as of December 31, 2014: | ||||||||||||||||
Assets (Liabilities) at Fair Value as of December 31, 2014 | ||||||||||||||||
Asset Class | Level 1 | Level 2 | Level 3 | Total | ||||||||||||
Equity securities: | ||||||||||||||||
U.S. large cap | $ | 9,548 | $ | — | $ | — | $ | 9,548 | ||||||||
U.S. mid-cap growth | 36,771 | — | — | 36,771 | ||||||||||||
U.S. small-cap value | 18,207 | 2,626 | — | 20,833 | ||||||||||||
International large cap value | 10,058 | — | — | 10,058 | ||||||||||||
Emerging markets growth | 375 | — | — | 375 | ||||||||||||
Equity contracts | 240 | 2,330 | — | 2,570 | ||||||||||||
Fixed income securities: | ||||||||||||||||
Corporate bonds and loans | — | 50,895 | — | 50,895 | ||||||||||||
Shorts | (46,909 | ) | (206 | ) | — | (47,115 | ) | |||||||||
Pension assets subject to leveling | $ | 28,290 | $ | 55,645 | $ | — | 83,935 | |||||||||
Pension assets measured at net asset value (1) | ||||||||||||||||
Hedge funds: (2) | ||||||||||||||||
Equity long/short | 72,497 | |||||||||||||||
Event driven | 50,131 | |||||||||||||||
Page | 61
Fund of funds: (3) | ||||||||||||||||
Equity long/short | 34,705 | |||||||||||||||
Global opportunities | 7,126 | |||||||||||||||
Total pension assets measured at net asset value | 164,459 | |||||||||||||||
Cash and cash equivalents | 75,099 | |||||||||||||||
Total pension assets | $ | 323,493 | ||||||||||||||
(1) | Certain investments that are measured at fair value using the net asset value per share (or its equivalent) practical expedient have not been classified in the fair value hierarchy. |
(2) | Hedge funds and common trust funds are comprised of shares or units in commingled funds that may not be publicly traded. The underlying assets in these funds are primarily publicly traded equity securities, fixed income securities and commodity-related securities and are valued at their net asset values which are calculated by the investment manager or sponsor of the fund and have daily or monthly liquidity. |
(3) | Fund of funds consist of fund-of-fund LLC or commingled fund structures. The underlying assets in these funds are primarily publicly traded equity securities, fixed income securities and commodity-related securities. The LLCs are valued based on net asset values calculated by the fund and are not publicly available. |
(4) | The JPS Pension Plan holds a deposit administration group annuity contract with an immediate participation guarantee from Transamerica Life Insurance Company ("TFLIC"). The TFLIC contract unconditionally guarantees benefits to certain salaried JPS Pension Plan participants earned through June 30, 1984 in the plan of a predecessor employer. The assets deposited under the contract are held in a separate custodial account ("TFLIC Assets"). If the TFLIC Assets decrease to the level of the trigger point (as defined in the contract), which represents the guaranteed benefit obligation representing the accumulated plan benefits as of June 30, 1984, TFLIC has the right to cause annuities to be purchased for the individuals covered by these contract agreements. Since the TFLIC Assets have remained in excess of the trigger point, no annuities have been purchased for the individuals covered by these contract arrangements. |
There were no assets for which fair value was determined using significant unobservable inputs (Level 3) during 2015. Changes in Level 3 assets were as follows during 2014 (in thousands):
Changes in Fair Value Measurements Using Significant Unobservable Inputs (Level 3) | ||||
Year Ended December 31, 2014 | Corporate Bonds and Loans | |||
Beginning balance as of January 1, 2014 | $ | 500 | ||
Transfers into Level 3 | — | |||
Transfers out of Level 3 | — | |||
Gains or losses included in changes in net assets | 73 | |||
Purchases, issuances, sales and settlements | ||||
Purchases | — | |||
Issuances | — | |||
Sales | (573 | ) | ||
Settlements | — | |||
Ending balance as of December 31, 2014 | $ | — | ||
The Company's policy is to recognize transfers in and transfers out of Level 3 as of the date of the event or change in circumstances that caused the transfer.
The following tables present the category, fair value, redemption frequency and redemption notice period for those assets whose fair value was estimated using the net asset value per share (or its equivalents), as well as plan assets which have redemption notice periods, as of December 31, 2015 and December 31, 2014 (in thousands):
Page | 62
Class Name | Description | Fair Value December 31, 2015 | Redemption Frequency | Redemption Notice Period | ||||||
Hedge funds | Event driven hedge funds | $ | 45,660 | Monthly | 90 day notice | |||||
Fund of funds | International large cap growth | $ | 4,531 | (1) | (1) | |||||
Hedge funds | Equity long/short hedge funds | $ | 2,706 | (1) | (1) | |||||
Common trust funds | Collective equity investment funds | $ | 61,097 | Daily | 0-2 days | |||||
Insurance separate account | Insurance separate account | $ | 15,013 | (2) | (2) | |||||
(1) | Request for redemption has been submitted. |
(2) | Except for benefit payments to participants and beneficiaries and related expenses, withdrawals are restricted for substantially all of the assets in the account, as defined in the contract. However, a suspension or transfer can be requested with 30 day notice. When funds are exhausted either by benefit payments, purchase of annuity contracts or transfer, the related contract terminates. |
Class Name | Description | Fair Value December 31, 2014 | Redemption Frequency | Redemption Notice Period | ||||||
Fund of funds | Equity long/short hedge funds | $ | 5,479 | Quarterly | 45 day notice | |||||
Fund of funds | Fund of fund composites | $ | 36,352 | Quarterly | 65 day notice | |||||
Hedge funds | Equity long/short hedge funds | $ | 59,727 | Annually | 45 day notice | |||||
Hedge funds | Event driven hedge funds | $ | 50,131 | Monthly | 90 day notice | |||||
Hedge funds | Equity long/short hedge funds | $ | 12,770 | Annually | 90 day notice | |||||
Separately managed fund | Separately managed fund | $ | 28,917 | Monthly | 30 day notice | |||||
Separately managed fund | Separately managed fund | $ | 66,851 | Quarterly | 45 day notice | |||||
Contributions
Employer contributions consist of funds paid from employer assets into a qualified pension trust account. The Company's funding policy is to contribute annually an amount that satisfies the minimum funding standards of the Employee Retirement Income Security Act.
The Company expects to have required minimum pension contributions for 2016, 2017, 2018, 2019, 2020 and for the five years thereafter of $16.5 million, $34.3 million, $42.0 million, $38.8 million, $35.3 million and $92.5 million, respectively. Required future contributions are estimated based upon assumptions such as discount rates on future obligations, assumed rates of return on plan assets and legislative changes. Actual future pension costs and required funding obligations will be affected by changes in the factors and assumptions described in the previous sentence, as well as other changes such as any plan termination or other acceleration events.
Benefit Payments
Estimated future benefit payments for the benefit plans over the next ten years are as follows (in thousands):
Pension | Other Post-Retirement | |||||||
Years | Benefits | Benefits | ||||||
2016 | $ | 44,406 | $ | 119 | ||||
2017 | 44,062 | 107 | ||||||
2018 | 43,590 | 105 | ||||||
2019 | 43,095 | 106 | ||||||
2020 | 42,513 | 89 | ||||||
2021-2025 | 200,531 | 385 | ||||||
401(k) Plans
Page | 63
Certain employees participate in a Company sponsored savings plan, which qualifies under Section 401(k) of the Internal Revenue Code. This savings plan allows eligible employees to contribute from 1% to 75% of their income on a pretax basis. The Company presently makes a contribution to match 50% of the first 6% of the employee's contribution. The charge to expense for the Company's matching contributions amounted to $1.9 million, $2.0 million and $1.6 million in 2015, 2014 and 2013, respectively.
Note 14 – Stockholders' Equity
The Company's authorized capital stock is a total of 185,000,000 shares, consisting of 180,000,000 shares of common stock and 5,000,000 shares of preferred stock. Of the authorized shares, no shares of preferred stock have been issued. As of December 31, 2015 and 2014, 12,208,016 and 10,779,451 shares of common stock were outstanding, respectively.
Although the Board of Directors of HNH is expressly authorized to fix the designations, preferences and rights, limitations or restrictions of the preferred stock by adoption of a Preferred Stock Designation resolution, the Board of Directors has not yet done so. The common stock of HNH has voting power, is entitled to receive dividends when and if declared by the Board of Directors and is subject to any preferential dividend rights of any then-outstanding preferred stock, and in liquidation, after distribution of the preferential amount, if any, due to preferred stockholders, the common stockholders are entitled to receive all the remaining assets of the corporation.
JPS Acquisition
As discussed in Note 4 - "Acquisitions," the Company issued 1,429,407 shares of common stock during the year ended December 31, 2015 in connection with the JPS acquisition.
Common Stock Repurchase Programs
On May 29, 2013, the Company's Board of Directors approved the repurchase of up to an aggregate of $2.0 million of the Company's common stock. On June 27, 2013, the Board of Directors further approved the repurchase of up to an aggregate of $8.0 million of the Company's common stock, which was in addition to the previously approved repurchase of up to an aggregate of $2.0 million of common stock. Such repurchases were made from time to time on the open market at prevailing market prices or in negotiated transactions off the market, in compliance with applicable laws and regulations. The Company repurchased 458,131 shares for a total purchase price of approximately $9.8 million under the repurchase program, which concluded at the end of 2013.
On March 24, 2014, the Company's Board of Directors approved the repurchase of up to an aggregate of $10.0 million of the Company's common stock. On June 6, 2014, the Board of Directors further approved the repurchase of up to an aggregate of $3.0 million of the Company's common stock, which was in addition to the previously approved repurchase of up to an aggregate of $10.0 million of common stock. Such repurchases were made from time to time on the open market at prevailing market prices or in negotiated transactions off the market, in compliance with applicable laws and regulations. The Company repurchased 242,383 shares for a total purchase price of approximately $5.8 million under the repurchase program, which concluded at the end of 2014.
Tender Offer
On August 7, 2014, the Company commenced a tender offer to purchase for cash up to $60.0 million in value of shares of its common stock. The tender offer expired on September 5, 2014, and a total of 2,099,843 shares were properly tendered and repurchased by the Company at a price of $26.00 per share, for a total cost of approximately $54.7 million, including related fees and expenses.
Accumulated Other Comprehensive Loss
Changes, net of tax, in accumulated other comprehensive loss and its components follow:
(in thousands) | Foreign Currency Translation Adjustments | Changes in Net Pension and Other Benefit Obligations | Total | |||||||||
Balance at December 31, 2014 | $ | (1,957 | ) | $ | (233,865 | ) | $ | (235,822 | ) | |||
Current period loss | (1,620 | ) | (21,950 | ) | (23,570 | ) | ||||||
Balance at December 31, 2015 | $ | (3,577 | ) | $ | (255,815 | ) | $ | (259,392 | ) | |||
Page | 64
Income tax benefits (provisions) of $13.8 million, $31.9 million and $(28.7) million were recorded in accumulated other comprehensive loss for 2015, 2014 and 2013, respectively.
Note 15 – Stock-Based Compensation
The Company has granted restricted stock awards and stock options under its 2007 Incentive Stock Plan, as amended ("2007 Plan"), to certain employees, members of the Board of Directors and service providers. The Company's stockholders have authorized the issuance of 2,075,000 shares under the 2007 Plan. As of December 31, 2015, there were 661,594 shares reserved for future issuance under the 2007 Plan.
Restricted Stock
Restricted stock grants made to employees are in lieu of a long-term incentive plan component in the Company's bonus plan for those individuals who receive shares of restricted stock. Compensation expense is measured based on the fair value of the stock-based awards on the grant date, as measured by the NASDAQ closing price for the Company's common stock. Compensation expense is recognized in the consolidated income statement on a straight-line basis over the requisite service period, which is the vesting period. Restricted stock grants made to the employees and service providers vest in approximately equal annual installments over a three year period from the grant date. Restricted stock grants to the Company's non-employee directors vest one year from the grant date. The Company allows certain grantees to forego the issuance of shares to meet applicable income tax withholding due as a result of the vesting of restricted stock. Such shares are returned to the unissued shares of the Company's common stock.
Restricted stock activity under the 2007 Plan was as follows for the year end December 31, 2015:
Employees and | |||||||||
(shares) | Service Providers | Directors | Total | ||||||
Balance, January 1, 2015 | 616,248 | 785,000 | 1,401,248 | ||||||
Granted | 12,439 | 40,275 | 52,714 | ||||||
Forfeited | (9,010 | ) | — | (9,010 | ) | ||||
Reduced for income tax obligations | (44,546 | ) | — | (44,546 | ) | ||||
Balance, December 31, 2015 | 575,131 | 825,275 | 1,400,406 | ||||||
Vested at December 31, 2015 | 497,987 | 785,733 | 1,283,720 | ||||||
Non-vested at December 31, 2015 | 77,144 | 39,542 | 116,686 | ||||||
The Company recognized compensation expense related to restricted shares of $3.4 million, $5.1 million and $4.9 million for the years ended December 31, 2015, 2014 and 2013, respectively. Unearned compensation expense related to restricted shares at December 31, 2015 is $1.2 million, which is net of an estimated 5% forfeiture rate for employees and service providers. This amount will be recognized over the remaining vesting period of the restricted shares.
Stock Options
In July 2007, stock options were granted to certain employees and directors under the 2007 Plan. The 2007 Plan permits options to be granted up to a maximum contractual term of 10 years. The Company's policy is to use shares of unissued common stock upon exercise of stock options. The Company recorded no compensation expense related to its stock options in 2015, 2014 or 2013 since the options were fully vested.
Stock option activity under the Company's 2007 Plan was as follows in 2015:
Page | 65
Options | Shares (000's) | Weighted-Average Exercise Price | Weighted-Average Remaining Contractual Term (Years) | Aggregate Intrinsic Value (000's) | |||||||||
Outstanding options at December 31, 2014 | 38 | $ | 90 | 1.34 | $ | — | |||||||
Granted | — | — | — | ||||||||||
Exercised | — | — | — | ||||||||||
Forfeited | (25 | ) | 90 | — | |||||||||
Outstanding at December 31, 2015 | 13 | $ | 90 | 0.34 | $ | — | |||||||
Exercisable at December 31, 2015 | 13 | $ | 90 | 0.34 | $ | — | |||||||
Note 16 – Income Taxes
Income (loss) from continuing operations before tax and equity investment for the three years ended December 31 is as follows:
Year Ended December 31, | ||||||||||||
(in thousands) | 2015 | 2014 | 2013 | |||||||||
Domestic | $ | 40,258 | $ | 39,154 | $ | 27,678 | ||||||
Foreign | 1,262 | 148 | (182 | ) | ||||||||
Total income from continuing operations before tax and equity investment | $ | 41,520 | $ | 39,302 | $ | 27,496 | ||||||
The provision for (benefit from) income taxes for the three years ended December 31 is as follows:
Year Ended December 31, | ||||||||||||||
(in thousands) | 2015 | 2014 | 2013 | |||||||||||
Current | ||||||||||||||
Federal | $ | 497 | $ | (413 | ) | $ | 146 | |||||||
State | 2,179 | 2,164 | 1,677 | |||||||||||
Foreign | 711 | 877 | 572 | |||||||||||
Total income taxes, current | 3,387 | 2,628 | 2,395 | |||||||||||
Deferred | ||||||||||||||
Federal | 12,993 | 14,110 | 9,168 | |||||||||||
State | 1,729 | 495 | 1,041 | |||||||||||
Foreign | (112 | ) | (225 | ) | (443 | ) | ||||||||
Total income taxes, deferred | 14,610 | 14,380 | 9,766 | |||||||||||
Total income tax provision | $ | 17,997 | $ | 17,008 | $ | 12,161 | ||||||||
Deferred income taxes result from temporary differences in the financial basis and tax basis of assets and liabilities. The amounts shown on the following table represent the tax effect of temporary differences between the Company's consolidated tax return basis of assets and liabilities and the corresponding basis for financial reporting, as well as tax credit and net operating loss carryforwards.
Page | 66
(in thousands) | December 31, | December 31, | ||||||
Deferred Income Tax Sources | 2015 | 2014 | ||||||
Inventories | $ | 330 | $ | 2,247 | ||||
Environmental costs | 1,013 | 913 | ||||||
Accrued liabilities | 4,927 | 2,984 | ||||||
Post-retirement and post-employment employee benefits | 896 | 1,015 | ||||||
Net operating loss carryforwards | 29,544 | 31,890 | ||||||
Pension liability | 98,556 | 78,835 | ||||||
Minimum tax credit carryforwards | 7,356 | 3,736 | ||||||
Miscellaneous other | 7,009 | 2,719 | ||||||
Deferred income tax assets before valuation allowance | 149,631 | 124,339 | ||||||
Valuation allowance | (4,267 | ) | (2,139 | ) | ||||
Deferred income tax assets | 145,364 | 122,200 | ||||||
Property, plant and equipment | (15,112 | ) | (13,708 | ) | ||||
Intangible assets | (9,847 | ) | (9,161 | ) | ||||
Undistributed foreign earnings | (256 | ) | (902 | ) | ||||
Deferred income tax liabilities | (25,215 | ) | (23,771 | ) | ||||
Net deferred income tax assets (a) | $ | 120,149 | $ | 98,429 | ||||
Foreign: | ||||||||
Net operating loss carryforwards | $ | 1,340 | $ | 960 | ||||
Valuation allowance | (1,340 | ) | (960 | ) | ||||
Foreign deferred income tax assets | — | — | ||||||
Foreign deferred tax liabilities | (402 | ) | (186 | ) | ||||
Net foreign deferred income tax liabilities (a) | $ | (402 | ) | $ | (186 | ) | ||
(a) | Prior to the adoption of ASU No. 2015-17, deferred income tax assets and liabilities were required to be presented as current and non-current on the consolidated balance sheet. In 2015, the Company adopted ASU No. 2015-17 retrospectively. Current deferred income tax assets at December 31, 2014 of $26.7 million were reclassified from current to non-current to conform to the 2015 presentation, and current deferred income tax liabilities at December 31, 2014 of $0.2 million were also reclassified from current to non-current to conform to the 2015 presentation. |
Included in deferred income tax assets as of December 31, 2015 is a $25.0 million tax effect of the Company's U.S. federal NOLs of $71.3 million, as well as certain state NOLs. Included in these amounts is approximately $47.0 million of U.S. federal NOLs resulting from the JPS acquisition. The utilization of the JPS NOL is subject to certain annual limitations under the ownership change rules of Section 382 of the Internal Revenue Code. The U.S. federal NOLs expire between 2020 and 2031. Also included in deferred income tax assets are tax credit carryforwards of $7.4 million. The Company's 2015 tax provisions from continuing and discontinued operations reflect the utilization of approximately $57.3 million of U.S. federal NOLs.
In 2005, the Company experienced an ownership change as defined by Section 382 of the Internal Revenue Code upon its emergence from bankruptcy. Section 382 imposes annual limitations on the utilization of NOLs post-ownership change. The Company believes it qualifies for the bankruptcy exception to the general Section 382 limitations. Under this exception, the annual limitation imposed by Section 382 resulting from an ownership change will not apply; instead the NOLs must be reduced by certain interest expense paid to creditors who became stockholders as a result of the bankruptcy reorganization. Thus, the Company's U.S. federal NOLs of $71.3 million as of December 31, 2015 include a reduction of $31.0 million ($10.8 million tax-effect).
The Company provides for income taxes on the undistributed earnings of non-U.S. corporate subsidiaries, except to the extent that such earnings are permanently invested outside the United States. As of December 31, 2015, $6.2 million of accumulated undistributed earnings of non-U.S. corporate subsidiaries were permanently invested. At existing U.S. and state statutory income tax rates, additional taxes of approximately $2.5 million would need to be provided if such earnings were remitted.
Page | 67
The provision for income taxes differs from the amount of income tax determined by applying the applicable U.S. statutory federal income tax rate to pretax income as follows:
Year Ended December 31, | ||||||||||||
(in thousands) | 2015 | 2014 | 2013 | |||||||||
Income from continuing operations before tax and equity investment | $ | 41,520 | $ | 39,302 | $ | 27,496 | ||||||
Tax provision at statutory rate | $ | 14,532 | $ | 13,755 | $ | 9,624 | ||||||
Increase (decrease) in tax due to: | ||||||||||||
State income tax, net of federal effect | 3,134 | 1,991 | 2,131 | |||||||||
Net increase in valuation allowance | 366 | 487 | 133 | |||||||||
Decrease in liability for uncertain tax positions | (381 | ) | (70 | ) | (679 | ) | ||||||
Foreign tax differential | (209 | ) | 101 | 71 | ||||||||
Other items, net | 555 | 744 | 881 | |||||||||
Tax provision | $ | 17,997 | $ | 17,008 | $ | 12,161 | ||||||
U.S. GAAP provides that the tax effects from an uncertain tax position can be recognized in the financial statements only if the position is more likely than not of being sustained on audit, based on the technical merits of the position. At December 31, 2015 and 2014, the Company had approximately $1.8 million and $1.3 million of unrecognized state tax benefits recorded, respectively, all of which, net of federal benefit, would affect the Company's effective tax rate if recognized. The changes in the amount of unrecognized tax benefits during 2015 and 2014 were as follows:
Year Ended December 31, | ||||||||
(in thousands) | 2015 | 2014 | ||||||
Beginning balance | $ | 1,274 | $ | 1,344 | ||||
Additions for tax positions related to current year | 787 | 144 | ||||||
Additions due to interest accrued | 85 | 61 | ||||||
Tax positions of prior years: | ||||||||
Payments | (57 | ) | — | |||||
Due to lapsed statutes of limitations | (303 | ) | (275 | ) | ||||
Ending balance | $ | 1,786 | $ | 1,274 | ||||
The Company recognizes interest and penalties related to uncertain tax positions in its income tax provision. At both December 31, 2015 and 2014, approximately $0.1 million of interest related to uncertain tax positions was accrued. No penalties were accrued. It is reasonably possible that the total amount of unrecognized tax benefits will decrease by as much as $0.3 million during the next year as a result of the lapse of the applicable statutes of limitations in certain taxing jurisdictions.
The Company is generally no longer subject to federal, state or local income tax examinations by tax authorities for any year prior to 2012. However, NOLs generated in prior years are subject to examination and potential adjustment by the Internal Revenue Service ("IRS") upon their utilization in future years' tax returns.
The Company is not currently under examination by the IRS. In 2014, the IRS completed a limited review of our 2012 federal consolidated income tax return, accepting the return as filed. An IRS examination of our federal consolidated income tax return for 2010 was settled during 2013 with minor adjustments.
The Company was under examination by the State of New York for 2009 to 2011, which resulted in an assessment of $0.1 million paid during 2015. An examination by the State of New York for tax years 2012 to 2013 has not yet commenced.
Note 17 – Earnings Per Share
The computation of basic earnings per share of common stock is calculated by dividing net income by the weighted-average number of shares of the Company's common stock outstanding, as follows:
Page | 68
Year Ended December 31, | ||||||||||||
(in thousands, except per share) | 2015 | 2014 | 2013 | |||||||||
Income from continuing operations, net of tax | $ | 16,991 | $ | 15,193 | $ | 21,341 | ||||||
Weighted-average number of common shares outstanding | 11,380 | 12,334 | 13,251 | |||||||||
Income from continuing operations, net of tax, per share | $ | 1.49 | $ | 1.23 | $ | 1.61 | ||||||
Net income from discontinued operations | $ | 89,372 | $ | 9,977 | $ | 20,688 | ||||||
Weighted-average number of common shares outstanding | 11,380 | 12,334 | 13,251 | |||||||||
Discontinued operations, net of tax, per share | $ | 7.86 | $ | 0.81 | $ | 1.56 | ||||||
Net income | $ | 106,363 | $ | 25,170 | $ | 42,029 | ||||||
Weighted-average number of common shares outstanding | 11,380 | 12,334 | 13,251 | |||||||||
Net income per share | $ | 9.35 | $ | 2.04 | $ | 3.17 | ||||||
Diluted earnings per share gives effect to dilutive potential common shares outstanding during the reporting period. The Company had potentially dilutive common share equivalents, in the form of outstanding stock options (see Note 15 - "Stock-Based Compensation"), during the years ended December 31, 2015, 2014 and 2013, although none were dilutive because the exercise price of these equivalents exceeded the market value of the Company's common stock during those periods. As of December 31, 2015, stock options for an aggregate of 13,000 shares are excluded from the calculations above.
Note 18 – Fair Value Measurements
Fair value is defined as the price that would be received to sell an asset or paid to transfer a liability (i.e. the "exit price") in an orderly transaction between market participants at the measurement date. Fair value measurements are broken down into three levels based on the reliability of inputs as follows:
Level 1 inputs are quoted prices in active markets for identical assets or liabilities that the Company has the ability to access at the measurement date. An active market for the asset or liability is a market in which transactions for the asset or liability occur with sufficient frequency and volume to provide pricing information on an ongoing basis. The valuation under this approach does not entail a significant degree of judgment ("Level 1").
Level 2 inputs are inputs other than quoted prices included within Level 1 that are observable for the asset or liability, either directly or indirectly. Level 2 inputs include quoted prices for similar assets or liabilities in active markets, inputs other than quoted prices that are observable for the asset or liability (e.g. interest rates and yield curves observable at commonly quoted intervals or current market) and contractual prices for the underlying financial instrument, as well as other relevant economic measures ("Level 2").
Level 3 inputs are unobservable inputs for the asset or liability. Unobservable inputs are used to measure fair value to the extent that observable inputs are not available, thereby allowing for situations in which there is little, if any, market activity for the asset or liability at the measurement date ("Level 3").
The fair value of the Company's financial instruments, such as cash and cash equivalents, trade and other receivables, and trade payables, approximate carrying value due to the short-term maturities of these assets and liabilities. Carrying cost approximates fair value for the Company's long-term debt which has variable interest rates.
The fair value of the Company's investment in associated company is a Level 1 measurement because the underlying security is listed on a national securities exchange.
The precious metal and commodity inventories associated with the Company's fair value hedges (see Note 12 - "Derivative Instruments") are reported at fair value. Fair values of these inventories are based on quoted market prices on commodity exchanges and are considered Level 1 measurements. The derivative instruments that the Company purchases in connection with its precious metal and commodity inventories, specifically commodity futures and forward contracts, are also valued at fair value. The futures contracts are Level 1 measurements since they are traded on a commodity exchange. The forward contracts are entered into with a counterparty and are considered Level 2 measurements.
The Company's interest rate swap agreements were considered Level 2 measurements as the inputs were observable at commonly quoted intervals.
Page | 69
The following tables summarize the Company's assets and liabilities that are measured at fair value on a recurring basis as of December 31, 2015 and 2014.
Asset (Liability) as of December 31, 2015 | ||||||||||||||||
(in thousands) | Total | Level 1 | Level 2 | Level 3 | ||||||||||||
Investment in associated company | $ | 20,923 | $ | 20,923 | $ | — | $ | — | ||||||||
Precious metal and commodity inventories recorded at fair value | $ | 10,380 | $ | 10,380 | $ | — | $ | — | ||||||||
Commodity contracts on precious metal and commodity inventories | $ | 215 | $ | — | $ | 215 | $ | — | ||||||||
Interest rate swap agreements | $ | (30 | ) | $ | — | $ | (30 | ) | $ | — | ||||||
Asset (Liability) as of December 31, 2014 | ||||||||||||||||
(in thousands) | Total | Level 1 | Level 2 | Level 3 | ||||||||||||
Investment in associated company | $ | 23,936 | $ | 23,936 | $ | — | $ | — | ||||||||
Precious metal and commodity inventories recorded at fair value | $ | 13,249 | $ | 13,249 | $ | — | $ | — | ||||||||
Commodity contracts on precious metal and commodity inventories | $ | 764 | $ | 764 | $ | — | $ | — | ||||||||
Interest rate swap agreements | $ | (138 | ) | $ | — | $ | (138 | ) | $ | — | ||||||
Prior to the redemption of the Subordinated Notes and related Warrants (see Note 11 - "Debt"), the embedded derivative features of the Subordinated Notes and Warrants were valued at fair value on a recurring basis and were considered Level 3 measurements. The Company recorded a loss of $0.8 million during the year ended December 31, 2013 attributable to the fair value of these embedded derivatives and the related redemption. The valuation of the derivative features of the Subordinated Notes and Warrants utilized a customized binomial model, which valued the embedded derivatives in such notes and the associated Warrants in a unified way, using a cash flow approach. Interest rates and the market price of HNH's stock were significant inputs that influenced the valuation of these derivatives.
The Company's non-financial assets and liabilities measured at fair value on a non-recurring basis include goodwill and other intangible assets, any assets and liabilities acquired in a business combination, or its long-lived assets written down to fair value. To measure fair value for such assets and liabilities, the Company uses techniques including an income approach, a market approach and/or appraisals (Level 3 inputs). The income approach is based on a discounted cash flow analysis and calculates the fair value by estimating the after-tax cash flows attributable to an asset or liability and then discounting the after-tax cash flows to a present value using a risk-adjusted discount rate. Assumptions used in the discounted cash flow analysis ("DCF") require the exercise of significant judgment, including judgment about appropriate discount rates and terminal values, growth rates and the amount and timing of expected future cash flows. The discount rates, which are intended to reflect the risks inherent in future cash flow projections, used in the DCF are based on estimates of the weighted-average cost of capital of a market participant. Such estimates are derived from analysis of peer companies and consider the industry weighted-average return on debt and equity from a market participant perspective. A market approach values a business by considering the prices at which shares of capital stock, or related underlying assets, of reasonably comparable companies are trading in the public market or the transaction price at which similar companies have been acquired. If comparable companies are not available, the market approach is not used.
Long-lived assets consisting of land and buildings used in previously operating businesses and currently unused, which total $7.5 million as of December 31, 2015, are carried at the lower of cost or fair value less cost to sell and are included primarily in other non-current assets on the consolidated balance sheet. A reduction in the carrying value of such long-lived assets is recorded as an asset impairment charge in the consolidated income statement.
Note 19 – Commitments and Contingencies
Operating Lease Commitments
The Company leases certain facilities under non-cancelable operating lease arrangements. Rent expense for the Company in 2015, 2014 and 2013 was $4.7 million, $4.4 million and $4.1 million, respectively. Future minimum operating lease and rental commitments under non-cancelable operating leases are as follows (in thousands):
Page | 70
Year | Amount | |||
2016 | 4,294 | |||
2017 | 2,639 | |||
2018 | 1,520 | |||
2019 | 1,402 | |||
2020 | 587 | |||
Thereafter | 857 | |||
Total | $ | 11,299 | ||
Environmental Matters
Certain H&H Group subsidiaries have existing and contingent liabilities relating to environmental matters, including capital expenditures, costs of remediation, and potential fines and penalties relating to possible violations of national and state environmental laws. Those subsidiaries have remediation expenses on an ongoing basis, although such costs are continually being readjusted based upon the emergence of new techniques and alternative methods. The Company had approximately $2.5 million accrued related to estimated environmental remediation costs as of December 31, 2015. The Company also has insurance coverage available for several of these matters and believes that excess insurance coverage may be available as well. During the years ended December 31, 2015 and 2014, the Company recorded insurance reimbursements totaling $2.9 million and $3.1 million, respectively, for previously incurred remediation costs.
In addition, certain H&H Group subsidiaries have been identified as potentially responsible parties ("PRPs") under the Comprehensive Environmental Response, Compensation and Liability Act ("CERCLA") or similar state statutes at sites and are parties to administrative consent orders in connection with certain properties. Those subsidiaries may be subject to joint and several liabilities imposed by CERCLA on PRPs. Due to the technical and regulatory complexity of remedial activities and the difficulties attendant in identifying PRPs and allocating or determining liability among them, the subsidiaries are unable to reasonably estimate the ultimate cost of compliance with such laws.
Based upon information currently available, however, the H&H Group subsidiaries do not expect that their respective environmental costs, including the incurrence of additional fines and penalties, if any, will have a material adverse effect on them or that the resolution of these environmental matters will have a material adverse effect on the financial position, results of operations or cash flows of such subsidiaries or the Company, but there can be no such assurances. The Company anticipates that the H&H Group subsidiaries will pay any such amounts out of their respective working capital, although there is no assurance that they will have sufficient funds to pay them. In the event that the H&H Group subsidiaries are unable to fund their liabilities, claims could be made against their respective parent companies, including H&H Group and/or HNH, for payment of such liabilities.
Among the sites where certain H&H Group subsidiaries may have more substantial environmental liabilities are the following:
H&H has been working with the Connecticut Department of Energy and Environmental Protection ("CTDEEP") with respect to its obligations under a 1989 consent order that applies to a property in Connecticut that H&H sold in 2003 ("Sold Parcel") and an adjacent parcel ("Adjacent Parcel") that together with the Sold Parcel comprises the site of a former H&H manufacturing facility. Remediation of all soil conditions on the Sold Parcel was completed on April 6, 2007. On September 11, 2008, the CTDEEP advised H&H that it had approved H&H's December 28, 2007 Soil Remediation Action Report, as amended, thereby concluding the active remediation of the Sold Parcel. The remaining remediation, monitoring and regulatory administrative costs for the Sold Parcel are expected to approximate $0.1 million. With respect to the Adjacent Parcel, an ecological risk assessment has been completed and the results, along with proposed clean up goals, will be submitted to the CTDEEP for their review and approval. The total remediation costs for the Adjacent Parcel cannot be reasonably estimated at this time. Accordingly, there can be no assurance that the resolution of this matter will not be material to the financial position, results of operations or cash flows of H&H or the Company.
In 1986, Handy & Harman Electronic Materials Corporation ("HHEM"), a subsidiary of H&H, entered into an administrative consent order ("ACO") with the New Jersey Department of Environmental Protection ("NJDEP") with regard to certain property that it purchased in 1984 in New Jersey. The ACO involves investigation and remediation activities to be performed with regard to soil and groundwater contamination. Thereafter, in 1998, HHEM and H&H settled a case brought by the local municipality in regard to this site and also settled with certain of its insurance carriers. HHEM is actively remediating the property and continuing to investigate effective methods for achieving compliance with the ACO. A remedial investigation report was filed with the NJDEP in December 2007. By letter dated December 12, 2008, the NJDEP issued its approval with respect to additional
Page | 71
investigation and remediation activities discussed in the December 2007 remedial investigation report. HHEM anticipates entering into discussions with the NJDEP to address that agency's potential natural resource damage claims, the ultimate scope and cost of which cannot be estimated at this time. Pursuant to a settlement agreement with the former owner/operator of the site, the responsibility for site investigation and remediation costs, as well as any other costs, as defined in the settlement agreement, related to or arising from environmental contamination on the property (collectively, "Costs") are contractually allocated 75% to the former owner/operator (with separate guaranties by the two joint venture partners of the former owner/operator for 37.5% each) and 25% jointly to HHEM and H&H after the first $1.0 million. The $1.0 million was paid solely by the former owner/operator. As of December 31, 2015, over and above the $1.0 million, total investigation and remediation costs of approximately $4.9 million and $1.6 million have been expended by the former owner/operator and HHEM, respectively, in accordance with the settlement agreement. Additionally, HHEM is currently being reimbursed indirectly through insurance coverage for a portion of the Costs for which HHEM is responsible. HHEM believes that there is additional excess insurance coverage, which it intends to pursue as necessary. HHEM anticipates that there will be additional remediation expenses to be incurred once a final remediation plan is agreed upon. There is no assurance that the former owner/operator or guarantors will continue to timely reimburse HHEM for expenditures and/or will be financially capable of fulfilling their obligations under the settlement agreement and the guaranties. The final Costs cannot be reasonably estimated at this time, and accordingly, there can be no assurance that the resolution of this matter will not be material to the financial position, results of operations or cash flows of HHEM or the Company.
HHEM is continuing to comply with a 1987 consent order from the Massachusetts Department of Environmental Protection ("MADEP") to investigate and remediate the soil and groundwater conditions at a commercial/industrial property in Massachusetts. On June 30, 2010, HHEM filed a Response Action Outcome report to close the site since HHEM's licensed site professional concluded that groundwater monitoring demonstrated that the groundwater conditions have stabilized or continue to improve at the site. On June 20, 2013, HHEM received the MADEP's Notice of Audit Findings and Notice of Noncompliance ("Notice"). HHEM and its consultant held meetings with the MADEP to resolve differences identified in the Notice. As a result of those meetings and subsequent discussions, HHEM initiated additional sampling, testing and well installations. The additional work was completed in the third quarter of 2015, and we expect to submit a follow-up response report to the MADEP in the first quarter of 2016. The cost of the follow up response report and subsequent decommissioning is estimated at $0.1 million. Additional costs could result from the final review of the remediation plan by the MADEP, which cannot be reasonably estimated at this time.
Other Litigation
In the ordinary course of our business, we are subject to periodic lawsuits, investigations, claims and proceedings, including, but not limited to, contractual disputes, employment, environmental, health and safety matters, as well as claims associated with our historical acquisitions and divestitures. There is insurance coverage available for many of the foregoing actions. Although we cannot predict with certainty the ultimate resolution of lawsuits, investigations, claims and proceedings asserted against us, we do not believe any currently pending legal proceeding to which we are a party will have a material adverse effect on our business, prospects, financial condition, cash flows, results of operations or liquidity.
Note 20 – Related Party Transactions
As of December 31, 2014, SPLP owned directly or indirectly through its subsidiaries 7,131,185 shares of the Company's common stock, representing approximately 66.2% of outstanding shares. As discussed in Note 4 - "Acquisitions," in connection with its acquisition of JPS, on July 31, 2015, HNH issued to H&H Group 1,429,407 shares of HNH common stock, and H&H Group then exchanged those shares of HNH common stock for all shares of JPS common stock held by SPH Group Holdings, a subsidiary of SPLP. As a result of these transactions, SPLP owned directly or indirectly through its subsidiaries 8,560,592 shares of the Company's common stock as of December 31, 2015, representing approximately 70.1% of outstanding shares. The power to vote and dispose of the securities held by SPLP is controlled by SPH GP. Warren G. Lichtenstein, our Chairman of the Board of Directors, is also the Executive Chairman of SPH GP. Certain other affiliates of SPH GP hold positions with the Company, including Jack L. Howard, as Vice Chairman and Principal Executive Officer, John H. McNamara Jr., as Director, James F. McCabe, Jr., as Chief Financial Officer and Leonard J. McGill, as Chief Legal Officer.
The Company has entered into a management services agreement, as amended ("Management Services Agreement"), with SP Corporate Services LLC ("SP Corporate"). SP Corporate is an affiliate of SPLP. Pursuant to the Management Services Agreement, SP Corporate provides the Company with certain executive and corporate services, including, without limitation, legal, tax, accounting, treasury, consulting, auditing, administrative, compliance, environmental health and safety, human resources, marketing, investor relations, operating group management and other similar services rendered for the Company or its subsidiaries.
Effective January 1, 2013, certain individuals employed by SP Corporate and their related expenses were transferred to the Company. On March 27, 2013, the Company and SP Corporate entered into an amendment to the Management Services Agreement to modify the titles and designation of certain officers to be provided pursuant to the Management Services Agreement
Page | 72
and to adjust the fee thereunder, reflecting the aforementioned employee transfer and related change in the scope of services provided under the Management Services Agreement. The amended Management Services Agreement provided that the Company pay SP Corporate a fixed annual fee of approximately $8.89 million, effective January 1, 2013, consisting of (a) $1.74 million in consideration of the executive services provided by SP Corporate under the Management Services Agreement and (b) $7.15 million in consideration of the corporate services provided by SP Corporate under the Management Services Agreement. On May 3, 2015, the Company and SP Corporate entered into a second amendment to the Management Services Agreement to add operating group management services to the scope of corporate services to be provided pursuant to the Management Services Agreement and to adjust the fee for corporate services provided under the Management Services Agreement from $7.15 million to $8.81 million. In connection with the amendment, the Company also entered into a transfer agreement, dated May 3, 2015, with Steel Partners LLC ("Steel Partners"), pursuant to which three employees of the Company and its subsidiaries were transferred to Steel Partners, which will assume the cost of compensating those employees and providing applicable benefits.
The fees payable under the Management Services Agreement are subject to an annual review and such adjustments as may be agreed upon by SP Corporate and the Company. The Management Services Agreement has a term of one year and automatically renews for successive one-year periods unless and until terminated in accordance with the terms set forth therein, which include, under certain circumstances, the payment by the Company of a termination fee to SP Corporate.
During the years ended December 31, 2015, 2014 and 2013, the Company also reimbursed SP Corporate and its affiliates approximately $0.7 million, $0.4 million and $0.4 million, respectively, for business expenses incurred on its behalf pursuant to the Management Services Agreement.
Mutual Securities, Inc. is the custodian for the majority of the Company's holdings in ModusLink common stock. Jack L. Howard is a registered principal of Mutual Securities, Inc.
The Company was indebted to SPLP under H&H Group's Subordinated Notes until March 26, 2013, when H&H Group delivered an irrevocable notice of its election to redeem all of its outstanding Subordinated Notes to the holders and irrevocably deposited funds for such redemption and interest payments in order to satisfy and discharge its obligations under the Indenture as more fully described in Note 11 - "Debt." SPLP received proceeds of $25.0 million in connection with the redemption of $21.6 million face amount of Subordinated Notes held by SPLP.
In connection with the Investment Agreement discussed in Note 10 - "Investment," ModusLink agreed to reimburse SPLP's reasonably documented out-of-pocket expenses associated with the agreement up to a maximum of $0.2 million, which was principally paid by and reimbursed to the Company during the first quarter of 2013.
Note 21 – Reportable Segments
HNH is a diversified holding company whose strategic business units encompass the following segments: Joining Materials, Tubing, Building Materials, Performance Materials and Kasco. For a more complete description of the Company's segments, see "Item 1 - Business - Products and Product Mix."
Management has determined that certain operating companies should be aggregated and presented within a single segment on the basis that such segments have similar economic characteristics and share other qualitative characteristics. Management reviews net sales, gross profit and operating income to evaluate segment performance. Operating income for the segments generally includes costs directly attributable to the segment and excludes other unallocated general corporate expenses. Interest expense, other income and expense, and income taxes are not presented by segment since they are excluded from the measures of segment profitability reviewed by the Company's management.
The following tables present information about the Company's reportable segments for the years ended December 31, 2015, 2014 and 2013:
Page | 73
Income Statement Data | Year Ended | |||||||||||
(in thousands) | December 31, | |||||||||||
2015 | 2014 | 2013 | ||||||||||
Net sales: | ||||||||||||
Joining Materials | $ | 182,702 | $ | 207,320 | $ | 195,187 | ||||||
Tubing | 79,539 | 81,264 | 91,002 | |||||||||
Building Materials | 266,859 | 253,644 | 226,806 | |||||||||
Performance Materials | 59,535 | — | — | |||||||||
Kasco | 60,833 | 58,240 | 58,169 | |||||||||
Total net sales | $ | 649,468 | $ | 600,468 | $ | 571,164 | ||||||
Segment operating income (loss): | ||||||||||||
Joining Materials (a) | $ | 19,906 | $ | 19,428 | $ | 16,624 | ||||||
Tubing | 13,081 | 13,340 | 17,434 | |||||||||
Building Materials | 37,480 | 30,217 | 27,789 | |||||||||
Performance Materials | (2,212 | ) | — | — | ||||||||
Kasco (b) | 4,336 | 3,176 | 4,496 | |||||||||
Total segment operating income | 72,591 | 66,161 | 66,343 | |||||||||
Unallocated corporate expenses and non-operating units (c) | (19,259 | ) | (16,878 | ) | (21,009 | ) | ||||||
Unallocated pension expense | (7,480 | ) | (3,739 | ) | (5,206 | ) | ||||||
Gain from asset dispositions | 62 | 176 | 75 | |||||||||
Operating income | 45,914 | 45,720 | 40,203 | |||||||||
Interest expense | (4,598 | ) | (7,544 | ) | (13,662 | ) | ||||||
Realized and unrealized gain on derivatives | 588 | 1,307 | 1,195 | |||||||||
Other expense | (384 | ) | (181 | ) | (240 | ) | ||||||
Income from continuing operations before tax and equity investment | $ | 41,520 | $ | 39,302 | $ | 27,496 | ||||||
(a) | The results of the Joining Materials segment in 2014 include a non-cash impairment charge of $0.6 million related to certain equipment located in Toronto, Canada to be sold or scrapped as part of the Company's integration activities associated with the Wolverine Joining acquisition. |
(b) | The results of the Kasco segment in 2014 include a non-cash impairment charge of $0.6 million related to certain unused, real property located in Atlanta, Georgia. |
(c) | Unallocated corporate expenses and non-operating units in 2015 includes a non-cash asset impairment charge of $1.4 million related to certain unused, real property located in Norristown, Pennsylvania. |
Page | 74
(in thousands) | 2015 | 2014 | 2013 | |||||||||
Capital Expenditures | ||||||||||||
Joining Materials | $ | 4,064 | $ | 5,128 | $ | 3,135 | ||||||
Tubing | 3,997 | 2,835 | 3,679 | |||||||||
Building Materials | 4,570 | 2,661 | 3,424 | |||||||||
Performance Materials | 576 | — | — | |||||||||
Kasco | 1,969 | 1,989 | 1,339 | |||||||||
Corporate and other | 49 | 45 | 167 | |||||||||
Total | $ | 15,225 | $ | 12,658 | $ | 11,744 | ||||||
(in thousands) | 2015 | 2014 | 2013 | |||||||||
Depreciation and Amortization | ||||||||||||
Joining Materials | $ | 3,026 | $ | 3,204 | $ | 2,682 | ||||||
Tubing | 2,571 | 2,401 | 2,399 | |||||||||
Building Materials | 5,598 | 5,217 | 4,600 | |||||||||
Performance Materials | 4,885 | — | — | |||||||||
Kasco | 2,147 | 2,162 | 2,095 | |||||||||
Corporate and other | 153 | 153 | 151 | |||||||||
Total | $ | 18,380 | $ | 13,137 | $ | 11,927 | ||||||
(in thousands) | 2015 | 2014 | ||||||||||
Total Assets | ||||||||||||
Joining Materials | $ | 98,441 | $ | 107,387 | ||||||||
Tubing | 35,544 | 36,160 | ||||||||||
Building Materials | 166,923 | 137,270 | ||||||||||
Performance Materials | 126,985 | — | ||||||||||
Kasco | 22,878 | 22,599 | ||||||||||
Corporate and other | 173,902 | 165,670 | ||||||||||
Discontinued operations | — | 69,673 | ||||||||||
Total | $ | 624,673 | $ | 538,759 | ||||||||
The following table presents revenue and long-lived asset information by geographic area as of and for the years ended December 31. Foreign revenue is based on the country in which the legal subsidiary is domiciled. Long-lived assets in 2015 and 2014 consist of property, plant and equipment, plus approximately $7.3 million and $8.4 million, respectively, of land and buildings from previously operating businesses and other non-operating assets that are carried at the lower of cost or fair value less cost to sell and are included in other non-current assets on the consolidated balance sheets. Neither net sales nor long-lived assets from any single foreign country was material to the consolidated financial statements of the Company.
Page | 75
Geographic Information | ||||||||||||
Net Sales | ||||||||||||
(in thousands) | 2015 | 2014 | 2013 | |||||||||
United States | $ | 603,079 | $ | 550,071 | $ | 518,631 | ||||||
Foreign | 46,389 | 50,397 | 52,533 | |||||||||
Total | $ | 649,468 | $ | 600,468 | $ | 571,164 | ||||||
Long-Lived Assets | ||||||||||||
(in thousands) | 2015 | 2014 | ||||||||||
United States | $ | 111,884 | $ | 67,574 | ||||||||
Foreign | 8,130 | 8,483 | ||||||||||
Total | $ | 120,014 | $ | 76,057 | ||||||||
Note 22 – Parent Company Condensed Financial Information
As discussed in Note 11 - "Debt," certain of the Company's subsidiaries have long-term debt outstanding which place restrictions on distributions of funds to HNH, subject to certain exceptions including required pension payments to the WHX Pension Plan. As these subsidiaries' restricted net assets, which totaled approximately $466 million at December 31, 2015, represent a significant portion of the Company's consolidated total assets, the Company is presenting the following parent company condensed financial information. The HNH parent company condensed financial information is prepared on the same basis of accounting as the HNH consolidated financial statements, except that the HNH subsidiaries are accounted for under the equity method of accounting. HNH is a holding company with minimal assets or operations, and all of its subsidiaries are 100% owned. We may offer debt securities in a registered offering in the future. If we do, and if we offer guarantees of these securities, then we expect the guarantees will be full and unconditional and joint and several. We expect that any subsidiaries of HNH that do not guarantee the securities would be minor.
Page | 76
HANDY & HARMAN LTD. (PARENT ONLY)
Balance Sheets
(in thousands, except par value)
December 31, | December 31, | |||||||
2015 | 2014 | |||||||
ASSETS | ||||||||
Current Assets: | ||||||||
Cash and cash equivalents | $ | 16,059 | $ | 22,106 | ||||
Prepaid and other current assets | 82 | 82 | ||||||
Total current assets | 16,141 | 22,188 | ||||||
Notes receivable from Bairnco | 4,627 | 4,627 | ||||||
Investment in associated company | 6,191 | 1,661 | ||||||
Deferred income tax assets | 101,820 | 94,146 | ||||||
Investments in and advances to subsidiaries, net | 433,588 | 266,946 | ||||||
Total assets | $ | 562,367 | $ | 389,568 | ||||
LIABILITIES AND STOCKHOLDERS' EQUITY | ||||||||
Current Liabilities: | ||||||||
Accrued liabilities | $ | 176 | $ | 380 | ||||
Total current liabilities | 176 | 380 | ||||||
Accrued interest - Handy & Harman | 12,193 | 12,193 | ||||||
Notes payable - Handy & Harman | 135,937 | 118,728 | ||||||
Accrued pension liability - WHX Pension Plan | 228,998 | 208,331 | ||||||
Other liabilities | 523 | 547 | ||||||
Total liabilities | 377,827 | 340,179 | ||||||
Commitments and Contingencies | ||||||||
Stockholders' Equity: | ||||||||
Common stock - $.01 par value; authorized 180,000 shares; issued 13,579 and 13,580 shares, respectively | 136 | 136 | ||||||
Accumulated other comprehensive loss | (259,392 | ) | (235,822 | ) | ||||
Additional paid-in capital | 586,693 | 570,256 | ||||||
Treasury stock, at cost - 1,371 and 2,800 shares, respectively | (34,454 | ) | (70,375 | ) | ||||
Accumulated deficit | (108,443 | ) | (214,806 | ) | ||||
Total stockholders' equity | 184,540 | 49,389 | ||||||
Total liabilities and stockholders' equity | $ | 562,367 | $ | 389,568 | ||||
Page | 77
HANDY & HARMAN LTD. (PARENT ONLY)
Statements of Income and Comprehensive Income (Loss)
(in thousands)
Year Ended December 31, | ||||||||||||
2015 | 2014 | 2013 | ||||||||||
Equity in income of subsidiaries, net of tax | $ | 117,375 | $ | 39,979 | $ | 44,275 | ||||||
Selling, general and administrative expenses | (6,483 | ) | (8,261 | ) | (7,790 | ) | ||||||
Pension expense - WHX Pension Plan | (7,989 | ) | (3,739 | ) | (5,206 | ) | ||||||
Income before tax and equity investment | 102,903 | 27,979 | 31,279 | |||||||||
Tax benefit | 5,352 | 4,624 | 4,744 | |||||||||
(Loss) gain from associated company, net of tax | (1,892 | ) | (7,433 | ) | 6,006 | |||||||
Net income | 106,363 | 25,170 | 42,029 | |||||||||
Other comprehensive (loss) income, net of tax: | ||||||||||||
Changes in pension liability and other post-retirement benefit obligations | (35,521 | ) | (83,887 | ) | 68,328 | |||||||
Tax effect of changes in pension liability and other post-retirement benefit obligations | 13,571 | 31,924 | (25,653 | ) | ||||||||
Change in market value of securities | — | — | 7,113 | |||||||||
Tax effect of change in market value of securities | — | — | (3,041 | ) | ||||||||
Foreign currency translation adjustments | (1,855 | ) | (1,928 | ) | (2,510 | ) | ||||||
Tax effect of changes in foreign currency translation adjustments | 235 | — | — | |||||||||
Other comprehensive (loss) income | (23,570 | ) | (53,891 | ) | 44,237 | |||||||
Comprehensive income (loss) | $ | 82,793 | $ | (28,721 | ) | $ | 86,266 | |||||
Page | 78
HANDY & HARMAN LTD. (PARENT ONLY)
Statements of Cash Flows
(in thousands)
Year ended December 31, | ||||||||||||
2015 | 2014 | 2013 | ||||||||||
Cash flows from operating activities: | ||||||||||||
Net income | $ | 106,363 | $ | 25,170 | $ | 42,029 | ||||||
Adjustments to reconcile net income to net cash used in operating activities: | ||||||||||||
Equity in income of subsidiaries, net of tax | (117,375 | ) | (39,979 | ) | (44,275 | ) | ||||||
Non-cash stock-based compensation | 3,373 | 5,105 | 4,860 | |||||||||
Non-cash loss (gain) from associated company, net of tax | 1,892 | 7,433 | (6,006 | ) | ||||||||
Deferred income taxes | (5,352 | ) | (4,624 | ) | (5,945 | ) | ||||||
Change in operating assets and liabilities: | ||||||||||||
Pension payments - WHX Pension Plan | (17,209 | ) | (20,540 | ) | (13,106 | ) | ||||||
Pension expense - WHX Pension Plan | 7,989 | 3,739 | 5,206 | |||||||||
Other current assets and liabilities | (330 | ) | 487 | 45 | ||||||||
Net cash used in operating activities | (20,649 | ) | (23,209 | ) | (17,192 | ) | ||||||
Cash flows from investing activities: | ||||||||||||
Investments in associated company | (7,607 | ) | (1,499 | ) | — | |||||||
Dividends from subsidiaries | 5,000 | 85,000 | 10,000 | |||||||||
Net cash (used in) provided by investing activities | (2,607 | ) | 83,501 | 10,000 | ||||||||
Cash flows from financing activities: | ||||||||||||
Notes payable - Handy & Harman | 17,209 | 20,540 | 18,106 | |||||||||
Purchases of treasury stock | — | (60,579 | ) | (9,796 | ) | |||||||
Net cash provided by (used in) financing activities | 17,209 | (40,039 | ) | 8,310 | ||||||||
Net change for the year | (6,047 | ) | 20,253 | 1,118 | ||||||||
Cash and cash equivalents at beginning of year | 22,106 | 1,853 | 735 | |||||||||
Cash and cash equivalents at end of year | $ | 16,059 | $ | 22,106 | $ | 1,853 | ||||||
Non-cash investing activities: | ||||||||||||
Issuance of treasury stock in connection with JPS acquisition | $ | 48,748 | $ | — | $ | — | ||||||
Page | 79
Note 23 – Unaudited Quarterly Results
Unaudited quarterly financial results during the years ended December 31, 2015 and 2014 were as follows:
Fiscal 2015 Quarter Ended (Unaudited) | ||||||||||||||||
(in thousands, except per share amounts) | March 31, | June 30, | September 30, | December 31, | ||||||||||||
Net sales | $ | 137,982 | $ | 166,475 | $ | 181,139 | $ | 163,872 | ||||||||
Operating income | $ | 5,446 | $ | 15,212 | $ | 15,969 | $ | 9,287 | ||||||||
Income from continuing operations before tax and equity investment | $ | 3,979 | $ | 14,304 | $ | 14,816 | $ | 8,421 | ||||||||
Net income (loss) from discontinued operations | $ | 90,086 | $ | (147 | ) | $ | 195 | $ | (762 | ) | ||||||
Net income | $ | 93,344 | $ | 6,129 | $ | 4,613 | $ | 2,277 | ||||||||
Comprehensive income (loss) | $ | 93,574 | $ | 6,476 | $ | 4,411 | $ | (21,668 | ) | |||||||
Basic and diluted income (loss) per share of common stock | ||||||||||||||||
Income from continuing operations, net of tax, per share | $ | 0.30 | $ | 0.58 | $ | 0.37 | $ | 0.25 | ||||||||
Discontinued operations, net of tax, per share | $ | 8.36 | $ | (0.01 | ) | $ | 0.02 | $ | (0.06 | ) | ||||||
Net income per share | $ | 8.66 | $ | 0.57 | $ | 0.39 | $ | 0.19 | ||||||||
Fiscal 2014 Quarter Ended (Unaudited) | ||||||||||||||||
(in thousands, except per share amounts) | March 31, | June 30, | September 30, | December 31, | ||||||||||||
Net sales | $ | 135,487 | $ | 168,545 | $ | 164,524 | $ | 131,912 | ||||||||
Operating income | $ | 5,353 | $ | 17,585 | $ | 18,640 | $ | 4,142 | ||||||||
Income from continuing operations before tax and equity investment | $ | 3,878 | $ | 15,299 | $ | 17,515 | $ | 2,610 | ||||||||
Net income from discontinued operations | $ | 2,856 | $ | 3,667 | $ | 2,290 | $ | 1,164 | ||||||||
Net (loss) income | $ | (370 | ) | $ | 11,076 | $ | 11,860 | $ | 2,604 | |||||||
Comprehensive (loss) income | $ | (599 | ) | $ | 11,186 | $ | 10,880 | $ | (50,188 | ) | ||||||
Basic and diluted (loss) income per share of common stock | ||||||||||||||||
(Loss) income from continuing operations, net of tax, per share | $ | (0.25 | ) | $ | 0.56 | $ | 0.77 | $ | 0.13 | |||||||
Discontinued operations, net of tax, per share | $ | 0.22 | $ | 0.28 | $ | 0.18 | $ | 0.11 | ||||||||
Net (loss) income per share | $ | (0.03 | ) | $ | 0.84 | $ | 0.95 | $ | 0.24 | |||||||
Other comprehensive loss of $23.9 million and $52.8 million, net of tax, were recorded in the fourth quarter of 2015 and 2014, respectively, primarily from unrealized actuarial losses associated with the Company's defined benefit pension plans.
Note 24 – Subsequent Events
On February 5, 2016, HNH delivered a letter to SL Industries, Inc. ("SLI") formally proposing to acquire all the outstanding shares of SLI for a cash purchase price of $35.50 per share, or approximately $140.6 million in total, subject to limited confirmatory due diligence. SLI designs, manufactures and markets power electronics, motion control, power protection, and power quality electromagnetic equipment that are used in a variety of medical, commercial and military aerospace, computer, datacom, industrial, and telecom applications. SPH GP and its affiliates own approximately 25.7% of SLI's outstanding shares.
Page | 80
Item 9. | Changes in and Disagreements With Accountants on Accounting and Financial Disclosure |
None.
Item 9A. | Controls and Procedures |
Disclosure Controls and Procedures
As required by Rule 13a-15(b) under the Exchange Act, we conducted an evaluation under the supervision and with the participation of our management, including the Principal Executive Officer and the Chief Financial Officer, of the effectiveness of our disclosure controls and procedures as of the end of the period covered by this report. Based on that evaluation, the Principal Executive Officer and the Chief Financial Officer concluded that as of December 31, 2015 our disclosure controls and procedures are effective in ensuring that all information required to be disclosed in reports that we file or submit under the Exchange Act is recorded, processed, summarized and reported within the time periods specified in the SEC rules and forms and that such information is accumulated and communicated to our management, including our Principal Executive Officer and Chief Financial Officer, in a manner that allows timely decisions regarding required disclosure.
Management's Report on Internal Control Over Financial Reporting
Management of the Company is responsible for establishing and maintaining adequate internal control over financial reporting, as such term is defined in Rule 13a-15(f) under the Exchange Act. Our internal control over financial reporting is a process designed to provide reasonable assurance regarding the reliability of financial reporting and the preparation of the Company's consolidated financial statements for external reporting purposes in accordance with U.S. generally accepted accounting principles.
The Company completed the acquisition of JPS on July 2, 2015. Our management has excluded the operations of this business from our evaluation of, and conclusion on, the effectiveness of our internal control over financial reporting as of December 31, 2015. This business represents approximately 20.3% of our total assets as of December 31, 2015, and approximately 9.2% of net sales for the year then ended. Our management plans to fully integrate the operations of this business into its assessment of the effectiveness of our internal control over financial reporting in 2016.
Under the supervision and with the participation of the Company's management, including the Company's Principal Executive Officer and Chief Financial Officer, the Company conducted an evaluation of the effectiveness of the internal control over financial reporting of the Company as referred to above as of December 31, 2015 as required by Rule 13a-15(c) under the Exchange Act. In making this assessment, the Company used the criteria set forth in the framework in Internal Control - Integrated Framework issued by the Committee of Sponsoring Organizations of the Treadway Commission. Based on its evaluation under the framework in Internal Control - Integrated Framework (2013), management concluded that the Company's internal control over financial reporting was effective as of December 31, 2015.
BDO USA, LLP, the independent registered public accounting firm who audited the Company's 2015 consolidated financial statements included in this Annual Report on Form 10-K, has issued a report on the effectiveness of the Company's internal control over financial reporting as of December 31, 2015, which is included herein.
Changes in Internal Control over Financial Reporting
No change in internal control over financial reporting occurred during the quarter ended December 31, 2015 that has materially affected, or is reasonably likely to materially affect, the Company's internal control over financial reporting, except for the changes in internal control over financial reporting associated with integrating the acquisition of JPS.
Inherent Limitations Over Controls
Because of its inherent limitations, internal control over financial reporting may not prevent or detect misstatements. Also, projections of any evaluation of effectiveness to future periods are subject to the risk that controls may become inadequate because of changes in conditions, or that the degree of compliance with the policies or procedures may deteriorate.
Item 9B. | Other Information |
No events have occurred during the fourth quarter that would require disclosure under this item.
Page | 81
PART III
Item 10. | Directors, Executive Officers and Corporate Governance |
Incorporated by reference from our Proxy Statement for our 2016 Annual Meeting of Stockholders to be filed with the SEC within 120 days after the end of the year ended December 31, 2015.
Item 11. | Executive Compensation |
Incorporated by reference from our Proxy Statement for our 2016 Annual Meeting of Stockholders to be filed with the SEC within 120 days after the end of the year ended December 31, 2015.
Item 12. | Security Ownership of Certain Beneficial Owners and Management and Related Stockholder Matters |
Incorporated by reference from our Proxy Statement for our 2016 Annual Meeting of Stockholders to be filed with the SEC within 120 days after the end of the year ended December 31, 2015. Also incorporated by reference is the information in the table under the heading "Equity Compensation Plan Information" included in Item 5 of the Form 10-K.
Item 13. | Certain Relationships and Related Transactions, and Director Independence |
Incorporated by reference from our Proxy Statement for our 2016 Annual Meeting of Stockholders to be filed with the SEC within 120 days after the end of the year ended December 31, 2015.
Item 14. | Principal Accountant Fees and Services |
Incorporated by reference from our Proxy Statement for our 2016 Annual Meeting of Stockholders to be filed with the SEC within 120 days after the end of the year ended December 31, 2015.
Page | 82
PART IV
Item 15. | Exhibits and Financial Statement Schedules |
(a) Listing of Documents
1. Consolidated Financial Statements:
The following consolidated financial statements are filed as a part of this report:
• | Reports of Independent Registered Public Accounting Firm |
• | Consolidated Balance Sheets as of December 31, 2015 and 2014 |
• | Consolidated Income Statements for the years ended December 31, 2015, 2014 and 2013 |
• | Consolidated Statements of Comprehensive Income (Loss) for the years ended December 31, 2015, 2014 and 2013 |
• | Consolidated Statements of Changes in Stockholders' Equity for the years ended December 31, 2015, 2014 and 2013 |
• | Consolidated Statements of Cash Flows for the years ended December 31, 2015, 2014 and 2013 |
• | Notes to Consolidated Financial Statements |
2. Financial Statement Schedules
None.
3. Exhibits
Exhibit Number | Description |
2.1 | Stock Purchase Agreement, dated as of December 18, 2014, by and among Handy & Harman Group Ltd., Bairnco Corporation and Rogers Corporation. (incorporated by reference to Exhibit 2.1 to the Company's Current Report on Form 8-K filed December 22, 2014) |
2.2 | Amendment No. 1 to Stock Purchase Agreement, dated January 22, 2015, by and among Handy & Harman Ltd., Bairnco, LLC and Rogers Corporation. (incorporated by reference to Exhibit 2.2 to the Company's Current Report on Form 8-K filed January 27, 2015) |
2.3 | Agreement and Plan of Merger, dated as of May 31, 2015, by and among Handy & Harman Ltd., Handy & Harman Group, Ltd., HNH Group Acquisition LLC, HNH Group Acquisition Sub LLC and JPS Industries, Inc. (incorporated by reference to Exhibit 2.1 to the Company's Current Report on Form 8-K filed June 1, 2015) |
3.1 | Amended and Restated Certificate of Incorporation of the Company, as most recently amended, effective on January 3, 2011. (incorporated by reference to Exhibit 3.1 to the Company's Annual Report on Form 10-K filed on March 15, 2012) |
3.2 | Amended and Restated By Laws of WHX, as most recently amended on November 24, 2008. (incorporated by reference to Exhibit 3.2 to the Company's Annual Report on Form 10-K filed on March 30, 2010) |
3.3 | Amendment to Section 2.9 of the By-Laws of Handy & Harman Ltd. (incorporated by reference to Exhibit 3.1 to the Company's Current Report on Form 8-K filed on November 2, 2012) |
3.4 | Amendment to Section 4.5 of the By-Laws of Handy & Harman Ltd. (incorporated by reference to Exhibit 3.2 to the Company's Current Report on Form 8-K filed on November 2, 2012) |
3.5 | Certificate of Amendment to the Certificate of Incorporation of Handy & Harman Ltd. (incorporated by reference to Exhibit 3.1 to the Company's Current Report on Form 8-K filed May 29, 2015) |
3.6 | Certificate of Amendment to the Amended and Restated Certificate of Incorporation of Handy & Harman Ltd., as filed with Secretary of State of the State of Delaware on July 14, 2015 (incorporated by reference to Exhibit 3.1 to the Company's Current Report on Form 8-K filed July 16, 2015) |
4.1 | Form of Common Stock Purchase Warrant. (incorporated by reference to Exhibit 10.1 to the Quarterly Report on Form 10-Q filed by the Company on November 9, 2010) |
4.2 | Form of Restricted Shares Agreement. (incorporated by reference to Exhibit 10.2 to the Company's Current Report on Form 8-K filed on April 2, 2013) |
4.3 | Credit Agreement, dated as of June 3, 2014, by and among WHX CS Corp., the other entities joined as borrowers thereunder from time to time, the lenders party thereunder and PNC Bank, National Association, in its capacity as administrative agent for the lenders thereunder. (incorporated by reference to Exhibit 99.1 to the Company's Current Report on Form 8-K filed June 4, 2014) |
Page | 83
4.4 | Pledge Agreement, dated as of June 3, 2014, by WHX CS Corp. in favor of PNC Bank, National Association, as agent for the benefit of the lenders. (incorporated by reference to Exhibit 99.2 to the Company's Current Report on Form 8-K filed June 4, 2014) |
4.5 | Amended and Restated Credit Agreement, as amended, dated as of August 29, 2014, by and among Handy & Harman Group Ltd., certain of its subsidiaries as guarantors, PNC Bank, N.A., in its capacity as agent acting for the financial institutions party thereto as lenders, and the financial institutions party thereto as lenders. (incorporated by reference to Exhibit 4.1 to the Company's Current Report on Form 8-K filed September 2, 2014) |
4.6 | First Amendment, dated as of November 24, 2014, to the Amended and Restated Credit Agreement, dated as of August 29, 2014, by and among Handy & Harman Group Ltd., certain of its subsidiaries as guarantors, PNC Bank N.A., in its capacity as agent acting for the financial institutions party thereto as lenders, and the financial institutions party thereto as lenders. (incorporated by reference to Exhibit 10.1 to the Company's Current Report on Form 8-K filed November 25, 2014) |
4.7 | Second Amendment, dated as of January 22, 2015, to the Amended and Restated Credit Agreement, dated as of August 29, 2014, by and among Handy & Harman Group Ltd., certain of its subsidiaries as guarantors, PNC Bank N.A., in its capacity as agent acting for the financial institutions party thereto as lenders, and the financial institutions party thereto as lenders. (incorporated by reference to Exhibit 10.1 to the Company's Current Report on Form 8-K filed January 26, 2015) |
10.1 | Settlement and Release Agreement by and among Wheeling-Pittsburgh Steel Corporation ("WPSC") and Wheeling-Pittsburgh Corporation ("WPC"), the Company and certain affiliates of WPSC, WPC and the Company. (incorporated by reference to Exhibit 99.1 to the Company's Current Report on Form 8-K filed May 30, 2001) |
**10.2 | Supplemental Executive Retirement Plan. (as Amended and Restated as of January 1, 1998) (incorporated by reference to Exhibit 10.9 to the Company's Annual Report on Form 10-K filed December 27, 2006) |
10.3 | Agreement by and among the Pension Benefit Guaranty Corporation, WHX Corporation, Wheeling-Pittsburgh Corporation, Wheeling-Pittsburgh Steel Corporation and the United Steel Workers of America, AFL-CIO-CLC, dated as of July 31, 2003. (incorporated by reference to Exhibit 10.10 to the Company's Annual Report on Form 10-K filed December 27, 2006) |
10.4 | Registration Rights Agreement, dated as of October 15, 2010, by and among the Company, H&H Group, the Steel Trusts, and each other person who becomes a holder thereunder. (incorporated by reference to Exhibit 10.1 to the Quarterly Report on Form 10-Q filed by the Company on November 9, 2010) |
**10.5 | 2007 Incentive Stock Plan, as amended. (incorporated by reference to Exhibit 10.1 to the Company's Current Report on Form 8-K filed May 28, 2013) |
10.6 | Settlement Agreement by and among WHX Corporation, Handy & Harman, and Pension Benefit Guaranty Corporation dated December 28, 2006. (incorporated by reference to Exhibit 10.12 to the Company's Current Report on Form 8-K filed January 4, 2007) |
**10.7 | Employment Agreement by and between Handy & Harman and Jeffrey A. Svoboda, effective January 28, 2008. (incorporated by reference to Exhibit 10.17 to the Company's Annual Report on Form 10-K filed March 31, 2009) |
**10.8 | Amendment to Employment Agreement by and between Handy & Harman and Jeffrey A. Svoboda, effective January 1, 2009. (incorporated by reference to Exhibit 10.16 to the Company's Annual Report on Form 10-K, filed March 31, 2009) |
**10.9 | Second Amendment to Employment Agreement by and between Handy & Harman and Jeffrey A. Svoboda, effective January 4, 2009. (incorporated by reference to Exhibit 10.17 to the Company's Annual Report on Form 10-K, filed March 31, 2009) |
**10.10 | Incentive Agreement, dated July 6, 2007, by and between WHX Corporation and Glen Kassan. (incorporated by reference to Exhibit 10.21 to the Company's Annual Report on Form 10-K, filed March 31, 2009) |
**10.11 | Amendment to Incentive Agreement, dated as of January 1, 2009, by and between WHX Corporation and Glen Kassan. (incorporated by reference to Exhibit 10.22 to the Company's Annual Report on Form 10-K, filed March 31, 2009) |
**10.12 | Incentive Agreement, dated July 6, 2007, by and between WHX Corporation and Warren G. Lichtenstein. (incorporated by reference to Exhibit 10.23 to the Company's Annual Report on Form 10-K, filed March 31, 2009) |
**10.13 | Amendment to Incentive Agreement, dated as of January 1, 2009, by and between WHX Corporation and Warren G. Lichtenstein. (incorporated by reference to Exhibit 10.24 to the Company's Annual Report on Form 10-K, filed March 31, 2009) |
**10.14 | Management Services Agreement, dated as of January 1, 2012, by and among the Company, Handy & Harman Group Ltd. and SP Corporate Services LLC. (incorporated by reference to Exhibit 10.16 to the Company's Annual Report on Form 10-K filed on March 15, 2012) |
**10.15 | First Amendment to Management Services Agreement by and among the Company, Handy & Harman Group Ltd. and SP Corporate Services LLC, dated as of March 27, 2013. (incorporated by reference to Exhibit 10.1 to the Company's Current Report on Form 8-K filed April 2, 2013) |
**10.16 | Second Amendment to Management Services Agreement, dated as of May 3, 2015, by and among SP Corporate Services LLC, Handy & Harman Ltd. and Handy & Harman Group Ltd. (incorporated by reference to Exhibit 10.1 to the Company's Current Report on Form 8-K filed May 5, 2015) |
Page | 84
10.17 | Exchange Agreement, dated as of May 31, 2015, by and between Handy & Harman Group, Ltd. and SPH Group Holdings LLC. (incorporated by reference to Exhibit 10.1 to the Company's Current Report on Form 8-K filed June 1, 2015) |
*21.1 | Subsidiaries of Registrant. |
*23.1 | Consent of Independent Registered Public Accounting Firm-BDO USA, LLP. |
*23.2 | Consent of Independent Registered Public Accounting Firm-BDO USA, LLP. |
*23.3 | Consent of Independent Registered Public Accounting Firm-KPMG LLP. |
*24.1 | Power of Attorney (included on signature page). |
*31.1 | Certification by Principal Executive Officer pursuant to Section 302 of the Sarbanes-Oxley Act of 2002. |
*31.2 | Certification by Principal Financial Officer pursuant to Section 302 of the Sarbanes-Oxley Act of 2002. |
*32 | Certification by Principal Executive Officer and Principal Financial Officer pursuant to Section 906 of the Sarbanes-Oxley Act of 2002. |
*99.1 | Financial Statements of ModusLink Global Solutions, Inc. |
* | Exhibit 101.INS XBRL Instance Document |
* | Exhibit 101.SCH XBRL Taxonomy Extension Schema |
* | Exhibit 101.CAL XBRL Taxonomy Extension Calculation Linkbase |
* | Exhibit 101.DEF XBRL Taxonomy Extension Definition Linkbase |
* | Exhibit 101.LAB XBRL Taxonomy Extension Label Linkbase |
* | Exhibit 101.PRE XBRL Taxonomy Extension Presentation Linkbase |
* - filed herewith.
** - Management contract, or compensatory plan or arrangement.
Page | 85
SIGNATURES
Pursuant to the requirements of the Securities Exchange Act of 1934, the registrant has duly caused this report to be signed on its behalf by the undersigned, thereunto duly authorized.
Handy & Harman Ltd. | ||
/s/ Jack L. Howard | ||
Name: | Jack L. Howard | |
Title: | Vice Chairman | |
POWER OF ATTORNEY
Handy & Harman Ltd. and each of the undersigned do hereby appoint Jack L. Howard and James F. McCabe, Jr., and each of them severally, its or his true and lawful attorney to execute on behalf of Handy & Harman Ltd. and the undersigned any and all amendments to this Annual Report on Form 10-K and to file the same with all exhibits thereto and other documents in connection therewith, with the Securities and Exchange Commission; each of such attorneys shall have the power to act hereunder with or without the other.
Pursuant to the requirements of the Securities Exchange Act of 1934, this report has been signed below by the following persons on behalf of the registrant and in the capacities and on the date indicated.
By: | /s/ Warren G. Lichtenstein | February 26, 2016 | |
Warren G. Lichtenstein, Chairman of the Board | Date | ||
By: | /s/ Jack L. Howard | February 26, 2016 | |
Jack L. Howard, Vice Chairman and Director | Date | ||
(Principal Executive Officer) | |||
By: | /s/ James F. McCabe, Jr. | February 26, 2016 | |
James F. McCabe, Jr., Chief Financial Officer | Date | ||
(Principal Accounting Officer) | |||
By: | /s/ Patrick A. DeMarco | February 26, 2016 | |
Patrick A. DeMarco, Director | Date | ||
By: | /s/ Robert Frankfurt | February 26, 2016 | |
Robert Frankfurt, Director | Date | ||
By: | /s/ John H. McNamara, Jr. | February 26, 2016 | |
John H. McNamara, Jr., Director | Date | ||
By: | /s/ Garen W. Smith | February 26, 2016 | |
Garen W. Smith, Director | Date | ||
By: | /s/ Jeffrey A. Svoboda | February 26, 2016 | |
Jeffrey A. Svoboda, Director | Date | ||
Page | 86