Attached files
| file | filename |
|---|---|
| EX-31.01 - EX-31.01 - AUDACY, INC. | d142039dex3101.htm |
| EX-32.02 - EX-32.02 - AUDACY, INC. | d142039dex3202.htm |
| EX-21.01 - EX-21.01 - AUDACY, INC. | d142039dex2101.htm |
| EX-31.02 - EX-31.02 - AUDACY, INC. | d142039dex3102.htm |
| EX-23.01 - EX-23.01 - AUDACY, INC. | d142039dex2301.htm |
| EX-10.04 - EX-10.04 - AUDACY, INC. | d142039dex1004.htm |
| EX-10.06 - EX-10.06 - AUDACY, INC. | d142039dex1006.htm |
| EX-32.01 - EX-32.01 - AUDACY, INC. | d142039dex3201.htm |
Table of Contents
UNITED STATES
SECURITIES AND EXCHANGE COMMISSION
Washington, D.C. 20549
FORM 10-K
(Mark One)
| x | ANNUAL REPORT PURSUANT TO SECTION 13 OR 15(d) OF THE SECURITIES EXCHANGE ACT OF 1934 |
For the fiscal year ended December 31, 2015
or
| ¨ | TRANSITION REPORT PURSUANT TO SECTION 13 OR 15(d) OF THE SECURITIES EXCHANGE ACT OF 1934 |
For the transition period from to
Commission File Number: 001-14461
Entercom Communications Corp.
(Exact name of registrant as specified in its charter)
| Pennsylvania | 23-1701044 | |
| (State or other jurisdiction of incorporation or organization) |
(I.R.S. Employer Identification No.) |
401 E. City Avenue, Suite 809
Bala Cynwyd, Pennsylvania 19004
(Address of principal executive offices and zip code)
(610) 660-5610
(Registrant’s telephone number, including area code)
SECURITIES REGISTERED PURSUANT TO SECTION 12(b) OF THE ACT:
| Title of each class |
Name of exchange on which registered | |
| Class A Common Stock, par value $.01 per share | New York Stock Exchange |
SECURITIES REGISTERED PURSUANT TO SECTION 12(g) OF THE ACT:
NONE
Indicate by check mark if the registrant is a well-known seasoned issuer, as defined in Rule 405 of the Securities Act. Yes ¨ No x
Indicate by check mark if the registrant is not required to file reports pursuant to Section 13 or Section 15(d) of the Act. Yes ¨ No x
Indicate by check mark whether the registrant (1) has filed all reports required to be filed by Section 13 or 15(d) of the Securities Exchange Act of 1934 during the preceding 12 months (or for such shorter period that the registrant was required to file such reports) and (2) has been subject to such filing requirements for the past 90 days. Yes x No ¨
Indicate by check mark whether the registrant has submitted electronically and posted on its corporate website, if any, every Interactive Data File required to be submitted and posted pursuant to Rule 405 of Regulation S-T (Section 232.405 of this chapter) during the preceding 12 months (or for such shorter period that the registrant was required to submit and post such files). Yes x No ¨
Indicate by check mark if disclosure of delinquent filers pursuant to Item 405 of Regulation S-K is not contained herein, and will not be contained, to the best of registrant’s knowledge, in definitive proxy or information statements incorporated by reference in Part III of this Form 10-K or any amendment to this Form 10-K. x
Indicate by check mark whether the registrant is a large accelerated filer, an accelerated filer, or a non-accelerated filer.
Large accelerated filer ¨ Accelerated filer x Non-accelerated filer ¨
Indicate by check mark whether the registrant is a shell company (as defined in Rule 12b-2 of the Exchange Act). Yes ¨ No x
As of February 15, 2016, the aggregate market value of the Class A common stock held by non-affiliates of the registrant was $309,327,453 based on the June 30, 2015 closing price of $11.42 on the New York Stock Exchange on such date.
Class A common stock, $0.01 par value 32,759,616 shares outstanding as of February 15, 2016
(Class A shares outstanding includes 1,584,801 unvested and vested but deferred restricted stock units).
Class B common stock, $0.01 par value 7,197,532 shares outstanding as February 15, 2016.
Table of Contents
DOCUMENTS INCORPORATED BY REFERENCE
Certain information in the registrant’s Definitive Proxy Statement for its 2016 Annual Meeting of Shareholders, pursuant to Regulation 14A, is incorporated by reference in Part III of this report, which will be filed with the Securities and Exchange Commission no later than April 29, 2016.
| Page | ||||||
| Item 1. |
1 | |||||
| Item 1A. |
4 | |||||
| Item 1B. |
10 | |||||
| Item 2. |
10 | |||||
| Item 3. |
11 | |||||
| Item 4. |
11 | |||||
| Item 5. |
11 | |||||
| Item 6. |
15 | |||||
| Item 7. |
Management’s Discussion and Analysis of Financial Condition and Results of Operations |
18 | ||||
| Item 7A. |
35 | |||||
| Item 8. |
35 | |||||
| Item 9. |
Changes in and Disagreements with Accountants on Accounting and Financial Disclosure |
35 | ||||
| Item 9A. |
35 | |||||
| Item 9B. |
36 | |||||
| Item 10. |
37 | |||||
| Item 11. |
37 | |||||
| Item 12. |
Security Ownership of Certain Beneficial Owners and Management and Related Shareholder Matters |
37 | ||||
| Item 13. |
Certain Relationships and Related Transactions and Director Independence |
37 | ||||
| Item 14. |
37 | |||||
| Item 15. |
38 | |||||
| 95 | ||||||
i
Table of Contents
CERTAIN DEFINITIONS
Unless the context requires otherwise, all references in this report to “Entercom,” “we,” “us,” “our” and similar terms refer to Entercom Communications Corp. and its consolidated subsidiaries, which would include any variable interest entities that are required to be consolidated under accounting guidance.
NOTE REGARDING FORWARD-LOOKING STATEMENTS
This report contains, in addition to historical information, statements by us with regard to our expectations as to financial results and other aspects of our business that involve risks and uncertainties and may constitute forward-looking statements within the meaning of Section 27A of the Securities Act of 1933 and Section 21E of the Securities Exchange Act of 1934, as amended.
Forward-looking statements, including certain pro forma information, are presented for illustrative purposes only and reflect our current expectations concerning future results and events. All statements other than statements of historical fact are “forward-looking statements” for purposes of federal and state securities laws including, without limitation, any projections of earnings, revenues or other financial items; any statements of the plans, strategies and objectives of management for future operations; any statements concerning proposed new services or developments; any statements regarding future economic conditions or performance; any statements of belief; and any statements of assumptions underlying any of the foregoing.
We report our financial information on a calendar year basis. Any reference to activity during the year is for the year ended December 31.
You can identify forward-looking statements by our use of words such as “anticipates,” “believes,” “continues,” “expects,” “intends,” “likely,” “may,” “opportunity,” “plans,” “potential,” “project,” “will,” “could,” “would,” “should,” “seeks,” “estimates,” “predicts” and similar expressions which identify forward-looking statements, whether in the negative or the affirmative. We cannot guarantee that we actually will achieve these plans, intentions or expectations. These forward-looking statements are subject to risks, uncertainties and other factors, some of which are beyond our control, which could cause actual results to differ materially from those forecasted or anticipated in such forward-looking statements. These risks, uncertainties and factors include, but are not limited to, the factors described in Part I, Item 1A, “Risk Factors.”
Any pro forma information that may be included reflects adjustments and is presented for comparative purposes only and does not purport to be indicative of what has occurred or indicative of future operating results or financial position.
You should not place undue reliance on these forward-looking statements, which reflect our view only as of the date of this report. We do not intend, and we do not undertake any obligation, to update these statements or publicly release the result of any revision(s) to these statements to reflect events or circumstances after the date of this report or to reflect the occurrence of unanticipated events.
ii
Table of Contents
| ITEM 1. | BUSINESS |
We are the fourth-largest radio broadcasting company in the United States with a portfolio of 125 radio stations in 27 top markets across the country. We were organized in 1968 as a Pennsylvania corporation.
Our Strategy
Our strategy focuses on providing compelling content in the communities we serve to enable us to offer our advertisers an effective marketing platform to reach a large targeted local audience. The principal components of our strategy are to: (i) focus on creating effective integrated marketing solutions for our customers that incorporate our audio, digital and experiential assets; (ii) build strongly-branded radio stations with highly compelling content; (iii) develop market leading station clusters; and (iv) recruit, develop, motivate and retain superior employees.
Source Of Revenue
The primary source of revenue for our radio stations is the sale of advertising time to local, regional and national advertisers and national network advertisers who purchase spot commercials in varying lengths. A growing source of revenue is from station-related digital platforms, which allow for enhanced audience interaction and participation, and integrated digital advertising solutions. A station’s local sales staff generates the majority of its local and regional advertising sales through direct solicitations of local advertising agencies and businesses. We retain a national representation firm to sell to advertisers outside of our local markets.
Our stations are typically classified by their format, such as news, sports, talk, classic rock, adult contemporary, alternative and country, among others. A station’s format enables it to target specific segments of listeners sharing certain demographics. Advertisers and stations use data published by audience measuring services to estimate how many people within particular geographical markets and demographics listen to specific stations. Our geographically and demographically diverse portfolio of radio stations allows us to deliver targeted messages to specific audiences for advertisers on a local, regional and national basis.
Competition
The radio broadcasting industry is highly competitive. Our stations compete for listeners and advertising revenue with other radio stations within their respective markets. In addition, our stations compete for audiences and advertising revenues with other media including: broadcast television, digital, satellite radio, satellite and cable television, newspapers and magazines, outdoor advertising, direct mail, yellow pages, wireless media alternatives, cellular phones and other forms of audio entertainment and advertisement.
Federal Regulation Of Radio Broadcasting
Overview. The radio broadcasting industry is subject to extensive and changing government regulation of, among other things, ownership limitations, program content, advertising content, technical operations and business and employment practices. The ownership, operation and sale of radio stations are subject to the jurisdiction of the Federal Communications Commission (the “FCC”) pursuant to the Communications Act of 1934, as amended (the “Communications Act”).
The following is a brief summary of certain provisions of the Communications Act and of certain specific FCC regulations and policies. This summary is not a comprehensive listing of all of the regulations and policies affecting radio stations. For further information concerning the nature and extent of federal regulation of radio stations, you should refer to the Communications Act, FCC rules and FCC public notices and rulings.
FCC Licenses. The operation of a radio broadcast station requires a license from the FCC. Certain of our subsidiaries hold the FCC licenses for our stations. The total number of radio stations that can simultaneously operate in any given area or market is limited by the amount of spectrum allotted by the FCC within the AM and FM radio bands, and by station-to-station interference within those bands. While there are no national station ownership caps, FCC rules do limit the number of stations within the same market that a single individual or entity may own or control.
The total number of stations authorized to operate in a local market may fluctuate from time to time, and the number of stations that can be owned by a single individual or entity in a given market can therefore vary over time. Once the FCC approves the ownership of a cluster of stations in a market, that owner may continue to hold those
1
Table of Contents
stations under “grandfathering” policies, despite a decrease in the number of stations in the market. A few of our market clusters, such as our stations in Greenville and Wilkes-Barre/Scranton, are considered to be “grandfathered.” If, at the time of a proposed future transaction, a cluster does not comply with the multiple ownership limitations based upon the number of stations then present in the market, the entire cluster cannot be transferred intact to a single party unless the purchaser qualifies as an “eligible entity” under specified small business standards and meets certain control tests.
Ownership Rules. The FCC sets limits on the number of broadcast stations (including both radio and TV) an entity may permissibly own within a market, as well as limits on the common ownership of broadcast stations and newspapers. Same-market FCC numeric ownership limitations are based: (i) on markets as defined and rated by Nielsen Audio; and (ii) in areas outside of Nielsen Audio markets, on markets ass determined by overlap of specified signal contours.
Ownership Attribution. In applying its ownership limitations, the FCC generally considers only “attributable” ownership interests. Attributable interests generally include: (i) equity and debt interests which when combined exceed 33% of a licensee’s or other media entity’s total asset value, if the interest holder supplies more than 15% of a station’s total weekly programming or has an attributable interest in any same-market media (television, radio, cable or newspaper), with a higher threshold in the case of investments in certain “eligible entities” acquiring broadcast stations; (ii) a 5% or greater direct or indirect voting stock interest, including certain interests held in trust, unless the holder is a qualified passive investor, in which case the threshold is a 20% or greater voting stock interest; (iii) any equity interest in a limited liability company or a partnership, including a limited partnership, unless properly “insulated” from management activities; and (iv) any position as an officer or director of a licensee or of its direct or indirect parent. In our case, where there is a “single majority voting shareholder,” the FCC treats as non-attributable voting stock interests held by non-single majority owners, even if they are in excess of the five percent standard described above.
Alien Ownership Rules. The Communications Act prohibits the issuance to, or holding of broadcast licenses by, foreign governments or aliens, non-U.S. citizens, whether individuals or entities, including any interest in a corporation which holds a broadcast license if more than 20% of the licensee’s capital stock is owned or voted by aliens. In addition, the FCC may prohibit any corporation from holding a broadcast license if the corporation is directly or indirectly controlled by any other corporation of which more than 25% of the capital stock is owned of record or voted by aliens if the FCC finds that the prohibition is in the public interest. The Communications Act gives the FCC discretion to allow greater amounts of alien ownership. The FCC considers investment proposals from international companies or individuals on a case-by-case basis.
License Renewal. Radio station licenses issued by the FCC are renewable ordinarily for an eight-year term. Seven of our FCC radio station license renewal applications filed in the most recent 2011-2014 renewal application window have not yet been granted. For five of those seven stations, license renewal applications filed during the prior 2003-2006 renewal application window have also not yet been granted. A station may continue to operate beyond the expiration date of its license if a timely filed license renewal application is pending.
The FCC is required to renew a broadcast station’s license if the FCC finds that the station has served the public interest, convenience and necessity; there have been no serious violations by the licensee of the Communications Act or the FCC’s rules and regulations; and there have been no other violations by the licensee of the Communications Act or the FCC’s rules and regulations that, taken together, constitute a pattern of abuse. If a challenge is filed against a renewal application, and, as a result of an evidentiary hearing, the FCC determines that the licensee has failed to meet certain fundamental requirements and that no mitigating factors justify the imposition of a lesser sanction, the FCC may deny a license renewal application. Historically, FCC licenses have generally been renewed.
Petitions to deny renewal applications are filed from time to time. Several petitions have been filed against us. Subject to the resolution of open FCC inquiries, we believe that our licenses will be renewed and that continuing challenges to already granted renewals will be resolved favorably to us, although there can be no assurance to that effect. The non-renewal of one or more of our licenses could have a material adverse effect on our business.
Transfer Or Assignment Of Licenses. The Communications Act prohibits the assignment of broadcast licenses or the transfer of control of a broadcast licensee without the prior approval of the FCC. In determining whether to grant such approval, the FCC considers a number of factors pertaining to the existing licensee and the proposed licensee, including:
| • | compliance with the various rules limiting common ownership of media properties in a given market; |
2
Table of Contents
| • | the “character” of the proposed licensee; and |
| • | compliance with the Communications Act’s limitations on alien ownership as well as general compliance with FCC regulations and policies. |
To obtain FCC consent for the assignment or transfer of control of a broadcast license, appropriate applications must be filed with the FCC. Interested parties may file objections or petitions to deny such applications.
Programming And Operation. The Communications Act requires broadcasters to serve the “public interest.” A licensee is required to present programming that is responsive to issues in the station’s community of license and to maintain records demonstrating this responsiveness. The FCC regulates, among other things, political advertising; sponsorship identification; the advertisement of contests and lotteries; the conduct of station-run contests; obscene, indecent and profane broadcasts; certain employment practices; and certain technical operation requirements, including limits on human exposure to radio-frequency radiation. The FCC considers complaints from listeners concerning a station’s public service programming, employment practices, or other operational issues when processing a renewal application filed by a station, but the FCC may consider complaints at any time and may impose fines or take other action for violations of the FCC’s rules separate from its action on a renewal application.
FCC regulations prohibit the broadcast of obscene material at any time as well as the broadcast, between the hours of 6 am and 10 pm, of material it considers “indecent” or “profane”. The FCC has historically enforced licensee compliance in this area through the assessment of monetary forfeitures. Such forfeitures may include: (i) imposition of the maximum authorized fine for egregious cases ($350,000 for a single violation, up to a maximum of $3,300,000 for a continuing violation); and (ii) imposition of fines on a per utterance basis instead of a single fine for an entire program. There are a number of outstanding indecency proceedings in which we are defending our stations’ conduct, and there may be other complaints of this nature which have been submitted to the FCC of which we have not yet been notified.
Certain FCC rules regulate the conduct of on-air station contests, requiring in general that the material rules and terms of the contest be broadcast periodically or posted online and that the contest be conducted substantially as announced. The FCC has a pending investigation into a contest at one of our stations. See Part I, Item 3, “Legal Proceedings,” for further discussion.
Enforcement Authority. The FCC has the power to impose penalties for violations of its rules under the Communications Act, including the imposition of monetary fines, the issuance of short-term licenses, the imposition of a condition on the renewal of a license, the denial of authority to acquire new stations, and the revocation of operating authority. The maximum fine for a single violation of the FCC’s rules (other than indecency rules – see discussion above) is currently $37,500.
Proposed And Recent Changes. Congress, the FCC and other federal agencies are considering or may in the future consider and adopt new laws, regulations and policies regarding a wide variety of matters that could: (1) affect, directly or indirectly, the operation, ownership and profitability of our radio stations; (2) result in the loss of audience share and advertising revenues for our radio stations; and (3) affect our ability to acquire additional radio stations or to finance those acquisitions.
Federal Antitrust Laws. The federal agencies responsible for enforcing the federal antitrust laws, the Federal Trade Commission and the Department of Justice, may investigate certain acquisitions. For an acquisition meeting certain size thresholds, the Hart-Scott-Rodino Antitrust Improvements Act of 1976 requires the parties to file Notification and Report Forms with the Federal Trade Commission and the Department of Justice and to observe specified waiting-period requirements before consummating the acquisition.
HD Radio
AM and FM radio stations may use the FCC selected In-Band On-Channel (“IBOC”) as the exclusive technology for terrestrial digital operations. IBOC, developed by iBiquity Digital Corporation, is also known as “HD Radio.”
HD Radio technology permits a station to transmit radio programming in digital format. We currently use HD Radio digital technology on most of our FM stations. The advantages of digital audio broadcasting over traditional analog broadcasting technology include improved sound quality, the availability of additional channels and the ability to offer a greater variety of auxiliary services.
3
Table of Contents
Employees
As of January 31, 2016, we had 1,608 full-time employees and 921 part-time employees. With respect to certain of our stations in our Kansas City and San Francisco markets, we are a party to collective bargaining agreements with the Screen Actors Guild - American Federation of Television and Radio Artists (known as SAG-AFTRA). Approximately ten employees are represented by these collective bargaining agreements. We believe that our relations with our employees are good.
Corporate Governance
Code Of Business Conduct And Ethics. We have a Code of Business Conduct and Ethics that applies to each of our employees including our principal executive officers and senior members of our finance department. Our Code of Business Conduct and Ethics can be found on the “Investors” sub-page of our website located at www.entercom.com/investors.
Board Committee Charters. Each of our Audit Committee, Compensation Committee and Nominating/Corporate Governance Committee has a committee charter as required by the rules of the New York Stock Exchange. These committee charters can be found on the “Investors” sub-page of our website located at www.entercom.com/investors.
Corporate Governance Guidelines. New York Stock Exchange rules require our Board of Directors to establish certain Corporate Governance Guidelines. These guidelines can be found on the “Investors” sub-page of our website located at www.entercom.com/investors.
Environmental Compliance
As the owner, lessee or operator of various real properties and facilities, we are subject to various federal, state and local environmental laws and regulations. Historically, compliance with these laws and regulations has not had a material adverse effect on our business.
Seasonality
Seasonal revenue fluctuations are common in the radio broadcasting industry and are due primarily to fluctuations in advertising expenditures. Our revenues are typically lowest in the first calendar quarter.
Internet Address And Internet Access To Periodic And Current Reports
You can find more information about us that includes a list of our stations in each of our markets at our Internet website located at www.entercom.com. Our Annual Report on Form 10-K, our Quarterly Reports on Form 10-Q, our Current Reports on Form 8-K and any amendments to those reports are available free of charge through our Internet website as soon as reasonably practicable after we electronically file such material with the Securities and Exchange Commission (the “SEC”). The contents of our websites are not incorporated by reference into this Annual Report on Form 10-K or in any other report or document we file with the SEC, and any references to our websites are intended to be inactive textual references only. We will also provide a copy of our annual report on Form 10-K upon any written request.
| ITEM 1A. | RISK FACTORS |
Many statements contained in this report are forward-looking in nature. See Note Regarding Forward-Looking Statements at the beginning of this Form 10-K. These statements are based on current plans, intentions or expectations, and actual results could differ materially as we cannot guarantee that we will achieve these plans, intentions or expectations. Among the factors that could cause actual results to differ are the following:
BUSINESS RISKS
Our results may be impacted by economic trends.
Our net revenues increased in 2015 as compared to the prior year primarily as a result of acquisitions made during the year. Excluding the net revenues from these new radio stations and a divested radio station, net revenues improved in the low single digits for the year. The second half of the year reflected improvement over the first half of the year.
4
Table of Contents
Our results of operations could be negatively impacted by delays or reversals in the economic recovery or by future economic downturns. Also, expenditures by advertisers tend to be cyclical, reflecting overall economic conditions. The risks associated with our business could be more acute in periods of a slowing economy or recession, which may be accompanied by a decrease in advertising. A decrease in advertising expenditures can have an adverse effect on our net revenues, profit margins, cash flow, and liquidity.
There can be no assurance that we will not experience an adverse impact on our ability to access capital, which may be material to our business, financial condition and results of operations. In addition, our ability to access the capital markets may be severely restricted at a time when we would like or need to do so, which could have an adverse impact on our capacity to react to changing economic and business conditions.
Our radio stations may be adversely affected by changes in programming and competition for advertising revenues.
We operate in a highly competitive business. Our radio stations compete for audiences with advertising revenue as our principal source of income. We compete directly with other radio stations, as well as with other media, such as broadcast, cable and satellite television, digital audio, newspapers and magazines, national and local digital services, outdoor advertising and direct mail. Audience ratings and market shares are subject to change, and any decrease in our ratings or market share in a particular market could have a material adverse effect on the revenue of our stations located in that market. Audience ratings and market shares could be affected by a variety of factors, including changes in the format or content of programming (some of which may be outside of our control), personnel changes, demographic shifts and general broadcast listening trends. Adverse changes in any of these areas or trends could have a material adverse effect on our business and results of operations. In addition, the market share mix of these competing mediums could also impact the advertising market share of radio advertising.
While we already compete in some of our markets with stations with similarly programmed formats, if another radio station in a market were to convert its programming format to a format similar to one of our stations or if an existing competitor were to garner additional market share, our stations could suffer a reduction in ratings and/or advertising revenue and could incur increased promotional and other expenses. Competing companies may be larger and have more financial resources than we do. We cannot be assured that any of our stations will be able to maintain or increase their current audience ratings and advertising revenues.
We cannot predict the competitive effect on the radio broadcasting industry of changes in audio content distribution, changes in technology or changes in regulations.
The radio broadcasting industry is subject to rapid technological change, evolving industry standards and the emergence of new media technologies and services. We may lack the resources to acquire new technologies or introduce new services to allow us to compete with these new offerings. Competing technologies and services, some of which are commercial free, include: personal audio devices; national and local digital audio services; satellite-delivered digital radio services; content available over the Internet; HD Radio, which provides multi-channel, multi-format digital radio services in the same bandwidth currently occupied by traditional AM and FM radio services; and low-power FM radio, which could result in additional FM radio broadcast outlets, including additional low-power FM radio signals authorized in December 2010 under the Local Community Radio Act.
We cannot predict the effect, if any, that competition arising from new technologies or regulatory changes may have on the radio broadcasting industry or on our financial condition and results of operations.
We are subject to extensive regulations and are dependent on federally issued licenses to operate our radio stations. Failure to comply with such regulations could damage our business.
The radio broadcasting industry is subject to extensive regulation by the FCC under the Communications Act of 1934. See Federal Regulation of Radio Broadcasting under Part I, Item 1, “Business.” We are required to obtain licenses from the FCC to operate our radio stations. Licenses are normally granted for a term of eight years and are renewable. Although the vast majority of FCC radio station licenses are routinely renewed, we cannot be assured that the FCC will approve our future renewal applications or that the renewals will not include conditions or qualifications. During the periods when a renewal application is pending, informal objections and petitions to deny the renewal application can be filed by interested parties, including members of the public, on a variety of grounds. Seven of our FCC radio station license renewal applications filed in the most recent 2011-2014 renewal period have not yet been granted. For five of those seven stations, license renewal applications filed during the prior 2003-2006 renewal application window have also not yet been granted. The non-renewal, or renewal with substantial conditions or modifications, of one or more of our licenses could have a material adverse effect on us.
5
Table of Contents
We must comply with extensive FCC regulations and policies in the ownership and operation of our radio stations. FCC regulations limit the number of radio stations that a licensee can own in a market, which could restrict our ability to consummate future transactions and in certain circumstances could require us to divest some radio stations. The FCC’s rules governing our radio station operations impose costs on our operations, and changes in those rules could have an adverse effect on our business. The FCC also requires radio stations to comply with certain technical requirements to limit interference between two or more radio stations. If the FCC relaxes these technical requirements, it could impair the signals transmitted by our radio stations and could have a material adverse effect on us. Moreover, these FCC regulations may change over time, and we cannot be assured that changes would not have a material adverse effect on us. We are currently the subject of several pending investigations by the FCC, including one involving a death following a contest at one of our stations.
Congress or federal agencies that regulate us could impose new regulations or fees on our operations that could have a material adverse effect on us.
There was proposed legislation in the past and there could be again in the future that requires radio broadcasters to pay additional fees such as a spectrum fee for the use of the spectrum. In addition, there was proposed legislation which would impose a new royalty fee that would be paid to record labels and performing artists for use of their recorded music. It is currently unknown what impact any potential required royalty payments or fees would have on our results of operations, cash flows or financial position.
The FCC has engaged in vigorous enforcement of its indecency rules against the broadcast industry, which could have a material adverse effect on our business.
FCC regulations prohibit the broadcast of obscene material at any time and indecent or profane material between the hours of 6:00 a.m. and 10:00 p.m. Over the last decade, the FCC has increased its enforcement efforts relating to the regulation of indecency and has threatened on more than one occasion to initiate license revocation proceedings against a broadcast licensee who commits a “serious” indecency violation. Congress has dramatically increased the penalties for broadcasting obscene, indecent or profane programming, and these penalties may potentially subject broadcasters to license revocation, renewal or qualification proceedings in the event that they broadcast such material. In addition, the FCC’s heightened focus on the indecency regulatory scheme, against the broadcast industry generally, may encourage third parties to oppose our license renewal applications or applications for consent to acquire broadcast stations. Several of our stations are currently subject to indecency-related inquiries and/or proposed fines at the FCC’s Enforcement Bureau as well as objections to our license renewals based on such inquiries and proposed fines, and we may in the future become subject to additional inquiries or proceedings related to our stations’ broadcast of obscene, indecent or profane material. To the extent that these inquiries or other proceedings result in the imposition of fines, a settlement with the FCC, revocation of any of our station licenses or denials of license renewal applications, our results of operations and business could be materially adversely affected.
The loss of key personnel could have a material adverse effect on our business.
Our business depends upon the continued efforts, abilities and expertise of our executive officers and other key personnel. We believe that the loss of one or more of these individuals could have a material adverse effect on our business.
Our radio stations compete for creative and on-air talent with other radio stations and other media, such as broadcast, cable and satellite television, digital media and satellite radio. Our on-air talent are subject to change, due to competition and for other reasons. Changes in on-air talent could materially and negatively affect our ratings and our ability to attract local and national advertisers, which could in turn adversely affect our revenues.
We depend on selected market clusters of radio stations for a material portion of our revenues.
For 2015, we generated over 50% of our net revenues in seven of our 27 markets, which were Boston, Denver, Kansas City, Portland, Sacramento, San Francisco and Seattle. Accordingly, we have greater exposure to adverse events or conditions in any of these markets, such as changes in the economy, shifts in population or demographics, or changes in audience tastes, which could have a material adverse effect on our financial position and results of operations and cash flows.
6
Table of Contents
We may be unable to effectively integrate our acquisitions.
The integration of acquisitions involves numerous risks, including:
| • | difficulties in the integration of operations and systems and the management of a large and geographically diverse group of stations; |
| • | the diversion of management’s attention from other business concerns; and |
| • | the potential loss of key employees of acquired stations. |
The risks of integration are magnified during any period of significant growth from acquisitions. We cannot be assured that we will be able to integrate successfully any operations, systems or management that might be acquired in future acquisitions. In addition, in the event that the operations of a new business do not meet expectations, we may restructure or write off the value of some or all of the assets of the new business.
Impairments to our broadcasting licenses and goodwill have reduced our earnings.
We have incurred impairment losses that resulted in the non-cash write-downs of our broadcasting licenses and goodwill. A significant amount of these impairment losses were recorded in 2008 during the recession and the most recent impairment loss was recorded in 2012. As of December 31, 2015, our broadcasting licenses and goodwill comprise 82% of our total assets. The valuation of our broadcasting licenses and goodwill is subjective and based on our estimates and assumptions rather than precise calculations. The fair value measurements for both our broadcast licenses and goodwill use significant unobservable inputs and reflect our own assumptions including market share and profit margin for an average station, growth within a radio market, estimates of costs and losses during early years, potential competition within a radio market and the appropriate discount rate used in determining fair value. If events occur or circumstances change that would reduce the fair value of the broadcasting licenses and goodwill below the amount reflected on the balance sheet, we may be required to recognize impairment charges, which may be material, in future periods. Current accounting guidance does not permit a valuation increase.
We have significant obligations relating to our current operating leases.
As of December 31, 2015, we had future operating lease commitments of approximately $114 million that are disclosed in Note 20 in the accompanying notes to the audited consolidated financial statements. We are required to make certain estimates at the inception of a lease in order to determine whether the lease is operating or capital. In February 2016, the accounting guidance was modified to require that all leases with a term of more than one year, covering leased assets such as real estate, broadcasting towers and equipment, be reflected on the balance sheet as assets and liabilities for the rights and obligations created by these leases. While we are currently reviewing the effects of this guidance, we believe that this would result in: (1) an increase in the assets and liabilities reflected on our consolidated balance sheets; and (2) an increase in our interest expense and depreciation and amortization expense and a decrease to our station operating expense reflected on our consolidated statements of operations. This guidance is effective for us as of January 1, 2019.
Our business is dependent upon the proper functioning of our internal business processes and information systems and modification or interruption of such systems may disrupt our business, processes and internal controls.
The proper functioning of our internal business processes and information systems is critical to the efficient operation and management of our business. If these information technology systems fail or are interrupted, our operations may be adversely affected and operating results could be harmed. Our business processes and information systems need to be sufficiently scalable to support the future growth of our business and may require modifications or upgrades that expose us to a number of operational risks. Our information technology systems, and those of third-party providers, may also be vulnerable to damage or disruption caused by circumstances beyond our control. These include catastrophic events, power anomalies or outages, computer system or network failures and natural disasters. Any material disruption, malfunction or similar challenges with our business processes or information systems, or disruptions or challenges relating to the transition to new processes, systems or providers, could have a material adverse effect on our financial position, results of operations and cash flows.
Cybersecurity threats to our business
The use of our computers and digital technology in substantially all aspects of our business operations give rise to cybersecurity risks, including viruses or malware, physical or electronic intrusions and unauthorized access to
7
Table of Contents
our data. A cybersecurity attack could compromise confidential information. There can be no assurance that we, or the security systems we implement, will protect against all of these rapidly changing risks. A cyber-incident could increase our operating costs, disrupt our operations, harm our reputation, or subject us to liability under laws and regulations that protect personal data. We maintain insurance coverage against certain of such risks, but cannot guarantee that such coverage will be applicable or sufficient with respect to any given incident or on-going incidents that go undetected.
RISKS RELATED TO OUR INDEBTEDNESS
Current and future indebtedness could have an adverse impact on us.
We have outstanding debt that could have an adverse impact on us. For example, these obligations:
| • | increase our vulnerability in an economic downturn, limit our ability to withstand competitive pressures and reduce our flexibility in responding to changing business and economic conditions; |
| • | make it more difficult for us to satisfy our financial obligations; |
| • | limit our ability to obtain additional financing for working capital, capital expenditures, acquisitions and general corporate or other purposes; |
| • | require us to dedicate a substantial portion of our cash flow from operations to debt service, thereby reducing the availability of cash flow for other purposes; |
| • | restrict us from taking advantage of opportunities to grow our business; and |
| • | limit or prohibit our ability to pay dividends and make other distributions. |
Our senior secured credit facility (the “Credit Facility”) includes a $40 million revolving commitment (the “Revolver”) of which $13.3 million was undrawn and available to us as of December 31, 2015. In December 2015, we reduced the total Revolver capacity from $50 million to $40 million. The amount of the Revolver available to us is a function of covenant compliance at the time of borrowing. Based on our financial covenant analysis as of December 31, 2015, we would not be limited in these borrowings. The Revolver matures on November 23, 2016. We expect to retire the Revolver using funds from operations. If we are not successful, a default under the Revolver could accelerate the due date for all of our outstanding debt.
We may from time to time seek to amend our existing debt agreements or obtain funding or additional debt financing, which may result in higher interest rates.
We must comply with the covenants in our debt agreements, which restrict our operational flexibility.
Our Credit Facility, which was entered into in November 2011 and subsequently amended, and the indenture governing our senior unsecured notes (the “Senior Notes”) contain provisions which, under certain circumstances, limit our ability to borrow money; make acquisitions, investments or restricted payments, including without limitation dividends and the repurchase of stock; swap or sell assets; or merge or consolidate with another company. To secure the debt under our Credit Facility, we have pledged substantially all of our assets, including the stock or equity interests of our subsidiaries. The Senior Notes are guaranteed on a senior unsecured basis by the parent and all of our existing subsidiaries.
The Credit Facility requires us to maintain compliance with specific financial covenants which are defined terms within the agreement, including: (1) a maximum Consolidated Leverage Ratio that cannot exceed 4.75 times at December 31, 2015, and which decreases to 4.50 times at March 31, 2016 and thereafter; and (2) a minimum Consolidated Interest Coverage Ratio of 2.00 times at December 31, 2015 and thereafter.
Our ability to comply with these financial covenants can be affected by operating performance or other events beyond our control, and we cannot be assured that we will comply with these covenants. A default under the indenture governing our Senior Notes or a default under our Credit Facility could cause a cross default. Any event of default, therefore, could have a material adverse effect on our business.
Failure to comply with our financial covenants or other terms of these financial instruments and the failure to negotiate and obtain any required relief from our lenders could result in the acceleration of the maturity of our outstanding debt and our lenders could proceed against our assets, including the equity interests of our subsidiaries. Under these circumstances, the acceleration of our debt could have a material adverse effect on our business.
8
Table of Contents
Because of our holding company structure, we depend on our subsidiaries for cash flow, and our access to this cash flow is restricted.
We operate as a holding company. All of our radio stations are currently owned and operated by our subsidiaries. Entercom Radio, LLC (“Radio”), our 100% owned finance subsidiary, is the borrower under our Credit Facility and is the issuer of our Senior Notes. All of our station operating subsidiaries and FCC license subsidiaries are subsidiaries of Radio. Further, we guarantee Radio’s obligations under the Credit Facility on a senior secured basis. The Senior Notes are guaranteed on an unsecured basis. Radio’s subsidiaries are all full and unconditional guarantors jointly and severally under the Credit Facility and the Senior Notes.
As a holding company, our only source of cash to pay our obligations, including corporate overhead and other expenses, is cash distributed from our subsidiaries. We currently expect that the majority of the net earnings and cash flow of our subsidiaries will be retained and used by them in their operations, including servicing Radio’s debt obligations. Even if our subsidiaries elect to make distributions to us, we cannot be assured that applicable state law and contractual restrictions, including the dividend covenants contained in our Credit Facility, would permit such dividends or distributions.
Our variable rate debt subjects us to interest rate risk, which could cause our debt service obligations to increase significantly.
Borrowings under our Credit Facility are at variable rates of interest and expose us to interest rate risk. If interest rates increase, our debt service obligations under the Credit Facility could increase even though the amount borrowed remains the same, and our net income and cash flows, including cash available for servicing our debt, could correspondingly decrease. As of December 31, 2015, and assuming the Revolver was fully drawn, a 100 basis point increase in London Interbank Offered Rate (“LIBOR”) rates as of December 31, 2015 would result in a $1.4 million increase in annual interest expense on our debt (in this hypothetical assumption, a 100 basis point increase in LIBOR only partially impacted the interest on our Credit Facility’s term loan (“Term B Loan”) as the LIBOR rate on our Term B Loan is subject to a 100 basis point minimum).
In the future, we may enter into interest rate swaps that involve the exchange of floating for fixed rate interest payments in order to reduce interest rate risk. We may, however, not maintain interest rate swaps with respect to all of our variable rate debt, and any swaps we enter into may not fully mitigate our interest rate risk.
A lowering or withdrawal of the ratings assigned to our debt securities by rating agencies may increase our future borrowing costs and reduce our access to capital.
Our debt has a non-investment grade rating, and any rating assigned could be lowered or withdrawn entirely by a rating agency if, in the rating agency’s judgment, future circumstances relating to the basis of the rating, such as adverse changes, so warrant. Any future lowering of our ratings would likely make it more difficult or more expensive for us to obtain additional debt financing.
RISKS ASSOCIATED WITH OUR STOCK
Our Chairman of the Board and our President and Chief Executive Officer own a substantial equity interest in us and effectively control our Company. Their interests may conflict with your interest.
As of February 15, 2016, Joseph M. Field, our Chairman of the Board, beneficially owned 1,563,291 shares of our Class A common stock and 6,148,282 shares of our Class B common stock, representing approximately 62% of the total voting power of all of our outstanding common stock. As of February 15, 2016, David J. Field, our President and Chief Executive Officer, one of our directors and the son of Joseph M. Field, beneficially owned 3,214,068 shares of our Class A common stock and 749,250 shares of our outstanding Class B common stock, representing approximately 11% of the total voting power of all of our outstanding common stock. Collectively, Joseph M. Field and David J. Field and other members of the Field family beneficially own all of our outstanding Class B common stock. Other members of the Field family and trusts for their benefit also own shares of Class A common stock.
9
Table of Contents
Shares of Class B common stock are transferable only to Joseph M. Field, David J. Field, certain of their family members or trusts for any of their benefit. Upon any other transfer, shares of our Class B common stock automatically convert into shares of our Class A common stock on a one-for-one basis. Shares of our Class B common stock are entitled to ten votes only when Joseph M. Field or David J. Field vote them, subject to certain exceptions when they are restricted to one vote. Joseph M. Field generally is able to control the vote on all matters submitted to a vote of shareholders and, therefore, is able to direct our management and policies, except with respect to those matters when the shares of our Class B common stock are only entitled to one vote and those matters requiring a class vote under the provisions of our articles of incorporation, bylaws or applicable law, including, without limitation, the election of the two Class A directors.
Future sales by Joseph M. Field and/or David J. Field could adversely affect the price of our Class A common stock.
The price for our Class A common stock could fall substantially if Joseph M. Field and/or David J. Field sell in the public market or transfer large amounts of shares, including any shares of our Class B common stock which are automatically converted to Class A common stock when sold (as described in the above paragraph). These sales, or the possibility of such sales, could make it more difficult for us to raise capital by selling equity or equity-related securities in the future.
The difficulties associated with any attempt to gain control of our Company could adversely affect the price of our Class A common stock.
Joseph M. Field controls the decision as to whether a change in control will occur for our Company. There are also provisions contained in our articles of incorporation, by-laws and Pennsylvania law that could make it more difficult for a third party to acquire control of our Company. In addition, FCC approval for transfers of control of FCC licenses and assignments of FCC licenses is required. These restrictions and limitations could adversely affect the trading price of our Class A common stock.
Our Class A stock price and trading volume could be volatile.
Our Class A common stock has been publicly traded on the New York Stock Exchange (“NYSE”) since January 29, 1999. The market price of our Class A common stock and our trading volume have been subject to fluctuations since the date of our initial public offering. As a result, the market price of our Class A common stock could experience volatility, regardless of our operating performance.
Our newly issued perpetual cumulative convertible preferred stock could adversely affect the price of our Class A common stock.
Our Board of Directors has the authority to issue up to 25,000,000 shares of preferred stock. We have issued 11 shares with a liquidation preference of $2.5 million per share. Our Board of Directors has the authority to determine the price, rights, preferences, privileges and restrictions, including voting rights, of our preferred stock without any further vote or action by the stockholders. The rights of the holders of our common stock may be subject to, and may be adversely affected by, the rights of the holders of any preferred stock that may be issued in the future.
| ITEM 1B. | UNRESOLVED STAFF COMMENTS |
None.
| ITEM 2. | PROPERTIES |
The types of properties required to support each of our radio stations include offices, studios and transmitter/antenna sites. We lease most of these sites. A station’s studios are generally housed with its offices in business districts. Our studio and office space leases typically contain lease terms with expiration dates of five to 15 years. Our transmitter/antenna sites, which may include an auxiliary transmitter/antenna as a back-up to the main site, contain lease terms that generally range from five to 30 years, which may include options to renew.
The transmitter/antenna site for each station is generally located so as to provide maximum market coverage. In general, we do not anticipate difficulties in renewing facility or transmitter/antenna site leases or in leasing additional space or sites if required.
10
Table of Contents
We have approximately $114 million in future minimum rental commitments under these leases. Many of these leases contain clauses such as defined contractual increases or cost of living adjustments.
Our principal executive offices are located at 401 E. City Avenue, Suite 809, Bala Cynwyd, Pennsylvania 19004, in 14,061 square feet of leased office space. The lease on these premises is due to expire on October 31, 2021. We generally consider our facilities to be suitable and of adequate size for our current and intended purposes.
| ITEM 3. | LEGAL PROCEEDINGS |
We currently and from time to time are involved in litigation incidental to the conduct of our business. Management anticipates that any potential liability of ours that may arise out of or with respect to these matters will not materially adversely affect our financial position, results of operations or cash flows.
Broadcast Licenses
We could face increased costs in the form of fines and a greater risk that we could lose any one or more of our broadcasting licenses if the FCC concludes that programming broadcast by our stations was obscene, indecent or profane and such conduct warrants license revocation. The FCC’s authority to impose a fine for the broadcast of such material is $325,000 for a single incident, with a maximum fine of up to $3,000,000 for a continuing violation. In the past, the FCC has issued Notices of Apparent Liability and a Forfeiture Order with respect to several of our stations proposing fines for certain programming which the FCC deemed to have been indecent. These cases are the subject of pending administrative appeals. The FCC has also investigated other complaints from the public that some of our stations broadcast indecent programming. These investigations remain pending. The FCC initiated an investigation into an incident where a person died in January 2007 after participating in a contest at one of our stations and this investigation remains pending. For a further discussion, refer to the risk factors described in Part I, Item 1A, “Risk Factors.”
| ITEM 4. | MINE SAFETY DISCLOSURE |
Not applicable.
| ITEM 5. | MARKET FOR REGISTRANT’S COMMON EQUITY, RELATED SHAREHOLDER MATTERS AND ISSUER PURCHASES OF EQUITY SECURITIES |
Market Information For Our Common Stock
Our Class A common stock, $0.01 par value, is listed on the New York Stock Exchange under the symbol “ETM.” The table below shows, for the quarters indicated, the reported high and low trading prices of our Class A common stock on the New York Stock Exchange.
| Price Range | ||||||||
| High | Low | |||||||
| Calendar Year 2015 |
||||||||
| Fourth Quarter |
$ | 12.45 | $ | 9.75 | ||||
| Third Quarter |
$ | 11.99 | $ | 9.62 | ||||
| Second Quarter |
$ | 13.33 | $ | 11.00 | ||||
| First Quarter |
$ | 13.09 | $ | 11.16 | ||||
| Calendar Year 2014 |
||||||||
| Fourth Quarter |
$ | 12.77 | $ | 7.86 | ||||
| Third Quarter |
$ | 11.33 | $ | 8.03 | ||||
| Second Quarter |
$ | 11.11 | $ | 9.87 | ||||
| First Quarter |
$ | 11.47 | $ | 8.96 | ||||
There is no established trading market for our Class B common stock, $0.01 par value.
11
Table of Contents
Holders
As of February 15, 2016, there were approximately 266 shareholders of record of our Class A common stock. Based upon available information, we believe we have approximately 2,239 beneficial owners of our Class A common stock. There are four shareholders of record of our Class B common stock, $0.01 par value, and no shareholders of record of our Class C common stock, $0.01 par value. There is one holder of our perpetual cumulative convertible preferred stock.
Dividends
We do not currently pay, and have not paid for the past several years, any dividends on our common stock. The payment of any future dividends will be at the discretion of the Board of Directors based upon the relevant factors at the time of such consideration, including, without limitation, compliance with the restrictions set forth in our Credit Facility, the indenture governing our Senior Notes and our perpetual cumulative convertible preferred stock (“Preferred”). The payment of dividends on the Preferred and the repayment of the liquidation preference of the Preferred will take preference over any dividends or other payments to our common stockholders. A quarterly dividend on our Preferred of $0.4 million was declared and paid in October 2015 and in January 2016.
For a summary of these restrictions on our ability to pay dividends, see Liquidity under Part II, Item 7, “Management’s Discussion And Analysis Of Financial Condition And Results Of Operations,” and Note 8 in the accompanying notes to the consolidated financial statements.
Repurchases Of Our Stock
The following table provides information on our repurchases during the quarter ended December 31, 2015:
| Period (1) |
(a) Total Number Of Shares Purchased |
(b) Average Price Paid Per Share |
(c) Total Number Of Shares Purchased As Part Of Publicly Announced Plans Or Programs |
(d) Maximum Approximate Dollar Value Of Shares That May Yet Be Purchased Under The Plans Or Programs |
||||||||||||
| October 1, 2015 - October 31, 2015 |
1,950 | $ | 11.36 | — | $ | — | ||||||||||
| November 1, 2015 - November 30, 2015 |
1,215 | $ | 11.04 | — | $ | — | ||||||||||
| December 1, 2015 - December 31, 2015 |
— | $ | — | — | $ | — | ||||||||||
|
|
|
|
|
|||||||||||||
| Total |
3,165 | — | ||||||||||||||
|
|
|
|
|
|||||||||||||
| (1) | We withheld shares upon the vesting of restricted stock units (“RSUs”) in order to satisfy employees’ tax obligations. As a result, we are deemed to have purchased: (1) 1,950 shares at an average price of $11.36 per share in October 2015; and (2) 1,215 shares at an average price of $11.04 per share in November 2015. |
On July 16, 2015, we issued 11 shares of Series A Preferred Stock in connection with an acquisition. Each share of preferred stock has a conversion price of $14.35 (subject to adjustment) and a liquidation preference of $2,500,000 per share. We previously provided the information required by Item 702 of Regulation S-K in a Current Report on Form 8-K filed with the Securities and Exchange Commission on July 17, 2015.
12
Table of Contents
Equity Compensation Plan Information
The following table sets forth, as of December 31, 2015, the number of securities outstanding upon the exercise of outstanding options under our equity compensation plan, the weighted average exercise price of such securities and the number of securities available for grant under these plans:
| Equity Compensation Plan Information as of December 31, 2015 |
||||||||||||
| (a) | (b) | (c ) | ||||||||||
| Plan Category |
Number Of Shares To Be Issued Upon Exercise Of Outstanding Options, Warrants And Rights |
Weighted Average Exercise Price Of Outstanding Options, Warrants And Rights |
Number Of Securities Remaining Available For Future Issuance Under Equity Compensation Plans (Excluding Column (a)) |
|||||||||
| Equity Compensation Plans Approved by Shareholders: |
||||||||||||
| Entercom Equity Compensation Plan (1) |
466,925 | $ | 1.93 | 2,502,986 | ||||||||
| Equity Compensation Plans Not Approved by Shareholders: |
||||||||||||
| None |
— | — | — | |||||||||
|
|
|
|
|
|||||||||
| Total |
466,925 | 2,502,986 | ||||||||||
|
|
|
|
|
|||||||||
| (1) | On January 1 of each year, the number of shares of Class A common stock authorized under the Entercom Equity Compensation Plan (the “Plan”) is automatically increased by 1.5 million, or a lesser number as may be determined by our Board of Directors. The Board of Directors elected to forego the January 1, 2016 increase. As of December 31, 2015: (i) the maximum number of shares authorized under the Plan was 10.3 million shares; and (ii) 2.5 million shares remain available for future grant under the Plan. |
For a description of the Entercom Equity Compensation Plan refer to Note 13, Share-Based Compensation, in the accompanying notes to the consolidated financial statements.
13
Table of Contents
Performance Graph
The following Comparative Stock Performance Graph shall not be deemed incorporated by reference by any general statement incorporating by reference this Form 10-K into any filing under the Securities Act of 1933, as amended, or the Securities Exchange Act of 1934, as amended, except to the extent that we specifically incorporate this information by reference. This Comparative Stock Performance Graph is being furnished with this Form 10-K and shall not otherwise be deemed filed under such acts.
The following line graph compares the cumulative 5-year total return provided to shareholders of our Class A common stock relative to the cumulative total returns of: (i) the S&P 500 index; and (ii) a peer group index consisting of Cumulus Media Inc., Emmis Communications Corp., Radio One, Inc. and Beasley Broadcast Group, Inc. An investment of $100 (with reinvestment of all dividends) is assumed to have been made on December 31, 2010.
Cumulative Five-Year Return Index Of A $100 Investment
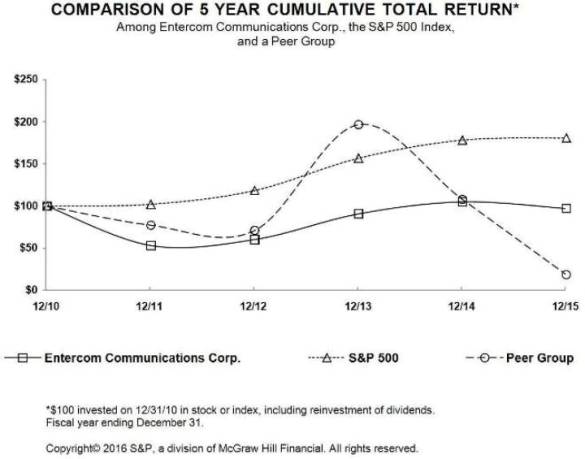
| 12/10 | 12/11 | 12/12 | 12/13 | 12/14 | 12/15 | |||||||||||||||||||
| Entercom Communications Corp. |
100.00 | 53.11 | 60.28 | 90.76 | 105.01 | 96.98 | ||||||||||||||||||
| S&P 500 |
100.00 | 102.11 | 118.45 | 156.82 | 178.29 | 180.75 | ||||||||||||||||||
| Peer Group |
100.00 | 77.25 | 71.06 | 196.65 | 107.85 | 18.47 | ||||||||||||||||||
14
Table of Contents
| ITEM 6. | SELECTED FINANCIAL DATA |
The selected financial data below, as of and for 2015 and the four prior years, were derived from our audited consolidated financial statements. The selected financial data for 2015, 2014 and 2013 and balance sheets as of December 31, 2015 and 2014 are qualified by reference to, and should be read in conjunction with, the corresponding audited consolidated financial statements, and the notes thereto, and Management’s Discussion and Analysis of Financial Condition and Results of Operations included elsewhere in this annual report. The selected financial data for 2012 and 2011 and the balance sheets as of December 31, 2013, 2012 and 2011 are derived from financial statements not included herein.
Our financial results are not comparable from year to year due to acquisitions and dispositions of radio stations, impairments of broadcasting licenses and goodwill and other significant events:
| • | In 2015, we acquired multiple radio stations, net of certain dispositions. Related to these transactions, we incurred: (1) merger and acquisition costs of $4.0 million in 2015 and $1.0 million in 2014; and (2) restructuring charges of $2.8 million in 2015 from the restructuring of operations; |
| • | In 2012 and 2011, we acquired one radio station; |
| • | In 2012, we incurred an impairment loss of $22.3 million in connection with our review of goodwill and broadcasting licenses; |
| • | In 2011, we reversed a full valuation allowance against our deferred tax assets that had been established previously; and |
| • | In the fourth quarter of 2011, we refinanced our debt which substantially increased our interest expense in 2012 as our new debt had higher borrowing rates than our prior debt. In addition, we incurred new deferred financing fees as part of the refinancing that were higher than the previous deferred financing fees. Subsequent modifications of our outstanding debt in the fourth quarters of 2013 and 2012 decreased our borrowing rate. |
15
Table of Contents
SELECTED FINANCIAL DATA
(amounts in thousands, except per share data)
| Years Ended December 31, | ||||||||||||||||||||
| 2015 | 2014 | 2013 | 2012 | 2011 | ||||||||||||||||
| Operating Data: |
||||||||||||||||||||
| Net revenues |
$ | 411,378 | $ | 379,789 | $ | 377,618 | $ | 388,924 | $ | 382,727 | ||||||||||
|
|
|
|
|
|
|
|
|
|
|
|||||||||||
| Operating (income) expenses: |
||||||||||||||||||||
| Station operating expenses, including non-cash compensation expense |
287,711 | 259,184 | 252,596 | 252,934 | 264,195 | |||||||||||||||
| Depreciation and amortization |
8,419 | 7,794 | 8,545 | 10,839 | 11,276 | |||||||||||||||
| Corporate G & A expenses, including non-cash compensation expense |
26,479 | 26,572 | 24,381 | 25,874 | 26,609 | |||||||||||||||
| Impairment loss |
— | — | 850 | 22,307 | — | |||||||||||||||
| Merger and acquisition costs and restructuring charges |
6,836 | 1,042 | — | — | 767 | |||||||||||||||
| Net time brokerage agreement fees (income) |
(1,285 | ) | — | — | 238 | 244 | ||||||||||||||
| Net (gain) loss on sale of assets |
(2,364 | ) | (379 | ) | (1,321 | ) | 138 | 163 | ||||||||||||
|
|
|
|
|
|
|
|
|
|
|
|||||||||||
| Total operating expenses |
325,796 | 294,213 | 285,051 | 312,330 | 303,254 | |||||||||||||||
|
|
|
|
|
|
|
|
|
|
|
|||||||||||
| Operating income (loss) |
85,582 | 85,576 | 92,567 | 76,594 | 79,473 | |||||||||||||||
| Other (income) expense: |
||||||||||||||||||||
| Net interest expense |
37,961 | 38,821 | 44,232 | 53,446 | 24,919 | |||||||||||||||
| Other income |
— | — | (165 | ) | (118 | ) | (32 | ) | ||||||||||||
| (Gain) loss on early extinguishment of debt |
— | — | — | 747 | 1,144 | |||||||||||||||
| Net loss on investments |
— | 21 | — | 123 | 30 | |||||||||||||||
| Net (gain) loss on derivative instruments |
— | — | — | (1,346 | ) | 1,346 | ||||||||||||||
|
|
|
|
|
|
|
|
|
|
|
|||||||||||
| Total other expense |
37,961 | 38,842 | 44,067 | 52,852 | 27,407 | |||||||||||||||
|
|
|
|
|
|
|
|
|
|
|
|||||||||||
| Income (loss) before income taxes (benefit) |
47,621 | 46,734 | 48,500 | 23,742 | 52,066 | |||||||||||||||
| Income taxes (benefit) |
18,437 | 19,911 | 22,476 | 12,474 | (18,988 | ) | ||||||||||||||
|
|
|
|
|
|
|
|
|
|
|
|||||||||||
| Net income (loss) attributable to Company |
29,184 | 26,823 | 26,024 | 11,268 | 71,054 | |||||||||||||||
| Preferred stock dividend |
752 | — | — | — | — | |||||||||||||||
|
|
|
|
|
|
|
|
|
|
|
|||||||||||
| Net income (loss) attributable to common shareholders |
$ | 28,432 | $ | 26,823 | $ | 26,024 | $ | 11,268 | $ | 71,054 | ||||||||||
|
|
|
|
|
|
|
|
|
|
|
|||||||||||
16
Table of Contents
SELECTED FINANCIAL DATA
(amounts in thousands, except per share data)
| Years Ended December 31, | ||||||||||||||||||||
| 2015 | 2014 | 2013 | 2012 | 2011 | ||||||||||||||||
| Operating Data (continued): |
||||||||||||||||||||
| Net income (loss) attributable to common shareholders per share - basic: |
$ | 0.75 | $ | 0.71 | $ | 0.70 | $ | 0.31 | $ | 1.95 | ||||||||||
|
|
|
|
|
|
|
|
|
|
|
|||||||||||
| Net income (loss) attributable to common shareholders per share - diluted: |
$ | 0.73 | $ | 0.69 | $ | 0.68 | $ | 0.30 | $ | 1.88 | ||||||||||
|
|
|
|
|
|
|
|
|
|
|
|||||||||||
| Weighted average shares - basic |
38,084 | 37,763 | 37,418 | 36,906 | 36,369 | |||||||||||||||
|
|
|
|
|
|
|
|
|
|
|
|||||||||||
| Weighted average shares - diluted |
39,038 | 38,664 | 38,301 | 37,810 | 37,764 | |||||||||||||||
|
|
|
|
|
|
|
|
|
|
|
|||||||||||
| Cash Flows Data: |
||||||||||||||||||||
| Cash flows related to: |
||||||||||||||||||||
| Operating activities |
$ | 64,790 | $ | 65,296 | $ | 63,349 | $ | 69,702 | $ | 85,525 | ||||||||||
|
|
|
|
|
|
|
|
|
|
|
|||||||||||
| Investing activities |
$ | (91,744 | ) | $ | (7,055 | ) | $ | (4,583 | ) | $ | (29,359 | ) | $ | (14,284 | ) | |||||
|
|
|
|
|
|
|
|
|
|
|
|||||||||||
| Financing activities |
$ | 4,583 | $ | (38,932 | ) | $ | (55,458 | ) | $ | (35,045 | ) | $ | (71,384 | ) | ||||||
|
|
|
|
|
|
|
|
|
|
|
|||||||||||
| Other Data: |
||||||||||||||||||||
| Dividends declared and paid on the perpetual cumulative convertible preferred stock - paid and accrued |
$ | 413 | $ | — | $ | — | $ | — | $ | — | ||||||||||
|
|
|
|
|
|
|
|
|
|
|
|||||||||||
| December 31, | ||||||||||||||||||||
| 2015 | 2014 | 2013 | 2012 | 2011 | ||||||||||||||||
| Balance Sheet Data: |
||||||||||||||||||||
| Cash and cash equivalents |
$ | 9,169 | $ | 31,540 | $ | 12,231 | $ | 8,923 | $ | 3,625 | ||||||||||
| Intangibles and other assets |
851,944 | 771,081 | 774,893 | 777,885 | 779,495 | |||||||||||||||
| Total assets |
1,022,108 | 926,615 | 912,688 | 920,358 | 919,269 | |||||||||||||||
| Senior secured debt, including current portion |
268,750 | 262,000 | 299,500 | 352,592 | 385,121 | |||||||||||||||
| Senior unsecured notes, senior subordinated notes and other |
218,269 | 217,929 | 217,624 | 229,959 | 229,713 | |||||||||||||||
| Deferred tax liabilities and other long-term liabilities |
109,251 | 89,904 | 70,519 | 41,455 | 23,152 | |||||||||||||||
| Perpetual cumulative convertible preferred stock (mezzanine) |
27,619 | — | — | — | — | |||||||||||||||
| Total shareholders’ equity |
361,450 | 329,021 | 298,393 | 269,494 | 253,688 | |||||||||||||||
17
Table of Contents
ITEM 7. MANAGEMENT’S DISCUSSION AND ANALYSIS OF FINANCIAL CONDITION AND RESULTS OF OPERATIONS
Overview
We are the fourth-largest radio broadcasting company in the United States with a portfolio of 125 radio stations in 27 top markets across the country.
Our results are based upon the aggregate performance of our radio stations. The following are some of the factors that impact a radio station’s performance at any given time: (i) audience ratings; (ii) program content; (iii) management talent and expertise; (iv) sales talent and expertise; (v) audience characteristics; (vi) signal strength; and (vii) the number and characteristics of other radio stations and other advertising media in the market area.
As opportunities arise, we may, on a selective basis, change or modify a station’s format due to changes in listeners’ tastes or changes in a competitor’s format. This could have an initial negative impact on a station’s ratings and/or revenues, and there are no guarantees that the modification or change will be beneficial at some future time. Our management is continually focused on these opportunities as well as the associated risks and uncertainties. We strive to develop compelling content and strong brand images to maximize audience ratings that are crucial to our stations’ financial success.
A radio broadcasting company derives its revenues primarily from the sale of broadcasting time to local, regional and national advertisers and national network advertisers who purchase spot commercials in varying lengths. A growing source of revenue is from station-related digital platforms, which allow for enhanced audience interaction and participation, and integrated local digital marketing solutions. A station’s local sales staff generates the majority of its local and regional advertising sales through direct solicitations of local advertising agencies and businesses. We retain a national representation firm to sell to advertisers outside of our local markets.
In the radio broadcasting industry, seasonal revenue fluctuations are common and are due primarily to variations in advertising expenditures by local and national advertisers. Typically, revenues are lowest in the first calendar quarter of the year.
In 2015, we generated the majority of our net revenues from local advertising, which is sold primarily by each individual local radio station’s sales staff, and the next largest amount from national advertising, which is sold by an independent advertising sales representative. This includes, but is not limited to, the sale of advertising during audio streaming of our radio stations over the Internet and the sale of advertising on our stations’ websites. We generated the balance of our 2015 revenues principally from network compensation, non-spot revenue, event marketing, e-commerce and integrated local digital marketing solutions.
The majority of our revenue is recorded on a net basis, which is gross revenue less advertising agency commissions. Revenues from digital marketing solutions and e-commerce are reflected on a net basis when appropriate. Revenues from event marketing are reflected on a net basis when we are not the primary party hosting the event. The revenues are determined by the advertising rates charged and the number of advertisements broadcast. We maximize our revenues by managing the inventory of advertising spots available for broadcast, which can vary throughout the day but is consistent over time.
Our most significant station operating expenses are employee compensation, programming and promotional expenses. Other significant expenses that impact our profitability are interest and depreciation and amortization expense.
You should read the following discussion and analysis of our financial condition and results in conjunction with our consolidated financial statements and related notes included elsewhere in this report. The following results of operations include a discussion of 2015 as compared to the prior year and a discussion of 2014 as compared to the prior year.
18
Table of Contents
Results Of Operations
The year 2015 as compared to the year 2014
The following significant factors affected our results of operations for 2015 as compared to the prior year:
Business Combinations
On July 16, 2015, we acquired the stock of Lincoln Financial Media Company (“Lincoln”) for $77.5 million in cash and $27.5 million in newly issued Preferred. Lincoln indirectly held the assets and liabilities of radio stations serving the Atlanta, Denver, Miami and San Diego markets (the “Lincoln Acquisition”).
On July 10, 2015, we agreed with Bonneville International Corporation (“Bonneville”) to exchange certain radio stations in Denver for a radio station in Los Angeles, California (the “Bonneville Exchange”) plus additional consideration. Pursuant to a time brokerage agreement (“TBA”), on July 17, 2015, we commenced operations of a radio station in Los Angeles. That same day, Bonneville commenced operations of certain of our Denver radio stations. On November 24, 2015, we completed the Bonneville Exchange.
On a combined basis, the above transactions resulted in an increase to our net revenues and station operating expenses, our TBA income, depreciation and amortization expense and interest expense. In addition, we recognized a gain of $1.5 million on the disposition of a radio station.
We incurred merger and acquisition costs of $4.0 million in 2015 and $1.0 million in 2014 primarily related to the Lincoln Acquisition and the Bonneville Exchange.
We incurred restructuring charges of $2.8 million in 2015 primarily as a result of the restructuring of operations for the Lincoln Acquisition. These costs included a workforce reduction charge, the recognition of duplicative contractual obligations and the abandonment of excess studio space in one of the acquired markets.
Other
During the third quarter of 2014, we settled a legal claim for $1.0 million. This amount was included in corporate general and administrative expenses.
| YEARS ENDED DECEMBER 31, | ||||||||||||
| 2015 | 2014 | % Change | ||||||||||
| (dollars in millions) | ||||||||||||
| NET REVENUES |
$ | 411.4 | $ | 379.8 | 8 | % | ||||||
|
|
|
|
|
|||||||||
| OPERATING EXPENSE: |
||||||||||||
| Station operating expenses |
287.7 | 259.2 | 11 | % | ||||||||
| Depreciation and amortization expense |
8.4 | 7.8 | 8 | % | ||||||||
| Corporate general and administrative expenses |
26.5 | 26.6 | (0 | %) | ||||||||
| Merger and acquisition costs and restructuring charges |
6.8 | 1.0 | nmf | |||||||||
| Other operating (income) expenses |
(3.6 | ) | (0.4 | ) | nmf | |||||||
|
|
|
|
|
|||||||||
| Total operating expense |
325.8 | 294.2 | 11 | % | ||||||||
|
|
|
|
|
|||||||||
| OPERATING INCOME (LOSS) |
85.6 | 85.6 | 0 | % | ||||||||
|
|
|
|
|
|||||||||
| OTHER (INCOME) EXPENSE: |
||||||||||||
| Net interest expense |
38.0 | 38.8 | (2 | %) | ||||||||
|
|
|
|
|
|||||||||
| TOTAL OTHER EXPENSE |
38.0 | 38.8 | (2 | %) | ||||||||
|
|
|
|
|
|||||||||
| INCOME (LOSS) BEFORE INCOME TAXES (BENEFIT) |
47.6 | 46.8 | 2 | % | ||||||||
| INCOME TAXES (BENEFIT) |
18.4 | 20.0 | (8 | %) | ||||||||
|
|
|
|
|
|||||||||
| NET INCOME (LOSS) AVAILABLE TO THE COMPANY |
29.2 | 26.8 | 9 | % | ||||||||
| Preferred stock dividend |
(0.8 | ) | — | nmf | ||||||||
|
|
|
|
|
|||||||||
| NET INCOME (LOSS) AVAILABLE TO COMMON SHAREHOLDERS |
$ | 28.4 | $ | 26.8 | 6 | % | ||||||
|
|
|
|
|
|||||||||
19
Table of Contents
Net Revenues
The increase in net revenues was primarily attributable to the net revenues from the Lincoln Acquisition and Bonneville Exchange. Excluding the net revenues from these new radio stations and the divested station, net revenues were up in the low single digits. Also, last year benefited from the influx of political advertising.
Excluding the benefit of the net revenues associated with the new stations, net revenues increased the most for our stations in the Boston and Kansas City markets, offset by revenue decreases for our stations located in the Denver market (includes the impact of a station we exchanged with Bonneville) and the New Orleans market.
Station Operating Expenses
The increase in station operating expenses was primarily attributable to the Lincoln Acquisition and the Bonneville Exchange. Excluding the station operating expenses from these new radio stations and the divested station, station operating expenses were up in the low single digits primarily due to a correlating increase in the variable expenses associated with the increase in net revenues which was also in the low single digits. Station operating expenses also increased for the current year due to the continuing investment and development within our markets of digital product offerings.
Depreciation And Amortization Expense
Depreciation and amortization expense increased in 2015 primarily due to the acquisition of assets included in the Lincoln Acquisition.
Corporate General And Administrative Expenses
Corporate general and administrative expenses were essentially flat for the current year.
Operating Income
Operating income was essentially flat. Operating income in 2015 benefited from: (1) an increase in net revenues, net of station operating expenses, of $3.1 million, that included the operation of the new stations and the disposition of one station; and (2) an increase in gains on the sale or disposal of assets of $2.0 million primarily related to the one station that was disposed to Bonneville. This increase was offset primarily due to an increase in 2015 of merger and acquisition costs and restructuring charges of $5.8 million related to the acquisition and integration of the new stations.
Interest Expense
The decrease in interest expense was primarily due to the lower outstanding debt upon which interest is computed for at least half of the year, offset by the increase in interest expense on the borrowing of $42.0 million under the revolving credit facility needed to partially fund closing on the Lincoln Acquisition as our variable interest rates remained flat for most of the year.
The weighted average variable interest rate as of December 31, 2015 and 2014 was 4.1% and 4.0%, respectively.
Income Before Income Taxes
The increase was largely attributable to the $0.9 million decrease in interest expense as operating income was essentially flat.
Income Taxes
The effective income tax rate was 38.7%, which was impacted by an adjustment for expenses that are not deductible for tax purposes and an increase in net deferred tax liabilities associated with non-amortizable assets such as broadcasting licenses and goodwill. Our income tax rate has been trending down as expenses not deductible for tax purposes have decreased due to the issuance to senior management of a higher percentage of awards that were market based. Effective with the Lincoln Acquisition and the Bonneville Exchange, the estimated annual income tax rate increased due to the impact of acquisitions on our state income apportionments to states with higher income tax rates. This increase was offset by a discrete state income tax credit due to recent legislation that allowed for the release of a partial valuation allowance in a certain single member state.
20
Table of Contents
The effective income tax rate was 42.6% for 2014, which was higher than expected due to an adjustment for expenses that are not deductible for tax purposes and net deferred tax liabilities associated with non-amortizable assets such as broadcasting licenses and goodwill. During this period, we received a discrete tax benefit from legislatively reduced income tax rates in certain states.
Estimated Income Tax Rate For 2016
We estimate that our 2016 annual tax rate before discrete items, which may fluctuate from quarter to quarter, will be about 40%. We anticipate that our rate in 2016 could be affected primarily by: (1) changes in the level of income in any of our taxing jurisdictions; (2) adding facilities in states that on average have different income tax rates from states in which we currently operate and the resulting effect on previously reported temporary differences between the tax and financial reporting bases of our assets and liabilities; (3) the effect of recording changes in our liabilities for uncertain tax positions; (4) taxes in certain states that are dependent on factors other than taxable income; (5) the limitations on the deduction of cash and certain non-cash compensation expense for certain key employees; and (6) any tax benefit shortfall associated with share-based awards. Our annual effective tax rate may also be materially impacted by: (i) tax expense associated with non-amortizable assets such as broadcasting licenses and goodwill; (ii) regulatory changes in certain states in which we operate; (iii) changes in the expected outcome of tax audits; (iv) changes in the estimate of expenses that are not deductible for tax purposes; and (v) changes in the deferred tax valuation allowance.
In the event we determine at a future time that it is more likely than not that we will not realize our net deferred tax assets, we will increase our deferred tax asset valuation allowance and increase income tax expense in the period when we make such a determination.
Net Deferred Tax Liabilities
As of December 31, 2015 and 2014, our total net deferred tax liabilities were $78.2 million and $61.2 million, respectively. Our net deferred tax liabilities primarily relate to differences between book and tax bases of certain of our indefinite-lived intangibles (broadcasting licenses and goodwill). Under accounting guidance, we do not amortize our indefinite-lived intangibles for financial statement purposes, but instead test them annually for impairment. The amortization of our indefinite-lived assets for tax purposes but not for book purposes creates deferred tax liabilities. A reversal of deferred tax liabilities may occur when indefinite-lived intangibles: (1) become impaired; or (2) are sold, which would typically only occur in connection with the sale of the assets of a station or groups of stations or the entire company in a taxable transaction. Due to the amortization for tax purposes and not book purposes of our indefinite-lived intangible assets, we expect to continue to generate deferred tax liabilities in future periods (without consideration for any impairment loss in future periods).
Net Income Available To The Company
The net change in net income available to the Company was primarily attributable to the reasons described above under Income Before Income Taxes and Income Taxes.
Results Of Operations
The year 2014 as compared to the year 2013
The following significant factors affected our results of operations for 2014 as compared to the prior year:
During 2014, we incurred merger and acquisition costs of $1.0 million related to our Lincoln transaction.
During the third quarter of 2014, we settled a legal claim for $1.0 million. This amount was included in corporate general and administrative expenses.
During the fourth quarter of 2013, our Term B Loan was modified, reducing interest rates on outstanding debt upon which interest is computed thereby lowering our interest expense in 2014 as compared to 2013.
During the second quarter of 2013, we recorded a non-cash gain of $1.6 million on the sale of certain towers under sale and leaseback accounting.
21
Table of Contents
| YEARS ENDED DECEMBER 31, | ||||||||||||
| 2014 | 2013 | % Change | ||||||||||
| (dollars in millions) | ||||||||||||
| NET REVENUES |
$ | 379.8 | $ | 377.6 | 1 | % | ||||||
|
|
|
|
|
|||||||||
| OPERATING EXPENSE: |
||||||||||||
| Station operating expenses |
259.2 | 252.6 | 3 | % | ||||||||
| Depreciation and amortization expense |
7.8 | 8.5 | (8 | %) | ||||||||
| Corporate general and administrative expenses |
26.6 | 24.4 | 9 | % | ||||||||
| Impairment loss |
— | 0.9 | (100 | %) | ||||||||
| Merger and acquisition costs and restructuring charges |
1.0 | — | nmf | |||||||||
| Other operating (income) expenses |
(0.4 | ) | (1.3 | ) | 69 | % | ||||||
|
|
|
|
|
|||||||||
| Total operating expense |
294.2 | 285.1 | 3 | % | ||||||||
|
|
|
|
|
|||||||||
| OPERATING INCOME (LOSS) |
85.6 | 92.5 | (7 | %) | ||||||||
|
|
|
|
|
|||||||||
| OTHER (INCOME) EXPENSE: |
||||||||||||
| Net interest expense |
38.8 | 44.2 | (12 | %) | ||||||||
| Other expense (income) |
— | (0.1 | ) | 100 | % | |||||||
|
|
|
|
|
|||||||||
| TOTAL OTHER EXPENSE |
38.8 | 44.1 | (12 | %) | ||||||||
|
|
|
|
|
|||||||||
| INCOME (LOSS) BEFORE INCOME TAXES (BENEFIT) |
46.8 | 48.4 | (3 | %) | ||||||||
| INCOME TAXES (BENEFIT) |
20.0 | 22.4 | (11 | %) | ||||||||
|
|
|
|
|
|||||||||
| NET INCOME (LOSS) AVAILABLE TO THE COMPANY |
26.8 | 26.0 | 3 | % | ||||||||
| Preferred stock dividend |
— | — | nmf | |||||||||
|
|
|
|
|
|||||||||
| NET INCOME (LOSS) AVAILABLE TO COMMON SHAREHOLDERS |
$ | 26.8 | $ | 26.0 | 3 | % | ||||||
|
|
|
|
|
|||||||||
Net Revenues
Our net revenues increased marginally in 2014 as compared to the prior year. Advertising revenues accelerated during the second half of 2014 as compared to the first half of 2014. In 2014, net revenues benefited from the influx of advertising from political candidates and groups primarily due to certain state and federal elections during that period. This was offset by the absence this year of the Boston Red Sox from the playoffs, as we were not able to generate post-season advertising from the broadcast of the Red Sox games. Advertising demand continues to fluctuate and reflects the uneven performance of the general economy.
Net revenues increased the most for our stations in the Kansas City and San Francisco markets, offset by revenue decreases for our stations located in the Boston and Portland markets. A factor contributing to the decline in our Boston market is described above.
Station Operating Expenses
Station operating expenses increased for the current year primarily due to the commencement and integration of a digital marketing initiative.
This increase in station operating expenses during the year was partially offset by: (1) the absence this year of the Boston Red Sox from the playoffs as we did not incur variable station operating expenses associated with post-season advertising from the broadcast of the Red Sox games; and (2) the termination of the Celtics radio sports contract after last year’s season.
Depreciation And Amortization Expense
Depreciation and amortization expense decreased in 2014 primarily due to a trend of lower capital expenditure requirements over the past several years, offset by higher capital expenditures in the current year.
22
Table of Contents
Corporate General And Administrative Expenses
Corporate general and administrative expenses increased primarily due to: (1) the settlement during the third quarter of 2014 of a $1.0 million legal claim; and (2) an increase in non-cash compensation expense of $1.0 million.
Operating Income
Operating income decreased primarily due to: (1) a $6.6 million increase in station operating expenses; (2) a $2.2 increase in corporate general and administrative expenses; and (3) a $1.0 million increase in merger and acquisition costs associated with the Lincoln transaction. The decrease was offset by an increase of $2.2 million in net revenues.
Interest Expense
The decrease in interest expense was primarily due to: (1) lower outstanding debt upon which interest is computed; and (2) lower interest rates as a result of the December 2013 modification to the Credit Facility.
The weighted average variable interest rate as of December 31, 2014 and 2013 was 4.0%.
Income Before Income Taxes
The decrease was primarily attributable to the decrease in operating income, offset by a decrease in interest expense.
Income Taxes
The effective income tax rate was 42.6% for 2014. This rate was impacted by expenses that are not deductible for tax purposes and net deferred tax liabilities associated with non-amortizable assets such as broadcasting licenses and goodwill. During this period, we received a discrete tax benefit from legislatively reduced income tax rates in certain states.
The effective income tax rate was 46.3% for 2013 which was higher than expected due to an adjustment for expenses that are not deductible for tax purposes, an increase in net deferred tax liabilities associated with non-amortizable assets such as broadcasting licenses and goodwill and discrete items arising during the period such as tax benefit shortfalls associated with share-based awards.
Net Income Available To The Company
The increase was primarily due to a decrease in the effective income tax rate.
Future Impairments
We may determine that it will be necessary to take impairment charges in future periods if we determine the carrying value of our intangible assets is more than the fair value .Our annual impairment test of our broadcasting licenses and goodwill was performed in the second quarter of 2015. We may be required to retest prior to our next annual evaluation, which could result in a material impairment. As of December 31, 2015, no interim impairment test was required for our broadcasting licenses and goodwill.
Liquidity And Capital Resources
Liquidity
Over the past several years, we have used a significant portion of our cash flow to reduce our indebtedness. Generally, our cash requirements are funded from one or a combination of internally generated cash flow, cash on hand and borrowings under our Revolver. In 2015, we consummated the acquisition of the Lincoln Acquisition (as described below), which required the payment of $77.5 million in cash (plus working capital of $8.3 million, which was net of a $2.7 million credit) along with the issuance of $27.5 million of Preferred. To complete the cash portion of the Lincoln Acquisition, we used $35.5 million of the cash on hand together with $42.0 million in borrowing under the Revolver. For the year ended December 31, 2015, we increased outstanding debt under our Credit Facility by $6.8 million and decreased our cash on hand by $22.4 million.
23
Table of Contents
We may also use our capital resources to repurchase shares of our Class A common stock, to pay dividends to our shareholders and to purchase radio station assets. We may from time to time seek to repurchase and retire our outstanding debt through open market purchases, privately negotiated transactions or otherwise. Such repurchases, if any, will depend on prevailing market conditions, our liquidity requirements, contractual restrictions and other factors. The amounts involved may be material. We could also use our capital resources to repurchase the Preferred from time to time.
As of December 31, 2015, we had $268.8 million outstanding under our Credit Facility, which includes an outstanding Term B Loan of $242.8 million and an outstanding Revolver of $26.0 million. In addition, we had outstanding $220.0 million in principal for our Senior Notes and $0.7 million in outstanding letters of credit. As of December 31, 2015, we had $9.2 million in cash and cash equivalents.
The Credit Facility
On November 23, 2011, we entered into a credit agreement with a syndicate of lenders for a $425 million Credit Facility, which was initially comprised of: (a) a $50 million Revolver that matures on November 23, 2016; and (b) a $375 million Term B Loan that matures on November 23, 2018. The Term B Loan amortizes in quarterly installments of $0.8 million and any remaining principal and interest is due at maturity (except for certain mandatory principal prepayments of Excess Cash Flow and other events as described below).
In December 2015, we reduced the total Revolver capacity from $50 million to $40 million. The undrawn amount of the Revolver was $13.3 million as of December 31, 2015. The outstanding Revolver is reflected as current debt as of December 31, 2015 as it matures in less than one year. We expect to use funds from our operations to retire the Revolver. In the past, we have not utilized the Revolver to fund operations. The outstanding balance of the Revolver was primarily used to partially fund the Lincoln acquisition. We cannot determine if and when a new revolving credit line would be entered into to replace the Revolver as market conditions may impact the timing and our performance may impact the pricing.
The Term B Loan requires: (1) mandatory prepayments equal to 50% of Excess Cash Flow, as defined within the agreement, subject to incremental step-downs depending on the Consolidated Leverage Ratio; and (2) mandatory prepayments from certain events such as the sale of certain property or the issuance of debt. Under the Term B Loan, the Excess Cash Flow payment is due in the first quarter of each year based on the Excess Cash Flow and Leverage Ratio for the prior year. An estimate of this payment that is due next year, net of any prepayments made through December 31, 2015, is included under the current portion of long-term debt. We expect to fund the payments using cash from operating activities.
As of December 31, 2015, we are in compliance with all financial covenants and all other terms of the Credit Facility in all material respects. Our ability to maintain compliance with our covenants will be highly dependent on our results of operations. A default under our Credit Facility or the indenture governing our Senior Notes could cause a cross default in the other. Any event of default could have a material adverse effect on our business and financial condition.
We believe that over the next 12 months we can continue to maintain our compliance with these covenants. Our operating cash flow remains positive, and we believe that it is adequate to fund our operating needs. We believe that cash on hand and cash from operating activities will be sufficient to permit us to meet our liquidity requirements over the next 12 months, including our debt repayments.
Failure to comply with our financial covenants or other terms of our Credit Facility and any subsequent failure to negotiate and obtain any required relief from our lenders could result in the acceleration of the maturity of all outstanding debt. Under these circumstances, the acceleration of our debt could have a material adverse effect on our business. We may seek from time to time to amend our Credit Facility or obtain other funding or additional financing, which may result in higher interest rates.
24
Table of Contents
The Credit Facility requires us to maintain compliance with certain financial covenants which are defined terms within the agreement, including:
| • | a maximum Consolidated Leverage Ratio that cannot exceed 4.75 times at December 31, 2015, and which decreases to 4.5 times at March 31, 2016 and thereafter; and |
| • | a minimum Consolidated Interest Coverage Ratio of 2.00 times at December 31, 2015, and thereafter. |
As of December 31, 2015, our Consolidated Leverage Ratio was 4.4 times and our Consolidated Interest Coverage Ratio was 3.1 times.
Under the Term Loan and depending on the Consolidated Leverage Ratio, we may elect an interest rate per annum equal to: (1) LIBOR plus fees of 3.0%; and (2) the Base Rate plus fees of 2.0%. The Term Loan includes a LIBOR floor of 1.0%. The interest rates were reduced in 2012 and 2013 under two Term B Loan amendments.
The Credit Facility is secured by a pledge of 100% of the capital stock and other equity interest in all of our wholly owned subsidiaries. In addition, the Credit Facility is secured by a lien on substantially all of our assets, with limited exclusions (including our real property). The assets securing the Credit Facility are subject to customary release provisions which would enable us to sell such assets free and clear of encumbrance, subject to certain conditions and exceptions.
Senior Notes
The Senior Notes may be redeemed at any time on or after December 1, 2015 at a redemption price of 105.25% of the principal amount plus accrued interest. The redemption price decreases to 102.625% of their principal amount plus accrued interest on or after December 1, 2016 and 100% on or after December 1, 2017.
Simultaneously with entering into the Credit Facility, on November 23, 2011 we issued 10.5% unsecured senior notes, or the Senior Notes, which mature on December 1, 2019 in the amount of $220.0 million. We received net proceeds of $212.7 million, which includes a discount of $2.9 million and deferred financing costs of $6.1 million, which will be amortized over the term under the effective interest rate method.
Interest on the Senior Notes accrues at the rate of 10.5% per annum and is payable semi-annually in arrears on June 1 and December 1 of each year. The Senior Notes are unsecured and rank: (1) senior in right of payment to our future subordinated debt; (2) equally in right of payment with all of our existing and future senior debt; (3) effectively subordinated to our existing and future secured debt (including the debt under our Credit Facility), to the extent of the value of the collateral securing such debt; and (4) structurally subordinated to all of the liabilities of our subsidiaries that do not guarantee the Senior Notes, to the extent of the assets of those subsidiaries.
In addition to the parent, Entercom Communications Corp., all of the Company’s existing subsidiaries (other than Entercom Radio, LLC, which is a finance subsidiary and is the issuer of the Senior Notes), jointly and severally guaranteed the Senior Notes. Under certain covenants, our subsidiary guarantors are restricted from paying dividends or distributions in excess of amounts defined under the Senior Notes, and the subsidiary guarantors are limited in their ability to incur additional indebtedness under certain restrictive covenants.
A default under our Senior Notes could cause a default under our Credit Facility. Any event of default could have a material adverse effect on our business and financial condition.
Perpetual Cumulative Convertible Preferred Stock
During the second quarter of 2015, we issued $27.5 million of Preferred in connection with the Lincoln Acquisition.
The Preferred ranks senior to common stock in our capital structure. The payment of dividends on the Preferred and the repayment of the liquidation preference of the preferred stock rank senior to any dividends or other payments to our common shareholders. The Preferred is convertible by Lincoln into a fixed number of shares after a three-year waiting period. At certain times (including the first three years after issuance), we could redeem the Preferred in cash. The dividend rate on the Preferred increases over time from 6% to 12%.
25
Table of Contents
Repurchases
We may from time to time seek to repurchase and retire our outstanding debt through cash purchases, open market purchases, privately negotiated transactions or otherwise. Such repurchases, if any, will depend on prevailing market conditions, our liquidity requirements, contractual restrictions and other factors. The amounts involved may be material.
Operating Activities
Net cash flows provided by operating activities were $64.8 million and $65.3 million for 2015 and 2014, respectively. The cash flows from operating activities decreased primarily due to the cash requirements to fund the increase of $5.8 million in merger and acquisitions costs and restructuring charges associated primarily associated with the Lincoln Acquisition. This decrease in cash flows from operating activities was offset by a $3.1 million increase in operating income primarily due to net revenues, net of station operating expenses, from the Lincoln Acquisition and Bonneville Exchange.
Net cash flows provided by operating activities were $65.3 million and $63.3 million for 2014 and 2013, respectively. The cash flows increased primarily due to: (1) a $5.4 million decrease in interest expense as a result of a decline in the outstanding debt upon which interest is computed and a decline in the average interest rate used to compute interest on outstanding debt; and (2) a decrease in working capital requirements of $3.6 million. This increase in cash flows from operating activities was offset by a $7.0 million decrease in operating income primarily due to the increase in station operating expenses of $6.6 million.
Investing Activities
For 2015, net cash flows used in investing activities were $91.7 million, which primarily reflected the purchase of radio station assets of $83.6 million (excluding the issuance of the Preferred and cash acquired from Lincoln). For 2014 and 2013, net cash flows used in investing activities were $7.1 million and $4.6 million, respectively, which primarily reflected the additions to property and equipment of $8.4 million and $4.3 million, respectively.
Financing Activities
For 2015, net cash flows provided by financing activities were $4.6 million and for 2014 and 2013, net cash flows used in financing activities were, $38.9 million and $55.5 million, respectively.
For 2015, net cash flows provided by financing activities primarily reflect the use of the Revolver of $42.0 million to fund a portion of the cash requirements necessary to complete the Lincoln Acquisition, offset by the reduction of our net borrowings of $51.3 million. For 2014 and 2013, the cash flows used in financing activities primarily reflected the net repayment of debt of $37.5 million and $53.0 million, respectively.
Income Taxes
During 2015, 2014 and 2013, we paid a nominal amount in income taxes (state income taxes) as we have benefited from the tax deductions available on acquired assets, which are primarily intangible assets such as broadcasting licenses and goodwill. For 2015, we estimate that we will have a minimal amount of taxable income before the utilization of net operating loss carryforwards (“NOLs”). In addition, we accrued a $0.1 million Alternative Minimum Tax (“AMT”) associated with expected income subject to tax for 2015, before the offset of available net operating loss carryforwards. The AMT is available to be carried forward indefinitely to be used as a credit to offset future income tax liabilities.
We anticipate that it will not be necessary to make any additional quarterly estimated federal, and most state, income tax payments for 2016, based upon projected quarterly taxable income and our ability to utilize federal NOLs of $293 million and significant state NOLs.
Dividends
We do not currently pay, and have not paid for the past several years, any dividends on our common stock. Any future dividends will be at the discretion of the Board of Directors based upon the relevant factors at the time of such consideration, including, without limitation, compliance with the restrictions set forth in our Credit Facility, the indenture governing in the Senior Notes and our Preferred. The payment of dividends on the Preferred and the repayment of the liquidation preference of the Preferred will take preference over any dividends or other payments to our common stockholders. A quarterly dividend on our Preferred of $0.4 million was declared and paid in October 2015 and January 2016.
26
Table of Contents
See Liquidity under Part II, Item 7, “Management’s Discussion And Analysis Of Financial Condition And Results Of Operations,” and Note 8 in the accompanying notes to the consolidated financial statements.
Share Repurchase Programs
Any share repurchase program is subject to the approval of our Board of Directors. Such approval would be dependent on many factors, including but not limited to, market conditions and restrictions under our Credit Facility and the indenture governing our Senior Notes. New share repurchase programs could be commenced at any time without prior notice.
Capital Expenditures
Capital expenditures for 2015, 2014 and 2013 were $7.0 million, $8.4 million and $4.3 million, respectively. We anticipate that capital expenditures in 2016 will be between $8.0 million and $10.0 million.
Credit Rating Agencies
On a continuing basis, Standard and Poor’s, Moody’s Investor Services and other rating agencies may evaluate our debt in order to assign a credit rating. Any significant downgrade in our credit rating could adversely impact our future liquidity by limiting or eliminating our ability to obtain debt financing.
Contractual Obligations
The following table reflects a summary of our contractual obligations as of December 31, 2015:
| Payments Due By Period | ||||||||||||||||||||
| Contractual Obligations: |
Total | Less Than 1 Year |
1 To 3 Years |
3 To 5 Years |
More Than 5 Years |
|||||||||||||||
| Long-term debt obligations (1) |
$ | 607,816 | $ | 65,134 | $ | 302,020 | $ | 240,662 | $ | — | ||||||||||
| Operating lease obligations (2) |
114,184 | 18,008 | 33,482 | 24,702 | 37,992 | |||||||||||||||
| Purchase obligations (3) |
128,912 | 82,766 | 43,208 | 2,680 | 258 | |||||||||||||||
| Other long-term liabilities (4) |
109,251 | 1,524 | 2,816 | 3,080 | 101,831 | |||||||||||||||
|
|
|
|
|
|
|
|
|
|
|
|||||||||||
| Total |
$ | 960,163 | $ | 167,432 | $ | 381,526 | $ | 271,124 | $ | 140,081 | ||||||||||
|
|
|
|
|
|
|
|
|
|
|
|||||||||||
| (1) | The total amount reflected in the above table includes principal and interest. |
| (a) | Our Credit Facility had outstanding debt in the amount of $268.8 million as of December 31, 2015. The maturity under our Credit Facility could be accelerated if we do not maintain compliance with certain covenants. The principal maturities reflected exclude any impact from required principal payments based upon our future operating performance. The above table includes projected interest expense under the remaining term of our Credit Facility. |
| (b) | Under our Senior Notes, the maturity could be accelerated if we do not maintain certain covenants or could be repaid in cash by us at our option prior to maturity. The above table includes projected interest expense under the remaining term of the agreement. |
| (2) | Certain leases include contingent rents for common area maintenance. These amounts are included in minimum operating lease commitments when it is probable that the expense has been incurred and the amount is reasonably measurable. |
27
Table of Contents
| (3) | (a) | We have purchase obligations of $126.8 million including contracts primarily for on-air personalities, ratings services, sports programming rights, software and equipment maintenance and certain other operating contracts. |
| (b) | In addition to the above, we have $2.1 million in liabilities related to: (i) construction obligations of $1.4 million; and (ii) our obligation to provide $0.7 million in letters of credit. |
| (4) | Included within total other long-term liabilities of $109.3 million are deferred income tax liabilities of $81.6 million. It is impractical to determine whether there will be a cash impact to an individual year. Therefore, deferred income tax liabilities, together with liabilities for deferred compensation and uncertain tax positions (other than the amount of unrecognized tax benefits that are subject to the expiration of various statutes of limitation over the next 12 months) are reflected in the above table in the column labeled as “More Than 5 Years.” See Note 14, Income Taxes, in the accompanying notes to the consolidated financial statements for a discussion of deferred tax liabilities, including liabilities for unrecognized tax positions. |
Off-Balance Sheet Arrangements
As of December 31, 2015 and as of the date this report was filed (other than as described below), we did not have any material off-balance sheet transactions, arrangements, or obligations, including contingent obligations.
Market Capitalization
As of December 31, 2015 and 2014, our total equity market capitalization was $445.6 million and $475.0 million, respectively, which was $84.1 million and $145.9 million higher, respectively, than our book equity value on those dates. As of December 31, 2015 and 2014, our stock price was $11.23 per share and $12.16 per share, respectively.
Intangibles
As of December 31, 2015, approximately 82% of our total assets consisted of radio broadcast licenses and goodwill, the value of which depends significantly upon the operational results of our business. We could not operate our radio stations without the related FCC license for each station. FCC licenses are subject to renewal every eight years. Consequently, we continually monitor the activities of our stations to ensure they comply with all regulatory requirements. See Part I, Item 1A, “Risk Factors,” for a discussion of the risks associated with the renewal of licenses.
Inflation
Inflation has affected our performance by increasing our radio station operating expenses in terms of higher costs for wages and multi-year vendor contracts with assumed inflationary built-in escalator clauses. The exact effects of inflation, however, cannot be reasonably determined. There can be no assurance that a high rate of inflation in the future would not have an adverse effect on our profits, especially since our Credit Facility is variable rate.
Recent Accounting Pronouncements
For a discussion of recently issued accounting standards, see Note 2 in the accompanying consolidated financial statements.
Lincoln Acquisition
On July 16, 2015, we completed our Lincoln Acquisition to acquire the assets and liabilities of radio stations serving the Atlanta, Denver, Miami and San Diego markets. The purchase price was $105.0 million of which $77.5 million was paid in cash and $27.5 million was paid with our issuance of new Preferred. The stock purchase agreement, originally dated December 7, 2014 and subsequently amended on July 10, 2015, provided for a step-up in basis for tax purposes. The working capital acquired was $8.3 million, which was net of a working capital credit. Merger and acquisition related costs of $4.0 million and restructuring charges of $2.8 million were expensed together as a separate line item in the statement of operations for 2015. We used the proceeds from borrowings under our Revolver of $42.0 million and cash on hand to fund the cash portion of the purchase price.
28
Table of Contents
Bonneville Exchange
On November 24, 2015, we completed the Bonneville Exchange that was entered into on July 10, 2015 to trade four radio stations in Denver for a Los Angeles station and additional consideration. On July 17, 2015, Bonneville commenced operation of certain Denver stations and on the same date we commenced operation of the Los Angeles radio station under two separate TBAs. During the period of the TBAs, we: (i) included net revenues and station operating expenses associated with our operation of the Los Angeles station in our consolidated financial statements; and (ii) excluded net revenues and station operating expenses associated with Bonneville’s operation of certain Denver stations in our consolidated financial statements. We received $0.3 million of monthly TBA income from Bonneville until the closing of the transaction.
Upon closing, we own: (1) one station in Los Angeles, a new market for us; and (2) continue to own and operate five radio stations in the Denver market.
Critical Accounting Policies
Our discussion and analysis of our financial condition and results of operations are based upon our consolidated financial statements, which have been prepared in accordance with accounting principles generally accepted in the United States. The preparation of these financial statements requires us to make estimates and assumptions that affect the reported amounts of assets and liabilities, and disclosure of contingent assets and liabilities as of the date of the financial statements, and the reported amounts of revenues and expenses during the reporting period. We base our estimates on historical experience and various other assumptions that we believe to be reasonable under the circumstances, the results of which form the basis for making judgments about the carrying values of assets and liabilities that are not readily available from other sources. Actual results may differ from these estimates under different circumstances or by using different assumptions.
We consider the following policies to be important in understanding the judgments involved in preparing our consolidated financial statements and the uncertainties that could affect our financial position, results of operations or cash flows:
Revenue Recognition
We generate revenue from the sale to advertisers of various services and products, including but not limited to: (1) commercial broadcast time; (2) digital advertising; (3) local events; (4) e-commerce where an advertiser’s goods and services are sold through our websites; and (5) integrated digital advertising solutions.
Revenue from services and products is recognized when delivered.
Advertiser payments received in advance of when the products or services are delivered are recorded on our balance sheet as unearned revenue.
Revenues presented in the consolidated financial statements are reflected on a net basis, after the deduction of advertising agency fees by the advertising agencies. We also evaluate when it is appropriate to recognize revenue based on the gross amount invoiced to the customer or the net amount retained by us if a third party is involved.
Allowance For Doubtful Accounts
We evaluate our allowance for doubtful accounts on an ongoing basis. We specifically review historical write-off activity by market, large customer concentrations, customer creditworthiness, the economic conditions of the customer’s industry, and changes in our customer payment practices when evaluating the adequacy of the allowance for doubtful accounts. Our historical estimates have been a reliable method to estimate future allowances.
29
Table of Contents
Contingencies And Litigation
On an ongoing basis, we evaluate our exposure related to contingencies and litigation and record a liability when available information indicates that a liability is probable and estimable. We also disclose significant matters that may reasonably result in a loss or are probable but not estimable.
Estimation Of Our Tax Rates
We must make certain estimates and judgments in determining income tax expense for financial statement purposes. These estimates and judgments must be used in the calculation of certain tax assets and liabilities because of differences in the timing of recognition of revenue and expense for tax and financial statement purposes. As changes occur in our assessments regarding our ability to recover our deferred tax assets, our tax provision is increased in any period in which we determine that the recovery is not probable.
We expect our effective tax rate, before discrete items, changes in the valuation allowance, the tax expense associated with non-amortizable assets and impairment losses, to be about 40%.
In 2015, our tax rate was 38.7%. The income tax rates in 2014 and 2013 of 42.6% and 46.3%, respectively, were higher primarily due to a tax benefit shortfall associated with share-based awards.
The calculation of our tax liabilities requires us to account for uncertainties in the application of complex tax regulations. We recognize liabilities for uncertain tax positions based on the two-step process prescribed within the interpretation of accounting for uncertain tax positions. The first step is to evaluate the tax position for recognition of a tax benefit by determining if the weight of available evidence indicates that it is more likely than not that the position will be sustained on audit based upon its technical merits, including resolution of related appeals or litigation processes, if any. The second step requires us to estimate and measure the tax benefit as the largest amount that has greater than a 50% likelihood of being realized upon ultimate settlement. It is inherently difficult and subjective to estimate such amounts, as this requires us to determine the probability of various possible outcomes. We evaluate these uncertain tax positions, and review whether any new uncertain tax positions have arisen, on a quarterly basis. This evaluation is based on factors including, but not limited to, changes in facts or circumstances, changes in tax law, effectively settled issues under audit, historical experience with similar tax matters, guidance from our tax advisors, and new audit activity. A change in recognition or measurement would result in the recognition of a tax benefit or an additional charge to the tax provision in the period in which the change occurs.
We believe our estimates of the value of our tax contingencies and valuation allowances are critical accounting estimates, as they contain assumptions based on past experiences and judgments about potential actions by taxing jurisdictions. It is reasonably likely that the ultimate resolution of these matters may be greater or less than the amount that we have currently accrued. The effect of a 1% increase in our estimated tax rate as of December 31, 2015 would be an increase in income tax expense of $0.5 million and a decrease in net income available to common shareholders of $0.5 million (net income available to common shareholders per basic and diluted share of $0.01) for 2015.
Radio Broadcasting Licenses And Goodwill
We have made acquisitions in the past for which a significant amount of the purchase price was allocated to broadcasting licenses and goodwill assets. As of December 31, 2015, we have recorded approximately $840 million in radio broadcasting licenses and goodwill, which represents 82% of our total assets at that date. We must conduct impairment testing at least annually, or more frequently if events or changes in circumstances indicate that the assets might be impaired, and charge to operations an impairment expense in the periods in which the recorded value of these assets is more than their fair value. Any such impairment could be material. After an impairment expense is recognized, the recorded value of these assets will be reduced by the amount of the impairment expense and that result will be the assets’ new accounting basis. Our most recent impairment loss to our broadcasting licenses and goodwill was in 2012.
We believe our estimate of the value of our radio broadcasting licenses and goodwill assets is an important accounting estimate as the value is significant in relation to our total assets, and our estimate of the value uses assumptions that incorporate variables based on past experiences and judgments about future performance of our stations.
30
Table of Contents
Broadcasting Licenses Impairment Test
We perform our broadcasting license impairment test by using the direct method at the market level. Each market’s broadcasting licenses are combined into a single unit of accounting for the purpose of testing impairment, as the broadcasting licenses in each market are operated as a single asset. We determine the fair value of broadcasting licenses in each of our markets by relying on a discounted cash flow approach (a 10-year income model) assuming a start-up scenario in which the only assets held by an investor are broadcasting licenses. Our fair value analysis contains assumptions based upon past experience, reflects expectations of industry observers and includes judgments about future performance using industry normalized information for an average station within a certain market. These assumptions include, but are not limited to: (1) the discount rate; (2) the market share and profit margin of an average station within a market based upon market size and station type; (3) the forecast growth rate of each radio market; (4) the estimated capital start-up costs and losses incurred during the early years; (5) the likely media competition within the market area; (6) the tax rate; and (7) future terminal values. Changes in our estimates of the fair value of these assets could result in material future period write-downs in the carrying value of our broadcasting licenses and goodwill assets.
The methodology used by us in determining our key estimates and assumptions was applied consistently to each market. Of the seven variables identified above, we believe that the assumptions in items (1) through (3) above are the most important and sensitive in the determination of fair value.
We most recently completed our annual impairment test for broadcasting licenses during the second quarter of 2015 and determined that the fair value of the broadcasting licenses was more than the carrying value in each of our markets and, as a result, we did not record an impairment loss.
The following table reflects the estimates and assumptions used in the second quarter of 2015 as compared to the second quarter of 2014, the date of the most recent prior impairment test:
| Estimates And Assumptions | ||||
| Second | Second | |||
| Quarter | Quarter | |||
| 2015 | 2014 | |||
| Discount rate |
9.7% | 9.6% | ||
| Operating profit margin ranges expected for average stations in the markets where the Company operates |
25% to 40% | 25% to 40% | ||
| Long-term revenue growth rate range of the Company’s markets |
1.5% to 2.0% | 1.5% to 2.0% | ||
While we believe we have made reasonable estimates and assumptions to calculate the fair value of our broadcasting licenses, these estimates and assumptions could be materially different from actual results.
If actual market conditions are less favorable than those projected by the industry or by us, or if events occur or circumstances change that would reduce the fair value of our broadcasting licenses below the amount reflected on the balance sheet, we may be required to recognize impairment charges, which could be material, in future periods.
The table below presents the percentage within a range by which the fair value exceeded the carrying value of our radio broadcasting licenses as of December 31, 2015 for 20 units of accounting (20 geographical markets) where the carrying value of the licenses is considered material to our financial statements. We excluded four new markets from testing as these markets were added through acquisitions during the second half of 2015. Rather than presenting the percentage separately for each unit of accounting, management’s opinion is that this table in summary form is more meaningful to the reader in assessing the recoverability of the broadcasting licenses. In addition, the units of accounting are not disclosed with the specific market name as such disclosure could be competitively harmful to us.
31
Table of Contents
| Units Of Accounting As Of December 31, 2015 | ||||||||||||||||
| Based Upon The Valuation As Of June 30, 2015 | ||||||||||||||||
| Percentage Range By Which Fair Value Exceeds | ||||||||||||||||
| The Carrying Value | ||||||||||||||||
| Greater | Greater | Greater | ||||||||||||||
| 0% To | Than 5% | Than 10% | Than | |||||||||||||
| 5% | To 10% | To 15% | 15% | |||||||||||||
| Number of units of accounting |
4 | 4 | — | 12 | ||||||||||||
| Carrying value (in thousands) |
$ | 220,224 | $ | 243,392 | $ | — | $ | 253,568 | ||||||||
Broadcasting Licenses Valuation At Risk
The second quarter 2015 impairment test of our broadcasting licenses indicated that there were eight units of accounting where the fair value exceeded their carrying value by 10% or less. In aggregate, these eight units of accounting have a carrying value of $463.6 million. If overall market conditions or the performance of the economy deteriorates, advertising expenditures and radio industry results could be negatively impacted, including expectations for future growth. This could result in future impairment charges for these or other of our units of accounting.
Goodwill Impairment Test
We perform our annual goodwill impairment test during the second quarter of each year by evaluating our goodwill for each reporting unit. We determined that a radio market is a reporting unit and, in total, we assessed goodwill at 19 separate reporting units. In determining the reporting units to evaluate, we excluded: (1) four reporting units that had no goodwill; and (2) four reporting units from 2015 acquisitions.
If the fair value of any reporting unit is less than the amount reflected in the balance sheet, an indication exists that the amount of goodwill attributed to a reporting unit may be impaired, and we are required to perform a second step of the impairment test. In the second step, we compare the amount reflected in the balance sheet to the implied fair value of the reporting unit’s goodwill, determined by allocating the reporting unit’s fair value to all of its assets and liabilities in a manner similar to a purchase price allocation.
To determine the fair value, we use a market approach and, when appropriate, an income approach in computing the fair value for each reporting unit. The market approach calculates the fair value of each market’s radio stations by analyzing recent sales of similar properties expressed as a multiple of cash flow. The income approach utilizes a discounted cash flow method by projecting the subject property’s income over a specified time and capitalizing at an appropriate market rate to arrive at an indication of the most probable selling price.
In step one of our goodwill analysis, we considered the results of the market approach and, where appropriate, the income approach in computing the fair value of our reporting units. In the market approach, we applied an estimated market multiple of between seven and a half times and eight times to each reporting unit’s operating performance to calculate the fair value. This multiple was consistent with the multiple applied to all markets in the prior year. Management believes that these approaches are an appropriate measurement given the current market valuations of broadcast radio stations together with historical market transactions, including those in recent months. Factors contributing to the determination of the reporting unit’s operating performance were historical performance and management’s estimates of future performance.
32
Table of Contents
The following table reflects certain key estimates and assumptions applied to each of our markets that were used in the second quarter of 2015 and in the second quarter of 2014, the date of the most recent prior impairment test:
| Estimates And Assumptions | ||||
| Second | Second | |||
| Quarter | Quarter | |||
| 2015 | 2014 | |||
| Discount rate |
9.7% | 9.6% | ||
| Long-term revenue growth rate range of the Company’s markets |
1.5% to 2.0% | 1.5% to 2.0% | ||
| Market multiple used in the market valuation approach |
7.5x to 8.0x | 7.5x to 8.0x | ||
While we believe we have made reasonable estimates and assumptions to calculate the fair value of our goodwill, these estimates and assumptions could be materially different from actual results.
The results of step one indicated that it was not necessary to perform the second step analysis in any of the markets tested. As a result of the step one test, no impairment loss was recorded during the second quarter of 2015. We performed a reasonableness test by comparing the fair value results for goodwill (by using the implied multiple based on our cash flow performance and our current stock price) to prevailing radio broadcast transaction multiples.
If actual market conditions are less favorable than those projected by the industry or us, or if events occur or circumstances change that would reduce the fair value of our goodwill below the amount reflected in the balance sheet, we may be required to conduct an interim test and possibly recognize impairment charges, which could be material, in future periods.
The table below presents the percentage within a range by which the fair value exceeded the carrying value of the reporting unit as of December 31, 2015 for 19 reporting units that were tested for goodwill impairment under step one during the second quarter of 2015. Rather than presenting the percentage separately for each reporting unit, management’s opinion is that this table in summary form is more meaningful to the reader in assessing the recoverability of the reporting unit, including goodwill. In addition, the reporting units are not disclosed with the specific market name as such disclosure could be competitively harmful to us.
| Reporting Units As Of December 31, 2015 | ||||||||||||||||
| Based Upon The Valuation As Of June 30, 2015 | ||||||||||||||||
| Percentage Range By Which Fair Value Exceeds Carrying Value | ||||||||||||||||
| Greater | Greater | Greater | ||||||||||||||
| 0% To | Than 5% | Than 10% | Than | |||||||||||||
| 5% | To 10% | To 15% | 15% | |||||||||||||
| Number of reporting units |
2 | 3 | 1 | 13 | ||||||||||||
| Carrying value (in thousands) |
$ | 175,379 | $ | 189,118 | $ | 8,968 | $ | 383,740 | ||||||||
Goodwill Valuation At Risk
The second quarter 2015 impairment test of our goodwill indicated that there were five reporting units that exceeded the carrying value by 10% or less. In aggregate, these three reporting units have a carrying value of $364.5 million, of which $10.8 million is goodwill. Future impairment charges may be required on these, or other of our reporting units, as the discounted cash flow and market-based models are subject to change based upon our performance, our stock price, peer company performance and their stock prices, overall market conditions, and the state of the credit markets.
33
Table of Contents
Sensitivity Of Key Broadcasting Licenses And Goodwill Assumptions
If we were to assume a 100 basis point change in certain of our key assumptions (a reduction in the long-term revenue growth rate, a reduction in the operating performance cash flow margin and an increase in the weighted average cost of capital) used to determine the fair value of our broadcasting licenses and goodwill using the income approach during the second quarter of 2015, the following would be the incremental impact:
| Sensitivity Analysis (1) |
||||||||||||
| Results Of | Results Of | Results Of | ||||||||||
| Long-Term | Operating | Weighted | ||||||||||
| Revenue | Performance | Average | ||||||||||
| Growth | Cash Flow | Cost Of | ||||||||||
| Rate | Margin | Capital | ||||||||||
| Decrease | Decrease | Increase | ||||||||||
| (amounts in thousands) | ||||||||||||
| Broadcasting Licenses |
||||||||||||
| Incremental broadcasting licenses impairment |
$ | 18,929 | $ | 4,631 | $ | 46,718 | ||||||
|
|
|
|
|
|
|
|||||||
| Goodwill (2) |
||||||||||||
| Incremental goodwill impairment |
$ | 4,246 | $ | — | $ | 20,081 | ||||||
|
|
|
|
|
|
|
|||||||
| (1) | Each assumption used in the sensitivity analysis is independent of the other assumptions. |
| (2) | The sensitivity goodwill analysis is computed using data from testing goodwill using the income approach under step 1. |
To determine the radio broadcasting industry’s future revenue growth rate, management uses publicly available information on industry expectations rather than management’s own estimates, which could be different. In addition, these long-term market growth rate estimates could vary in each of our markets. Using the publicly available information on industry expectations, each market’s revenues were forecasted over a ten-year projection period to reflect the expected long-term growth rate for the radio broadcast industry, which was further adjusted for each of our markets. If the industry’s growth is less than forecasted, then the fair value of our broadcasting licenses could be negatively impacted.
Operating profit is defined as profit before interest, depreciation and amortization, income tax and corporate allocation charges. Operating profit is then divided by broadcast revenues, net of agency and national representative commissions, to compute the operating profit margin. For the broadcast license fair value analysis, the projections of operating profit margin that are used are based upon industry operating profit norms, which reflect market size and station type. These margin projections are not specific to the performance of our radio stations in a market, but are predicated on the expectation that a new entrant into the market could reasonably be expected to perform at a level similar to a typical competitor. For the goodwill fair value analysis, the projections of operating margin for each market are based on our actual historical performance. If the outlook for the radio industry’s growth declines, then operating profit margins in both the broadcasting license and goodwill fair value analyses would be negatively impacted, which would decrease the value of those assets.
The discount rate to be used by a typical market participant reflects the risk inherent in future cash flows for the broadcast industry. The same discount rate was used for each of our markets. The discount rate is calculated by weighting the required returns on interest-bearing debt and common equity capital in proportion to their estimated percentages in an expected capital structure. The capital structure was estimated based upon data available for publicly traded companies in the broadcast industry.
See Note 4, Intangible Assets And Goodwill, in the accompanying notes to the consolidated financial statements, for a discussion of intangible assets and goodwill.
For a more comprehensive list of our accounting policies, see Note 2, Significant Accounting Policies, accompanying the consolidated financial statements included within this annual report on Form 10-K for 2015. Note 2 to the consolidated financial statements included with Form 10-K contains several other policies, including policies governing the timing of revenue recognition, that are important to the preparation of our consolidated financial statements, but do not meet the SEC’s definition of critical accounting policies because they do not involve subjective or complex judgments. In addition, for further discussion of new accounting policies that were effective for us on January 1, 2015, see the new accounting standards under Note 2 to the accompanying notes to the consolidated financial statements.
34
Table of Contents
| ITEM 7A. | QUANTITATIVE AND QUALITATIVE DISCLOSURES ABOUT MARKET RISK |
We are exposed to market risk from changes in interest rates on our variable rate senior debt (the Term B Loan and Revolver). If the borrowing rates under LIBOR were to increase 1% above the current rates as of December 31, 2015, our interest expense on: (1) our Term B Loan would increase $1.0 million on an annual basis as our Term B Loan provides for a minimum LIBOR floor of 1%; and (2) our Revolver would increase by $0.4 million, assuming our entire Revolver was outstanding as of December 31, 2015. From time to time, we may seek to limit our exposure to interest rate volatility through the use of interest rate hedging instruments.
Assuming LIBOR remains flat, interest expense in 2016 is expected to be lower as we anticipate reducing our outstanding debt upon which interest is computed. Our Senior Notes can currently be redeemed at a price of 105.25%, which decreases over time. Any redemption would be subject to approval by our Board of Directors and our ability to obtain alternative sources of funds would be subject to market conditions. Such refinancing could increase our exposure to variable rate debt.
As of December 31, 2015, there were no interest rate hedging transactions outstanding.
Our credit exposure under hedging agreements similar to the agreements that we have entered into in the past, or similar agreements that we may enter into in the future, is the cost of replacing such agreements in the event of nonperformance by our counterparty. To minimize this risk, we select high credit quality counterparties. We do not anticipate nonperformance by such counterparties who we may enter into agreements with in the future, but we could recognize a loss in the event of nonperformance.
From time to time, we may invest all or a portion of our cash in cash equivalents, which are money market instruments consisting of short-term government securities and repurchase agreements that are fully collateralized by government securities. We do not believe that we have any material credit exposure with respect to these assets.
Our credit exposure related to our accounts receivable does not represent a significant concentration of credit risk due to the quantity of advertisers, the minimal reliance on any one advertiser, the multiple markets in which we operate and the wide variety of advertising business sectors.
See also additional disclosures regarding liquidity and capital resources made under Part II, Item 7, above.
| ITEM 8. | FINANCIAL STATEMENTS AND SUPPLEMENTARY DATA |
Our consolidated financial statements, together with related notes and the report of PricewaterhouseCoopers LLP, our independent registered public accounting firm, are set forth on the pages indicated in Part IV, Item 15.
| ITEM 9. | CHANGES IN AND DISAGREEMENTS WITH ACCOUNTANTS ON ACCOUNTING AND FINANCIAL DISCLOSURE |
None.
| ITEM 9A. | CONTROLS AND PROCEDURES |
Evaluation Of Controls And Procedures
We maintain “disclosure controls and procedures” (as defined in Rules 13a-15(e) and 15d-15(e) of the Securities Exchange Act of 1934) that are designed to ensure that: (1) information required to be disclosed in our Exchange Act reports is recorded, processed, summarized and reported within the time periods specified in the Securities and Exchange Commission’s rules and forms; and (2) such information is accumulated and communicated to our management, including our Chief Executive Officer and Chief Financial Officer, as appropriate, to allow for timely decisions regarding required disclosure. In designing and evaluating our disclosure controls and procedures, our management recognizes that any controls and procedures, no matter how well designed and operated, can provide only reasonable assurance of achieving the desired control objectives, and our management is required to apply its judgment in evaluating the cost-benefit relationship of possible controls and procedures.
We carried out an evaluation, under the supervision of and with the participation of our management, including our Chief Executive Officer and Chief Financial Officer, of the effectiveness of our disclosure controls and procedures as of December 31, 2015. Based on the foregoing, our President/Chief Executive Officer and Executive Vice President/Chief Financial Officer concluded that, as of December 31, 2015, our disclosure controls and procedures were effective at the reasonable assurance level.
35
Table of Contents
Changes In Internal Controls
There has been no change in the Company’s internal controls over financial reporting during the Company’s most recent fiscal quarter that has materially affected, or is reasonably likely to materially affect, the Company’s internal controls over financial reporting.
Management’s Report On Internal Control Over Financial Reporting
Internal control over financial reporting refers to the process designed by, or under the supervision of, our Chief Executive Officer and Chief Financial Officer, and effected by our Board of Directors, management and other personnel, to provide reasonable assurance regarding the reliability of financial reporting and the preparation of financial statements for external purposes in accordance with generally accepted accounting principles, and includes those policies and procedures that:
| • | pertain to the maintenance of records that, in reasonable detail, accurately and fairly reflect the transactions and dispositions of the assets of the Company; |
| • | provide reasonable assurance that transactions are recorded as necessary to permit preparation of financial statements in accordance with generally accepted accounting principles, and that receipts and expenditures of the Company are being made only in accordance with authorizations of management and directors of the Company; and |
| • | provide reasonable assurance regarding prevention or timely detection of unauthorized acquisition, use or disposition of the Company’s assets that could have a material effect on the consolidated financial statements. |
Management has used the criteria established in Internal Control – Integrated Framework (2013) issued by the Committee of Sponsoring Organizations of the Treadway Commission (“COSO”) to evaluate the effectiveness of the Company’s internal control over financial reporting. Based on this evaluation, management has concluded that the Company’s internal control over financial reporting was effective as of December 31, 2015. The effectiveness of the Company’s internal control over financial reporting as of December 31, 2015 has been audited by PricewaterhouseCoopers LLP, an independent registered public accounting firm, as stated in their report which appears under Item 15.
We have excluded the stations acquired from Lincoln Financial Media Company and the station acquired from Bonneville International Corporation from our assessment of internal control over financial reporting as of December 31, 2015 as these stations were acquired by us in a purchase business combination during 2015. These stations’ total assets and total revenues represent 4% and 7%, respectively, of the related consolidated financial statement amounts as of and for the year ended December 31, 2015.
Inherent Limitations on Effectiveness of Controls
Internal control over financial reporting cannot provide absolute assurance of achieving financial reporting objectives because of its inherent limitations. Internal control over financial reporting is a process that involves human diligence and compliance and is subject to lapses in judgment and breakdowns resulting from human failures. Internal control over financial reporting also can be circumvented by collusion or improper management override. Because of such limitations, there is a risk that material misstatements may not be prevented or detected on a timely basis by internal control over financial reporting. However, these inherent limitations are known features of the financial reporting process. Therefore, it is possible to design into the process safeguards to reduce, though not eliminate, this risk. Management is responsible for establishing and maintaining adequate internal control over financial reporting for the Company.
David J. Field, President and Chief Executive Officer
Stephen F. Fisher, Executive Vice President - Chief Financial Officer
| ITEM 9B. | OTHER INFORMATION |
None.
36
Table of Contents
| ITEM 10. | DIRECTORS, EXECUTIVE OFFICERS AND CORPORATE GOVERNANCE |
The information required by this Item 10 is incorporated in this report by reference to the applicable information set forth in our proxy statement for the 2016 Annual Meeting of Shareholders, which we expect to file with the Securities and Exchange Commission prior to April 29, 2016.
| ITEM 11. | EXECUTIVE COMPENSATION |
The information required by this Item 11 is incorporated in this report by reference to the applicable information set forth in our proxy statement for the 2016 Annual Meeting of Shareholders, which we expect to file with the Securities and Exchange Commission prior to April 29, 2016.
| ITEM 12. | SECURITY OWNERSHIP OF CERTAIN BENEFICIAL OWNERS AND MANAGEMENT AND RELATED SHAREHOLDER MATTERS |
The information required by this Item 12 is incorporated in this report by reference to the applicable information set forth in our proxy statement for the 2016 Annual Meeting of Shareholders, which we expect to file with the Securities and Exchange Commission prior to April 29, 2016.
| ITEM 13. | CERTAIN RELATIONSHIPS AND RELATED TRANSACTIONS AND DIRECTOR INDEPENDENCE |
The information required by this Item 13 is incorporated in this report by reference to the applicable information set forth in our proxy statement for the 2016 Annual Meeting of Shareholders, which we expect to file with the Securities and Exchange Commission prior to April 29, 2016.
| ITEM 14. | PRINCIPAL ACCOUNTING FEES AND SERVICES |
The information required by this Item 14 is incorporated in this report by reference to the applicable information set forth in our proxy statement for the 2016 Annual Meeting of Shareholders, which we expect to file with the Securities and Exchange Commission prior to April 29, 2016.
37
Table of Contents
| ITEM 15. | EXHIBITS, FINANCIAL STATEMENT SCHEDULES |
| (a) | The following documents are filed as part of this Report: |
38
Table of Contents
| (b) | Exhibits |
| Exhibit Number |
Description | |
| 3.01 | Amended and Restated Articles of Incorporation of the Entercom Communications Corp. (1) | |
| 3.02 | Amended and Restated Bylaws of the Entercom Communications Corp. (2) | |
| 3.03 | Statement with Respect to Shares, filed with the Pennsylvania Department of State on July 16, 2015. (3) (Originally filed as Exhibit 3.1) | |
| 4.01 | Credit Agreement, dated as of November 23, 2011, among Entercom Radio, LLC, as the Borrower, Entercom Communications Corp., as the Parent, Bank of America, N.A. as Administrative Agent and the lenders party thereto. (4) (Originally filed as Exhibit 4.1) | |
| 4.02 | First Amendment To Credit Agreement, dated as of November 27, 2012, among Entercom Radio, LLC, as the Borrower, Entercom Communications Corp., as the Parent, Bank of America, N.A. as Administrative Agent and the lenders party thereto. (5) | |
| 4.03 | Second Amendment To Credit Agreement, dated as of December 2, 2013, among Entercom Radio, LLC, as the Borrower, Entercom Communications Corp., as the Parent, Bank of America, N.A. as Administrative Agent and the lenders party thereto. (6) | |
| 4.04 | Indenture, dated as of November 23, 2011, by and among Entercom Radio, LLC, as the Issuer, the Note Guarantors (as defined therein) and Wilmington Trust, National Association, as trustee. (3) (Originally filed as Exhibit 4.2) | |
| 4.05 | Form of Note. (4) (Originally filed as Exhibit 4.3) | |
| 4.06 | Registration Rights Agreement, dated July 16, 2015, by and between Entercom Communications Corp. and The Lincoln National Life Insurance Company. (3) (Originally filed as Exhibit 4.1) | |
| 10.01 | Amended and Restated Employment Agreement, dated December 23, 2010, between Entercom Communications Corp. and David J. Field. (7) (Originally filed as Exhibit 10.01) | |
| 10.02 | Employment Agreement, dated July 1, 2007, between Entercom Communications Corp. and Joseph M. Field. (8) | |
| 10.03 | First Amendment To Employment Agreement, dated December 15, 2008, between Entercom Communications Corp. and Joseph M. Field. (9) | |
| 10.04 | Amended and Restated Employment Agreement, dated October 27, 2015, between Entercom Communications Corp. and Stephen F. Fisher. (10) | |
| 10.05 | Employment Agreement, dated as of January 1, 2013 between Entercom Communications Corp. and Andrew P. Sutor, IV. (11) | |
| 10.06 | Employment Agreement, dated May 5, 2015, between Entercom Communications Corp. and Louise Kramer. (10) | |
| 10.07 | Entercom Non-Employee Director Compensation Policy adopted February 19, 2015. (12) | |
| 10.08 | Amended and Restated Entercom Equity Compensation Plan. (13) | |
| 10.09 | Entercom Annual Incentive Plan. (14) | |
| 21.01 | Information Regarding Subsidiaries of Entercom Communications Corp. (10) | |
| 23.01 | Consent of PricewaterhouseCoopers LLP. (10) | |
| 31.01 | Certification of President and Chief Executive Officer required by Rule 13a-14(a) or Rule 15d-14(a), as created by Section 302 of the Sarbanes-Oxley Act of 2002. (10) | |
| 31.02 | Certification of Executive Vice President and Chief Financial Officer required by Rule 13a-14(a) or Rule 15d-14(a), as created by Section 302 of the Sarbanes-Oxley Act of 2002. (10) | |
| 32.01 | Certification of President and Chief Executive Officer pursuant to 18 U.S.C. § 1350, as created by Section 906 of the Sarbanes-Oxley Act of 2002. (15) | |
| 32.02 | Certification of Executive Vice President and Chief Financial Officer pursuant to 18 U.S.C. § 1350, as created by Section 906 of the Sarbanes-Oxley Act of 2002. (15) | |
| 101.INS | XBRL Instance Document | |
| 101.SCH | XBRL Taxonomy Extension Schema | |
| 101.CAL | XBRL Taxonomy Extension Calculation Linkbase | |
| 101.DEF | XBRL Taxonomy Extension Definition Linkbase | |
| 101.LAB | XBRL Taxonomy Extension Label Linkbase | |
| 101.PRE | XBRL Taxonomy Extension Presentation Linkbase | |
| (1) | Incorporated by reference to Exhibit 3.01 to our Amendment to Registration Statement on Form S-1, as filed on January 27, 1999 (File No. 333-61381), Exhibit 3.1 of our Current Report on Form 8-K as filed on December 21, 2007 and Exhibit 3.02 to our Quarterly Report on Form 10-Q for the quarter ended June 30, 2009, as filed on August 5, 2009. |
39
Table of Contents
| (2) | Incorporated by reference to Exhibit 3.01 to our Current Report on Form 8-K filed on February 21, 2008. |
| (3) | Incorporated by reference to an exhibit (as indicated above) to our Current Report on Form 8-K filed on July 17, 2015. |
| (4) | Incorporated by reference to an exhibit (as indicated above) to our Current report on Form 8-K filed on November 25, 2011. |
| (5) | Incorporated by reference to Exhibit 4.02 to our Annual Report on Form 10-K for the year ended December 31, 2012, as filed on February 27, 2013. |
| (6) | Incorporated by reference to Exhibit 4.03 to our Annual Report on Form 10-K for the year ended December 31, 2013, as filed on March 3, 2014. |
| (7) | Incorporated by reference to an exhibit (as indicated above) to our Annual Report on Form 10-K for the year ended December 31, 2010, as filed on February 9, 2011. |
| (8) | Incorporated by reference to Exhibit 10.02 to our Quarterly Report on Form 10-Q/A for the quarter ended September 30, 2007, as filed on November 21, 2007. |
| (9) | Incorporated by reference to Exhibit 10.04 to our Annual Report on Form 10-K for the year ended December 31, 2008, as filed on February 26, 2009. |
| (10) | Filed herewith. |
| (11) | Incorporated by reference to Exhibit 10.01 to our Quarterly Report on Form 10-Q for the quarter ended March 31, 2013, as filed on May 9, 2013. |
| (12) | Incorporated by reference to Exhibit 10.01 to our Current Report on Form 8-K as filed on February 19, 2015. |
| (13) | Incorporated by reference to Exhibit A to our Proxy Statement on Schedule 14A filed on March 20, 2014. |
| (14) | Incorporated by reference to Exhibit A to our Proxy Statement on Schedule 14A filed on March 16, 2012. |
| (15) | These exhibits are submitted as “accompanying” this Annual Report on Form 10-K and shall not be deemed to be “filed” as part of such Annual Report on Form 10-K. |
40
Table of Contents
REPORT OF INDEPENDENT REGISTERED PUBLIC ACCOUNTING FIRM
To the Board of Directors and Shareholders
of Entercom Communications Corp.:
In our opinion, the accompanying consolidated balance sheets and the related consolidated statement of operations, shareholders’ equity and cash flows present fairly, in all material respects, the financial position of Entercom Communications Corp and its subsidiaries at December 31, 2015 and 2014, and the results of their operations and their cash flows for each of the three years in the period ended December 31, 2015 in conformity with accounting principles generally accepted in the United States of America. Also in our opinion, the Company maintained, in all material respects, effective internal control over financial reporting as of December 31, 2015, based on criteria established in Internal Control - Integrated Framework (2013) issued by the Committee of Sponsoring Organizations of the Treadway Commission (COSO). The Company’s management is responsible for these financial statements, for maintaining effective internal control over financial reporting and for its assessment of the effectiveness of internal control over financial reporting, included in Management’s Report on Internal Control over Financial Reporting under Item 9A. Our responsibility is to express opinions on these financial statements and on the Company’s internal control over financial reporting based on our integrated audits. We conducted our audits in accordance with the standards of the Public Company Accounting Oversight Board (United States). Those standards require that we plan and perform the audits to obtain reasonable assurance about whether the financial statements are free of material misstatement and whether effective internal control over financial reporting was maintained in all material respects. Our audits of the financial statements included examining, on a test basis, evidence supporting the amounts and disclosures in the financial statements, assessing the accounting principles used and significant estimates made by management, and evaluating the overall financial statement presentation. Our audit of internal control over financial reporting included obtaining an understanding of internal control over financial reporting, assessing the risk that a material weakness exists, and testing and evaluating the design and operating effectiveness of internal control based on the assessed risk. Our audits also included performing such other procedures as we considered necessary in the circumstances. We believe that our audits provide a reasonable basis for our opinions.
A company’s internal control over financial reporting is a process designed to provide reasonable assurance regarding the reliability of financial reporting and the preparation of financial statements for external purposes in accordance with generally accepted accounting principles. A company’s internal control over financial reporting includes those policies and procedures that (i) pertain to the maintenance of records that, in reasonable detail, accurately and fairly reflect the transactions and dispositions of the assets of the company; (ii) provide reasonable assurance that transactions are recorded as necessary to permit preparation of financial statements in accordance with generally accepted accounting principles, and that receipts and expenditures of the company are being made only in accordance with authorizations of management and directors of the company; and (iii) provide reasonable assurance regarding prevention or timely detection of unauthorized acquisition, use, or disposition of the company’s assets that could have a material effect on the financial statements.
Because of its inherent limitations, internal control over financial reporting may not prevent or detect misstatements. Also, projections of any evaluation of effectiveness to future periods are subject to the risk that controls may become inadequate because of changes in conditions, or that the degree of compliance with the policies or procedures may deteriorate.
As described in Management’s Report On Internal Control over Financial Reporting appearing under Item 9A, management has excluded the stations acquired from Lincoln Financial Media Company and the station acquired from Bonneville International Corporation from its assessment of internal control over financial reporting as of December 31, 2015 because these entities were acquired by the Company in purchase business combinations during 2015. We have also excluded these stations from our audit of internal control over financial reporting. These stations’ total assets and total revenues represent 4% and 7%, respectively, of the related consolidated financial statement amounts as of and for the year ended December 31, 2015.
/s/ PricewaterhouseCoopers LLP
Philadelphia, Pennsylvania
February 26, 2016
41
Table of Contents
CONSOLIDATED FINANCIAL STATEMENTS OF ENTERCOM COMMUNICATIONS CORP.
CONSOLIDATED BALANCE SHEETS
(amounts in thousands, except share data)
| DECEMBER 31, 2015 |
DECEMBER 31, 2014 |
|||||||
| ASSETS: |
||||||||
| Cash |
$ | 9,169 | $ | 31,540 | ||||
| Accounts receivable, net of allowance for doubtful accounts |
87,157 | 70,249 | ||||||
| Prepaid expenses, deposits and other |
6,220 | 5,937 | ||||||
| Prepaid and refundable federal and state income taxes |
55 | 30 | ||||||
| Deferred tax assets |
3,464 | 2,248 | ||||||
|
|
|
|
|
|||||
| Total current assets |
106,065 | 110,004 | ||||||
| Net property and equipment |
57,993 | 44,662 | ||||||
| Radio broadcasting licenses |
807,381 | 718,992 | ||||||
| Goodwill |
32,629 | 38,850 | ||||||
| Assets held for sale |
6,106 | 868 | ||||||
| Deferred charges and other assets, net of accumulated amortization |
11,934 | 13,239 | ||||||
|
|
|
|
|
|||||
| TOTAL ASSETS |
$ | 1,022,108 | $ | 926,615 | ||||
|
|
|
|
|
|||||
| LIABILITIES: |
||||||||
| Accounts payable |
$ | 73 | $ | 324 | ||||
| Accrued expenses |
16,772 | 13,938 | ||||||
| Other current liabilities |
19,924 | 13,499 | ||||||
| Long-term debt, current portion |
31,832 | 3,000 | ||||||
|
|
|
|
|
|||||
| Total current liabilities |
68,601 | 30,761 | ||||||
|
|
|
|
|
|||||
| Long-term debt, net of current portion |
455,187 | 476,929 | ||||||
| Deferred tax liabilities |
81,643 | 63,470 | ||||||
| Other long-term liabilities |
27,608 | 26,434 | ||||||
|
|
|
|
|
|||||
| Total long-term liabilities |
564,438 | 566,833 | ||||||
|
|
|
|
|
|||||
| Total liabilities |
633,039 | 597,594 | ||||||
|
|
|
|
|
|||||
| CONTINGENCIES AND COMMITMENTS |
||||||||
| PERPETUAL CUMULATIVE CONVERTIBLE PREFERRED STOCK |
27,619 | — | ||||||
|
|
|
|
|
|||||
| SHAREHOLDERS’ EQUITY: |
||||||||
| Preferred stock; authorized 25,000,000 shares; issued and outstanding 11 shares in 2015 and no shares in 2014 |
— | — | ||||||
| Class A common stock $0.01 par value; voting; authorized 200,000,000 shares; issued and outstanding 32,480,551 in 2015 and 31,862,294 in 2014 |
325 | 319 | ||||||
| Class B common stock $0.01 par value; voting; authorized 75,000,000 shares; issued and outstanding 7,197,532 in 2015 and 2014 |
72 | 72 | ||||||
| Class C common stock $0.01 par value; nonvoting; authorized 50,000,000 shares; no shares issued and outstanding |
— | — | ||||||
| Additional paid-in capital |
611,754 | 608,515 | ||||||
| Accumulated deficit |
(250,701 | ) | (279,885 | ) | ||||
|
|
|
|
|
|||||
| Total shareholders’ equity |
361,450 | 329,021 | ||||||
|
|
|
|
|
|||||
| TOTAL LIABILITIES AND SHAREHOLDERS’ EQUITY |
$ | 1,022,108 | $ | 926,615 | ||||
|
|
|
|
|
|||||
See notes to consolidated financial statements.
42
Table of Contents
CONSOLIDATED STATEMENTS OF OPERATIONS
(amounts in thousands, except share and per share data)
| YEARS ENDED DECEMBER 31, | ||||||||||||
| 2015 | 2014 | 2013 | ||||||||||
| NET REVENUES |
$ | 411,378 | $ | 379,789 | $ | 377,618 | ||||||
|
|
|
|
|
|
|
|||||||
| OPERATING EXPENSE: |
||||||||||||
| Station operating expenses, including non-cash compensation expense |
287,711 | 259,184 | 252,596 | |||||||||
| Depreciation and amortization expense |
8,419 | 7,794 | 8,545 | |||||||||
| Corporate general and administrative expenses, including non-cash compensation expense |
26,479 | 26,572 | 24,381 | |||||||||
| Impairment loss |
— | — | 850 | |||||||||
| Merger and acquisition costs and restructuring charges |
6,836 | 1,042 | — | |||||||||
| Net time brokerage agreement (income) fees |
(1,285 | ) | — | — | ||||||||
| Net (gain) loss on sale or disposal of assets |
(2,364 | ) | (379 | ) | (1,321 | ) | ||||||
|
|
|
|
|
|
|
|||||||
| Total operating expense |
325,796 | 294,213 | 285,051 | |||||||||
|
|
|
|
|
|
|
|||||||
| OPERATING INCOME (LOSS) |
85,582 | 85,576 | 92,567 | |||||||||
|
|
|
|
|
|
|
|||||||
| OTHER (INCOME) EXPENSE: |
||||||||||||
| Net interest expense |
37,961 | 38,821 | 44,232 | |||||||||
| Net (gain) loss on investments |
— | 21 | — | |||||||||
| Other expense (income) |
— | — | (165 | ) | ||||||||
|
|
|
|
|
|
|
|||||||
| TOTAL OTHER EXPENSE |
37,961 | 38,842 | 44,067 | |||||||||
|
|
|
|
|
|
|
|||||||
| INCOME (LOSS) BEFORE INCOME TAXES (BENEFIT) |
47,621 | 46,734 | 48,500 | |||||||||
| INCOME TAXES (BENEFIT) |
18,437 | 19,911 | 22,476 | |||||||||
|
|
|
|
|
|
|
|||||||
| NET INCOME (LOSS) AVAILABLE TO THE COMPANY |
29,184 | 26,823 | 26,024 | |||||||||
| Preferred stock dividend |
(752 | ) | — | — | ||||||||
|
|
|
|
|
|
|
|||||||
| NET INCOME (LOSS) AVAILABLE TO COMMON SHAREHOLDERS |
$ | 28,432 | $ | 26,823 | $ | 26,024 | ||||||
|
|
|
|
|
|
|
|||||||
| NET INCOME (LOSS) AVAILABLE TO COMMON SHAREHOLDERS PER SHARE - BASIC |
$ | 0.75 | $ | 0.71 | $ | 0.70 | ||||||
|
|
|
|
|
|
|
|||||||
| NET INCOME (LOSS) AVAILABLE TO COMMON SHAREHOLDERS PER SHARE - DILUTED |
$ | 0.73 | $ | 0.69 | $ | 0.68 | ||||||
|
|
|
|
|
|
|
|||||||
| WEIGHTED AVERAGE SHARES: |
||||||||||||
| Basic |
38,083,947 | 37,763,353 | 37,417,807 | |||||||||
|
|
|
|
|
|
|
|||||||
| Diluted |
39,037,623 | 38,664,066 | 38,301,495 | |||||||||
|
|
|
|
|
|
|
|||||||
See notes to consolidated financial statements.
43
Table of Contents
CONSOLIDATED STATEMENTS OF SHAREHOLDERS’ EQUITY
YEARS ENDED DECEMBER 31, 2015, 2014 AND 2013
(amounts in thousands, except share data)
| Retained | ||||||||||||||||||||||||||||
| Common Stock | Additional | Earnings | ||||||||||||||||||||||||||
| Class A | Class B | Paid-in | (Accumulated | |||||||||||||||||||||||||
| Shares | Amount | Shares | Amount | Capital | Deficit) | Total | ||||||||||||||||||||||
| Balance, December 31, 2012 |
31,226,047 | $ | 312 | 7,197,532 | $ | 72 | $ | 601,847 | $ | (332,737 | ) | $ | 269,494 | |||||||||||||||
| Net income (loss) available to the Company |
— | — | — | — | — | 26,024 | 26,024 | |||||||||||||||||||||
| Compensation expense related to granting of stock awards |
96,560 | 1 | — | — | 4,269 | — | 4,270 | |||||||||||||||||||||
| Exercise of stock options |
171,625 | 2 | — | — | 243 | — | 245 | |||||||||||||||||||||
| Purchase of vested employee restricted stock units |
(186,038 | ) | (2 | ) | — | — | (1,638 | ) | — | (1,640 | ) | |||||||||||||||||
|
|
|
|
|
|
|
|
|
|
|
|
|
|
|
|||||||||||||||
| Balance, December 31, 2013 |
31,308,194 | 313 | 7,197,532 | 72 | 604,721 | (306,713 | ) | 298,393 | ||||||||||||||||||||
| Net income (loss) |
— | — | — | — | — | 26,823 | 26,823 | |||||||||||||||||||||
| Compensation expense related to granting of stock awards |
638,102 | 7 | — | — | 5,225 | — | 5,232 | |||||||||||||||||||||
| Exercise of stock options |
57,500 | — | — | — | 82 | — | 82 | |||||||||||||||||||||
| Purchase of vested employee restricted stock units |
(141,502 | ) | (1 | ) | — | — | (1,513 | ) | — | (1,514 | ) | |||||||||||||||||
| Forfeitures of dividend equivalents |
— | — | — | — | — | 5 | 5 | |||||||||||||||||||||
|
|
|
|
|
|
|
|
|
|
|
|
|
|
|
|||||||||||||||
| Balance, December 31, 2014 |
31,862,294 | 319 | 7,197,532 | 72 | 608,515 | (279,885 | ) | 329,021 | ||||||||||||||||||||
| Net income (loss) available to the Company |
— | — | — | — | — | 29,184 | 29,184 | |||||||||||||||||||||
| Compensation expense related to granting of stock awards |
738,195 | 7 | — | — | 5,517 | — | 5,524 | |||||||||||||||||||||
| Exercise of stock options |
11,750 | — | — | — | 35 | — | 35 | |||||||||||||||||||||
| Purchase of vested employee restricted stock units |
(131,688 | ) | (1 | ) | — | — | (1,561 | ) | — | (1,562 | ) | |||||||||||||||||
| Preferred stock dividend |
— | — | — | — | (752 | ) | — | (752 | ) | |||||||||||||||||||
|
|
|
|
|
|
|
|
|
|
|
|
|
|
|
|||||||||||||||
| Balance, December 31, 2015 |
32,480,551 | $ | 325 | 7,197,532 | $ | 72 | $ | 611,754 | $ | (250,701 | ) | $ | 361,450 | |||||||||||||||
|
|
|
|
|
|
|
|
|
|
|
|
|
|
|
|||||||||||||||
See notes to consolidated financial statements.
44
Table of Contents
CONSOLIDATED STATEMENTS OF CASH FLOWS
(amounts in thousands)
| YEARS ENDED DECEMBER 31, | ||||||||||||
| 2015 | 2014 | 2013 | ||||||||||
| OPERATING ACTIVITIES: |
||||||||||||
| Net income (loss) available to the Company |
$ | 29,184 | $ | 26,823 | $ | 26,024 | ||||||
| Adjustments to reconcile net income (loss) to net cash provided by (used in) operating activities: |
||||||||||||
| Depreciation and amortization |
8,419 | 7,794 | 8,545 | |||||||||
| Amortization of deferred financing costs (including original issue discount) |
3,203 | 4,165 | 4,144 | |||||||||
| Net deferred taxes (benefit) and other |
18,322 | 19,811 | 22,422 | |||||||||
| Provision for bad debts |
1,553 | 1,004 | 824 | |||||||||
| Net (gain) loss on sale or disposal of assets |
(2,364 | ) | (379 | ) | (1,251 | ) | ||||||
| Non-cash stock-based compensation expense |
5,524 | 5,232 | 4,270 | |||||||||
| Net (gain) loss on investments |
— | 21 | — | |||||||||
| Deferred rent |
1,017 | 807 | 206 | |||||||||
| Unearned revenue - long-term |
(10 | ) | (33 | ) | (82 | ) | ||||||
| Deferred compensation |
584 | 1,291 | 2,380 | |||||||||
| Impairment loss |
— | — | 850 | |||||||||
| Accretion expense, net of asset retirement obligation adjustments |
13 | (11 | ) | 18 | ||||||||
| Other (income) expense |
— | — | (165 | ) | ||||||||
| Changes in assets and liabilities: |
||||||||||||
| Accounts receivable |
(4,027 | ) | 565 | (1,678 | ) | |||||||
| Prepaid expenses and deposits |
642 | (1,586 | ) | (743 | ) | |||||||
| Accounts payable and accrued liabilities |
700 | 1,633 | (952 | ) | ||||||||
| Accrued interest expense |
769 | (132 | ) | (523 | ) | |||||||
| Accrued liabilities - long-term |
146 | (1,311 | ) | (1,140 | ) | |||||||
| Prepaid expenses - long-term |
1,115 | (398 | ) | 200 | ||||||||
|
|
|
|
|
|
|
|||||||
| Net cash provided by (used in) operating activities |
64,790 | 65,296 | 63,349 | |||||||||
|
|
|
|
|
|
|
|||||||
| INVESTING ACTIVITIES: |
||||||||||||
| Additions to property and equipment |
(7,043 | ) | (8,408 | ) | (4,325 | ) | ||||||
| Proceeds from sale of property, equipment, intangibles and other assets |
427 | 2,153 | 8 | |||||||||
| Purchases of radio station assets |
(83,553 | ) | — | — | ||||||||
| Deferred charges and other assets |
(1,575 | ) | (800 | ) | (475 | ) | ||||||
| Purchases of investments |
(9 | ) | — | — | ||||||||
| Proceeds from investments and capital projects |
9 | — | 209 | |||||||||
|
|
|
|
|
|
|
|||||||
| Net cash provided by (used in) investing activities |
(91,744 | ) | (7,055 | ) | (4,583 | ) | ||||||
|
|
|
|
|
|
|
|||||||
45
Table of Contents
ENTERCOM COMMUNICATIONS CORP.
CONSOLIDATED STATEMENTS OF CASH FLOWS
(amounts in thousands)
| YEARS ENDED DECEMBER 31, | ||||||||||||
| 2015 | 2014 | 2013 | ||||||||||
| FINANCING ACTIVITIES: |
||||||||||||
| Deferred financing expenses related to the bank facility, finance method lease obligations and senior unsecured notes |
— | — | (1,040 | ) | ||||||||
| Borrowing under the revolving senior debt |
58,000 | 15,500 | 33,000 | |||||||||
| Payments of long-term debt |
(51,250 | ) | (53,000 | ) | (86,023 | ) | ||||||
| Payment of fees associated with the issuance of preferred stock |
(220 | ) | — | — | ||||||||
| Proceeds from the exercise of stock options |
35 | 82 | 245 | |||||||||
| Purchase of vested employee restricted stock units |
(1,562 | ) | (1,514 | ) | (1,640 | ) | ||||||
| Payment of dividend equivalents on vested restricted stock units |
(7 | ) | — | — | ||||||||
| Payment of dividends |
(413 | ) | — | — | ||||||||
|
|
|
|
|
|
|
|||||||
| Net cash provided by (used in) financing activities |
4,583 | (38,932 | ) | (55,458 | ) | |||||||
|
|
|
|
|
|
|
|||||||
| NET INCREASE (DECREASE) IN CASH AND CASH |
(22,371 | ) | 19,309 | 3,308 | ||||||||
| CASH AND CASH EQUIVALENTS, BEGINNING OF YEAR |
31,540 | 12,231 | 8,923 | |||||||||
|
|
|
|
|
|
|
|||||||
| CASH AND CASH EQUIVALENTS, END OF YEAR |
$ | 9,169 | $ | 31,540 | $ | 12,231 | ||||||
|
|
|
|
|
|
|
|||||||
| SUPPLEMENTAL DISCLOSURES OF CASH FLOW |
||||||||||||
| Cash paid during the period for: |
||||||||||||
| Interest |
$ | 34,822 | $ | 35,593 | $ | 41,010 | ||||||
|
|
|
|
|
|
|
|||||||
| Income taxes |
$ | 81 | $ | 79 | $ | 69 | ||||||
|
|
|
|
|
|
|
|||||||
| Dividends |
$ | 413 | $ | — | $ | — | ||||||
|
|
|
|
|
|
|
|||||||
See notes to consolidated financial statements.
46
Table of Contents
NOTES TO CONSOLIDATED FINANCIAL STATEMENTS
YEARS ENDED DECEMBER 31, 2015, 2014 AND 2013
| 1. | BASIS OF PRESENTATION |
Nature Of Business – Entercom Communications Corp. (the “Company”) is the fourth-largest radio broadcasting company in the United States with a portfolio that includes 125 radio stations in 27 top markets across the country.
| 2. | SIGNIFICANT ACCOUNTING POLICIES |
Principles Of Consolidation – The accompanying consolidated financial statements include the accounts of the Company and its subsidiaries, all of which are 100% owned by the Company. All intercompany transactions and balances have been eliminated in consolidation. The Company also considers the applicability of any variable interest entities (“VIEs”) that are required to be consolidated by the primary beneficiary. From time to time, the Company may enter into a time brokerage agreement (“TBA”) in connection with a pending acquisition or disposition of radio stations and the requirement to consolidate or deconsolidate a VIE may apply, depending on the facts and circumstances related to each transaction. As of December 31, 2015, there were no outstanding VIEs.
Reportable Segment - The Company operates under one reportable business segment, radio broadcasting, for which segment disclosure is consistent with the management decision-making process that determines the allocation of resources and the measuring of performance. Radio stations serving the same geographic area, which may be comprised of a city or combination of cities, are referred to as markets or as distinct operating segments. The Company has 27 operating segments. These operating segments are aggregated to create one reportable segment.
Management’s Use Of Estimates – The preparation of consolidated financial statements, in conformity with accounting principles generally accepted in the United States of America, requires the Company to make estimates and assumptions that affect the reported amounts of assets and liabilities, and the disclosure of contingent assets and liabilities, as of the date of the consolidated financial statements, and the reported amounts of revenues and expenses during the reporting period. Significant estimates and assumptions are used for, but not limited to: (1) asset impairments, including broadcasting licenses and goodwill; (2) income tax valuation allowances for deferred tax assets; (3) allowance for doubtful accounts; (4) self-insurance reserves; (5) fair value of equity awards; (6) estimated lives for tangible and intangible assets; (7) contingency and litigation reserves; (8) fair value measurements; (9) acquisition purchase price asset and liability allocations; and (10) uncertain tax positions. The Company’s accounting estimates require the use of judgment as future events and the effect of these events cannot be predicted with certainty. The accounting estimates may change as new events occur, as more experience is acquired and as more information is obtained. The Company evaluates and updates assumptions and estimates on an ongoing basis and may use outside experts to assist in the Company’s evaluation, as considered necessary. Actual results could differ from those estimates.
Income Taxes – The Company applies the liability method to the accounting for deferred income taxes. Deferred income taxes are recognized for all temporary differences between the tax and financial reporting bases of the Company’s assets and liabilities based on enacted tax laws and statutory tax rates applicable to the periods in which the differences are expected to affect taxable income. A valuation allowance is recorded for a net deferred tax asset balance when it is more likely than not that the benefits of the tax asset will not be realized. The Company reviews on a continuing basis the need for a deferred tax asset valuation allowance in the jurisdictions in which it operates. Any adjustment to the deferred tax asset valuation allowance is recorded in the consolidated statements of operations in the period that such an adjustment is required.
The Company applies the guidance for income taxes and intra-period allocation to the recognition of uncertain tax positions. This guidance clarifies the recognition, de-recognition and measurement in financial statements of income tax positions taken in previously filed tax returns or tax positions expected to be taken in tax returns, including a decision whether to file or not to file in a particular jurisdiction. The guidance requires that any liability created for unrecognized tax benefits is disclosed. The application of this guidance may also affect the tax bases of assets and liabilities and therefore may change or create deferred tax liabilities or assets. This guidance also clarifies the method to allocate income taxes (benefit) to the different components of income (loss), such as: (1) income (loss) from continuing operations; (2) income (loss) from discontinued operations; (3) extraordinary items; (4) other comprehensive income (loss); (5) the cumulative effects of accounting changes; and (6) other charges or credits recorded directly to shareholders’ equity. See Note 14 for a further discussion of income taxes.
47
Table of Contents
Property And Equipment – Property and equipment are carried at cost. Major additions or improvements are capitalized, including interest expense when material, while repairs and maintenance are charged to expense when incurred. Upon sale or retirement, the related cost and accumulated depreciation are removed from the accounts, and any gain or loss is recognized in the statement of operations. Depreciation expense on property and equipment is determined on a straight-line basis.
Depreciation expense for property and equipment is reflected in the following table:
| Property And Equipment | ||||||||||||
| Years Ended December 31, | ||||||||||||
| 2015 | 2014 | 2013 | ||||||||||
| (amounts in thousands) | ||||||||||||
| Depreciation expense |
$ | 7,419 | $ | 6,748 | $ | 7,543 | ||||||
|
|
|
|
|
|
|
|||||||
As of December 31, 2015, the Company had capital expenditure commitments outstanding of $1.4 million.
During 2014, the Company wrote off a significant amount of unused and obsolete assets that primarily consisted of fully depreciated assets.
The following is a summary of the categories of property and equipment along with the range of estimated useful lives used for depreciation purposes:
| Depreciation Period | Property And Equipment | |||||||||||||||
| In Years | December 31, | |||||||||||||||
| From | To | 2015 | 2014 | |||||||||||||
| (amounts in thousands) | ||||||||||||||||
| Land, land easements and land improvements |
— | 15 | $ | 16,764 | $ | 12,020 | ||||||||||
| Buildings |
20 | 40 | 22,711 | 21,836 | ||||||||||||
| Equipment |
3 | 40 | 108,399 | 97,509 | ||||||||||||
| Furniture and fixtures |
5 | 10 | 10,868 | 9,906 | ||||||||||||
| Leasehold improvements |
shorter of economic life | |||||||||||||||
| or lease term | 23,119 | 21,245 | ||||||||||||||
|
|
|
|
|
|||||||||||||
| 181,861 | 162,516 | |||||||||||||||
| Accumulated depreciation |
(124,870 | ) | (118,667 | ) | ||||||||||||
|
|
|
|
|
|||||||||||||
| 56,991 | 43,849 | |||||||||||||||
| Capital improvements in progress |
1,002 | 813 | ||||||||||||||
|
|
|
|
|
|||||||||||||
| Net property and equipment |
$ | 57,993 | $ | 44,662 | ||||||||||||
|
|
|
|
|
|||||||||||||
Long-Lived Assets - The Company evaluates the recoverability of its long-lived assets, which include property and equipment, broadcasting licenses (subject to an eight-year renewal cycle), goodwill, deferred charges, and other assets. See Note 4 for further discussion. If events or changes in circumstances were to indicate that an asset’s carrying value is not recoverable, a write-down of the asset would be recorded through a charge to operations. The determination and measurement of the fair value of long-lived assets requires the use of significant judgments and estimates. Future events may impact these judgments and estimates.
During the second quarter of 2013, the Company conducted an evaluation of useful lives for longer-lived assets, such as broadcast towers and buildings. As a result of this review, which was based upon current facts and circumstances, the Company determined that future acquisitions may warrant the use of longer lives anywhere between 15 years and 40 years.
Revenue Recognition – The Company generates revenue from the sale to advertisers of various services and products, including but not limited to: (1) commercial broadcast time; (2) digital advertising; (3) local events; (4) e-commerce where an advertiser’s goods and services are sold through our websites; and (5) digital product and marketing solutions.
48
Table of Contents
Revenue from services and products is recognized when delivered.
Advertiser payments received in advance of when the products or services are delivered are recorded on the Company’s balance sheet as unearned revenue.
Revenues presented in the consolidated financial statements are reflected on a net basis, after the deduction of advertising agency fees by the advertising agencies. The Company also evaluates when it is appropriate to recognize revenue based on the gross amount invoiced to the customer or the net amount retained by the Company if a third party is involved.
The following table presents the amounts of unearned revenues as of the periods indicated:
| Unearned Revenues | ||||||||||
| December 31, | ||||||||||
| Balance Sheet Location |
2015 | 2014 | ||||||||
| (amounts in thousands) | ||||||||||
| Current |
Other current liabilities | $ | 306 | $ | 191 | |||||
|
|
|
|
|
|||||||
| Long-term |
Other long-term liabilities | $ | — | $ | 10 | |||||
|
|
|
|
|
|||||||
Concentration Of Credit Risk – The Company’s revenues and accounts receivable relate primarily to the sale of advertising within its radio stations’ broadcast areas. Credit is extended based on an evaluation of the customers’ financial condition and, generally, collateral is not required. Credit losses are provided for in the financial statements and consistently have been within management’s expectations. The Company also maintains deposit accounts with financial institutions. At times, such deposits may exceed FDIC insurance limits.
Debt Issuance Costs And Original Issue Discount – The costs related to the issuance of debt are capitalized and amortized over the lives of the related debt and such amortization is accounted for as interest expense. See Note 8 for further discussion for the amount of deferred financing expense and original issue discount that was included in interest expense in the accompanying consolidated statements of operations.
Extinguishment Of Debt – The Company may amend, append or replace, in part or in full, its outstanding debt. The Company reviews its unamortized financing costs associated with its outstanding debt to determine the amount subject to extinguishment under the accounting provisions for an exchange of debt instruments with substantially different terms or changes in a line-of-credit or revolving-debt arrangement. See Note 8 for a discussion of the Company’s long-term debt. In addition, refer to the recent accounting pronouncements section of this note, Debt Issuance Costs, for a change in the balance sheet presentation of debt issuance costs effective January 1, 2016.
Corporate General And Administrative Expense – Corporate general and administrative expense consists of corporate overhead costs and non-cash compensation expense. Included in corporate general and administrative expenses are those costs not specifically allocable to any of the Company’s individual business properties.
Time Brokerage Agreement (Income) Fees – TBA fees or income consist of fees paid or received under agreements which permit an acquirer to program and market stations prior to an acquisition. The Company sometimes enters into a TBA prior to the consummation of station acquisitions and dispositions. The Company may also enter into a Joint Sales Agreement (“JSA”) to market, but not to program, a station for a defined period of time.
Barter Transactions – The Company provides advertising broadcast time in exchange for certain products, supplies and services. The terms of the exchanges generally permit the Company to preempt such broadcast time in favor of advertisers who purchase time on regular terms. The Company includes the value of such exchanges in both broadcasting net revenues and station operating expenses. Barter valuation is based upon management’s estimate of the fair value of the products, supplies and services received. See Note 15, Supplemental Cash Flow Disclosures On Non-Cash Investing And Financing Activities, for a summary of the Company’s barter transactions.
Business Combinations – Accounting guidance for business combinations provides the criteria to recognize intangible assets apart from goodwill. Other than goodwill, the Company uses a direct value method to determine the fair value of all intangible assets required to be recognized for business combinations. For a discussion of impairment testing of those assets acquired in a business combination, including goodwill, see Note 4.
49
Table of Contents
Asset Retirement Obligations – The Company reasonably estimates the fair value of an asset retirement obligation. For an asset retirement obligation that is conditional (uncertainty about the timing and/or method of settlement), the Company factors into its fair value measurement a probability factor as the obligation depends upon a future event that may or may not be within the control of the Company. The Company’s asset retirement obligations are not significant when compared to its net outstanding property and equipment.
Accrued Compensation – Certain types of employee compensation, which amounts are included in the balance sheets under other current liabilities, are paid in subsequent periods. See Note 6 for amounts reflected in the balance sheets.
Cash And Cash Equivalents – Cash consists primarily of amounts held on deposit with financial institutions. From time to time, the Company may invest in cash equivalents, which consists of investments in immediately available money market accounts and all highly liquid debt instruments with initial maturities of three months or less. As of December 31, 2015 and 2014, the Company had no cash equivalents on hand.
Derivative Financial Instruments – The Company follows accounting guidance for its derivative financial instruments that it enters into from time to time, including certain derivative instruments embedded in other contracts, and hedging activities.
Leases – The Company follows accounting guidance for its leases, which includes the recognition of escalated rents on a straight-line basis over the term of the lease agreement, as described further in Note 7.
Share-Based Compensation – The Company records compensation expense for all share-based payment awards made to employees and directors, at estimated fair value. The Company also uses the simplified method in developing an estimate of the expected term of certain stock options. For further discussion of share-based compensation, see Note 13.
Investments – For those investments in which the Company has the ability to exercise significant influence over the operating and financial policies of the investee, the investment is accounted for under the equity method. For those investments in which the Company does not have such significant influence, the Company applies the accounting guidance for certain investments in debt and equity securities. An investment is classified into one of three categories: held-to-maturity, available-for-sale, or trading securities, and, depending upon the classification, is carried at fair value based upon quoted market prices or historical cost when quoted market prices are unavailable.
The Company also provides certain quantitative and qualitative disclosures for those investments that are impaired (other than temporarily) at the balance sheet date and for those investments for which an impairment has not been recognized.
Advertising And Promotion Costs – Costs of media advertising and associated production costs are expensed when incurred.
Insurance And Self-Insurance Liabilities – The Company uses a combination of insurance and self-insurance mechanisms to provide for the potential liabilities for workers’ compensation, general liability, property, director and officers’ liability, vehicle liability and employee health care benefits. Liabilities associated with the risks that are retained by the Company are estimated, in part, by considering claims experience, demographic factors, severity factors, outside expertise and other actuarial assumptions. For any legal costs expected to be incurred in connection with a loss contingency, the Company recognizes the expense as incurred.
Recognition Of Insurance Recoveries – The Company recognizes insurance recoveries when all of the contingencies related to the insurance claims have been satisfied.
Sports Programming Costs – Programming costs which are for a specified number of events are amortized on an event-by-event basis, and programming costs which are for a specified season are amortized over the season on a straight-line basis. The Company allocates that portion of sports programming costs that are related to sponsorship and marketing activities to sales and marketing expenses on a straight-line basis over the term of the agreement.
Accrued Litigation - The Company evaluates the likelihood of an unfavorable outcome in legal or regulatory proceedings to which it is a party and records a loss contingency when it is probable that a liability has been incurred and the amount of the loss can be reasonably estimated. These judgments are subjective, based on the status of such legal or regulatory proceedings, the merits of the Company’s defenses and consultation with corporate and external legal counsel. Actual outcomes of these legal and regulatory proceedings may materially differ from the Company’s estimates. The Company expenses legal costs as incurred in professional fees. See Note 20, Contingencies And Commitments.
50
Table of Contents
Software Costs – The Company capitalizes direct internal and external costs incurred to develop internal-use software during the application development state. Internal-use software includes website development activities such as the planning and design of additional functionality and features for existing sites and/or the planning and design of new sites. Costs related to the maintenance, content development and training of internal-use software are expensed as incurred. Capitalized costs are amortized over the estimated useful life of three years using the straight-line method.
Recent Accounting Pronouncements
All new accounting pronouncements that are in effect that may impact the Company’s financial statements have been implemented. The Company does not believe that there are any other new accounting pronouncements that have been issued, other than for a few of those as listed below, that might have a material impact on the Company’s financial position or results of operations.
Leasing Transactions
In February 2016, the accounting guidance was modified to require that all leases with a term of more than one year, covering leased assets such as real estate, broadcasting towers and equipment, be reflected on the balance sheet as assets and liabilities for the rights and obligations created by these leases. While the Company is currently reviewing the effects of this guidance, the Company believes that this would result in: (1) an increase in the assets and liabilities reflected on the Company’s consolidated balance sheets; and (2) an increase in the Company’s interest expense and depreciation and amortization expense and a decrease to the Company’s station operating expense reflected on its consolidated statements of operations. This guidance is effective for the Company as of January 1, 2019.
Balance Sheet Classification Of Deferred Taxes
In November 2015, the accounting guidance for balance sheet classification of deferred taxes was modified to present deferred taxes for each jurisdiction as noncurrent on the balance sheet. Previously, deferred taxes were presented for each jurisdiction as a net current asset or liability and net noncurrent asset or liability. This guidance is effective for the Company as of January 1, 2017. The Company anticipates that this guidance will have no impact on the Company’s cash flows or results of operation and no material impact on the Company’s financial position.
Business Combinations
In September 2015, the accounting guidance for business combinations was modified to reflect measurement period adjustments to be recorded prospectively rather than retroactively to the assets and liabilities initially recorded under purchase price accounting. This guidance was effective for the Company as of January 1, 2016. The Company anticipates that this guidance could have an impact on the Company’s financial position and results of operations in the period that the adjustment is recorded for a previously reported business combination. There should be no material impact to the Company’s cash flows.
Fees Paid In A Cloud Computing Arrangement
In April 2015, the accounting guidance was revised to identify when a cloud computing service includes a software license that is to be capitalized and treated consistently with the acquisition of other software licenses. This guidance was effective for the Company as of January 1, 2016. The Company believes that this accounting guidance will not have any material effect on the Company’s results of operations, cash flows or financial condition.
Debt Issuance Costs
In April 2015, the accounting guidance was amended to modify the presentation of debt issuance costs on the balance sheet by requiring that all costs, including incremental third-party costs, be reflected as an offset to the associated debt liability rather than as a deferred charge. This guidance was subsequently modified in August 2015 to allow the existing presentation to continue for line-of-credit arrangements. This guidance was effective for the Company as of January 1, 2016. The impact of this guidance to the Company will be for balance sheet presentation purposes only and will have no impact on the Company’s results of operations, cash flows or financial condition.
Consolidation
In February 2015, the accounting guidance for consolidation was amended which revises the analysis of and reduces the need to consolidate certain entities. This guidance was effective for the Company as of January 1, 2016. The Company believes that this accounting guidance will not have any material effect on the Company’s results of operations, cash flows or financial condition.
51
Table of Contents
Extraordinary Items
In January 2015, the accounting guidance was updated to eliminate the concept of an extraordinary item and the requirement to consider whether an underlying event or transaction is extraordinary. If an item is considered extraordinary, it is presented in the income statement net of tax, after income from continuing operations. Eliminating the concept of extraordinary removes the uncertainty for the preparer as to whether the item had been treated properly. This guidance was effective for the Company as of January 1, 2016. The Company believes that this accounting guidance will not have any impact to the Company’s cash flows or financial condition as this only impacts the Company’s presentation on the Company’s results of operations.
Derivatives And Hedging
In November 2014, the accounting guidance was updated for determining whether the host contract in a hybrid financial instrument issued in the form of a share is more akin to debt or to equity. This update does not change the current criteria for determining when separation of certain embedded derivative features in a hybrid financial instrument is required, but clarifies how current accounting guidance should be interpreted in the evaluation of the economic characteristics and risks of a host contract in a hybrid financial instrument that is issued in the form of a share, reducing existing diversity in practice. This guidance was effective for the Company as of January 1, 2016. The Company believes that this accounting guidance will not have any material effect on the Company’s results of operations, cash flows or financial condition.
Stock-Based Performance Awards
In June 2014, the accounting guidance was updated for stock-based awards when the terms of an award provide that a performance target that affects vesting could be achieved after the requisite service period. The current accounting standard for stock-based compensation as it applies to awards with performance conditions should be applied. This guidance was effective for the Company as of January 1, 2016. The Company believes that this accounting guidance will not have any material effect on the Company’s results of operations, cash flows or financial condition.
Revenue Recognition
In August 2015, the effective date of the accounting guidance for revenue recognition from contracts with customers was deferred for an additional year. The guidance was originally issued in May 2014. Along with the update, most industry-specific revenue guidance was eliminated. The new guidance is based on the principle that revenue is recognized to depict the transfer of goods or services to customers in an amount that reflects the consideration to which the entity expects to be entitled in exchange for those goods or services. The guidance also requires additional disclosure about the nature, amount, timing and uncertainty of revenue and cash flows arising from customer contracts, including significant judgments and changes in judgments and assets recognized from costs incurred to obtain or fulfill a contract. The guidance will be applied using one of two retrospective methods. The guidance is effective for the Company as of January 1, 2018. The Company has not determined the potential effects of this guidance on its financial statements.
Reporting Discontinued Operations
In April 2014, the criteria for reporting discontinued operations, including enhanced disclosures, was modified under new accounting guidance. Under the new guidance, only disposals that have a major effect through a strategic shift on an organization’s operations and financial results should be presented as discontinued operations. In addition, the new guidance requires expanded disclosures that will provide financial statement users with more information about the assets, liabilities, income, and expenses of discontinued operations. The guidance was effective for the Company as of January 1, 2015. The Company believes that this accounting guidance did not have any impact on the Company’s cash flows or financial condition as this only impacts the Company’s presentation of the Company’s results of operations. In 2015, the Company disposed of a market cluster of radio stations. This disposition did not qualify as discontinued operations under this new guidance, whereas under prior guidance, this disposition would have qualified as discontinued operations.
| 3. | ACCOUNTS RECEIVABLE AND RELATED ALLOWANCE FOR DOUBTFUL ACCOUNTS |
Accounts receivable are primarily attributable to advertising which has been provided and for which payment has not been received from the advertiser. Accounts receivable are net of agency commissions and an estimated allowance for doubtful accounts. Estimates of the allowance for doubtful accounts are recorded based on management’s judgment of the collectability of the accounts receivable based on historical information, relative improvements or deteriorations in the age of the accounts receivable and changes in current economic conditions.
52
Table of Contents
The accounts receivable balances and reserve for doubtful accounts are presented in the following table:
| Net Accounts Receivable | ||||||||
| December 31, | ||||||||
| 2015 | 2014 | |||||||
| (amounts in thousands) | ||||||||
| Accounts receivable |
$ | 89,291 | $ | 72,698 | ||||
| Allowance for doubtful accounts |
(2,134 | ) | (2,449 | ) | ||||
|
|
|
|
|
|||||
| Accounts receivable, net of allowance for doubtful accounts |
$ | 87,157 | $ | 70,249 | ||||
|
|
|
|
|
|||||
See the table in Note 6 for accounts receivable credits outstanding as of the periods indicated.
The following table presents the changes in the allowance for doubtful accounts:
| Changes In Allowance For Doubtful Accounts |
||||||||||||||||
| Additions | ||||||||||||||||
| Balance At | Charged To | Deductions | Balance At | |||||||||||||
| Beginning | Costs And | From | End Of | |||||||||||||
| Year Ended |
Of Year | Expenses | Reserves | Year | ||||||||||||
| (amounts in thousands) | ||||||||||||||||
| December 31, 2015 |
$ | 2,449 | $ | 1,553 | $ | (1,868 | ) | $ | 2,134 | |||||||
| December 31, 2014 |
2,413 | 1,004 | (968 | ) | 2,449 | |||||||||||
| December 31, 2013 |
2,703 | 824 | (1,114 | ) | 2,413 | |||||||||||
| 4. | INTANGIBLE ASSETS AND GOODWILL |
(A) Indefinite-Lived Intangibles
Goodwill and certain intangible assets are not amortized for book purposes. They may be, however, amortized for tax purposes. The Company accounts for its acquired broadcasting licenses as indefinite-lived intangible assets and, similar to goodwill, these assets are reviewed at least annually for impairment. At the time of each review, if the fair value is less than the carrying value of goodwill and certain intangibles (such as broadcasting licenses), then a charge is recorded to the results of operations.
The Company may only write down the carrying value of its indefinite-lived intangibles. The Company is not permitted to increase the carrying value if the fair value of these assets subsequently increases.
53
Table of Contents
The following table presents the changes in broadcasting licenses that include an acquisition for multiple radio stations in new markets along with a related transaction that covers the exchange of certain stations in Denver for a station in Los Angeles (see Note 18 for further discussion):
| Broadcasting Licenses | ||||||||
| Carrying Amount | ||||||||
| December 31, | December 31, | |||||||
| 2015 | 2014 | |||||||
| (amounts in thousands) | ||||||||
| Beginning of period balance as of January 1, |
$ | 718,992 | $ | 718,542 | ||||
| Acquisition of radio stations |
79,209 | — | ||||||
| Acquisition of a radio station through an exchange |
53,057 | — | ||||||
| Acquisitions - other |
100 | 450 | ||||||
| Assets held for sale |
(1,397 | ) | — | |||||
| Disposition of radio stations previously reflected as held for sale |
(32,979 | ) | — | |||||
| Disposition of a radio station previously reflected as deconsolidated subsidiary |
(9,601 | ) | — | |||||
|
|
|
|
|
|||||
| Ending period balance |
$ | 807,381 | $ | 718,992 | ||||
|
|
|
|
|
|||||
The following table presents the changes in goodwill that include an acquisition for multiple radio stations in new markets along with a related transaction that covers the exchange of certain stations in Denver for a station in Los Angeles (see Note 18 for further discussion):
| Goodwill Carrying Amount | ||||||||
| December 31, | December 31, | |||||||
| 2015 | 2014 | |||||||
| (amounts in thousands) | ||||||||
| Goodwill balance before cumulative loss on impairment as of January 1, |
$ | 164,465 | $ | 164,465 | ||||
| Accumulated loss on impairment as of January 1, |
(125,615 | ) | (125,615 | ) | ||||
|
|
|
|
|
|||||
| Goodwill beginning balance after cumulative loss on impairment as of January 1, |
38,850 | 38,850 | ||||||
| Loss on impairment during year |
— | — | ||||||
| Acquisition of radio stations |
5,866 | — | ||||||
| Acquisition of radio stations through an exchange |
266 | — | ||||||
| Adjustment to acquired goodwill associated with an assumed fair value liability |
(1,364 | ) | — | |||||
| Disposition of radio stations previously reflected as assets held for sale |
(10,230 | ) | — | |||||
| Disposition of a radio station previously reflected as a deconsolidated subsidiary |
(759 | ) | — | |||||
|
|
|
|
|
|||||
| Ending period balance |
$ | 32,629 | $ | 38,850 | ||||
|
|
|
|
|
|||||
Broadcasting Licenses Impairment Test
The Company performs its annual broadcasting license impairment test during the second quarter of each year by evaluating its broadcasting licenses for impairment at the market level using the direct method.
During the second quarter for each of the years 2015, 2014 and 2013, the Company completed its annual impairment test for broadcasting licenses and determined that the fair value of its broadcasting licenses was greater than the amount reflected in the balance sheet for each of the Company’s markets and, accordingly, no impairment was recorded. For the four new markets added during the second half of 2015, similar valuation techniques that are used in the testing process were applied to the valuation of the broadcasting licenses under purchase price accounting.
Each market’s broadcasting licenses are combined into a single unit of accounting for purposes of testing impairment, as the broadcasting licenses in each market are operated as a single asset. The Company determines the fair value of the broadcasting licenses in each of its markets by relying on a discounted cash flow approach (a 10-year income model) assuming a start-up scenario in which the only assets held by an investor are broadcasting licenses. The Company’s fair value analysis contains assumptions based upon past experience, reflects expectations of industry observers and includes judgments about future performance using industry normalized information for an average station within a certain market. These assumptions include, but are not limited to: (1) the discount rate; (2) the market share and profit margin of an average station within a market, based upon market size and station type; (3) the forecast growth rate of each radio market; (4) the estimated capital start-up costs and losses incurred during the early years; (5) the likely media competition within the market area; (6) the tax rate; and (7) future terminal values.
54
Table of Contents
The methodology used by the Company in determining its key estimates and assumptions was applied consistently to each market. Of the seven variables identified above, the Company believes that the assumptions in items (1) through (3) above are the most important and sensitive in the determination of fair value.
The following table reflects the estimates and assumptions used in the second quarter of each year (no interim tests were performed in these years):
| Estimates And Assumptions | ||||||||
| Second | Second | Second | Second | |||||
| Quarter | Quarter | Quarter | Quarter | |||||
| 2015 | 2014 | 2013 | 2012 | |||||
| Discount rate |
9.7% | 9.6% | 9.8% | 10.0% | ||||
| Operating profit margin ranges expected for average stations in the markets where the Company operates |
25% to 40% | 25% to 40% | 25% to 41% | 21% to 41% | ||||
| Long-term revenue growth rate range of the Company’s markets |
1.5% to 2.0% | 1.5% to 2.0% | 1.5% to 2.0% | 1.5% to 2.0% | ||||
The Company has made reasonable estimates and assumptions to calculate the fair value of its broadcasting licenses. These estimates and assumptions could be materially different from actual results.
If actual market conditions are less favorable than those projected by the industry or the Company, or if events occur or circumstances change that would reduce the fair value of the Company’s broadcasting licenses below the amount reflected in the balance sheet, the Company may be required to conduct an interim test and possibly recognize impairment charges, which may be material, in future periods.
There were no events or circumstances since the Company’s second quarter annual license impairment test that indicated an interim review of broadcasting licenses was required.
Goodwill Impairment Test
The Company performs its annual goodwill impairment test during the second quarter of each year by evaluating its goodwill for each reporting unit.
During the second quarter in each of the years 2015, 2014 and 2013, the results of step one indicated that it was not necessary to perform the second step analysis in any of the reporting units that contained goodwill. For the four new markets added during the second half of 2015, similar valuation techniques that are used in the testing process were applied to the valuation of goodwill under purchase price accounting.
The Company also performed a reasonableness test on the fair value results for goodwill on a combined basis by comparing the carrying value of the Company’s assets to the Company’s enterprise value based upon its stock price. The Company determined that the results were reasonable.
In step one of the Company’s goodwill analysis, the Company considered the results of the market approach and, when appropriate, the income approach in computing the fair value of the Company’s reporting units. In the market approach, the Company applied an estimated market multiple to each reporting unit’s operating profit to calculate the fair value. In the income approach, the Company utilized the discounted cash flow methodology to calculate the fair value of the reporting unit. Management believes that these approaches are commonly used and appropriate methodologies for valuing broadcast radio stations. Factors contributing to the determination of the reporting unit’s operating performance were historical performance and/or management’s estimates of future performance.
The Company has determined that a radio market is a reporting unit and the Company assesses goodwill in each of the Company’s markets. If the fair value of any reporting unit is less than the amount reflected on the balance sheet, an indication exists that the amount of goodwill attributed to a reporting unit may be impaired, and the Company is required to perform a second step of the impairment test. The Company uses quantitative rather than
55
Table of Contents
qualitative factors to determine whether it is necessary to perform the two-step goodwill impairment test. In the second step, the Company compares the amount reflected on the balance sheet to the implied fair value of the reporting unit’s goodwill, determined by allocating the reporting unit’s fair value to all of its assets and liabilities in a manner similar to a purchase price allocation.
To determine the fair value, the Company uses a market approach and, when appropriate, an income approach in computing the fair value of each reporting unit. The market approach calculates the fair value of each market’s radio stations by analyzing recent sales and offering prices of similar properties expressed as a multiple of cash flow. The income approach utilizes a discounted cash flow method by projecting the subject property’s income over a specified time and capitalizing at an appropriate market rate to arrive at an indication of the most probable selling price.
The following table reflects the estimates and assumptions used in the second quarter of each year (no interim tests were performed in these years):
| Estimates And Assumptions | ||||||||
| Second | Second | Second | Second | |||||
| Quarter | Quarter | Quarter | Quarter | |||||
| 2015 | 2014 | 2013 | 2012 | |||||
| Discount rate |
9.7% | 9.6% | 9.8% | 10.0% | ||||
| Long-term revenue growth rate range of the Company’s markets |
1.5% to 2.0% | 1.5% to 2.0% | 1.5% to 2.0% | 1.5% to 2.0% | ||||
| Market multiple used in the market valuation approach |
7.5x to 8.0x | 7.5x to 8.0x | 7.5x to 8.0x | 7.5x to 8.0x | ||||
If actual market conditions are less favorable than those projected by the industry or the Company, or if events occur or circumstances change that would reduce the fair value of the Company’s goodwill below the amount reflected in the balance sheet, the Company may be required to conduct an interim test and possibly recognize impairment charges, which could be material, in future periods.
There were no events or circumstances since the Company’s second quarter annual goodwill test that indicated an interim review of goodwill was required.
(B) Definite-Lived Intangibles
The Company has definite-lived intangible assets that consist of advertiser lists and customer relationships, and acquired advertising contracts. These assets are amortized over the period for which the assets are expected to contribute to the Company’s future cash flows and are reviewed for impairment whenever events or changes in circumstances indicate that the carrying amount of an asset may not be recoverable. For 2015, 2014 and 2013, the Company reviewed the carrying value and the useful lives of these assets and determined they were appropriate.
See Note 5 for: (1) a listing of the assets comprising definite-lived assets, which are included in deferred charges and other assets on the balance sheets; (2) the amount of amortization expense for definite-lived assets; and (3) the Company’s estimate of amortization expense for definite-lived assets in future periods.
56
Table of Contents
| 5. | DEFERRED CHARGES AND OTHER ASSETS |
Deferred charges and other assets, including definite-lived intangible assets, consist of the following:
| Deferred Charges And Other Assets | ||||||||||||||||||||||||||
| December 31, | ||||||||||||||||||||||||||
| 2015 | 2014 | |||||||||||||||||||||||||
| Period Of | ||||||||||||||||||||||||||
| Asset | Reserve | Net | Asset | Reserve | Net | Amortization | ||||||||||||||||||||
| (amounts in thousands) | ||||||||||||||||||||||||||
| Deferred contracts and other agreements |
$ | 1,788 | $ | 1,442 | $ | 346 | $ | 1,788 | $ | 1,374 | $ | 414 | Term of contract | |||||||||||||
| Leasehold premium |
735 | 426 | 309 | 846 | 515 | 331 | Less than 1 year | |||||||||||||||||||
| Other definitive-lived assets |
861 | 836 | 25 | 833 | 833 | — | 3 years | |||||||||||||||||||
|
|
|
|
|
|
|
|
|
|
|
|
|
|||||||||||||||
| Total definite-lived intangibles |
3,384 | 2,704 | 680 | 3,467 | 2,722 | 745 | ||||||||||||||||||||
| Debt issuance costs |
23,154 | 16,457 | 6,697 | 23,154 | 13,594 | 9,560 | Term of debt | |||||||||||||||||||
| Prepaid assets - long-term |
2,233 | — | 2,233 | 467 | — | 467 | ||||||||||||||||||||
| Software costs and other |
6,367 | 4,043 | 2,324 | 5,665 | 3,198 | 2,467 | ||||||||||||||||||||
|
|
|
|
|
|
|
|
|
|
|
|
|
|||||||||||||||
| $ | 35,138 | $ | 23,204 | $ | 11,934 | $ | 32,753 | $ | 19,514 | $ | 13,239 | |||||||||||||||
|
|
|
|
|
|
|
|
|
|
|
|
|
|||||||||||||||
The following table presents the various categories of amortization expense, including deferred financing expense which is reflected as interest expense:
| Amortization Expense | ||||||||||||
| Deferred Charges And Other Assets | ||||||||||||
| For The Years Ended December 31, | ||||||||||||
| 2015 | 2014 | 2013 | ||||||||||
| (amounts in thousands) | ||||||||||||
| Definite-lived assets |
$ | 150 | $ | 147 | $ | 203 | ||||||
| Deferred financing expense |
2,863 | 3,860 | 3,870 | |||||||||
| Software costs |
850 | 899 | 800 | |||||||||
|
|
|
|
|
|
|
|||||||
| Total |
$ | 3,863 | $ | 4,906 | $ | 4,873 | ||||||
|
|
|
|
|
|
|
|||||||
The following table presents the Company’s estimate of amortization expense, for each of the five succeeding years for: (1) deferred charges and other assets; and (2) definite-lived assets:
| Future Amortization Expense | ||||||||||||
| Definite-Lived | ||||||||||||
| Total | Other | Assets | ||||||||||
| (amounts in thousands) | ||||||||||||
| Years ending December 31, |
||||||||||||
| 2016 |
$ | 3,711 | $ | 3,626 | 85 | |||||||
| 2017 |
2,391 | 2,313 | 78 | |||||||||
| 2018 |
1,585 | 1,511 | 74 | |||||||||
| 2019 |
1,043 | 971 | 72 | |||||||||
| 2020 |
70 | — | 70 | |||||||||
| Thereafter |
301 | — | 301 | |||||||||
|
|
|
|
|
|
|
|||||||
| Total |
$ | 9,101 | $ | 8,421 | $ | 680 | ||||||
|
|
|
|
|
|
|
|||||||
57
Table of Contents
| 6. | OTHER CURRENT LIABILITIES |
Other current liabilities consist of the following as of the periods indicated:
| Other Current Liabilities | ||||||||
| December 31, | ||||||||
| 2015 | 2014 | |||||||
| (amounts in thousands) | ||||||||
| Accrued compensation |
$ | 8,865 | $ | 5,783 | ||||
| Accounts receivable credits |
3,575 | 2,398 | ||||||
| Advertiser obligations |
1,198 | 928 | ||||||
| Accrued interest payable |
3,547 | 2,777 | ||||||
| Other |
2,739 | 1,613 | ||||||
|
|
|
|
|
|||||
| Total other current liabilities |
$ | 19,924 | $ | 13,499 | ||||
|
|
|
|
|
|||||
| 7. | OTHER LONG-TERM LIABILITIES |
Deferred Rent Liabilities
Under the Company’s leases, the Company recognizes: (1) escalated rents, including any rent-free periods, on a straight-line basis over the term of the lease for those lease agreements where the Company receives the right to control the use of the entire leased property at the beginning of the lease term; (2) amortization expense over the shorter of the economic lives of the leasehold assets or the lease term, excluding any lease renewals unless the lease renewals are reasonably assured; (3) landlord incentive payments to the Company as deferred rent that is amortized as reductions to lease rent expense over the lease term; and (4) rental costs associated with ground or building operating leases, that are incurred during a construction period, as rental expense.
For those leasehold improvements acquired in a business combination or acquired subsequent to lease inception, the amortization period is based on the lesser of the useful life of the leasehold improvements or the period of the lease including all renewal periods that are reasonably assured of exercise at the time of the acquisition.
The following table reflects deferred rent liabilities included under other long-term liabilities:
| Deferred Rent Liabilities | ||||||||
| December 31, | ||||||||
| 2015 | 2014 | |||||||
| (amounts in thousands) | ||||||||
| Deferred rent liabilities |
$ | 6,137 | $ | 5,120 | ||||
|
|
|
|
|
|||||
58
Table of Contents
| 8. | LONG-TERM DEBT |
Long-term debt, including financing method lease obligations, was comprised of the following:
| Long-Term Debt | ||||||||
| December 31, | ||||||||
| 2015 | 2014 | |||||||
| (amounts in thousands) | ||||||||
| Credit Facility |
||||||||
| Revolver, due November 23, 2016 |
$ | 26,000 | $ | — | ||||
| Term B Loan, due November 23, 2018 |
242,750 | 262,000 | ||||||
| Senior Notes |
||||||||
| 10.5% senior unsecured notes, due December 1, 2019 |
220,000 | 220,000 | ||||||
|
|
|
|
|
|||||
| Total |
488,750 | 482,000 | ||||||
| Current amount of long-term debt |
(31,832 | ) | (3,000 | ) | ||||
| Unamortized original issue discount |
(1,731 | ) | (2,071 | ) | ||||
|
|
|
|
|
|||||
| Total long-term debt |
$ | 455,187 | $ | 476,929 | ||||
|
|
|
|
|
|||||
| Outstanding standby letter of credit |
$ | 670 | $ | 620 | ||||
|
|
|
|
|
|||||
(A) Senior Debt
The Credit Facility
As of December 31, 2015, the amount outstanding under the term loan component (the “Term B Loan”) of the Company’s senior secured credit facility (the “Credit Facility”) was $242.8 million and the amount outstanding under the revolving credit facility (the “Revolver”) of the Credit Facility was $26.0 million. The amount available under the Revolver, which includes the impact of outstanding letters of credit, was $13.3 million as of December 31, 2015.
On November 23, 2011, the Company entered into a credit agreement with a syndicate of lenders for a $425 million Credit Facility that was initially comprised of: (a) a $50 million Revolver (reduced to $40 million in December 2015) that matures on November 23, 2016; and (b) a $375 million Term B Loan that matures on November 23, 2018.
The Credit Facility is secured by a pledge of 100% of the capital stock and other equity interest in all of the Company’s wholly owned subsidiaries. In addition, the Credit Facility is secured by a lien on substantially all of the Company’s assets, with limited exclusions (including the Company’s real property). The assets securing the Credit Facility are subject to customary release provisions which would enable the Company to sell such assets free and clear of encumbrance, subject to certain conditions and exceptions.
The Term B Loan requires mandatory prepayments equal to 50% of Excess Cash Flow, as defined within the agreement, subject to incremental step-downs to 0%, depending on the Consolidated Leverage Ratio. The Excess Cash Flow payment is due in the first quarter of each year and is based on the Excess Cash Flow and Leverage Ratio for the prior year. The Excess Cash Flow payment due in the first quarter of 2016, net of prepayments made through December 31, 2015, is included under the current portion of long-term debt. The Company expects to fund the payment using cash from operating activities.
Management believes that over the next 12 months the Company can continue to maintain compliance with its financial covenants. The Company’s operating cash flow is positive, and management believes that it is adequate to fund the Company’s operating needs and mandatory debt repayments under the Company’s Credit Facility. As of December 31, 2015, the Company is in compliance with all financial covenants and all other terms of the Credit Facility in all material respects. The Company’s ability to maintain compliance with its covenants is highly dependent on its results of operations.
The amount outstanding under the Revolver as of December 31, 2015 was primarily used to partially fund an acquisition described under Note 18. During December 2015, the Company reduced the total Revolver capacity from $50 million to $40 million. The Company anticipates that it will use funds from operations to fully retire the Revolver, which matures on November 23, 2016. Management believes that cash on hand and cash from operating activities will be sufficient to permit the Company to meet its liquidity requirements over the next 12 months, including its debt repayments. The Company cannot determine if and when a new revolving credit line would be entered into to replace the Revolver when it expires as market conditions may impact the timing and the Company’s performance may impact the pricing.
59
Table of Contents
The Credit Facility requires the Company to maintain compliance with certain financial covenants which are defined terms within the agreement, including:
| • | a maximum Consolidated Leverage Ratio that cannot exceed 4.75 times as of December 31, 2015 and which decreases to 4.5 times as of March 31, 2016 and thereafter; and |
| • | a minimum Consolidated Interest Coverage Ratio of 2.0 times as of December 31, 2015 and thereafter. |
As of December 31, 2015, the Company’s Consolidated Leverage Ratio was 4.4 times and the Consolidated Interest Coverage Ratio was 3.1 times.
The Term B Loan was last amended on December 2, 2013 which reduced the interest rates. Under the December 2, 2013 amendment of the Term B Loan and depending on the Consolidated Leverage Ratio, the Company may elect an interest rate per annum equal to: (1) the Eurodollar London Interbank Offered Rate (“LIBOR”) plus fees of 3.0%; and (2) the Base Rate plus fees of 2.0%. The Term B Loan includes a LIBOR floor of 1.0%.
Under the Revolver and depending on the Consolidated Leverage Ratio, the Company may elect an interest rate per annum equal to: (1) LIBOR plus fees that can range from 4.5% to 5.0%; or (2) the Base Rate plus fees that can range from 3.5% to 4.0%, where the Base Rate is the highest of: (a) the administrative agent’s prime rate; (b) the Federal Funds Rate plus 0.5%; and (c) LIBOR plus 1.0%. In addition, the Revolver requires the Company to pay a commitment fee of 0.5% per annum for the unused amount of the Revolver.
Failure to comply with the Company’s financial covenants or other terms of its Credit Facility and any subsequent failure to negotiate and obtain any required relief from its lenders could result in a default under the Company’s Credit Facility. Any event of default could have a material adverse effect on the Company’s business and financial condition. In addition, a default under either the Company’s Credit Facility or the indenture governing the Company’s Senior Notes could cause a cross default in the other instrument and result in the acceleration of the maturity of all outstanding debt. The acceleration of the Company’s debt could have a material adverse effect on its business. The Company may seek from time to time to amend its Credit Facility or obtain other funding or additional funding, which may result in higher interest rates.
(B) Senior Unsecured Debt
The Senior Notes
The Senior Notes may be redeemed at any time on or after December 1, 2015 at a redemption price of 105.25% of the principal amount plus accrued interest. The redemption price decreases over time.
On November 23, 2011, the Company issued $220.0 million of 10.5% unsecured Senior Notes which mature on December 1, 2019. The Company received net proceeds of $212.7 million, which included a discount of $2.9 million, and incurred deferred financing costs of $6.1 million. These amounts are amortized over the term under the effective interest rate method. Interest on the Senior Notes is payable semi-annually in arrears on June 1 and December 1 of each year.
The Senior Notes are in minimum denominations of $2,000. The Senior Notes are unsecured and rank: (1) senior in right of payment to the Company’s future subordinated debt; (2) equally in right of payment with all of the Company’s existing and future senior debt; (3) effectively subordinated to the Company’s existing and future secured debt (including the debt under the Company’s Credit Facility), to the extent of the value of the collateral securing such debt; and (4) structurally subordinated to all of the liabilities of the Company’s subsidiaries that do not guarantee the Senior Notes, to the extent of the assets of those subsidiaries.
Financial statements of the subsidiaries are not included in accordance with Rule 3-10 of Regulation S-X as: (1) Entercom Communications Corp., after excluding all subsidiaries (the “Parent Company”), has no independent assets or operations; (2) Entercom Radio, LLC (“Radio”) is a 100% owned finance subsidiary of the Parent Company; (3) the Parent Company has guaranteed the Credit Facility and Senior Notes; (4) all of the Parent Company’s direct and indirect subsidiaries other than Radio have guaranteed the Credit Facility and Senior Notes; (5) all of the guarantees are full and unconditional (subject to the customary automatic release provisions); and (6) all of the guarantees are joint and several.
60
Table of Contents
Radio, which is a wholly owned subsidiary of the Parent Company, holds the ownership interest in various subsidiary companies that own the operating assets, including broadcasting licenses, permits, authorizations and cash royalties. Radio is the borrower under the Credit Facility and is the issuer of the Senior Notes. The assets securing both the Credit Facility and the Senior Notes are subject to customary release provisions which would enable the Company to sell such assets free and clear of encumbrance, subject to certain conditions and exceptions.
Under certain covenants, the Company’s subsidiary guarantors are restricted from paying dividends or distributions in excess of amounts defined under the Senior Notes, and the subsidiary guarantors are limited in their ability to incur additional indebtedness under certain restrictive covenants. See Note 21 for financial statements of the Parent Company.
A default under the Company’s Senior Notes could cause a default under the Company’s Credit Facility. Any event of default, therefore, could have a material adverse effect on the Company’s business and financial condition.
(C) Net Interest Expense
The components of net interest expense are as follows:
| Net Interest Expense | ||||||||||||
| Years Ended December 31, | ||||||||||||
| 2015 | 2014 | 2013 | ||||||||||
| (amounts in thousands) | ||||||||||||
| Interest expense |
$ | 34,764 | $ | 34,656 | $ | 40,091 | ||||||
| Amortization of deferred financing costs |
2,863 | 3,860 | 3,870 | |||||||||
| Amortization of original issue discount of senior notes |
340 | 305 | 274 | |||||||||
| Interest income and other investment income |
(6 | ) | — | (3 | ) | |||||||
|
|
|
|
|
|
|
|||||||
| Total net interest expense |
$ | 37,961 | $ | 38,821 | $ | 44,232 | ||||||
|
|
|
|
|
|
|
|||||||
The weighted average interest rate under the Credit Facility (before taking into account the fees on the unused portion of the Revolver) was: (1) 4.1% as of December 31, 2015; and (2) 4.0% as of December 31, 2014.
(D) Interest Rate Transactions
As of December 31, 2015 and 2014, there were no derivative interest rate transactions outstanding.
The Company from time to time enters into interest rate transactions with different lenders to diversify its risk associated with interest rate fluctuations of its variable rate debt. Under these transactions, the Company agrees with other parties (participating members of the Company’s Credit Facility) to exchange, at specified intervals, the difference between fixed rate and floating rate interest amounts calculated by reference to an agreed notional principal amount against the variable debt.
The Company formally documents all relationships between hedging instruments and hedged items, as well as its risk-management objective and strategy for undertaking various hedge transactions. This process includes ongoing effectiveness assessments by relating all derivatives that are designated as fair value or cash flow hedges to specific assets and liabilities on the balance sheet or to specific firm commitments or forecasted transactions. The Company’s derivative activities, all of which are for purposes other than trading, are initiated within the guidelines of corporate risk-management policies. The Company reviews the correlation and effectiveness of its derivatives on a periodic basis.
The Company’s credit exposure under these hedging agreements, or similar agreements the Company may enter into in the future, is the cost of replacing such agreements in the event of nonperformance by the Company’s counterparty. For those interest rate transactions that may be entered into with the same counterparty, the Company will enter into a master netting agreement that would allow, under certain circumstances, the Company and the counterparty to settle financial assets and liabilities on a net basis.
61
Table of Contents
(E) Aggregate Principal Maturities
The minimum aggregate principal maturities on the Company’s outstanding debt (excluding any impact from required principal payments based upon the Company’s future operating performance) are as follows:
| Principal Debt Maturities | ||||||||||||
| Credit Facility |
Senior Notes |
Total | ||||||||||
| (amounts in thousands) | ||||||||||||
| Years ending December 31: |
||||||||||||
| 2016 |
$ | 31,832 | $ | — | $ | 31,832 | ||||||
| 2017 |
168 | — | 168 | |||||||||
| 2018 |
236,750 | — | 236,750 | |||||||||
| 2019 |
— | 220,000 | 220,000 | |||||||||
| 2020 |
— | — | — | |||||||||
| Thereafter |
— | — | — | |||||||||
|
|
|
|
|
|
|
|||||||
| Total |
$ | 268,750 | $ | 220,000 | $ | 488,750 | ||||||
|
|
|
|
|
|
|
|||||||
(F) Outstanding Letters Of Credit
The Company is required to maintain standby letters of credit in connection with insurance coverage as described in Note 20.
(G) Guarantor and Non-Guarantor Financial Information
Radio, which is a wholly owned subsidiary of Entercom Communications Corp., holds the ownership interest in various subsidiary companies that own the operating assets, including broadcasting licenses, permits and authorizations. Radio (1) is the borrower under the Credit Facility, as described in Note 8(A); and (2) is the issuer of the Senior Notes, as described in Note 8(B). As of December 31, 2015, Entercom Communications Corp. and each direct and indirect subsidiary of Radio is a guarantor of Radio’s obligations under both the Credit Facility and the Senior Notes.
Separate condensed consolidating financial information is not included as Entercom Communications Corp. does not have independent assets or operations, Radio is a 100% owned finance subsidiary of Entercom Communications Corp., and all guarantees by Entercom Communications Corp. and its guarantor subsidiaries are full, unconditional (subject to the customary automatic release provisions), joint and several under its Credit Facility and are full, unconditional, joint and several under its Senior Notes.
Under the Credit Facility, Radio is permitted to make distributions to Entercom Communications Corp. in amounts as defined, which are required to pay Entercom Communications Corp.’s reasonable overhead costs, including income taxes and other costs associated with conducting the operations of Radio and its subsidiaries.
Under the indenture governing the Senior Notes, Radio is permitted to make distributions to Entercom Communications Corp. in amounts, as defined, that are required to pay Entercom Communications Corp’s overhead costs and other costs associated with conducting the operations of Radio and its subsidiaries.
| 9. | PERPETUAL CUMULATIVE CONVERTIBLE PREFERRED STOCK |
In connection with an acquisition on July 16, 2015 as described in Note 18, Business Combinations, the Company issued perpetual cumulative convertible preferred stock (“Preferred”) that ranks senior to common stock in its capital structure. The payment of dividends on the Preferred and the repayment of the liquidation preference of the Preferred will take preference over any dividends or other payments to the Company’s common shareholders. The Preferred is convertible by the holder into a fixed number of 1.9 million shares at a price of $14.35, subject to customary anti-dilution provisions after a three-year waiting period. At certain times (including during the first three years after issuance), the Company can redeem the Preferred in cash at a price of 100%. The dividend rate on the Preferred increases over time from 6% to 12%. Due to the legal obligation to pay cumulative dividends as a liquidation preference, the dividends are accrued as they are earned instead of when they are declared.
62
Table of Contents
The Company reflected the Preferred as mezzanine due to a change in control contingency provision that provides the holder with a redeemable feature. For accounting purposes, the Preferred is not considered mandatorily redeemable at the holder’s option until the contingency is met.
The Company incurred issuance costs, which are recorded as a reduction of the Preferred. The following table reflects the Preferred shares authorized, issued and outstanding:
| December 31, 2015 |
December 31, 2014 |
|||||||
| (amounts in thousands, except shares) |
||||||||
| Perpetual cumulative convertible preferred stock $0.01 par value |
||||||||
| Shares issued and outstanding |
11 | — | ||||||
|
|
|
|
|
|||||
| Aggregate liquidation preference |
$ | 27,500 | $ | — | ||||
| Less stock issuance costs |
(220 | ) | — | |||||
| Plus accrued dividend as of the end of period |
339 | — | ||||||
|
|
|
|
|
|||||
| Net carrying value |
$ | 27,619 | $ | — | ||||
|
|
|
|
|
|||||
| 10. | SHAREHOLDERS’ EQUITY |
Class B Common Stock
Shares of Class B common stock are transferable only to Joseph M. Field, David J. Field, certain of their family members, their estates and trusts for any of their benefit. Upon any other transfer, shares of Class B common stock automatically convert into shares of Class A common stock on a one-for-one basis.
Dividends
The Company does not currently pay, and has not paid, dividends on its common stock since 2008. Any future dividends will be at the discretion of the Board of Directors based upon the relevant factors at the time of such consideration, including, without limitation, compliance with the restrictions set forth in the Credit Facility, the indenture governing the Senior Notes and the Preferred. The payment of dividends on the Preferred and the repayment of the liquidation preference of the Preferred will take preference over any dividends or other payments to the Company’s common stockholders.
Under the Credit Facility, the Company has $40 million available for dividends, share repurchases, investments and debt repurchases, which can be used when its pro forma Consolidated Leverage Ratio is less than or equal to the maximum Leverage Ratio permitted at the time. The amount available can increase over time based upon the Company’s financial performance and used when its pro forma Consolidated Leverage Ratio is less than or equal to the maximum Leverage Ratio permitted at the time. There are certain other limitations that apply to its use.
The following table presents a summary of the Company’s dividend activity as of December 31, 2015:
| Equity Type |
Record Date |
Payment Date |
Dividends Per Share |
Aggregate Payment Amount |
||||||||
| Perpetual convertible cumulative preferred stock |
October 15, 2015 | October 16, 2015 | $ | 37,500.00 | $ | 412,500 | ||||||
Dividend Equivalents
The Company’s grants of restricted stock units (“RSUs”) include the right, upon vesting, to receive a cash payment equal to the aggregate amount of dividends, if any, that holders would have received on the shares of common stock underlying their RSUs if such RSUs had been vested during the period.
63
Table of Contents
The following table presents the amounts accrued and unpaid on unvested RSUs:
| Balance Sheet Location |
Dividend Equivalent Liabilities | |||||||||
| December 31, | ||||||||||
| 2015 | 2014 | |||||||||
| (amounts in thousands) | ||||||||||
| Long-term |
Other long-term liabilities |
$ | 210 | $ | 216 | |||||
|
|
|
|
|
|||||||
Deemed Stock Repurchase When RSUs Vest
Upon vesting of RSUs, a tax obligation is created for both the employer and the employee. Unless employees elect to pay their tax withholding obligations in cash, the Company withholds shares of stock in an amount sufficient to cover their tax withholding obligations. The withholding of these shares by the Company is deemed to be a repurchase of its stock.
The following table provides summary information on the deemed repurchase of vested RSUs:
| Years Ended December 31, | ||||||||||||
| 2015 | 2014 | 2013 | ||||||||||
| (amounts in thousands) | ||||||||||||
| Shares of stock deemed repurchased |
132 | 142 | 186 | |||||||||
|
|
|
|
|
|
|
|||||||
| Amount recorded as financing activity |
$ | 1,562 | $ | 1,514 | $ | 1,640 | ||||||
|
|
|
|
|
|
|
|||||||
| 11. | NET INCOME (LOSS) PER COMMON SHARE |
Net income per common share is calculated as basic net income per share and diluted net income per share. Basic net income per share excludes dilution and is computed by dividing net income available to common shareholders by the weighted average number of common shares outstanding for the period. Diluted net income per share is computed in the same manner as basic net income after assuming issuance of common stock for all potentially dilutive equivalent shares, which includes the potential dilution that could occur: (1) if the RSUs with service conditions were fully vested (using the treasury stock method); (2) if all of the Company’s outstanding stock options that are in-the-money were exercised (using the treasury stock method); (3) if the RSUs with service and market conditions were considered contingently issuable; (4) if the RSUs with service and performance conditions were considered contingently issuable; and (5) if the perpetual cumulative convertible preferred stock was converted (using the as if converted method).
The Company considered the allocation of undistributed net income for multiple classes of common stock and determined that it was appropriate to allocate undistributed net income between the Company’s Class A and Class B common stock on an equal basis. For purposes of making this determination, the Company’s charter provides that the holders of Class A and Class B common stock have equal rights and privileges except with respect to voting on most matters voted by Joseph Field or David Field.
64
Table of Contents
The following tables present the computations of basic and diluted net income (loss) per share:
| Year Ended December 31, | ||||||||||||
| 2015 | 2014 | 2013 | ||||||||||
| (amounts in thousands, except share and per share data) |
||||||||||||
| Basic Income (Loss) Per Share |
||||||||||||
| Numerator |
||||||||||||
| Net income (loss) available to the Company |
$ | 29,184 | $ | 26,823 | $ | 26,024 | ||||||
| Preferred stock dividends |
752 | — | — | |||||||||
|
|
|
|
|
|
|
|||||||
| Net income (loss) available to common shareholders |
$ | 28,432 | $ | 26,823 | $ | 26,024 | ||||||
|
|
|
|
|
|
|
|||||||
| Denominator |
||||||||||||
| Basic weighted average shares outstanding |
38,083,647 | 37,763,353 | 37,417,807 | |||||||||
|
|
|
|
|
|
|
|||||||
| Basic net income (loss) per share available to common shareholders |
$ | 0.75 | $ | 0.71 | $ | 0.70 | ||||||
|
|
|
|
|
|
|
|||||||
| Diluted Income (Loss) Per Share |
||||||||||||
| Numerator |
||||||||||||
| Net income (loss) available to the Company |
$ | 29,184 | $ | 26,823 | $ | 26,024 | ||||||
| Preferred stock dividends |
752 | — | — | |||||||||
|
|
|
|
|
|
|
|||||||
| Net income (loss) available to common shareholders |
$ | 28,432 | $ | 26,823 | $ | 26,024 | ||||||
|
|
|
|
|
|
|
|||||||
| Denominator |
||||||||||||
| Basic weighted average shares outstanding |
38,083,647 | 37,763,353 | 37,417,807 | |||||||||
| Effect of RSUs and options under the treasury stock method |
953,976 | 900,713 | 883,688 | |||||||||
|
|
|
|
|
|
|
|||||||
| Diluted weighted average shares outstanding |
39,037,623 | 38,664,066 | 38,301,495 | |||||||||
|
|
|
|
|
|
|
|||||||
| Diluted net income (loss) per share available to common shareholders |
$ | 0.73 | $ | 0.69 | $ | 0.68 | ||||||
|
|
|
|
|
|
|
|||||||
Incremental Shares Disclosed As Anti-Dilutive
The following table provides the incremental shares excluded as they were anti-dilutive:
| Impact Of Equity Awards | ||||||||||||
| Years Ended December 31, | ||||||||||||
| 2015 | 2014 | 2013 | ||||||||||
| (amounts in thousands, except per share data) | ||||||||||||
| Dilutive or anti-dilutive for all potentially dilutive equivalent shares |
dilutive | dilutive | dilutive | |||||||||
| Excluded shares as anti-dilutive under the treasury stock method: |
||||||||||||
| Options excluded |
14 | 30 | 37 | |||||||||
|
|
|
|
|
|
|
|||||||
| Price range of options excluded: from |
$ | 11.24 | $ | 10.11 | $ | 10.52 | ||||||
|
|
|
|
|
|
|
|||||||
| Price range of options excluded: to |
$ | 11.78 | $ | 33.90 | $ | 48.21 | ||||||
|
|
|
|
|
|
|
|||||||
| RSUs with service conditions |
8 | 1 | 4 | |||||||||
|
|
|
|
|
|
|
|||||||
| Excluded RSUs with service and market conditions as market conditions not met |
165 | 193 | — | |||||||||
|
|
|
|
|
|
|
|||||||
| Excluded RSUs with service and performance conditions until performance criteria is probable |
29 | 11 | — | |||||||||
|
|
|
|
|
|
|
|||||||
| Excluded preferred stock as anti-dilutive under the as if method |
882 | — | — | |||||||||
|
|
|
|
|
|
|
|||||||
| 12. | TOWER SALE AND LEASEBACK |
During the second quarter of 2013, the Company: (1) recorded current and deferred gains of $1.6 million and $9.9 million, respectively, from the sale of certain towers; and (2) applied sale and leaseback accounting to the leases that the Company had entered into for radio station space on these same towers. All of the leases were accounted for as operating leases.
65
Table of Contents
The current gain was included in 2013 in the statement of operations under net (gain) loss on sale or disposal of assets. The deferred gain is amortized on a straight-line basis over the 16.5 year life of the leases and during this period the gain will be reflected as a net (gain) loss on sale or disposal of assets.
Minimum rental commitments at December 31, 2015 for these non-cancellable leases are included within the operating lease commitment table under Note 20.
| 13. | SHARE-BASED COMPENSATION |
Equity Compensation Plan
Under the Entercom Equity Compensation Plan (the “Plan”), the Company is authorized to issue share-based compensation awards to key employees, directors and consultants. The RSUs and options that have been issued generally vest over periods of up to four years. The options expire ten years from the date of grant. The Company issues new shares of Class A common stock upon the exercise of stock options and the later of vesting or issuance of RSUs.
On January 1 of each year, the number of shares of Class A common stock authorized under the Plan is automatically increased by 1.5 million, or a lesser number as may be determined by the Company’s Board of Directors. The Board of Directors elected to forego the January 1, 2015 and January 1, 2016 increase in the shares available for grant. As of December 31, 2015, the shares available for grant were 2.5 million shares.
The Plan includes certain performance criteria for purposes of satisfying expense deduction requirements for income tax purposes.
Accounting For Share-Based Compensation
The measurement and recognition of compensation expense, for all share-based payment awards made to employees and directors, is based on estimated fair values. The fair value is determined at the time of grant: (1) using the Company’s stock price for RSUs; and (2) using the Black Scholes model for options. The value of the portion of the award that is ultimately expected to vest is recognized as expense over the requisite service periods in the Company’s consolidated statements of operations. Estimated forfeitures are revised, if necessary, in subsequent periods if actual forfeitures differ from those estimates.
66
Table of Contents
RSU Activity
The following is a summary of the changes in RSUs under the Plan during the current period:
| Number | Weighted | Aggregate | ||||||||||||||||
| Of | Weighted | Average | Intrinsic | |||||||||||||||
| Restricted | Average | Remaining | Value As Of | |||||||||||||||
| Stock | Purchase | Contractual | December 31, | |||||||||||||||
| Period Ended | Units | Price | Term (Years) | 2015 | ||||||||||||||
| RSUs outstanding as of: |
December 31, 2014 | 1,258,685 | ||||||||||||||||
| RSUs awarded |
795,693 | |||||||||||||||||
| RSUs released |
(406,463 | ) | ||||||||||||||||
| RSUs forfeited |
(57,498 | ) | ||||||||||||||||
|
|
|
|||||||||||||||||
| RSUs outstanding as of: |
December 31, 2015 | 1,590,417 | $ | — | 1.1 | $ | 18,051,233 | |||||||||||
|
|
|
|
|
|
|
|
|
|||||||||||
| RSUs vested and expected to vest as of: |
December 31, 2015 | 1,512,428 | $ | — | 1.0 | $ | 16,242,396 | |||||||||||
|
|
|
|
|
|
|
|
|
|||||||||||
| RSUs exercisable (vested and deferred) as of: |
December 31, 2015 | 81,380 | $ | — | — | $ | 923,663 | |||||||||||
|
|
|
|
|
|
|
|
|
|||||||||||
| Weighted average remaining recognition period in years |
1.8 | |||||||||||||||||
|
|
|
|||||||||||||||||
| Unamortized compensation expense, net of estimated forfeitures |
$ | 7,988,821 | ||||||||||||||||
|
|
|
|||||||||||||||||
The following table presents additional information on RSU activity:
| Years Ended December 31, | ||||||||||||||||||||||||
| 2015 | 2014 | 2013 | ||||||||||||||||||||||
| Shares | Amount | Shares | Amount | Shares | Amount | |||||||||||||||||||
| (amounts in thousands, except per share) | ||||||||||||||||||||||||
| RSUs issued |
796 | $ | 9,045 | 685 | $ | 5,754 | 361 | $ | 2,906 | |||||||||||||||
| RSUs forfeited - service based |
(58 | ) | (709 | ) | (47 | ) | (727 | ) | (64 | ) | (685 | ) | ||||||||||||
| RSUs forfeited - market based |
— | — | — | — | (200 | ) | (2,110 | ) | ||||||||||||||||
|
|
|
|
|
|
|
|
|
|
|
|
|
|||||||||||||
| Net RSUs issued and increase (decrease) to paid-in capital |
738 | $ | 8,336 | 638 | $ | 5,027 | 97 | $ | 111 | |||||||||||||||
|
|
|
|
|
|
|
|
|
|
|
|
|
|||||||||||||
| Weighted average grant date fair value per share |
$ | 11.36 | $ | 8.40 | $ | 8.05 | ||||||||||||||||||
|
|
|
|
|
|
|
|||||||||||||||||||
| Fair value of shares vested per share |
$ | 11.85 | $ | 10.58 | $ | 8.76 | ||||||||||||||||||
|
|
|
|
|
|
|
|||||||||||||||||||
| RSUs vested and released |
406 | 410 | 547 | |||||||||||||||||||||
|
|
|
|
|
|
|
|||||||||||||||||||
RSUs With Service And Market Conditions
The Company issued RSUs with service and market conditions that are included in the table above. These shares vest if: (1) the Company’s stock achieves certain shareholder performance targets over a defined measurement period; and (2) the employee fulfills a minimum service period. The compensation expense is recognized even if the market conditions are not satisfied and are only reversed in the event the service period is not met, as all of the conditions need to be satisfied. These RSUs are amortized over the longest of the explicit, implicit or derived service periods, which range from one to two years.
67
Table of Contents
The following table presents the changes in outstanding RSUs with market conditions:
| Years Ended December 31, | ||||||||||||
| 2015 | 2014 | 2013 | ||||||||||
| (amounts in thousands, except per share data) | ||||||||||||
| Reconciliation Of RSUs With Market Conditions |
||||||||||||
| Beginning of period balance |
290 | — | 200 | |||||||||
| Number of RSUs granted |
165 | 290 | — | |||||||||
| Number of RSUs forfeited |
— | — | (200 | ) | ||||||||
| Number of RSUs vested |
(65 | ) | — | — | ||||||||
|
|
|
|
|
|
|
|||||||
| End of period balance |
390 | 290 | — | |||||||||
|
|
|
|
|
|
|
|||||||
| Average fair value of RSUs issued with market conditions |
$ | 8.39 | $ | 6.90 | $ | — | ||||||
|
|
|
|
|
|
|
|||||||
The fair value of RSUs with service conditions is estimated using the Company’s closing stock price on the date of the grant. To determine the fair value of RSUs with service and market conditions, the Company used the Monte Carlo simulation lattice model. The Company’s determination of the fair value was based on the number of shares granted, the Company’s stock price on the date of grant and certain assumptions regarding a number of highly complex and subjective variables. If other reasonable assumptions were used, the results could differ.
The specific assumptions used for these valuations are as follows:
| Years Ended | ||||
| December 31, | ||||
| 2015 | 2014 | |||
| Expected Volatility Structure (1) |
34% to 39% | 33% to 42% | ||
| Risk Free Interest Rate (2) |
0.1% to 1.1% | 0.1% to 0.4% | ||
| Dividend Yield (3) |
0.0% | 0.0% | ||
| (1) | Expected Volatility Term Structure - The Company estimated the volatility term structure using: (1) the historical volatility of its stock; and (2) the implied volatility provided by its traded options from a trailing month’s average of the closing bid-ask price quotes. |
| (2) | Risk-Free Interest Rate - The Company estimated the risk-free interest rate based upon the implied yield available on U.S. Treasury issues using the Treasury bond rate as of the date of grant. |
| (3) | Dividend Yield - The Company calculated the dividend yield at the time of grant based upon the Company’s most recent history of not paying a dividend on its common stock. |
RSUs With Service And Performance Conditions
In addition to the RSUs included in the table above summarizing the activity in RSUs under the Plan, the Company issued RSUs with both service and performance conditions. Vesting of performance-based awards, if any, is dependent upon the achievement of certain performance targets. If the performance standards are not achieved, all unvested shares will expire and any accrued expense will be reversed. The Company determines the requisite service period on a case-by-case basis to determine the expense recognition period for non-vested performance based RSUs. The fair value is determined based upon the closing price of the Company’s common stock on the date of grant. The Company applies a quarterly probability assessment in computing its non-cash compensation expense and any change in the estimate is reflected as a cumulative adjustment to expense in the quarter of the change.
68
Table of Contents
The following table reflects the activity of RSUs with service and performance conditions:
| Years Ended December 31, | ||||||||||||
| 2015 | 2014 | 2013 | ||||||||||
| (amounts in thousands, except per share data) | ||||||||||||
| Reconciliation Of RSUs With Performance Conditions |
||||||||||||
| Beginning of period balance |
8 | — | — | |||||||||
| Number of RSUs granted |
21 | 11 | — | |||||||||
| Number of RSUs that did not meet criteria |
— | (3 | ) | — | ||||||||
| Number of RSUs vested |
— | — | — | |||||||||
|
|
|
|
|
|
|
|||||||
| End of period balance |
29 | 8 | — | |||||||||
|
|
|
|
|
|
|
|||||||
| Average fair value of RSUs issued with performance conditions |
$ | 11.11 | $ | 9.60 | $ | — | ||||||
|
|
|
|
|
|
|
|||||||
As of December 31, 2015, no non-cash compensation expense was accrued.
Option Activity
The following table presents the option activity during the current year ended under the Plan:
| Weighted | Intrinsic | |||||||||||||||||
| Weighted | Average | Value | ||||||||||||||||
| Average | Remaining | As Of | ||||||||||||||||
| Number Of | Exercise | Contractual | December 31, | |||||||||||||||
| Period Ended | Options | Price | Term (Years) | 2015 | ||||||||||||||
| Options outstanding as of: |
December 31, 2014 | 486,675 | $ | 2.11 | ||||||||||||||
| Options granted |
— | — | ||||||||||||||||
| Options exercised |
(11,750 | ) | 3.02 | |||||||||||||||
| Options forfeited |
(3,750 | ) | 8.72 | |||||||||||||||
| Options expired |
(4,250 | ) | 13.63 | |||||||||||||||
|
|
|
|||||||||||||||||
| Options outstanding as of: |
December 31, 2015 | 466,925 | $ | 1.93 | 3.1 | $ | 4,401,204 | |||||||||||
|
|
|
|
|
|
|
|
|
|||||||||||
| Options vested and expected to vest as of: |
December 31, 2015 | 466,925 | $ | 1.93 | 3.1 | $ | 4,401,204 | |||||||||||
|
|
|
|
|
|
|
|
|
|||||||||||
| Options vested and exercisable as of: |
December 31, 2015 | 466,925 | $ | 1.93 | 3.1 | $ | 4,401,204 | |||||||||||
|
|
|
|
|
|
|
|
|
|||||||||||
| Weighted average remaining recognition period in years |
— | |||||||||||||||||
|
|
|
|||||||||||||||||
| Unamortized compensation expense, net of estimated forfeitures |
$ | 10,307 | ||||||||||||||||
|
|
|
|||||||||||||||||
The following table summarizes significant ranges of outstanding and exercisable options as of the current period:
| Options Outstanding | Options Exercisable | |||||||||||||||||||||||||
| Number Of | Weighted | Number Of | ||||||||||||||||||||||||
| Options | Average | Weighted | Options | Weighted | ||||||||||||||||||||||
| Range Of | Outstanding | Remaining | Average | Exercisable | Average | |||||||||||||||||||||
| Exercise Prices | December 31, | Contractual | Exercise | December 31, | Exercise | |||||||||||||||||||||
| From | To | 2015 | Life | Price | 2015 | Price | ||||||||||||||||||||
| $ | 1.34 | $ | 1.34 | 432,925 | 3.1 | $ | 1.34 | 432,925 | $ | 1.34 | ||||||||||||||||
| $ | 2.02 | $ | 11.78 | 34,000 | 2.7 | $ | 9.50 | 34,000 | $ | 9.50 | ||||||||||||||||
|
|
|
|
|
|||||||||||||||||||||||
| $ | 1.34 | $ | 11.78 | 466,925 | 3.1 | $ | 1.93 | 466,925 | $ | 1.93 | ||||||||||||||||
|
|
|
|
|
|
|
|
|
|
|
|
|
|
|
|||||||||||||
69
Table of Contents
The following table provides summary information on the granting and vesting of options:
| Years Ended December 31, | ||||||||||||||||||||||||
| Option Issuance And Exercise Data |
2015 | 2014 | 2013 | |||||||||||||||||||||
| (amounts in thousands except for per share and years) | ||||||||||||||||||||||||
| From | To | From | To | From | To | |||||||||||||||||||
| Exercise price range of options issued |
$ | — | $ | — | $ | — | $ | — | $ | 8.72 | $ | 8.72 | ||||||||||||
|
|
|
|
|
|
|
|
|
|
|
|
|
|||||||||||||
| Upon vesting, period to exercise in years |
— | — | — | — | 1 | 10 | ||||||||||||||||||
|
|
|
|
|
|
|
|
|
|
|
|
|
|||||||||||||
| Fair value per share upon grant |
$ | — | $ | — | $ | 6.07 | ||||||||||||||||||
|
|
|
|
|
|
|
|||||||||||||||||||
| Fair value per share upon exercise |
$ | 8.57 | $ | 8.99 | $ | 7.15 | ||||||||||||||||||
|
|
|
|
|
|
|
|||||||||||||||||||
| Intrinsic value of options exercised |
$ | 101 | $ | 517 | $ | 1,228 | ||||||||||||||||||
|
|
|
|
|
|
|
|||||||||||||||||||
| Tax benefit from options exercised (1) |
$ | 38 | $ | 196 | $ | 466 | ||||||||||||||||||
|
|
|
|
|
|
|
|||||||||||||||||||
| Cash received from exercise price of options exercised |
$ | 35 | $ | 82 | $ | 245 | ||||||||||||||||||
|
|
|
|
|
|
|
|||||||||||||||||||
| Number of options granted |
— | — | 5 | |||||||||||||||||||||
|
|
|
|
|
|
|
|||||||||||||||||||
| (1) | Amount excludes impact from suspended income tax benefits and/or valuation allowances. |
Valuation Of Options
The Company estimates the fair value of option awards on the date of grant using an option-pricing model. The Company used the straight-line single option method for recognizing compensation expense, which was reduced for estimated forfeitures based on awards ultimately expected to vest. The Company’s determination of the fair value of share-based payment awards on the date of grant using an option-pricing model is affected by the Company’s stock price, as well as assumptions regarding a number of highly complex and subjective variables. These variables include, but are not limited to, the Company’s expected stock price volatility over the term of the awards, and actual and projected employee stock option exercise behaviors. Option-pricing models were developed for use in estimating the value of traded options that have no vesting or hedging restrictions and are fully transferable. The Company’s stock options have certain characteristics that are different from traded options, and changes in the subjective assumptions could affect the estimated value.
For options granted, the Company used the Black-Scholes option-pricing model and determined: (1) the term by using the simplified plain-vanilla method as the Company’s employee exercise history may not be indicative for estimating future exercises; (2) a historical volatility over a period commensurate with the expected term, with the observation of the volatility on a daily basis; (3) a risk-free interest rate that was consistent with the expected term of the stock options and based on the U.S. Treasury yield curve in effect at the time of the grant; and (4) an annual dividend yield based upon the Company’s most recent quarterly dividend at the time of grant.
The following table presents the range of the assumptions used to determine the fair value:
| Option Valuation Estimates | ||||||||
| Years Ended December 31, | ||||||||
| 2015 | 2014 | 2013 | ||||||
| Expected life (years) |
6.3 | |||||||
| Expected volatility factor (%) |
no options | no options | 78.8 | |||||
| Risk-free interest rate (%) |
issued | issued | 2.0 | |||||
| Expected dividend yield (%) |
— | |||||||
70
Table of Contents
Recognized Non-Cash Stock-Based Compensation Expense
The following non-cash stock-based compensation expense, which is comprised primarily of RSUs, is included in each of the respective line items in our statement of operations:
| Years Ended December 31, | ||||||||||||
| 2015 | 2014 | 2013 | ||||||||||
| (amounts in thousands) | ||||||||||||
| Station operating expenses |
$ | 1,259 | $ | 919 | $ | 766 | ||||||
| Corporate general and administrative expenses |
4,265 | 4,313 | 3,504 | |||||||||
|
|
|
|
|
|
|
|||||||
| Stock-based compensation expense included in operating expenses |
5,524 | 5,232 | 4,270 | |||||||||
| Income tax benefit (1) |
2,036 | 1,502 | 1,080 | |||||||||
|
|
|
|
|
|
|
|||||||
| Net stock-based compensation expense |
$ | 3,488 | $ | 3,730 | $ | 3,190 | ||||||
|
|
|
|
|
|
|
|||||||
| (1) | Amount excludes impact from suspended income tax benefits and/or valuation allowances. |
| 14. | INCOME TAXES |
Effective Tax Rate - Overview
The Company’s effective income tax rate may be impacted by: (1) changes in the level of income in any of the Company’s taxing jurisdictions; (2) changes in the statutes and rules applicable to taxable income in the jurisdictions in which the Company operates; (3) changes in the expected outcome of income tax audits; (4) changes in the estimate of expenses that are not deductible for tax purposes; (5) income taxes in certain states where the states’ current taxable income is dependent on factors other than the Company’s consolidated net income; and (6) adding facilities in states that on average have different income tax rates from states in which the Company currently operates and the resulting effect on previously reported temporary differences between the tax and financial reporting bases of the Company’s assets and liabilities. The Company’s annual effective tax rate may also be materially impacted by tax expense associated with non-amortizable assets such as broadcasting licenses and goodwill and changes in the deferred tax valuation allowance.
An impairment loss for financial statement purposes will result in an income tax benefit during the period incurred as the amortization of broadcasting licenses and goodwill is deductible for income tax purposes.
Expected And Reported Income Taxes (Benefit)
Income tax expense (benefit) computed using the United States federal statutory rates is reconciled to the reported income tax expense (benefit) as follows:
| Years Ended December 31, | ||||||||||||
| 2015 | 2014 | 2013 | ||||||||||
| (amounts in thousands) | ||||||||||||
| Federal statutory income tax rate |
35 | % | 35 | % | 35 | % | ||||||
| Computed tax expense at federal statutory rates on income before income taxes |
$ | 16,667 | $ | 16,357 | $ | 16,975 | ||||||
| State income tax expense, net of federal benefit |
1,333 | 2,491 | 3,399 | |||||||||
| Non-recognition of expense due to full valuation allowance |
(244 | ) | — | 54 | ||||||||
| Tax benefit shortfall associated with share-based awards |
12 | 62 | 997 | |||||||||
| Nondeductible expenses and other |
669 | 1,001 | 1,051 | |||||||||
|
|
|
|
|
|
|
|||||||
| Income taxes |
$ | 18,437 | $ | 19,911 | $ | 22,476 | ||||||
|
|
|
|
|
|
|
|||||||
71
Table of Contents
For 2015
The effective income tax rate was 38.7%. This rate was higher than the federal statutory rate of 35% primarily due to the combination of: (1) an increase in net deferred tax liabilities associated with non-amortizable assets such as broadcasting licenses and goodwill; (2) an adjustment for expenses that are not deductible for tax purposes; and (3) a tax benefit shortfall associated with share-based awards.
The income tax rate has been trending down as expenses not deductible for tax purposes have decreased due to the issuance to senior management of a higher percentage of awards that were market based. Effective during the second half of 2015, the estimated annual income tax rate increased due to the impact of acquisitions on the Company’s state income apportionments to states with higher income tax rates. This increase was offset by a discrete state income tax credit due to recent legislation that allowed for the release of a partial valuation allowance in a certain single member state.
For 2014
The effective income tax rate was 42.6%. This rate was higher than the federal statutory rate of 35% primarily due to the combination of: (1) an increase in net deferred tax liabilities associated with non-amortizable assets such as broadcasting licenses and goodwill; (2) an adjustment for expenses that are not deductible for tax purposes; and (3) a tax benefit shortfall associated with share-based awards. In addition, the Company recorded a discrete tax benefit from legislatively reduced income tax rates in certain states.
For 2013
The effective income tax rate was 46.3%. This rate was higher than the federal statutory rate of 35% primarily due to the combination of: (1) an increase in net deferred tax liabilities associated with non-amortizable assets such as broadcasting licenses and goodwill; (2) an adjustment for expenses that are not deductible for tax purposes; and (3) a tax benefit shortfall associated with share-based awards.
Income Tax Expense
Income tax expense (benefit) for each year is summarized as follows:
| Years Ended December 31, | ||||||||||||
| 2015 | 2014 | 2013 | ||||||||||
| Current: |
||||||||||||
| Federal |
$ | 25 | $ | — | $ | — | ||||||
| State |
90 | 100 | 54 | |||||||||
|
|
|
|
|
|
|
|||||||
| Total current |
115 | 100 | 54 | |||||||||
|
|
|
|
|
|
|
|||||||
| Deferred: |
||||||||||||
| Federal |
17,042 | 17,373 | 19,051 | |||||||||
| State |
1,280 | 2,438 | 3,371 | |||||||||
|
|
|
|
|
|
|
|||||||
| Total deferred |
18,322 | 19,811 | 22,422 | |||||||||
|
|
|
|
|
|
|
|||||||
| Total income taxes (benefit) |
$ | 18,437 | $ | 19,911 | $ | 22,476 | ||||||
|
|
|
|
|
|
|
|||||||
Deferred Tax Assets And Deferred Tax Liabilities
The income tax accounting process to determine the Company’s deferred tax assets and liabilities involves estimating all temporary differences between the tax and financial reporting bases of the Company’s assets and liabilities based on tax laws and statutory tax rates applicable to the period in which the differences are expected to affect taxable income. These estimates include assessing the likely future tax consequences of events that have been recognized in the Company’s financial statements or tax returns. Changes to these estimates could have a future impact on the Company’s financial position or results of operations.
72
Table of Contents
The tax effects of significant temporary differences that comprise the net deferred tax assets and liabilities are as follows:
| December 31, | ||||||||
| 2015 | 2014 | |||||||
| (amounts in thousands) | ||||||||
| Deferred tax assets: |
||||||||
| Employee benefits |
$ | 783 | $ | 678 | ||||
| Deferred compensation |
988 | 588 | ||||||
| Provision for doubtful accounts |
835 | 959 | ||||||
| Deferred gain on tower transaction |
235 | 236 | ||||||
| Other |
987 | 505 | ||||||
|
|
|
|
|
|||||
| Total current deferred tax assets before valuation allowance |
3,828 | 2,966 | ||||||
| Valuation allowance |
(231 | ) | (620 | ) | ||||
|
|
|
|
|
|||||
| Total current deferred tax assets - net |
3,597 | 2,346 | ||||||
|
|
|
|
|
|||||
| Federal and state income tax loss carryforwards |
129,944 | 130,074 | ||||||
| Share-based compensation |
3,218 | 2,648 | ||||||
| Investments - impairments |
499 | 498 | ||||||
| Lease rental obligations |
3,440 | 2,289 | ||||||
| Deferred compensation |
3,968 | 4,322 | ||||||
| Deferred gain on tower transaction |
3,039 | 3,281 | ||||||
| Other non-current |
1,014 | 1,154 | ||||||
|
|
|
|
|
|||||
| Total non-current deferred tax assets before valuation allowance |
145,122 | 144,266 | ||||||
| Valuation allowance |
(20,407 | ) | (20,146 | ) | ||||
|
|
|
|
|
|||||
| Total non-current deferred tax assets - net |
124,715 | 124,120 | ||||||
|
|
|
|
|
|||||
| Total deferred tax assets |
$ | 128,312 | $ | 126,466 | ||||
|
|
|
|
|
|||||
| Deferred tax liabilities: |
||||||||
| Advertiser broadcasting obligations |
$ | (133 | ) | $ | (98 | ) | ||
|
|
|
|
|
|||||
| Total current deferred tax liabilities |
(133 | ) | (98 | ) | ||||
|
|
|
|
|
|||||
| Deferral of gain recognition on the extinguishment of debt |
(4,568 | ) | (6,119 | ) | ||||
| Property, equipment and certain intangibles (other than broadcasting licenses and goodwill) |
4,804 | 5,579 | ||||||
| Broadcasting licenses and goodwill |
(206,594 | ) | (187,050 | ) | ||||
|
|
|
|
|
|||||
| Total non-current deferred tax liabilities |
(206,358 | ) | (187,590 | ) | ||||
|
|
|
|
|
|||||
| Total deferred tax liabilities |
$ | (206,491 | ) | $ | (187,688 | ) | ||
|
|
|
|
|
|||||
| Total net deferred tax liabilities |
$ | (78,179 | ) | $ | (61,222 | ) | ||
|
|
|
|
|
|||||
Valuation Allowance For Deferred Tax Assets
Judgment is required in estimating valuation allowances for deferred tax assets. Deferred tax assets are reduced by a valuation allowance if an assessment of their components indicates that it is more likely than not that all or some portion of these assets will not be realized. The realization of a deferred tax asset ultimately depends on the existence of sufficient taxable income in the carryforward periods under tax law. The Company periodically assesses the need for valuation allowances for deferred tax assets based on more-likely-than-not realization threshold criteria. In the Company’s assessment, appropriate consideration is given to all positive and negative evidence related to the realization of the deferred tax assets. This assessment considers, among other matters, forecasts of future profitability, the duration of statutory carryforward periods and any ownership change limitations under Internal Revenue Code Section 382 on the Company’s future income that can be used to offset historic losses.
As changes occur in the Company’s assessments regarding its ability to recover its deferred tax assets, the Company’s tax provision is increased in any period in which the Company determines that the recovery is not probable.
73
Table of Contents
The following table presents the changes in the deferred tax asset valuation allowance for the periods indicated:
| Increase | Increase | |||||||||||||||
| (Decrease) | (Decrease) | |||||||||||||||
| Charged | Charged | |||||||||||||||
| (Credited) | (Credited) | |||||||||||||||
| Balance At | To Income | To | Balance At | |||||||||||||
| Beginning | Taxes | Balance | End Of | |||||||||||||
| Year Ended |
Of Year | (Benefit) | Sheet | Year | ||||||||||||
| (amounts in thousands) | ||||||||||||||||
| December 31, 2015 |
$ | 20,766 | $ | (165 | ) | $ | 37 | $ | 20,638 | |||||||
| December 31, 2014 |
20,238 | 528 | — | 20,766 | ||||||||||||
| December 31, 2013 |
18,333 | 1,905 | — | 20,238 | ||||||||||||
Liabilities For Uncertain Tax Positions
The Company recognizes liabilities for uncertain tax positions based on whether evidence indicates that it is more likely than not that the position will be sustained on audit. It is inherently difficult and subjective to estimate such amounts, as this requires the Company to estimate the probability of various possible outcomes. The Company reevaluates these uncertain tax positions on a quarterly basis. Changes in assumptions may result in the recognition of a tax benefit or an additional charge to the tax provision.
The Company classifies interest and penalties that are related to income tax liabilities as a component of income tax expense. The income tax liabilities and accrued interest and penalties are presented as non-current liabilities, as payments are not anticipated within one year of the balance sheet date. These non-current income tax liabilities are recorded in other long-term liabilities in the consolidated balance sheets.
The Company’s liabilities for uncertain tax positions are reflected in the following table:
| December 31, | ||||||||
| 2015 | 2014 | |||||||
| (amounts in thousands) | ||||||||
| Liabilities for uncertain tax positions |
||||||||
| Tax |
$ | 67 | $ | 67 | ||||
| Interest and penalties |
170 | 150 | ||||||
|
|
|
|
|
|||||
| Total |
$ | 237 | $ | 217 | ||||
|
|
|
|
|
|||||
The amounts for interest and penalties expense reflected in the statements of operations were eliminated in the statements of cash flows under net deferred taxes (benefit) and other as no cash payments were made during these periods.
The following table presents the expense (income) for uncertain tax positions, which amounts were reflected in the consolidated statements of operations as an increase (decrease) to income tax expense:
| Years Ended December 31, | ||||||||||||
| 2015 | 2014 | 2013 | ||||||||||
| (amounts in thousands) | ||||||||||||
| Interest and penalties (income) |
20 | 18 | 11 | |||||||||
|
|
|
|
|
|
|
|||||||
| Total income taxes (benefit) from uncertain tax positions |
$ | 20 | $ | 18 | $ | 11 | ||||||
|
|
|
|
|
|
|
|||||||
The increase in liabilities for uncertain tax positions for 2015 primarily reflects the addition of interest related to existing uncertain tax positions.
74
Table of Contents
The following table presents the gross amount of changes in unrecognized tax benefits:
| Years Ended December 31, | ||||||||||||
| 2015 | 2014 | 2013 | ||||||||||
| (amounts in thousands) | ||||||||||||
| Beginning of year balance |
$ | (7,690 | ) | $ | (7,690 | ) | $ | (7,690 | ) | |||
| Prior year positions |
||||||||||||
| Gross Increases |
— | — | — | |||||||||
| Gross Decreases |
— | — | — | |||||||||
| Current year positions |
||||||||||||
| Gross Increases |
— | — | — | |||||||||
| Gross Decreases |
— | — | — | |||||||||
| Settlements with tax authorities |
— | — | — | |||||||||
| Reductions due to statute lapse |
— | — | — | |||||||||
|
|
|
|
|
|
|
|||||||
| End of year balance |
$ | (7,690 | ) | $ | (7,690 | ) | $ | (7,690 | ) | |||
|
|
|
|
|
|
|
|||||||
| Ending liability balance included above that was reflected as an offset to deferred tax assets |
$ | (7,623 | ) | $ | (7,623 | ) | $ | (7,623 | ) | |||
|
|
|
|
|
|
|
|||||||
The gross amount of the Company’s unrecognized tax benefits is reflected in the above table which, if recognized, would impact the Company’s effective income tax rate in the period of recognition. The total amount of unrecognized tax benefits could increase or decrease within the next 12 months for a number of reasons including the expiration of statutes of limitations, audit settlements and tax examination activities.
As of December 31, 2015, there were no significant unrecognized net tax benefits (exclusive of interest and penalties) that over the next 12 months are subject to the expiration of various statutes of limitation. Interest and penalties accrued on uncertain tax positions are released upon the expiration of statutes of limitations.
Federal And State Income Tax Audits
The Company is subject to federal and state income tax audits from time to time that could result in proposed assessments. Management believes that the Company has made sufficient tax provisions for tax periods that are within the statutory period of limitations not previously audited and that are potentially open for examination by the taxing authorities. Potential liabilities associated with these years will be resolved when an event occurs to warrant closure, primarily through the completion of audits by the taxing jurisdictions, or if the statute of limitations expires. To the extent audits or other events result in a material adjustment to the accrued estimates, the effect would be recognized during the period of the event. There can be no assurance, however, that the ultimate outcome of audits will not have a material adverse impact on the Company’s financial position, results of operations or cash flows.
The Company cannot predict with certainty how these audits will be resolved and whether the Company will be required to make additional tax payments, which may include penalties and interest. During 2010, the Company concluded an audit by the IRS with no proposed adjustment for the tax years of 2004 through 2008. For most states where the Company conducts business, the Company is subject to examination for the preceding three to six years. In certain states, the period could be longer.
Income Tax Payments, Refunds And Credits
The Company accrued a $0.1 million Alternative Minimum Tax (“AMT”) associated with expected income subject to tax for 2015, before the offset of available net operating loss carryforwards (“NOLs”). The AMT is available to be carried forward indefinitely to be used as a credit to offset future income tax liabilities.
75
Table of Contents
The following table provides the amount of income tax payments and income tax refunds for the periods indicated:
| Years Ended December 31, | ||||||||||||
| 2015 | 2014 | 2013 | ||||||||||
| (amounts in thousands) | ||||||||||||
| State income tax payments |
$ | 81 | $ | 79 | $ | 69 | ||||||
|
|
|
|
|
|
|
|||||||
| Federal and state income tax refunds |
$ | — | $ | 10 | $ | 5 | ||||||
|
|
|
|
|
|
|
|||||||
Net Operating Loss Carryforwards
The Company has recorded a valuation allowance for certain of its state NOLs as the Company does not expect to obtain a benefit in future periods. In addition, utilization in future years of the NOL carryforwards may be subject to limitations due to the changes in ownership provisions under Section 382 of the Internal Revenue Code and similar state provisions.
Windfall tax benefits will be recognized for book purposes and recorded to paid-in capital only when realized. The Company does not recognize a deferred tax asset for unrealized tax benefits associated with the tax deductions in excess of the compensation recorded (excess tax benefit). The Company applies the “with and without” approach for utilization of tax attributes upon realization of NOLs in the future. This method allocates stock-based compensation benefits last among other tax benefits recognized.
The NOLs reflected in the following table exclude these windfall stock compensation deductions. In addition, the NOLs reflect an estimate of the NOLs for the 2015 tax filing year as these returns will not be filed until later in 2016:
| Net Operating Losses | ||||||||||
| December 31, 2015 | ||||||||||
| Suspended | ||||||||||
| NOLs | Windfall | NOL Expiration Period | ||||||||
| (amounts in thousands) | (in years) | |||||||||
| Federal NOL carryforwards |
$ | 292,800 | $ | 10,799 | 2030 to 2035 | |||||
|
|
|
|
|
|||||||
| State NOL carryforwards |
$ | 614,834 | $ | 8,806 | 2016 to 2034 | |||||
|
|
|
|
|
|||||||
| State income tax credit |
$ | 1,248 | to 2018 | |||||||
|
|
|
|||||||||
76
Table of Contents
| 15. | SUPPLEMENTAL CASH FLOW DISCLOSURES ON NON-CASH INVESTING AND FINANCING ACTIVITIES |
The following table provides non-cash disclosures during the periods indicated:
| Years Ended December 31, | ||||||||||||
| 2015 | 2014 | 2013 | ||||||||||
| (amounts in thousands) | ||||||||||||
| Operating Activities |
||||||||||||
| Barter revenues |
$ | 4,002 | $ | 3,826 | $ | 3,821 | ||||||
|
|
|
|
|
|
|
|||||||
| Barter expenses |
$ | 4,258 | $ | 3,665 | $ | 3,766 | ||||||
|
|
|
|
|
|
|
|||||||
| Financing Activities |
||||||||||||
| Increase in paid-in capital from the issuance of RSUs |
$ | 9,045 | $ | 5,754 | $ | 2,906 | ||||||
| Decrease in paid-in capital from the forfeiture of RSUs |
(709 | ) | (727 | ) | (2,795 | ) | ||||||
|
|
|
|
|
|
|
|||||||
| Net paid-in capital of RSUs issued (forfeited) |
$ | 8,336 | $ | 5,027 | $ | 111 | ||||||
|
|
|
|
|
|
|
|||||||
| Perpetual cumulative convertible preferred stock issued in connection with an acquisition |
$ | 27,500 | $ | — | $ | — | ||||||
|
|
|
|
|
|
|
|||||||
| Dividend accrued on perpetual cumulative convertible preferred stock |
$ | 339 | $ | — | $ | — | ||||||
|
|
|
|
|
|
|
|||||||
| Retirement of finance method lease obligations and other |
$ | — | $ | — | $ | 12,679 | ||||||
|
|
|
|
|
|
|
|||||||
| Investing Activities |
||||||||||||
| Net radio station assets given up in a market |
$ | 59,000 | $ | — | $ | — | ||||||
|
|
|
|
|
|
|
|||||||
| Net radio station assets acquired in a market |
$ | 59,000 | $ | — | $ | — | ||||||
|
|
|
|
|
|
|
|||||||
| Radio station assets acquired through the issuance of perpetual cumulative convertible preferred stock |
$ | 27,500 | $ | — | $ | — | ||||||
|
|
|
|
|
|
|
|||||||
| 16. | EMPLOYEE SAVINGS AND BENEFIT PLANS |
Deferred Compensation Plans
The Company provides certain of its employees and the Board of Directors with an opportunity to defer a portion of their compensation on a tax-favored basis. The obligations by the Company to pay these benefits under the deferred compensation plans represent unsecured general obligations that rank equally with the Company’s other unsecured indebtedness. Amounts deferred under these plans were included in other long-term liabilities in the consolidated balance sheets. Any change in the deferred compensation liability for each period is recorded to corporate general and administrative expenses and to station operating expenses in the statement of operations.
| Years Ended December 31, | ||||||||||||
| Benefit Plan Disclosures |
2015 | 2014 | 2013 | |||||||||
| (amounts in thousands) | ||||||||||||
| Deferred compensation |
||||||||||||
| Beginning of period balance |
$ | 11,017 | $ | 10,459 | $ | 8,377 | ||||||
| Employee compensation deferrals |
534 | 420 | 369 | |||||||||
| Employee compensation payments |
(1,464 | ) | (734 | ) | (297 | ) | ||||||
| Increase (decrease) in plan fair value |
50 | 872 | 2,010 | |||||||||
|
|
|
|
|
|
|
|||||||
| End of period balance |
$ | 10,137 | $ | 11,017 | $ | 10,459 | ||||||
|
|
|
|
|
|
|
|||||||
401(k) Savings Plan
The Company has a savings plan which is intended to be qualified under Section 401(k) of the Internal Revenue Code. The plan is a defined contribution plan, available to all eligible employees, and allows participants to contribute up to the legal maximum of their eligible compensation, not to exceed the maximum tax-deferred amount allowed by the Internal Revenue Service. The Company’s discretionary matching contribution is subject to certain conditions. The Company’s contributions for 2015, 2014 and 2013 were $0.9 million, $0.8 million and $0.9 million, respectveily.
77
Table of Contents
| 17. | FAIR VALUE OF FINANCIAL INSTRUMENTS |
Fair Value Of Financial Instruments Subject To Fair Value Measurements
The Company has determined the types of financial assets and liabilities subject to fair value measurement are: (1) certain tangible and intangible assets subject to impairment testing as described in Note 4; (2) financial instruments as described in Note 8; (3) interest rate derivative transactions that are outstanding from time to time (none currently outstanding); (4) deemed deferred compensation plans as described in Note 16; and (5) lease abandonment liabilities as described in Note 18.
The fair value is the price that would be received upon the sale of an asset or be paid to transfer a liability in an orderly transaction between market participants at the measurement date (exit price). The Company utilizes market data or assumptions that market participants would use in pricing the asset or liability, including assumptions about risk and the risks inherent to the inputs of the valuation technique. These inputs can be readily observable, market corroborated, or generally unobservable. The Company utilizes valuation techniques that maximize the use of observable inputs and minimize the use of unobservable inputs. The fair value hierarchy prioritizes the inputs used to measure fair value. The hierarchy assigns the highest priority to unadjusted quoted prices in active markets for identical assets or liabilities (Level 1 measurement) and the lowest priority to unobservable inputs (Level 3 measurement).
The three levels of the fair value hierarchy are as follows:
Level 1 – Quoted prices are available in active markets for identical assets or liabilities as of the reporting date.
Level 2 – Pricing inputs are other than quoted prices in active markets included in Level 1, which are either directly or indirectly observable as of the reported date.
Level 3 – Pricing inputs include significant inputs that are generally less observable than objective sources. These inputs may be used with internally developed methodologies that result in management’s best estimate of fair value. At each balance sheet date, the Company performs an analysis of all instruments and includes in Level 3 all of those whose fair value is based on significant unobservable inputs.
Recurring Fair Value Measurements
The following table sets forth the Company’s financial assets and/or liabilities that were accounted for at fair value on a recurring basis and are classified in their entirety based on the lowest level of input that is significant to the fair value measurement. The Company’s assessment of the significance of a particular input to the fair value measurement requires judgment and may affect the valuation of fair value and its placement within the fair value hierarchy levels.
| Value Measurements At Reporting Date | ||||||||
| December 31, | ||||||||
| Description |
2015 | 2014 | ||||||
| (amounts in thousands) | ||||||||
| Liabilities |
||||||||
| Deferred compensation - Level 1 (1) |
$ | 10,137 | $ | 11,017 | ||||
|
|
|
|
|
|||||
| (1) | The Company’s deferred compensation liability, which is included in other long-term liabilities, is recorded at fair value on a recurring basis. The unfunded plan allows participants to hypothetically invest in various specified investment options. The deferred compensation plan liability is valued at Level 1 as it is based on quoted market prices of the underlying investments. |
Non-Recurring Fair Value Measurements
The Company has certain assets that are measured at fair value on a non-recurring basis and are adjusted to fair value only when the carrying values are more than the fair values. The categorization of the framework used to price the assets is considered Level 3, due to the subjective nature of the unobservable inputs used to determine the fair value.
78
Table of Contents
The Company reviewed the fair value of its broadcasting licenses, goodwill and net property and equipment and other intangibles, and concluded that these assets were not impaired as the fair value of these assets equaled or exceeded their carrying values.
During 2013, the Company determined that land it had reclassified as held for sale was in excess of the fair value less the cost to sell. The Company measured $2.1 million of land held for sale using significant unobservable inputs (Level 3) and recorded an impairment loss of $0.9 million. This land was later sold in October 2014.
Fair Value Of Financial Instruments Subject To Disclosures
The estimated fair value of financial instruments is determined using the best available market information and appropriate valuation methodologies. Considerable judgment is necessary, however, in interpreting market data to develop the estimates of fair value. Accordingly, the estimates presented are not necessarily indicative of the amounts that the Company could realize in a current market exchange, or the value that ultimately will be realized upon maturity or disposition. The use of different market assumptions may have a material effect on the estimated fair value amounts.
The carrying amount of the following assets and liabilities approximates fair value due to the short maturity of these instruments: (1) cash and cash equivalents; (2) accounts receivable; and (3) accounts payable, including accrued liabilities.
The following table presents the carrying value of financial instruments and, where practicable, the fair value as of the periods indicated:
| December 31, | December 31, | |||||||||||||||
| 2015 | 2014 | |||||||||||||||
| Carrying | Fair | Carrying | Fair | |||||||||||||
| Value | Value | Value | Value | |||||||||||||
| (amounts in thousands) | ||||||||||||||||
| Term B Loan (1) |
$ | 242,750 | $ | 242,447 | $ | 262,000 | $ | 261,345 | ||||||||
|
|
|
|
|
|
|
|
|
|||||||||
| Revolver (2) |
$ | 26,000 | $ | 26,000 | $ | — | $ | — | ||||||||
|
|
|
|
|
|
|
|
|
|||||||||
| Senior Notes (3) |
$ | 218,269 | $ | 227,000 | $ | 217,929 | $ | 237,134 | ||||||||
|
|
|
|
|
|
|
|
|
|||||||||
| Letters of credit (4) |
$ | 670 | $ | 620 | ||||||||||||
|
|
|
|
|
|||||||||||||
The following methods and assumptions were used to estimate the fair value of financial instruments:
| (1) | The Company’s determination of the fair value of the Term B Loan was based on quoted prices for this instrument and is considered a Level 2 measurement as the pricing inputs are other than quoted prices in active markets. |
| (2) | The fair value of the Revolver is considered to approximate the carrying value as the interest payments are based on LIBOR that reset periodically. The Revolver is considered a Level 2 measurement as the pricing inputs are other than quoted prices in active markets. |
| (3) | The Company utilizes a Level 2 valuation input based upon the market trading prices of the Senior Notes to compute the fair value as these Senior Notes are traded in the debt securities market. The Senior Notes are considered a Level 2 measurement as the pricing inputs are other than quoted prices in active markets. |
| (4) | The Company does not believe it is practicable to estimate the fair value of the outstanding standby letters of credit and does not expect any material loss since the performance of the letters of credit is not likely to be required. |
79
Table of Contents
| 18. | BUSINESS COMBINATIONS |
The Company consummated acquisitions under the purchase method of accounting, and the purchase price was allocated to the assets and liabilities based upon their respective fair values as determined as of the acquisition date. Merger and acquisition costs are excluded from the purchase price as these costs are expensed for book purposes and amortized for tax purposes.
2015 Acquisitions
Acquisition Of Lincoln Financial Media Company
On July 16, 2015, the Company acquired under a Stock Purchase Agreement (“SPA”) with The Lincoln National Life Insurance Company the stock of one of its subsidiaries, Lincoln Financial Media Company (“Lincoln”), which hold through subsidiaries the assets and liabilities of radio stations serving the Atlanta, Denver, Miami and San Diego markets. The purchase price was $105.0 million of which: (1) $77.5 million was paid in cash using $42.0 million in borrowing under the Company’s Revolver together with cash on hand; and (2) $27.5 million was paid with the Company’s issuance of Preferred. The SPA, originally dated December 7, 2014 and subsequently amended on July 10, 2015, provided for a working capital reimbursement to Lincoln of $11.0 million before a working capital credit to the Company of $2.7 million. The SPA provided for a step-up in basis for tax purposes.
Three Denver radio stations acquired from Lincoln together with another Denver radio station were included in an exchange transaction as described below in Note 18.
The Company recorded goodwill on its books, which is fully deductible for income tax purposes. Management believes that this acquisition provides the Company with an opportunity to increase its national footprint to compete more effectively for national business and to benefit from certain operational synergies. In addition, this acquisition allows for certain operational synergies in programming, sales and administration that were not available to Lincoln.
The preliminary purchase price allocations are based upon a preliminary valuation of assets and liabilities and the estimates and assumptions are subject to change as the Company obtains additional information during the measurement period, which may be up to one year from the acquisition date. The assets and liabilities pending finalization include the valuation of acquired intangible assets and working capital. Differences between the preliminary and final valuation could be substantially different from the initial estimates.
80
Table of Contents
The following table reflects the aggregate fair value purchase price allocation of these assets and liabilities and is management’s estimate.
| As Reported | As Revised | |||||||||||||||
| September 30, | December 31, | Useful Lives In Years | ||||||||||||||
| Description |
2015 | Adjustment | 2015 | From |
To | |||||||||||
| (Amounts in thousands) | ||||||||||||||||
| Cash |
$ | 2,246 | $ | $ | 2,246 | |||||||||||
| Net accounts receivable |
11,908 | 25 | 11,933 | less than 1 year | ||||||||||||
| Prepaid expenses, deposits and other |
953 | 17 | 970 | less than 1 year | ||||||||||||
|
|
|
|
|
|
|
|||||||||||
| Total current assets |
15,107 | 42 | 15,149 | |||||||||||||
|
|
|
|
|
|
|
|||||||||||
| Land |
7,368 | — | 7,368 | non-depreciating | ||||||||||||
| Land improvements |
87 | — | 87 | 15 | 15 | |||||||||||
| Building |
1,067 | — | 1,067 | 15 | 25 | |||||||||||
| Leasehold improvements |
973 | — | 973 | 2 | 11 | |||||||||||
| Equipment and towers |
8,651 | — | 8,651 | 3 | 40 | |||||||||||
| Furniture and fixtures |
29 | — | 29 | 5 | 5 | |||||||||||
|
|
|
|
|
|
|
|||||||||||
| Total tangible property |
18,175 | — | 18,175 | |||||||||||||
|
|
|
|
|
|
|
|||||||||||
| Assets held for sale |
1,885 | — | 1,885 | |||||||||||||
| Other intangibles |
487 | — | 487 | 1 | 5 | |||||||||||
| Broadcasting licenses |
79,209 | — | 79,209 | non-amortizing | ||||||||||||
| Goodwill |
5,866 | (1,364 | ) | 4,502 | non-amortizing | |||||||||||
| Deferred tax assets |
— | 1,364 | 1,364 | over remaining lease life | ||||||||||||
|
|
|
|
|
|
|
|||||||||||
| Total intangible and other assets |
87,447 | — | 87,447 | |||||||||||||
|
|
|
|
|
|
|
|||||||||||
| Total assets |
$ | 120,729 | $ | 42 | $ | 120,771 | ||||||||||
|
|
|
|
|
|
|
|||||||||||
| Accounts payable |
$ | 723 | $ | — | $ | 723 | less than 1 year | |||||||||
| Accrued expenses |
3,232 | 234 | 3,466 | less than 1 year | ||||||||||||
| Other current liabilities |
12 | — | 12 | less than 1 year | ||||||||||||
|
|
|
|
|
|
|
|||||||||||
| Total current liabilities |
3,967 | 234 | 4,201 | |||||||||||||
|
|
|
|
|
|
|
|||||||||||
| Unfavorable contracts and other liabilities |
3,272 | — | 3,272 | over remaining lease life | ||||||||||||
|
|
|
|
|
|
|
|||||||||||
| Total liabilities acquired |
$ | 7,239 | $ | 234 | $ | 7,473 | ||||||||||
|
|
|
|
|
|
|
|||||||||||
| Net assets acquired |
$ | 113,490 | $ | (192 | ) | $ | 113,298 | |||||||||
|
|
|
|
|
|
|
|||||||||||
The allocations as of December 31, 2015, were revised during the fourth quarter of 2015 due to: (1) a change in working capital based upon information that was not available at the time of the original estimate; and (2) the recording of a deferred tax asset associated with certain underlying unfavorable lease and contract liabilities, net of a deferred tax liability for a separate company state valuation allowance.
The allocations presented in the table are based upon management’s estimate of the fair values using valuation techniques including income, cost and market approaches. In estimating the fair value of the acquired assets and assumed liabilities, the fair value estimates are based on, but not limited to, expected future revenue and cash flows that assume expected future growth rates of 1.0% to 1.5%; and an estimated discount rate of 9.6%. The gross profit margins are similar to the ranges used in the Company’s second quarter 2015 annual license impairment testing. The fair value for accounts receivable is net of an estimate for bad debts. The Company determines the fair value of the broadcasting licenses in each of these markets by relying on a discounted cash flow approach assuming a start-up scenario in which the only assets held by an investor are broadcasting licenses. The Company’s fair value analysis contains assumptions based upon past experience, reflects expectations of industry observers and includes judgments about future performance using industry normalized information for an average station within a certain market. Any excess of the purchase price over the net assets acquired was reported as goodwill.
Exchange Transaction: Denver, Colorado, And Los Angeles, California
On November 24, 2015, the Company completed an asset exchange agreement (“AEA”) with Bonneville International Corporation (“Bonneville”) that was entered into on July 10, 2015. The Company divested four Denver, Colorado, radio stations as consideration by the Company in exchange for a radio station in Los Angeles,
81
Table of Contents
California. The Company, which did not require cash to complete this transaction, now owns: (1) one station in Los Angeles, a new market for the Company; and (2) five radio stations in the Denver market, an existing market for the Company. The Company recorded both the disposition and the acquisition on its balance sheet as of December 31, 2015.
On July 17, 2015 the Company entered into two TBAs. Pursuant to these TBAs, on July 17, 2015, the Company commenced operation of the Los Angeles station and Bonneville commenced operation of the Denver stations. During the period of the TBAs (July 17, 2015 through November 24, 2015), the Company: (i) included net revenues and station operating expenses associated with the Company’s operation of the Los Angeles station in the Company’s consolidated financial statements; and (ii) excluded net revenues and station operating expenses associated with Bonneville’s operation of the Denver stations in the Company’s consolidated financial statements. The Company incurred no TBA expense to Bonneville for operation of the Los Angeles station and received $0.3 million of monthly TBA income from Bonneville during the period of the TBA. The Company did not consider the net revenues and station operating expenses to be material to the Company’s financial position, results of operations or cash flows.
Certain of the Denver radio stations that were exchanged with Bonneville qualified as assets held for sale as of September 30, 2015. In addition, during the period of the TBA, certain of the assets and liabilities that were held in a trust (KKFN FM) and operated by Bonneville were deconsolidated by the Company as of September 30, 2015 as Bonneville was the primary beneficiary absorbing the majority of the profits and losses. For all other assets during the period of the TBA, the Company was the primary beneficiary absorbing the majority of the profits and losses. Upon closing, there were no remaining assets held for sale or outstanding VIEs related to this transaction.
The following preliminary purchase price allocations are based upon a preliminary valuation of assets and liabilities and the estimates and assumptions are subject to change as the Company obtains additional information during the measurement period, which may be up to one year from the acquisition date. The assets and liabilities pending finalization include the valuation of acquired intangible assets and liabilities. Differences between the preliminary and final valuation could be substantially different from the initial estimates.
| As Reported | As Revised | |||||||||||||||
| September 30, | December 31, | Useful Lives In Years | ||||||||||||||
| Description |
2015 | Adjustment | 2015 | From | To | |||||||||||
| (amounts in thousands) | ||||||||||||||||
| Other receivables |
$ | 4,175 | $ | 689 | $ | 4,864 | ||||||||||
|
|
|
|
|
|
|
|||||||||||
| Equipment |
1,012 | — | 1,012 | 3 | 15 | |||||||||||
| Furniture and fixtures |
121 | — | 121 | 5 | 5 | |||||||||||
|
|
|
|
|
|
|
|||||||||||
| Total tangible property |
1,133 | — | 1,133 | |||||||||||||
|
|
|
|
|
|
|
|||||||||||
| Advertiser lists and customer relationships |
1 | — | 1 | 3 | 3 | |||||||||||
| Trademarks and trade names |
2 | — | 2 | 5 | 5 | |||||||||||
| Broadcasting licenses |
53,371 | (314 | ) | 53,057 | non-amortizing | |||||||||||
| Goodwill |
641 | (375 | ) | 266 | non-amortizing | |||||||||||
|
|
|
|
|
|
|
|||||||||||
| Total intangible assets |
54,015 | (689 | ) | 53,326 | ||||||||||||
|
|
|
|
|
|
|
|||||||||||
| Total assets |
59,323 | — | 59,323 | |||||||||||||
| Unfavorable contract and lease liabilities |
(323 | ) | — | (323 | ) | 1 | 4 | |||||||||
|
|
|
|
|
|
|
|||||||||||
| Net assets acquired |
$ | 59,000 | $ | — | $ | 59,000 | ||||||||||
|
|
|
|
|
|
|
|||||||||||
| Fair value of net assets provided as consideration |
$ | 59,000 | $ | — | $ | 59,000 | ||||||||||
|
|
|
|
|
|
|
|||||||||||
The allocations as of December 31, 2015 were revised primarily to reflect a change in the original estimate of accounts receivable available for recovery.
The allocations presented in the table are based upon management’s estimate of the fair values using valuation techniques including income, cost and market approaches. In estimating the fair value of the acquired assets and assumed liabilities, the fair value estimates are based on, but not limited to, expected future revenue and cash flows that assumes the expected future growth rate of 1.0% and an estimated discount rate of 9.2%. The gross profit margin range was similar to the ranges used in the Company’s second quarter 2015 annual impairment testing for broadcasting licenses. The Company determines the fair value of the broadcasting licenses in each of these
82
Table of Contents
markets by relying on a discounted cash flow approach assuming a start-up scenario in which the only assets held by an investor are broadcasting licenses. The Company’s fair value analysis contains assumptions based upon past experience, reflects expectations of industry observers and includes judgments about future performance using industry normalized information for an average station within a certain market. Any excess of the purchase price over the net assets acquired was reported as goodwill.
In valuing the non-monetary assets that were part of the consideration transferred, the Company utilized the fair value as of the acquisition date, with any excess of the purchase price over the net assets acquired reported as goodwill. The fair value was measured from the perspective of a market participant, applying the same methodology and types of assumptions as described above in estimating the fair value of the acquired assets and liabilities. Applying these methodologies requires significant judgment. The Company reported in the statements of operations for the year ended December 31, 2015 a non cash gain of $1.5 million under gain (loss) on sale or disposal of assets on the Denver assets provided as consideration, primarily from the non-Lincoln assets included in the exchange.
Summary Of Lincoln And Bonneville Transactions By Radio Station
| Bonneville Exchange | ||||
| Markets |
Radio Stations |
Transactions | ||
| Los Angeles, CA |
KSWD FM | Company acquired from Bonneville | ||
| Denver, CO |
KOSI FM | Company disposed to Bonneville | ||
| Denver, CO |
KYGO FM; KEPN AM | Company disposed to Bonneville | ||
| Denver, CO |
KKFN FM | The trust disposed to Bonneville | ||
| Lincoln Acquisition | ||||
| Markets |
Radio Stations |
Transactions | ||
| Denver, CO |
KKFN FM | The trust acquired from Lincoln | ||
| Denver, CO |
KYGO FM; KEPN AM | Company acquired from Lincoln | ||
| Denver, CO |
KQKS FM; KRWZ AM | Company acquired from Lincoln | ||
| Atlanta, GA |
WSTR FM; WQXI AM | Company acquired from Lincoln | ||
| Miami, FL |
WAXY AM/FM; WLYF FM; WMXJ FM | Company acquired from Lincoln | ||
| San Diego, CA |
KBZT FM; KSON FM/KSOQ FM; KIFM FM | Company acquired from Lincoln | ||
Merger And Acquisition Costs And Restructuring Charges
Merger and acquisition costs and restructuring charges were expensed as a separate line item in the statement of operations. These costs consist primarily of legal, professional, advisory services and restructuring costs (as identified below) related to the Company’s acquisition of Lincoln and the Company’s exchange agreement with Bonneville.
During the third and fourth quarters of 2015, the Company initiated a restructuring plan primarily as a result of the integration of the Lincoln radio stations acquired in July 2015. The restructuring plan included: (1) costs associated with exiting contractual vendor obligations as these obligations were duplicative; (2) a workforce reduction and realignment charges that included one-time termination benefits and related costs; and (3) lease abandonment costs as described below. The estimated amount of unpaid restructuring charges as of December 31, 2015 were included in accrued expenses as most expenses are expected to be paid within one year.
In connection with the Lincoln acquisition, the Company assumed a studio lease in one of its markets that included excess space. During the fourth quarter of 2015, the Company ceased using a portion of the space after analyzing its future needs as well as comparing its space utilization in other of the Company’s markets. As a result, the Company recorded a lease abandonment expense during the fourth quarter of 2015. Lease abandonment costs include future lease liabilities offset by estimated sublease income. Due to the location of the space in an area of the city that is not considered prime, including a very high vacancy rate in the existing and neighboring building in a soft rental market that is expected to continue throughout the remaining term of the lease, the Company did not include an estimate to sublease any of the space. The Company will continue to evaluate the opportunities to sublease this space and revise its sublease estimates accordingly. Any increase in the estimate of sublease income will be reflected through the income statement and such amount will also reduce the lease abandonment liability. The lease expires in the year 2026. The lease liability is discounted using a credit risk adjusted basis utilizing the estimated rental cash flows over the remaining term of the agreement.
83
Table of Contents
| Years Ended December 31, | ||||||||||||
| 2015 | 2014 | 2013 | ||||||||||
| (amounts in thousands) | ||||||||||||
| Restructuring charges - beginning balance |
$ | — | $ | — | $ | — | ||||||
| Costs to exit duplicative contracts |
646 | — | — | |||||||||
| Workforce reduction |
1,538 | — | — | |||||||||
| Lease abandonment costs |
687 | — | — | |||||||||
| Changes in estimates |
(13 | ) | — | — | ||||||||
|
|
|
|
|
|
|
|||||||
| Total restructuring charges |
2,858 | — | — | |||||||||
| Merger and acquisition costs |
3,978 | 1,042 | — | |||||||||
|
|
|
|
|
|
|
|||||||
| Total merger & acquisition costs and restructuring charges |
$ | 6,836 | $ | 1,042 | $ | — | ||||||
|
|
|
|
|
|
|
|||||||
| Total restructuring charges |
$ | 2,858 | $ | — | $ | — | ||||||
| Deductions from reserves through payments |
(1,172 | ) | — | — | ||||||||
|
|
|
|
|
|
|
|||||||
| Restructuring charges unpaid and outstanding |
$ | 1,686 | $ | — | $ | — | ||||||
|
|
|
|
|
|
|
|||||||
Under purchase price accounting for the Lincoln and Bonneville acquisitions, the Company recorded unfavorable lease and contract liabilities for studio and transmitter site property leases and vendor contracts as these contracts contained terms that were considered to be above market rates. The unfavorable liabilities are reflected in other long-term liabilities in the consolidated balance sheets and are amortized as a reduction to station operating expenses on a straight-line basis over the lives of the leases and contracts. The future amortization of unfavorable leases and contracts is as follows:
| As Of December 31, 2015 |
||||
| (amounts in thousands) |
||||
| Years ending December 31, |
||||
| 2016 |
$ | 1,041 | ||
| 2017 |
875 | |||
| 2018 |
295 | |||
| 2019 |
167 | |||
| 2020 |
147 | |||
| Thereafter |
518 | |||
|
|
|
|||
| $ | 3,043 | |||
|
|
|
|||
Lease Abandonment Costs
During the second quarter of 2013, the Company entered into a sublease for previously abandoned studio space. As a result, the Company eliminated a lease abandonment liability of $0.7 million and recorded a reduction to station operating expenses of $0.6 million, net of broker’s commission. The lease expires during the third quarter of 2018.
Acquisitions For 2014 and 2013
There were no acquisitions during these periods.
Unaudited Pro Forma Summary Of Financial Information
The following pro forma information presents the consolidated results of operations as if the Lincoln and the Bonneville exchange transactions had occurred as of the beginning of the prior pro forma period presented, after giving effect to certain adjustments, including: (1) depreciation and amortization of assets; (2) amortization of unfavorable contracts related to the fair value adjustments of the assets acquired; (3) change in the effective tax rate;
84
Table of Contents
(4) interest expense on any debt incurred; (5) merger and acquisition costs and restructuring charges; and (6) accrued dividends on the Preferred. For purposes of this presentation, the pro forma data: (a) excludes certain Lincoln radio stations disposed to Bonneville as the Company never operated these stations and does not expect to operate these stations at a future time (KYGO FM; KKFN FM and KEPN AM); and (b) excludes a radio station disposed to Bonneville and operated by the Company prior to the TBA (KOSI FM) as these assets were a key component of the assets acquired. These unaudited pro forma results have been prepared for comparative purposes only and do not purport to be indicative of what would have occurred had the acquisitions been made as of that date or results which may occur in the future. No adjustments have been made to the 2013 financial data as presented.
| Years Ended December 31, | ||||||||||||
| 2015 | 2014 | 2013 | ||||||||||
| (amounts in thousands, except per share data) |
||||||||||||
| Pro Forma | Pro Forma | Actual | ||||||||||
| Net revenues |
$ | 442,485 | $ | 437,597 | $ | 377,618 | ||||||
|
|
|
|
|
|
|
|||||||
| Net income (loss) available to the Company |
$ | 33,050 | $ | 22,736 | $ | 26,024 | ||||||
|
|
|
|
|
|
|
|||||||
| Net income (loss) available to common shareholders |
$ | 30,850 | $ | 21,086 | $ | 26,024 | ||||||
|
|
|
|
|
|
|
|||||||
| Net income (loss) available to commons shareholders per common share - basic |
$ | 0.81 | $ | 0.56 | $ | 0.70 | ||||||
|
|
|
|
|
|
|
|||||||
| Net income (loss) available to commons shareholders per common share - diluted |
$ | 0.79 | $ | 0.55 | $ | 0.68 | ||||||
|
|
|
|
|
|
|
|||||||
| Weighted shares outstanding basic |
38,084 | 37,763 | 37,418 | |||||||||
|
|
|
|
|
|
|
|||||||
| Weighted shares outstanding diluted |
39,038 | 38,664 | 38,301 | |||||||||
|
|
|
|
|
|
|
|||||||
| Conversion of preferred stock for dilutive purposes under the as if method |
anti-dilutive | anti-dilutive | n/a | |||||||||
|
|
|
|
|
|
|
|||||||
| 19. | ASSETS HELD FOR SALE |
Long-lived assets to be sold are classified as held for sale in the period in which they meet all the criteria for the disposal of long-lived assets. The Company measures assets held for sale at the lower of their carrying amount or fair value less cost to sell. Additionally, the Company determined that these assets comprise operations and cash flows that can be clearly distinguished, operationally and for financial reporting purposes, from the rest of the Company. As of December 31, 2015, the Company classified assets held for sale, which primarily reflect: (1) an AM radio station in Denver, Colorado, that is described in Note 20, Contingencies And Commitments; (2) land, building and a tower at a tower/antenna site to be sold to a government agency; and (3) land and a building that the Company formerly used as its main studio facility in one of its markets and a co-located tower/antenna structure for two of its AM radio stations that the Company plans to relocate to other suitable sites.
Goodwill, which is usually measured at the market level rather than the station level, is not included with the sale of the Denver radio station. It is expected that the cash flows of this radio station will not be migrated to other Company-owned radio stations in the Denver market. As a result, the Company determined that it was not appropriate to include an amount of goodwill that is attributable to this radio station.
Long-lived assets are reviewed for impairment whenever events or changes in circumstances indicate that the carrying amount of an asset may not be recoverable. The Company determined that the carrying value of these assets was less than the fair value by utilizing offers from third parties for a bundle of assets. This is considered a Level 3 measurement.
85
Table of Contents
The major categories of these assets are as follows:
| Assets Held For Sale |
As Of December 31, 2015 |
|||
| (amounts in thousands) |
||||
| Land and land improvements |
$ | 3,972 | ||
| Building |
1,036 | |||
| Equipment |
497 | |||
|
|
|
|||
| Total property and equipment |
5,505 | |||
| Depreciation and amortization |
796 | |||
|
|
|
|||
| Net property and equipment |
4,709 | |||
|
|
|
|||
| Radio broadcasting licenses |
1,397 | |||
|
|
|
|||
| Total intangibles |
1,397 | |||
|
|
|
|||
| Assets held for sale |
$ | 6,106 | ||
|
|
|
|||
During the fourth quarter of 2014, the Company completed the sale of land at a former transmitter site that was previously reflected as held for sale and received $2.1 million in cash.
Impairment Of Assets Held For Sale
In 2013, the Company determined that the carrying value of land it was holding for sale was in excess of the fair value less the cost to sell. The Level 3 fair value measurement was determined using a third party’s offer as representative of the fair value. The third party’s offer was accepted by the Company in early July 2013. As a result, the Company recorded an impairment of $0.9 million in 2013.
| 20. | CONTINGENCIES AND COMMITMENTS |
Contingencies
The Company is subject to various outstanding claims which arise in the ordinary course of business and to other legal proceedings. Management anticipates that any potential liability of the Company, which may arise out of or with respect to these matters, will not materially affect the Company’s financial position, results of operations or cash flows.
Insurance
The Company uses a combination of insurance and self-insurance mechanisms to mitigate the potential liabilities for workers’ compensation, general liability, property, directors’ and officers’ liability, vehicle liability and employee health care benefits. Liabilities associated with the risks that are retained by the Company are estimated, in part, by considering claims experience, demographic factors, severity factors, outside expertise and other actuarial assumptions. Under these policies, the Company is required to maintain letters of credit in the amount of $0.7 million.
Broadcast Licenses
The Company could face increased costs in the form of fines and a greater risk that the Company could lose any one or more of its broadcasting licenses if the Federal Communications Commission (the “FCC”) concludes that programming broadcast by a Company station was obscene, indecent or profane and such conduct warrants license revocation. The FCC’s authority to impose a fine for the broadcast of such material is $325,000 for a single incident, with a maximum fine of up to $3,000,000 for a continuing violation. In the past, the FCC has issued Notices of Apparent Liability and a Forfeiture Order with respect to several of the Company’s stations proposing fines for certain programming which the FCC deemed to have been indecent. These cases are the subject of pending administrative appeals. The FCC has also investigated other complaints from the public that some of the Company’s stations broadcast indecent programming. These investigations remain pending. The FCC initiated an investigation into an incident where a person died in January 2007 after participating in a contest at one of the Company’s stations and this investigation remains pending. The Company has determined that, at this time, the amount of potential fines and penalties, if any, cannot be estimated.
86
Table of Contents
The Company has filed, on a timely basis, renewal applications for those radio stations with radio broadcasting licenses that are subject to renewal with the FCC. The Company’s costs to renew its licenses with the FCC are nominal and are expensed as incurred rather than capitalized. Seven of the Company’s FCC radio station license renewal applications filed in the most recent 2011-2014 renewal application window have not yet been granted. For five of those seven stations, license renewal applications filed during the prior 2003-2006 renewal application window have also not yet been granted. The Company continues to operate these radio stations under their existing licenses until the licenses are renewed. The FCC may delay the renewal pending the resolution of open inquiries. The affected stations are, however, authorized to continue operations until the FCC acts upon the renewal applications.
Pending Divestiture
In December 2015, the Company entered into an agreement with a buyer to dispose of KRWZ AM in Denver, Colorado, for the amount of $3.8 million in cash. The Company believes that the elimination of this station, with a marginal market share, will not alter the Company’s competitive position in the market for the remaining four stations the Company will continue to operate in this market. The Company anticipates that this transaction, which is subject to FCC approval, will close in the first half of 2016. Upon completion of this transaction, the Company expects to report a nominal gain on the disposition of these assets.
Accounting guidelines for variable interest entities require that the primary beneficiary consolidate the entity into its financial statements. The Company will remain as the primary beneficiary until the transaction is completed as the Company will absorb all of the profits and losses from the operation of the entity holding the Denver, Colorado, radio station, KRWZ AM.
Other Matters
During the third quarter of 2014, the Company settled a legal claim for $1.0 million. The amount was included in corporate general and administrative expenses for the year ended December 31, 2014.
Leases And Other Contracts
Rental expense is incurred principally for office and broadcasting facilities. Certain of the leases contain clauses that provide for contingent rental expense based upon defined events such as cost of living adjustments and/or maintenance costs in excess of pre-defined amounts.
The Company also has rent obligations under a sale and leaseback transaction whereby the Company sold certain of its radio broadcasting towers to a third party for cash in return for long-term leases on these towers. These sale and leaseback obligations are listed in the future minimum annual commitments table. The Company sold these towers as operating these towers to maximize tower rental income was not part of the Company’s core strategy.
The following table provides the Company’s rent expense for the periods indicated:
| Years Ended December 31, | ||||||||||||
| 2015 | 2014 | 2013 | ||||||||||
| (amounts in thousands) | ||||||||||||
| Rent Expense |
$ | 16,116 | $ | 14,556 | $ | 13,226 | ||||||
|
|
|
|
|
|
|
|||||||
87
Table of Contents
The Company also has various commitments under the following types of contracts:
| Future Minimum Annual Commitments | ||||||||||||||||
| Rent Under Operating Leases |
Sale Leaseback Operating Leases |
Programming And Related Contracts |
Total | |||||||||||||
| (amounts in thousands) | ||||||||||||||||
| Years ending December 31, |
||||||||||||||||
| 2016 |
$ | 17,167 | $ | 841 | $ | 81,589 | $ | 99,597 | ||||||||
| 2017 |
17,174 | 865 | 32,317 | 50,356 | ||||||||||||
| 2018 |
14,552 | 891 | 9,957 | 25,400 | ||||||||||||
| 2019 |
12,935 | 918 | 2,129 | 15,982 | ||||||||||||
| 2020 |
9,903 | 946 | 551 | 11,400 | ||||||||||||
| Thereafter |
28,301 | 9,691 | 258 | 38,250 | ||||||||||||
|
|
|
|
|
|
|
|
|
|||||||||
| $ | 100,032 | $ | 14,152 | $ | 126,801 | $ | 240,985 | |||||||||
|
|
|
|
|
|
|
|
|
|||||||||
| 21. | GUARANTOR ARRANGEMENTS |
Guarantor Arrangements
The Company recognizes, at the inception of a guarantee, a liability for the fair value of the obligation undertaken by issuing the guarantee. The following is a summary of agreements that the Company has determined are within the scope of guarantor arrangements:
| • | The Company enters into indemnification agreements in the ordinary course of business. Under these agreements, the Company typically indemnifies, holds harmless, and agrees to reimburse the indemnified party for losses suffered or incurred by the indemnified party. The maximum potential amount of future payments the Company could be required to make under these indemnification agreements is unlimited. The Company believes that the estimated fair value of these agreements is minimal. Accordingly, the Company has not recorded liabilities for these agreements as of December 31, 2015. |
| • | Under the Company’s Credit Facility, the Company is required to reimburse lenders for any increased costs that they may incur in the event of a change in law, rule or regulation resulting in their reduced returns from any change in capital requirements. The Company cannot estimate the potential amount of any future payment under this provision, nor can the Company predict if such an event will ever occur. |
| • | In connection with many of the Company’s acquisitions, the Company enters into time brokerage agreements or local marketing agreements for specified periods of time, usually six months or less, whereby the Company typically indemnifies the owner and operator of the radio station, their employees, agents and contractors from liability, claims and damages arising from the activities of operating the radio station under such agreements. The maximum potential amount of any future payments the Company could be required to make for any such previous indemnification obligations is indeterminable at this time. The Company has not, however, previously incurred any significant costs to defend lawsuits or settle claims relating to any such indemnification obligation. |
Financial Statements Of Parent
The condensed financial data of the Parent Company has been prepared in accordance with Rule 12-04 of Regulation S-X. The Parent Company’s financial data includes the financial data of Entercom Communications Corp., excluding all subsidiaries.
The most significant restrictions on the payment of dividends by Radio (as contemplated by Rule 4-08(e) of Regulation S-X) are set forth in the Credit Facility and the indenture governing the Senior Notes.
Under both the Credit Facility and the indenture governing the Senior Notes, Radio is permitted to make distributions to the Parent Company in amounts, as defined, as follow: (a) amounts which are required to pay the Parent Company’s reasonable overhead costs, including income taxes and other costs associated with conducting the
88
Table of Contents
operations of Radio and its subsidiaries; and (b) certain amounts which qualify as “Restricted Payments.” With respect to the Credit Facility, the permitted Restricted Payment is generally $40 million plus Cumulative Retained Excess Cash Flow. The Company’s ability to make a Restricted Payment in these amounts under the Credit Facility is a function of its leverage ratio. With respect to the indenture governing the Senior Notes, the permitted Restricted Payment is generally $60 million plus a variable amount. The variable amount is a function of the Company’s EBITDA and the Company’s leverage ratio.
Effectively all of Radio’s assets are subject to these distribution limitations to the Parent Company.
The following tables set forth the condensed financial data (other than the statements of shareholders’ equity and statements of comprehensive income as these statements are not condensed) of the Parent Company:
| • | the balance sheets as of December 31, 2015 and 2014; |
| • | the statements of operations for the years ended December 31, 2015, 2014 and 2013; |
| • | the statements of shareholders’ equity for the years ended December 31, 2015, 2014 and 2013; and |
| • | the statements of cash flows for the years ended December 31, 2015, 2014 and 2013. |
89
Table of Contents
ENTERCOM COMMUNICATIONS CORP.
CONDENSED PARENT COMPANY BALANCE SHEETS
(amounts in thousands)
| 2015 | 2014 | |||||||
| ASSETS | ||||||||
| Current Assets |
$ | 7,289 | $ | 6,446 | ||||
| Property And Equipment - Net |
472 | 495 | ||||||
| Deferred Charges And Other Assets - Net |
3,807 | 2,233 | ||||||
| Investment In Subsidiaries / Intercompany |
424,493 | 360,091 | ||||||
|
|
|
|
|
|||||
| TOTAL ASSETS |
$ | 436,061 | $ | 369,265 | ||||
|
|
|
|
|
|||||
| LIABILITIES AND SHAREHOLDERS’ EQUITY | ||||||||
| Current Liabilities |
$ | 19,631 | $ | 14,041 | ||||
| Long Term Liabilities |
27,361 | 26,203 | ||||||
|
|
|
|
|
|||||
| Total Liabilities |
46,992 | 40,244 | ||||||
|
|
|
|
|
|||||
| Perpectual Cumulative Convertible Preferred Stock |
27,619 | — | ||||||
| Shareholders’ Equity: |
||||||||
| Class A, B and C Common Stock |
397 | 391 | ||||||
| Additional Paid-In Capital |
611,754 | 608,515 | ||||||
| Accumulated Deficit |
(250,701 | ) | (279,885 | ) | ||||
|
|
|
|
|
|||||
| Total shareholders’ equity |
361,450 | 329,021 | ||||||
|
|
|
|
|
|||||
| TOTAL LIABILITIES AND SHAREHOLDERS’ EQUITY |
$ | 436,061 | $ | 369,265 | ||||
|
|
|
|
|
|||||
See notes to condensed Parent Company financial statements.
90
Table of Contents
ENTERCOM COMMUNICATIONS CORP.
CONDENSED PARENT COMPANY INCOME STATEMENTS
(amounts in thousands)
| YEARS ENDED DECEMBER 31, | ||||||||||||
| 2015 | 2014 | 2013 | ||||||||||
| NET REVENUES |
$ | 1,536 | $ | 1,309 | $ | 615 | ||||||
| OPERATING (INCOME) EXPENSE: |
||||||||||||
| Depreciation and amortization expense |
1,123 | 1,217 | 1,122 | |||||||||
| Corporate general and administrative expenses |
26,395 | 26,463 | 24,229 | |||||||||
| Merger and acquisition costs and restructuring charges |
6,836 | 1,042 | — | |||||||||
| Net (gain) loss on sale or disposal of assets |
(601 | ) | (601 | ) | (1,954 | ) | ||||||
|
|
|
|
|
|
|
|||||||
| Total operating expense |
33,753 | 28,121 | 23,397 | |||||||||
|
|
|
|
|
|
|
|||||||
| OPERATING INCOME (LOSS) |
(32,217 | ) | (26,812 | ) | (22,782 | ) | ||||||
|
|
|
|
|
|
|
|||||||
| OTHER (INCOME) EXPENSE: |
||||||||||||
| Net interest expense, including amortization of deferred financing expense |
— | 15 | 1 | |||||||||
| Other expense (income) |
— | — | (165 | ) | ||||||||
| Income from equity investment in subsidiaries |
(79,838 | ) | (73,561 | ) | (71,118 | ) | ||||||
|
|
|
|
|
|
|
|||||||
| TOTAL OTHER (INCOME) EXPENSE |
(79,838 | ) | (73,546 | ) | (71,282 | ) | ||||||
|
|
|
|
|
|
|
|||||||
| INCOME (LOSS) BEFORE INCOME TAXES (BENEFIT) |
47,621 | 46,734 | 48,500 | |||||||||
|
|
|
|
|
|
|
|||||||
| INCOME TAXES (BENEFIT) |
18,437 | 19,911 | 22,476 | |||||||||
|
|
|
|
|
|
|
|||||||
| NET INCOME (LOSS) AVAILABLE TO THE COMPANY |
29,184 | 26,823 | 26,024 | |||||||||
|
|
|
|
|
|
|
|||||||
| Preferred stock dividend |
(752 | ) | — | — | ||||||||
|
|
|
|
|
|
|
|||||||
| NET INCOME (LOSS) AVAILABLE TO COMMON SHAREHOLDERS |
$ | 28,432 | $ | 26,823 | $ | 26,024 | ||||||
|
|
|
|
|
|
|
|||||||
See notes to condensed Parent Company financial statements.
91
Table of Contents
ENTERCOM COMMUNICATIONS CORP.
PARENT COMPANY STATEMENTS OF SHAREHOLDERS’ EQUITY
YEARS ENDED DECEMBER 31, 2015, 2014 AND 2013
(amounts in thousands, except share data)
| Retained | ||||||||||||||||||||||||||||
| Common Stock | Additional | Earnings | ||||||||||||||||||||||||||
| Class A | Class B | Paid-in | (Accumulated | |||||||||||||||||||||||||
| Shares | Amount | Shares | Amount | Capital | Deficit) | Total | ||||||||||||||||||||||
| Balance, December 31, 2012 |
31,226,047 | $ | 312 | 7,197,532 | $ | 72 | $ | 601,847 | $ | (332,737 | ) | $ | 269,494 | |||||||||||||||
| Net income (loss) available to the Company |
— | — | — | — | — | 26,024 | 26,024 | |||||||||||||||||||||
| Compensation expense related to granting of stock awards |
96,560 | 1 | — | — | 4,269 | — | 4,270 | |||||||||||||||||||||
| Exercise of stock options |
171,625 | 2 | — | — | 243 | — | 245 | |||||||||||||||||||||
| Purchase of vested employee restricted stock units |
(186,038 | ) | (2 | ) | — | — | (1,638 | ) | — | (1,640 | ) | |||||||||||||||||
|
|
|
|
|
|
|
|
|
|
|
|
|
|
|
|||||||||||||||
| Balance, December 31, 2013 |
31,308,194 | 313 | 7,197,532 | 72 | 604,721 | (306,713 | ) | 298,393 | ||||||||||||||||||||
| Net income (loss) available to the Company |
— | — | — | — | — | 26,823 | 26,823 | |||||||||||||||||||||
| Compensation expense related to granting of stock awards |
638,102 | 7 | — | — | 5,225 | — | 5,232 | |||||||||||||||||||||
| Exercise of stock options |
57,500 | — | — | — | 82 | — | 82 | |||||||||||||||||||||
| Purchase of vested employee restricted stock units |
(141,502 | ) | (1 | ) | — | — | (1,513 | ) | — | (1,514 | ) | |||||||||||||||||
| Forfeitures of dividend equivalents |
— | — | — | — | — | 5 | 5 | |||||||||||||||||||||
|
|
|
|
|
|
|
|
|
|
|
|
|
|
|
|||||||||||||||
| Balance, December 31, 2014 |
31,862,294 | 319 | 7,197,532 | 72 | 608,515 | (279,885 | ) | 329,021 | ||||||||||||||||||||
| Net income (loss) available to the Company |
— | — | — | — | — | 29,184 | 29,184 | |||||||||||||||||||||
| Compensation expense related to granting of stock awards |
738,195 | 7 | — | — | 5,517 | — | 5,524 | |||||||||||||||||||||
| Exercise of stock options |
11,750 | — | — | — | 35 | — | 35 | |||||||||||||||||||||
| Purchase of vested employee restricted stock units |
(131,688 | ) | (1 | ) | — | — | (1,561 | ) | — | (1,562 | ) | |||||||||||||||||
| Preferred stock dividend |
— | — | — | — | (752 | ) | — | (752 | ) | |||||||||||||||||||
|
|
|
|
|
|
|
|
|
|
|
|
|
|
|
|||||||||||||||
| Balance, December 31, 2015 |
32,480,551 | $ | 325 | 7,197,532 | $ | 72 | $ | 611,754 | $ | (250,701 | ) | $ | 361,450 | |||||||||||||||
|
|
|
|
|
|
|
|
|
|
|
|
|
|
|
|||||||||||||||
See notes to Parent Company financial statements.
92
Table of Contents
ENTERCOM COMMUNICATIONS CORP.
CONDENSED PARENT COMPANY STATEMENTS OF CASH FLOWS
(amounts in thousands)
| YEARS ENDED DECEMBER 31, | ||||||||||||
| 2015 | 2014 | 2013 | ||||||||||
| OPERATING ACTIVITIES: |
||||||||||||
| Net cash provided by (used in) operating activities |
$ | (25,355 | ) | $ | (21,652 | ) | $ | (18,167 | ) | |||
|
|
|
|
|
|
|
|||||||
| INVESTING ACTIVITIES: |
||||||||||||
| Additions to property and equipment |
(304 | ) | (213 | ) | (146 | ) | ||||||
| Deferred charges and other assets |
(1,142 | ) | (481 | ) | (468 | ) | ||||||
| Proceeds (distributions) from investments in subsidiaries |
29,030 | 23,610 | 20,208 | |||||||||
|
|
|
|
|
|
|
|||||||
| Net cash provided by (used in) investing activities |
27,584 | 22,916 | 19,594 | |||||||||
|
|
|
|
|
|
|
|||||||
| FINANCING ACTIVITIES: |
||||||||||||
| Payment of fees associated with the issuance of preferred stock |
(220 | ) | — | — | ||||||||
| Proceeds from the exercise of stock options |
35 | 82 | 245 | |||||||||
| Purchase of vested employee restricted stock units |
(1,562 | ) | (1,514 | ) | (1,640 | ) | ||||||
| Payment of dividend equivalents on vested restricted stock units |
(7 | ) | — | — | ||||||||
| Payment of dividends |
(413 | ) | — | — | ||||||||
|
|
|
|
|
|
|
|||||||
| Net cash provided by (used in) financing activities |
(2,167 | ) | (1,432 | ) | (1,395 | ) | ||||||
|
|
|
|
|
|
|
|||||||
| NET INCREASE (DECREASE) IN CASH AND CASH EQUIVALENTS |
62 | (168 | ) | 32 | ||||||||
| CASH AND CASH EQUIVALENTS, BEGINNING OF YEAR |
133 | 301 | 269 | |||||||||
|
|
|
|
|
|
|
|||||||
| CASH AND CASH EQUIVALENTS, END OF YEAR |
$ | 195 | $ | 133 | $ | 301 | ||||||
|
|
|
|
|
|
|
|||||||
See notes to condensed Parent Company financial statements.
Accounting Policies
The Parent Company follows the accounting policies as described in Note 2 except that the Parent Company accounts for its investment in its subsidiaries using the equity method.
Debt – For a discussion of debt obligations of the Company, refer to Note 8.
Other - For further information, reference should be made to the notes to the consolidated financial statements of the Company.
| 22. | SUBSEQUENT EVENTS |
Events occurring after December 31, 2015 and through the date that these consolidated financial statements were issued were evaluated to ensure that any subsequent events that met the criteria for recognition have been included.
93
Table of Contents
| 23. | SUMMARIZED QUARTERLY FINANCIAL DATA (Unaudited) |
The following table presents unaudited operating results for each quarter within the two most recent years. The Company believes that all necessary adjustments, consisting only of normal recurring adjustments, have been included in the amounts stated below to present fairly the following quarterly results when read in conjunction with the financial statements included elsewhere in this report. Results of operations for any particular quarter are not necessarily indicative of results of operations for a full year. The Company’s financial results are also not comparable from quarter to quarter due to the Company’s acquisitions and dispositions of radio stations as described in Note 18 and due to the seasonality of revenues, with revenues usually the lowest in the first quarter of each year.
| Quarters Ended | ||||||||||||||||
| December 31 | September 30 | June 30 | March 31 | |||||||||||||
| (amounts in thousands, except per share data) | ||||||||||||||||
| 2015 |
||||||||||||||||
| Net revenues |
$ | 117,704 | $ | 114,662 | $ | 100,592 | $ | 78,420 | ||||||||
| Operating income |
$ | 32,555 | $ | 23,159 | $ | 20,615 | $ | 9,253 | ||||||||
| Net income (loss) available to the Company |
$ | 14,088 | $ | 8,442 | $ | 6,747 | $ | (93 | ) | |||||||
| Net income (loss) available to common shareholders |
$ | 13,675 | $ | 8,103 | $ | 6,747 | $ | (93 | ) | |||||||
| Net income (loss) available to common shareholders per share - basic (1) |
$ | 0.36 | $ | 0.21 | $ | 0.18 | $ | — | ||||||||
|
|
|
|
|
|
|
|
|
|||||||||
| Weighted average common shares outstanding - basic |
38,088 | 38,076 | 38,074 | 38,026 | ||||||||||||
|
|
|
|
|
|
|
|
|
|||||||||
| Net income (loss) available to common shareholders per share - diluted (1) |
$ | 0.34 | $ | 0.21 | $ | 0.17 | $ | — | ||||||||
|
|
|
|
|
|
|
|
|
|||||||||
| Weighted average common shares outstanding - diluted |
40,974 | 38,913 | 38,929 | 38,026 | ||||||||||||
|
|
|
|
|
|
|
|
|
|||||||||
| Quarters Ended | ||||||||||||||||
| December 31 | September 30 | June 30 | March 31 | |||||||||||||
| (amounts in thousands, except per share data) | ||||||||||||||||
| 2014 |
||||||||||||||||
| Net revenues |
$ | 101,513 | $ | 99,840 | $ | 100,201 | $ | 78,235 | ||||||||
| Operating income |
$ | 28,531 | $ | 21,205 | $ | 23,916 | $ | 11,924 | ||||||||
| Net income (loss) available to the Company |
$ | 10,850 | $ | 6,473 | $ | 8,137 | $ | 1,363 | ||||||||
| Net income (loss) available to common shareholders |
$ | 10,850 | $ | 6,473 | $ | 8,137 | $ | 1,363 | ||||||||
| Net income (loss) available to common shareholders per share - basic (1) |
$ | 0.29 | $ | 0.17 | $ | 0.22 | $ | 0.04 | ||||||||
|
|
|
|
|
|
|
|
|
|||||||||
| Weighted average common shares outstanding - basic |
37,779 | 37,693 | 37,687 | 37,660 | ||||||||||||
|
|
|
|
|
|
|
|
|
|||||||||
| Net income (loss) available to common shareholders per share - diluted (1) |
$ | 0.28 | $ | 0.17 | $ | 0.21 | $ | 0.04 | ||||||||
|
|
|
|
|
|
|
|
|
|||||||||
| Weighted average common shares outstanding - diluted |
38,730 | 38,482 | 38,446 | 38,501 | ||||||||||||
|
|
|
|
|
|
|
|
|
|||||||||
| (1) | Basic and diluted net income per share is computed independently for each quarter and the full year based upon respective average shares outstanding. Therefore, the sum of the quarterly per share amounts may not equal the annual per share amounts reported. |
94
Table of Contents
Pursuant to the requirements of Section 13 or 15(d) of the Securities and Exchange Act of 1934, the registrant has duly caused this report to be signed on its behalf by the undersigned, thereunto duly authorized, in Bala Cynwyd, Pennsylvania, on February 26, 2016.
| ENTERCOM COMMUNICATIONS CORP. | ||
| By: | /s/ DAVID J. FIELD | |
| David J. Field, President, Chief Executive Officer | ||
| (principal executive officer) | ||
Pursuant to the requirements of the Securities and Exchange Act of 1934, this report has been signed by the following persons in the capacities and on the dates indicated.
| SIGNATURE | CAPACITY | DATE | ||
| Principal Executive Officer: | ||||
| /s/ DAVID J. FIELD |
President, Chief Executive Officer | February 26, 2016 | ||
| David J. Field | and a Director | |||
| Principal Financial Officer: | ||||
| /s/ STEPHEN F. FISHER |
Executive Vice President and | February 26, 2016 | ||
| Stephen F. Fisher | Chief Financial Officer | |||
| Principal Accounting Officer: | ||||
| /s/ EUGENE D. LEVIN |
Vice President, Treasurer and Controller | February 26, 2016 | ||
| Eugene D. Levin | ||||
| Directors: | ||||
| /s/ JOSEPH M. FIELD |
Chairman of the Board | February 26, 2016 | ||
| Joseph M. Field | ||||
| /s/ DAVID J. BERKMAN |
Director | February 26, 2016 | ||
| David J. Berkman | ||||
| /s/ JOEL HOLLANDER |
Director | February 26, 2016 | ||
| Joel Hollander | ||||
| /s/ MARK R. LANEVE |
Director | February 26, 2016 | ||
| MARK R. LANEVE | ||||
| /s/ DAVID LEVY |
Director | February 26, 2016 | ||
| DAVID LEVY | ||||
95
Table of Contents
| Exhibit Number |
Description | |
| 3.01 | Amended and Restated Articles of Incorporation of the Entercom Communications Corp. (1) | |
| 3.02 | Amended and Restated Bylaws of the Entercom Communications Corp. (2) | |
| 3.03 | Statement with Respect to Shares, filed with the Pennsylvania Department of State on July 16, 2015. (3) (Originally filed as Exhibit 3.1) | |
| 4.01 | Credit Agreement, dated as of November 23, 2011, among Entercom Radio, LLC, as the Borrower, Entercom Communications Corp., as the Parent, Bank of America, N.A. as Administrative Agent and the lenders party thereto. (4) (Originally filed as Exhibit 4.1) | |
| 4.02 | First Amendment To Credit Agreement, dated as of November 27, 2012, among Entercom Radio, LLC, as the Borrower, Entercom Communications Corp., as the Parent, Bank of America, N.A. as Administrative Agent and the lenders party thereto. (5) | |
| 4.03 | Second Amendment To Credit Agreement, dated as of December 2, 2013, among Entercom Radio, LLC, as the Borrower, Entercom Communications Corp., as the Parent, Bank of America, N.A. as Administrative Agent and the lenders party thereto. (6) | |
| 4.04 | Indenture, dated as of November 23, 2011, by and among Entercom Radio, LLC, as the Issuer, the Note Guarantors (as defined therein) and Wilmington Trust, National Association, as trustee. (3) (Originally filed as Exhibit 4.2) | |
| 4.05 | Form of Note. (4) (Originally filed as Exhibit 4.3) | |
| 4.06 | Registration Rights Agreement, dated July 16, 2015, by and between Entercom Communications Corp. and The Lincoln National Life Insurance Company. (3) (Originally filed as Exhibit 4.1) | |
| 10.01 | Amended and Restated Employment Agreement, dated December 23, 2010, between Entercom Communications Corp. and David J. Field. (7) (Originally filed as Exhibit 10.01) | |
| 10.02 | Employment Agreement, dated July 1, 2007, between Entercom Communications Corp. and Joseph M. Field. (8) | |
| 10.03 | First Amendment To Employment Agreement, dated December 15, 2008, between Entercom Communications Corp. and Joseph M. Field. (9) | |
| 10.04 | Amended and Restated Employment Agreement, dated October 27, 2015, between Entercom Communications Corp. and Stephen F. Fisher. (10) | |
| 10.05 | Employment Agreement, dated as of January 1, 2013 between Entercom Communications Corp. and Andrew P. Sutor, IV. (11) | |
| 10.06 | Employment Agreement, dated May 5, 2015, between Entercom Communications Corp. and Louise Kramer. (10) | |
| 10.07 | Entercom Non-Employee Director Compensation Policy adopted February 19, 2015. (12) | |
| 10.08 | Amended and Restated Entercom Equity Compensation Plan. (13) | |
| 10.09 | Entercom Annual Incentive Plan. (14) | |
| 21.01 | Information Regarding Subsidiaries of Entercom Communications Corp. (10) | |
| 23.01 | Consent of PricewaterhouseCoopers LLP. (10) | |
| 31.01 | Certification of President and Chief Executive Officer required by Rule 13a-14(a) or Rule 15d-14(a), as created by Section 302 of the Sarbanes-Oxley Act of 2002. (10) | |
| 31.02 | Certification of Executive Vice President and Chief Financial Officer required by Rule 13a-14(a) or Rule 15d-14(a), as created by Section 302 of the Sarbanes-Oxley Act of 2002. (10) | |
| 32.01 | Certification of President and Chief Executive Officer pursuant to 18 U.S.C. § 1350, as created by Section 906 of the Sarbanes-Oxley Act of 2002. (15) | |
| 32.02 | Certification of Executive Vice President and Chief Financial Officer pursuant to 18 U.S.C. § 1350, as created by Section 906 of the Sarbanes-Oxley Act of 2002. (15) | |
| 101.INS | XBRL Instance Document | |
| 101.SCH | XBRL Taxonomy Extension Schema | |
| 101.CAL | XBRL Taxonomy Extension Calculation Linkbase | |
| 101.DEF | XBRL Taxonomy Extension Definition Linkbase | |
| 101.LAB | XBRL Taxonomy Extension Label Linkbase | |
| 101.PRE | XBRL Taxonomy Extension Presentation Linkbase | |
| (1) | Incorporated by reference to Exhibit 3.01 to our Amendment to Registration Statement on Form S-1, as filed on January 27, 1999 (File No. 333-61381), Exhibit 3.1 of our Current Report on Form 8-K as filed on December 21, 2007 and Exhibit 3.02 to our Quarterly Report on Form 10-Q for the quarter ended June 30, 2009, as filed on August 5, 2009. |
96
Table of Contents
| (2) | Incorporated by reference to Exhibit 3.01 to our Current Report on Form 8-K filed on February 21, 2008. |
| (3) | Incorporated by reference to an exhibit (as indicated above) to our Current Report on Form 8-K filed on July 17, 2015. |
| (4) | Incorporated by reference to an exhibit (as indicated above) to our Current report on Form 8-K filed on November 25, 2011. |
| (5) | Incorporated by reference to Exhibit 4.02 to our Annual Report on Form 10-K for the year ended December 31, 2012, as filed on February 27, 2013. |
| (6) | Incorporated by reference to Exhibit 4.03 to our Annual Report on Form 10-K for the year ended December 31, 2013, as filed on March 3, 2014. |
| (7) | Incorporated by reference to an exhibit (as indicated above) to our Annual Report on Form 10-K for the year ended December 31, 2010, as filed on February 9, 2011. |
| (8) | Incorporated by reference to Exhibit 10.02 to our Quarterly Report on Form 10-Q/A for the quarter ended September 30, 2007, as filed on November 21, 2007. |
| (9) | Incorporated by reference to Exhibit 10.04 to our Annual Report on Form 10-K for the year ended December 31, 2008, as filed on February 26, 2009. |
| (10) | Filed herewith. |
| (11) | Incorporated by reference to Exhibit 10.01 to our Quarterly Report on Form 10-Q for the quarter ended March 31, 2013, as filed on May 9, 2013. |
| (12) | Incorporated by reference to Exhibit 10.01 to our Current Report on Form 8-K as filed on February 19, 2015. |
| (13) | Incorporated by reference to Exhibit A to our Proxy Statement on Schedule 14A filed on March 20, 2014. |
| (14) | Incorporated by reference to Exhibit A to our Proxy Statement on Schedule 14A filed on March 16, 2012. |
| (15) | These exhibits are submitted as “accompanying” this Annual Report on Form 10-K and shall not be deemed to be “filed” as part of such Annual Report on Form 10-K. |
97