Attached files
SECURITIES AND EXCHANGE COMMISSION
Washington, D.C. 20549
FORM 10‑K
☒ ANNUAL REPORT PURSUANT TO SECTION 13 OR 15(d) OF THE SECURITIES EXCHANGE ACT OF 1934
For the fiscal year ended December 31, 2015
or
☐ TRANSITION REPORT PURSUANT TO SECTION 13 OR 15(d) OF THE SECURITIES EXCHANGE ACT OF 1934
For the transition period from _______________ to _______________
Commission file number: 001‑31899

|
|
WHITING PETROLEUM CORPORATION |
|
|
|
(Exact name of Registrant as specified in its charter) |
|
|
Delaware |
|
20‑0098515 |
|
(State or other jurisdiction |
|
(I.R.S. Employer |
|
1700 Broadway, Suite 2300 |
|
80290‑2300 |
|
(Address of principal executive offices) |
|
(Zip code) |
|
|
(303) 837‑1661 |
|
|
|
(Registrant’s telephone number, including area code) |
|
Securities registered pursuant to Section 12(b) of the Act:
|
Common Stock, $0.001 par value Preferred Share Purchase Rights |
New York Stock Exchange New York Stock Exchange |
|
(Title of Class) |
(Name of each exchange on which registered) |
Securities registered pursuant to Section 12(g) of the Act: None.
Indicate by check mark if the Registrant is a well-known seasoned issuer, as defined in Rule 405 of the Securities Act. Yes ☒ No ☐
Indicate by check mark if the Registrant is not required to file reports pursuant to Section 13 or 15(d) of the Securities Act. Yes ☐ No ☒
Indicate by check mark whether the Registrant (1) has filed all reports required to be filed by Section 13 or 15(d) of the Securities Exchange Act of 1934 during the preceding 12 months (or for such shorter period that the Registrant was required to file such reports), and (2) has been subject to such filing requirements for the past 90 days. Yes ☒ No ☐
Indicate by check mark whether the Registrant has submitted electronically and posted on its corporate Web site, if any, every Interactive Data File required to be submitted and posted pursuant to Rule 405 of Regulation S-T (§232.405 of this chapter) during the preceding 12 months (or for such shorter period that the Registrant was required to submit and post such files). Yes ☒ No ☐
Indicate by check mark if disclosure of delinquent filers pursuant to Item 405 of Regulation S-K (§229.405 of this chapter) is not contained herein, and will not be contained, to the best of Registrant’s knowledge, in definitive proxy or information statements incorporated by reference in Part III of this Form 10-K or any amendment to this Form 10-K. ☐
Indicate by check mark whether the Registrant is a large accelerated filer, an accelerated filer, a non-accelerated filer, or a smaller reporting company. See the definitions of “large accelerated filer”, “accelerated filer” and “smaller reporting company” in Rule 12b-2 of the Exchange Act. (Check one):
|
Large accelerated filer ☒ |
Accelerated filer ☐ |
Non-accelerated filer ☐ |
Smaller reporting company ☐ |
|
(Do not check if a smaller reporting company) |
|||
Indicate by check mark whether the Registrant is a shell company (as defined in Rule 12b-2 of the Exchange Act). Yes ☐ No ☒
Aggregate market value of the voting common stock held by non-affiliates of the Registrant at June 30, 2015: $6,876,311,467.
Number of shares of the Registrant’s common stock outstanding at February 16, 2016: 204,385,177 shares.
DOCUMENTS INCORPORATED BY REFERENCE
Portions of the Proxy Statement for the 2016 Annual Meeting of Stockholders are incorporated by reference into Part III.
glossary of Certain Definitions
Unless the context otherwise requires, the terms “we”, “us”, “our” or “ours” when used in this Annual Report on Form 10-K refer to Whiting Petroleum Corporation, together with its consolidated subsidiaries. When the context requires, we refer to these entities separately.
We have included below the definitions for certain terms used in this Annual Report on Form 10-K:
“3-D seismic” Geophysical data that depict the subsurface strata in three dimensions. 3-D seismic typically provides a more detailed and accurate interpretation of the subsurface strata than 2-D, or two-dimensional, seismic.
“Bbl” One stock tank barrel, or 42 U.S. gallons liquid volume, used in this report in reference to oil, NGLs and other liquid hydrocarbons.
“Bcf” One billion cubic feet, used in reference to natural gas or CO2.
“BOE” One stock tank barrel of oil equivalent, computed on an approximate energy equivalent basis that one Bbl of crude oil equals six Mcf of natural gas and one Bbl of crude oil equals one Bbl of natural gas liquids.
“CO2” Carbon dioxide.
“CO2 flood” A tertiary recovery method in which CO2 is injected into a reservoir to enhance hydrocarbon recovery.
“completion” The installation of permanent equipment for the production of crude oil or natural gas.
“costless collar” An option position where the proceeds from the sale of a call option at its inception fund the purchase of a put option at its inception.
“delay rental” Consideration paid to the lessor by a lessee to extend the terms of an oil and natural gas lease in the absence of drilling operations and/or production that is contractually required to hold the lease. This consideration is generally required to be paid on or before the anniversary date of the oil and gas lease during its primary term, and typically extends the lease for an additional year.
“deterministic method” The method of estimating reserves or resources using a single value for each parameter (from the geoscience, engineering or economic data) in the reserves calculation.
“development well” A well drilled within the proved area of an oil or natural gas reservoir to the depth of a stratigraphic horizon known to be productive.
“differential” The difference between a benchmark price of oil and natural gas, such as the NYMEX crude oil spot, and the wellhead price received.
“dry hole” A well found to be incapable of producing either oil or gas in sufficient quantities to justify completion as an oil or gas well.
“EOR” Enhanced oil recovery.
“exploratory well” A well drilled to find a new field or to find a new reservoir in a field previously found to be productive of oil or natural gas in another reservoir.
“extension well” A well drilled to extend the limits of a known reservoir.
“FASB” Financial Accounting Standards Board.
“FASB ASC” The Financial Accounting Standards Board Accounting Standards Codification.
“field” An area consisting of a single reservoir or multiple reservoirs all grouped on or related to the same individual geological structural feature and/or stratigraphic condition. There may be two or more reservoirs in a field that are separated vertically by intervening impervious strata, or laterally by local geologic barriers, or both. Reservoirs that are associated by being in overlapping or adjacent fields may be treated as a single or common operational field. The geological terms “structural feature” and “stratigraphic condition” are intended to identify localized geological features as opposed to the broader terms of basins, trends, provinces, plays, areas of interest, etc.
1
“GAAP” Generally accepted accounting principles in the United States of America.
“gross acres” or “gross wells” The total acres or wells, as the case may be, in which a working interest is owned.
“ISDA” International Swaps and Derivatives Association, Inc.
“lease operating expense” or “LOE” The expenses of lifting oil or gas from a producing formation to the surface, constituting part of the current operating expenses of a working interest, and also including labor, superintendence, supplies, repairs, short-lived assets, maintenance, allocated overhead costs and other expenses incidental to production, but not including lease acquisition or drilling or completion expenses.
“LIBOR” London interbank offered rate.
“MBbl” One thousand barrels of oil, NGLs or other liquid hydrocarbons.
“MBbl/d” One MBbl per day.
“MBOE” One thousand BOE.
“MBOE/d” One MBOE per day.
“Mcf” One thousand cubic feet, used in reference to natural gas or CO2.
“MMBbl” One million Bbl.
“MMBOE” One million BOE.
“MMBtu” One million British Thermal Units.
“MMcf” One million cubic feet, used in reference to natural gas or CO2.
“MMcf/d” One MMcf per day.
“net acres” or “net wells” The sum of the fractional working interests owned in gross acres or wells, as the case may be.
“net production” The total production attributable to our fractional working interest owned.
“NGL” Natural gas liquid.
“NYMEX” The New York Mercantile Exchange.
“PDNP” Proved developed nonproducing reserves.
“PDP” Proved developed producing reserves.
“plug-and-perf technology” A horizontal well completion technique in which hydraulic fractures are performed in multiple stages, with each stage utilizing a bridge plug to divert fracture stimulation fluids through the casing perforations into the formation within that stage.
“plugging and abandonment” Refers to the sealing off of fluids in the strata penetrated by a well so that the fluids from one stratum will not escape into another or to the surface. Regulations of most states require plugging of abandoned wells.
“pre-tax PV10%” The present value of estimated future revenues to be generated from the production of proved reserves calculated in accordance with the guidelines of the SEC, net of estimated lease operating expense, production taxes and future development costs, using costs as of the date of estimation without future escalation and using an average of the first-day-of-the month price for each of the 12 months within the fiscal year, without giving effect to non-property related expenses such as general and administrative expenses, debt service and depreciation, depletion and amortization, or federal income taxes and discounted using an annual discount rate of 10%. Pre-tax PV10% may be considered a non-GAAP financial measure as defined by the SEC. See the footnote to the Proved Reserves table in Item 1. “Business” of this Annual Report on Form 10-K for more information.
2
“prospect” A property on which indications of oil or gas have been identified based on available seismic and geological information.
“proved developed reserves” Proved reserves that can be expected to be recovered through existing wells with existing equipment and operating methods or in which the cost of the required equipment is relatively minor compared to the cost of a new well.
“proved reserves” Those reserves which, by analysis of geoscience and engineering data, can be estimated with reasonable certainty to be economically producible—from a given date forward, from known reservoirs and under existing economic conditions, operating methods and government regulations—prior to the time at which contracts providing the right to operate expire, unless evidence indicates that renewal is reasonably certain, regardless of whether deterministic or probabilistic methods are used for the estimation. The project to extract the hydrocarbons must have commenced, or the operator must be reasonably certain that it will commence the project, within a reasonable time.
The area of the reservoir considered as proved includes all of the following:
|
a. |
The area identified by drilling and limited by fluid contacts, if any, and |
|
b. |
Adjacent undrilled portions of the reservoir that can, with reasonable certainty, be judged to be continuous with it and to contain economically producible oil or gas on the basis of available geoscience and engineering data. |
Reserves that can be produced economically through application of improved recovery techniques (including, but not limited to, fluid injection) are included in the proved classification when both of the following occur:
|
a. |
Successful testing by a pilot project in an area of the reservoir with properties no more favorable than in the reservoir as a whole, the operation of an installed program in the reservoir or an analogous reservoir, or other evidence using reliable technology establishes the reasonable certainty of the engineering analysis on which the project or program was based, and |
|
b. |
The project has been approved for development by all necessary parties and entities, including governmental entities. |
Existing economic conditions include prices and costs at which economic producibility from a reservoir is to be determined. The price shall be the average price during the 12-month period before the ending date of the period covered by the report, determined as an unweighted arithmetic average of the first-day-of-the-month price for each month within such period, unless prices are defined by contractual arrangements, excluding escalations based upon future conditions.
“proved undeveloped reserves” or “PUDs” Proved reserves that are expected to be recovered from new wells on undrilled acreage, or from existing wells where a relatively major expenditure is required for recompletion. Reserves on undrilled acreage shall be limited to those directly offsetting development spacing areas that are reasonably certain of production when drilled, unless evidence using reliable technology exists that establishes reasonable certainty of economic producibility at greater distances. Undrilled locations can be classified as having undeveloped reserves only if a development plan has been adopted indicating that they are scheduled to be drilled within five years, unless specific circumstances justify a longer time. Under no circumstances shall estimates of proved undeveloped reserves be attributable to any acreage for which an application of fluid injection or other improved recovery technique is contemplated, unless such techniques have been proved effective by actual projects in the same reservoir or an analogous reservoir, or by other evidence using reliable technology establishing reasonable certainty.
“reasonable certainty” If deterministic methods are used, reasonable certainty means a high degree of confidence that the quantities will be recovered. If probabilistic methods are used, there should be at least a 90 percent probability that the quantities actually recovered will equal or exceed the estimate. A high degree of confidence exists if the quantity is much more likely to be achieved than not, and, as changes due to increased availability of geoscience (geological, geophysical and geochemical) engineering, and economic data are made to estimated ultimate recovery with time, reasonably certain estimated ultimate recovery is much more likely to increase or remain constant than to decrease.
“recompletion” An operation whereby a completion in one zone is abandoned in order to attempt a completion in a different zone within the existing wellbore.
“reserves” Estimated remaining quantities of oil and gas and related substances anticipated to be economically producible, as of a given date, by application of development projects to known accumulations. In addition, there must exist, or there must be a reasonable expectation that there will exist, the legal right to produce or a revenue interest in the production, installed means of delivering oil and gas or related substances to market, and all permits and financing required to implement the project.
3
“reservoir” A porous and permeable underground formation containing a natural accumulation of producible crude oil and/or natural gas that is confined by impermeable rock or water barriers and is individual and separate from other reservoirs.
“resource play” Refers to drilling programs targeted at regionally distributed oil or natural gas accumulations. Successful exploitation of these reservoirs is dependent upon new technologies such as horizontal drilling and multi-stage fracture stimulation to access large rock volumes in order to produce economic quantities of oil or natural gas.
“royalty” The amount or fee paid to the owner of mineral rights, expressed as a percentage or fraction of gross income from crude oil or natural gas produced and sold, unencumbered by expenses relating to the drilling, completing or operating of the affected well.
“royalty interest” An interest in an oil or natural gas property entitling the owner to shares of the crude oil or natural gas production free of costs of exploration, development and production operations.
“SEC” The United States Securities and Exchange Commission.
“standardized measure of discounted future net cash flows” The discounted future net cash flows relating to proved reserves based on the average price during the 12-month period before the ending date of the period covered by the report, determined as an unweighted arithmetic average of the first-day-of-the-month price for each month within such period (unless prices are defined by contractual arrangements, excluding escalations based upon future conditions); current costs and statutory tax rates (to the extent applicable); and a 10% annual discount rate.
“working interest” The interest in a crude oil and natural gas property (normally a leasehold interest) that gives the owner the right to drill, produce and conduct operations on the property and to a share of production, subject to all royalties, overriding royalties and other burdens and to all costs of exploration, development and operations and all risks in connection therewith.
“workover” Operations on a producing well to restore or increase production.
4
Overview
We are an independent oil and gas company engaged in development, production, acquisition and exploration activities primarily in the Rocky Mountains and Permian Basin regions of the United States. We were incorporated in the state of Delaware in 2003 in connection with our initial public offering.
Since our inception in 1980, we have built a strong asset base and achieved steady growth through a combination of property acquisitions, development of proved reserves and exploration activities. Since 2006, however, we have increased our focus on organic drilling activity and on the development of previously acquired properties, specifically on projects that we believe provide an opportunity for repeatable successes and production growth, while continuing to selectively pursue acquisitions that complement our existing core properties, such as the acquisition of Kodiak Oil & Gas Corp. (the “Kodiak Acquisition”) discussed below under “Acquisitions and Divestitures”. As a result of the sustained decline in crude oil prices during 2015 and continuing into 2016, we have significantly reduced our level of capital spending to more closely align with our cash flows generated from operations. We have also focused our drilling activity on projects that provide the highest rate of return. In addition, we continually evaluate our portfolio and sell properties when we believe that the sales price realized will provide an above average rate of return for the property or when the property no longer matches the profile of properties we desire to own, such as the asset sales discussed below under “Acquisitions and Divestitures”. We are currently exploring additional asset sales of non-core properties and anticipate further sales during 2016.
As of December 31, 2015, our estimated proved reserves totaled 820.6 MMBOE, representing a 5% increase in our proved reserves since December 31, 2014. Our 2015 average daily production was 163.2 MBOE/d and results in an average reserve life of approximately 13.8 years.
The following table summarizes by core area, our estimated proved reserves as of December 31, 2015, their corresponding pre-tax PV10% values, and our fourth quarter 2015 average daily production rates, as well as our company’s total standardized measure of discounted future net cash flows as of December 31, 2015:
|
Proved Reserves (1) |
|||||||||||||||
|
Pre-Tax |
4th Quarter 2015 |
||||||||||||||
|
Natural |
PV10% |
Average Daily |
|||||||||||||
|
Oil |
NGLs |
Gas |
Total |
% |
Value (2) |
Production |
|||||||||
|
Core Area |
(MMBbl) |
(MMBbl) |
(Bcf) |
(MMBOE) |
Oil |
(in millions) |
(MBOE/d) |
||||||||
|
Rocky Mountains (3) |
492.7 | 93.9 | 652.2 | 695.3 | 71% |
$ |
4,265 | 142.9 | |||||||
|
Permian Basin |
99.6 | 18.9 | 10.5 | 120.3 | 83% | 329 | 9.2 | ||||||||
|
Other (4) |
4.4 | 0.1 | 3.0 | 5.0 | 88% | 23 | 3.1 | ||||||||
|
Total |
596.7 | 112.9 | 665.7 | 820.6 | 73% |
$ |
4,617 | 155.2 | |||||||
|
Discounted Future Income Taxes |
|
|
|
|
|
|
|
|
|
|
|
|
(43) |
|
|
|
Standardized Measure of Discounted Future Net Cash Flows |
|
|
|
|
|
|
|
|
|
|
|
$ |
4,574 |
|
|
_____________________
|
(1) |
Oil and gas reserve quantities and related discounted future net cash flows have been derived from an oil price of $50.28 per Bbl and a gas price of $2.58 per Mcf, which were calculated by using an average of the first-day-of-the month price for each month within the 12 months ended December 31, 2015 as required by current SEC and FASB guidelines. |
|
(2) |
Pre-tax PV10% may be considered a non-GAAP financial measure as defined by the SEC and is derived from the standardized measure of discounted future net cash flows, which is the most directly comparable GAAP financial measure. Pre-tax PV10% is computed on the same basis as the standardized measure of discounted future net cash flows but without deducting future income taxes. We believe pre-tax PV10% is a useful measure for investors for evaluating the relative monetary significance of our oil and natural gas properties. We further believe investors may utilize our pre-tax PV10% as a basis for comparison of the relative size and value of our proved reserves to other companies because many factors that are unique to each individual company impact the amount of future income taxes to be paid. Our management uses this measure when assessing the potential return on investment related to our oil and gas properties and acquisitions. However, pre-tax PV10% is not a substitute for the standardized
5 |
measure of discounted future net cash flows. Our pre-tax PV10% and the standardized measure of discounted future net cash flows do not purport to present the fair value of our proved oil, NGL and natural gas reserves. |
|
(3) |
Includes oil and gas properties located in Colorado, Montana and North Dakota. |
|
(4) |
Other primarily includes non-core oil and gas properties located in Colorado, Mississippi, North Dakota, Texas and Wyoming. |
During 2015, we incurred $2.3 billion in exploration and development (“E&D”) expenditures, including $2.1 billion for the drilling of 540 gross (267.8 net) wells. Of these new wells, 265.8 (net) resulted in productive completions and 2.0 (net) were unsuccessful, yielding a 99% success rate.
As a result of the sustained decline in crude oil prices during 2015 and continuing into 2016, our 2016 E&D budget is $500 million, which represents a substantial decrease from 2015. This E&D budget also reflects the Company’s current plan to suspend completion operations beginning in the second quarter of 2016. We plan to incur the majority of our budgeted E&D expenditures during the first half of 2016 as we complete projects that were initiated in 2015 and wind down our completion operations. We currently anticipate that our E&D expenditures will total approximately $80 million per quarter during the second half of 2016. We expect to fund substantially all of our 2016 E&D budget using net cash provided by operating activities, proceeds from property divestitures, cash on hand and, if necessary, borrowings under our credit facility. To the extent net cash provided by operating activities is higher or lower than currently anticipated, we would adjust our E&D budget accordingly, enter into agreements with industry partners, divest certain oil and gas property interests or adjust borrowings outstanding under our credit facility as necessary.
Acquisitions and Divestitures
Our significant acquisitions and divestitures during the last two years are summarized below. See “Management’s Discussion and Analysis of Financial Condition and Results of Operations” in Item 7 of this Annual Report on Form 10-K for additional information on these acquisitions and divestitures.
2015 Acquisitions. There were no significant acquisitions during the year ended December 31, 2015.
2015 Divestitures. In December 2015, we completed the sale of a fresh water delivery system, a produced water gathering system and four saltwater disposal wells located in Weld County, Colorado, effective December 16, 2015, for a purchase price of $75 million (before closing adjustments).
In June 2015, we completed the sale of our interests in certain non-core oil and gas wells, effective June 1, 2015, for a purchase price of $150 million (before closing adjustments) and resulting in a pre-tax loss on sale of $118 million. The properties included over 2,000 gross wells in 132 fields across 10 states. The properties had estimated proved reserves of 20.9 MMBOE as of December 31, 2014, representing 3% of our proved reserves as of that date, and generated 5.3 MBOE/d (or 3%) of our May 2015 average daily production.
In April 2015, we completed the sale of our interests in certain non-core oil and gas wells, effective May 1, 2015, for a purchase price of $108 million (before closing adjustments) and resulting in a pre-tax gain on sale of $29 million. The properties are located in 187 fields across 14 states, and predominately consisted of assets that were previously included in the underlying properties of Whiting USA Trust I. The properties had estimated proved reserves of 8.9 MMBOE as of December 31, 2014, representing 1% of our total proved reserves as of that date, and generated 2.7 MBOE/d (or 2%) of our March 2015 average daily net production.
Also during the year ended December 31, 2015, we completed several immaterial divestiture transactions for the sale of our interests in certain non-core oil and gas wells and undeveloped acreage, for a total purchase price of $176 million (before closing adjustments) and resulting in a pre-tax gain on sale of $28 million. These properties had estimated proved reserves of 23.4 MMBOE as of December 31, 2014, representing 3% of our total proved reserves as of that date. The properties generated a combined total of approximately 4.4 MBOE/d of average daily net production, based on production rates at each of the respective closing dates.
2014 Acquisitions. On December 8, 2014, we completed the acquisition of Kodiak Oil & Gas Corp. (now known as Whiting Canadian Holding Company ULC, “Kodiak”), whereby we acquired all of the outstanding common stock of Kodiak. Pursuant to the terms of the Kodiak Acquisition agreement, Kodiak shareholders received 0.177 of a share of Whiting common stock in exchange for each share of Kodiak common stock they owned. Total consideration for the Kodiak Acquisition was $1.8 billion, consisting of the 47,546,139 Whiting common shares issued at the market price of $37.25 per share on the date of issuance plus the fair value of Kodiak’s outstanding equity awards assumed by Whiting. The aggregate purchase price of the transaction was $4.3 billion, which includes the assumption of Kodiak’s outstanding debt of $2.5 billion as of December 8, 2014 and the net cash acquired of $19 million.
As a result of the Kodiak Acquisition, Whiting acquired approximately 327,000 gross (178,000 net) acres located primarily in North Dakota, including interests in 778 producing oil and gas wells and undeveloped acreage. Approximately 10,000 of the net acres
6
acquired were located in Wyoming and Colorado. The producing properties had estimated proved reserves of 191.8 MMBOE as of the acquisition date, 86% of which were crude oil and NGLs.
The acquisition significantly expanded our presence in the Williston Basin, adding undeveloped acreage, oil and natural gas reserves and production that were complementary to our existing asset base and operations in this area. As a result of this acquisition, we became the largest Bakken/Three Forks producer in the Williston Basin as of the acquisition date.
2014 Divestitures. In March 2014, we completed the sale of approximately 49,900 gross (41,000 net) acres in our Big Tex prospect, which consisted mainly of undeveloped acreage as well as our interests in certain producing oil and gas wells, located in the Delaware Basin of Texas for a cash purchase price of $76 million resulting in a pre-tax gain on sale of $12 million.
Business Strategy
Our goal is to generate meaningful growth in our net asset value of proved reserves per share through the development, acquisition and exploration of oil and gas projects with attractive rates of return on capital employed. To date, we have pursued this goal through continued field development in our core areas and the acquisition of reserves. Specifically, we have focused, and plan to continue to focus, on the following:
Pursuing High-Return Organic Reserve Additions. The development of large resource plays such as our Williston Basin and our Denver Julesburg Basin (“DJ Basin”) projects has become one of our central objectives. As of December 31, 2015, we have assembled approximately 778,900 gross (454,800 net) developed and undeveloped acres in the Williston Basin located in Montana and North Dakota. As of December 31, 2015, we had five drilling rigs operating in this area. As a result of the sustained decline in crude oil prices, we plan to decrease the number of rigs operating in this area to two for most of 2016, while suspending our completion activity beginning in the second quarter. Additionally, Whiting owns a 50% ownership interest in two gas processing plants located in the Williston Basin. The Robinson Lake plant located in our Sanish field has a current processing capacity of approximately 130 MMcf/d. Our Belfield plant located near the Pronghorn field currently has inlet compression in place to process 35 MMcf/d. Both plants have fractionation capability to convert NGLs into propane and butane, which end products can then be sold locally for higher realized prices.
At our Redtail field in the DJ Basin in Weld County, Colorado, we have assembled approximately 154,300 gross (126,400 net) developed and undeveloped acres where we have the potential to drill over 1,200 gross wells targeting several intervals in the Niobrara formation. As of December 31, 2015, we had two drilling rigs operating in the DJ Basin, and we plan to maintain a two-rig drilling program in this area during 2016, while suspending our completion activity beginning in the second quarter. In April 2014, we brought online the Redtail gas plant to process the associated gas produced from our wells in this area. The plant’s current inlet capacity is 50 MMcf/d.
Developing Existing Properties. Our current property base provides us with numerous low-risk opportunities for exploration and development drilling. As of December 31, 2015, we have identified a drilling inventory of over 3,000 gross wells that we believe will add production over the next five years. Our drilling inventory consists of the development of our proved and unproved reserves. Additionally, we have opportunities to apply and expand enhanced recovery techniques that we expect will increase proved reserves and extend the productive lives of our mature fields. Since we acquired the North Ward Estes field located in the Permian Basin of West Texas in 2005, we have experienced significant production increases through the use of secondary and tertiary recovery techniques. We are currently injecting approximately 370 MMcf/d of CO2 into this field, over half of which is recycled.
Disciplined Financial Approach. Our goal is to remain financially strong, yet flexible, through the prudent management of our balance sheet and active management of our exposure to commodity price volatility. We have historically funded our acquisition and growth activity through a combination of equity and debt issuances, bank borrowings, internally generated cash flow and certain oil and gas property divestitures, as appropriate, to maintain our financial position. As a result of the sustained decline in crude oil prices during 2015 and continuing into 2016, we have significantly reduced our level of capital spending to more closely align with our cash flows generated from operations, and have focused our drilling activity on projects that provide the highest rate of return. From time to time, we monetize non-core properties and use the net proceeds from these asset sales to repay debt under our credit agreement or fund our E&D expenditures. For example, during 2015 we sold a large number of non-core oil and gas properties that were primarily operated by third parties and no longer matched the profile of properties we desire to own. Divesting of these non-operated properties allows us to better control the timing and amount of capital spending as well as our operating costs. In addition, to support cash flow generation on our existing properties and help ensure expected cash flows from newly acquired properties, we periodically enter into derivative contracts. Typically, we use costless collars, swaps and crude oil sales and delivery contracts to provide an attractive base commodity price level. As of January 1, 2016, we had derivative contracts covering the sale of approximately 54% of our forecasted 2016 oil production.
Growing Through Accretive Acquisitions. Since 2003, we have completed 21 separate significant acquisitions of producing properties for total estimated proved reserves of 445.2 MMBOE, as of the effective dates of the acquisitions. Our experienced team of
7
management, land, engineering and geoscience professionals has developed and refined an acquisition program designed to increase reserves and complement our existing properties, including identifying and evaluating acquisition opportunities, closing purchases and effectively managing the properties we acquire. We intend to selectively pursue the acquisition of properties that are complementary to our core operating areas, as demonstrated by the Kodiak Acquisition, which closed on December 8, 2014 and expanded our presence in the Williston Basin.
Competitive Strengths
We believe that our key competitive strengths lie in our balanced asset portfolio, our experienced management and technical team and our commitment to the effective application of new technologies.
Focused, Long-Lived Asset Base. As of December 31, 2015, we had interests in 5,889 gross (3,177 net) productive wells on approximately 948,600 gross (593,900 net) developed acres across all our geographical areas. We believe this geographic mix of properties and organic drilling locations presents us with multiple opportunities to successfully execute our business strategy. Our proved reserve life is approximately 13.8 years based on year-end 2015 proved reserves and 2015 production.
Experienced Management Team. Our management team averages 29 years of experience in the oil and gas industry. Our personnel have extensive experience in each of our core geographical areas and in all of our operational disciplines. In addition, each of our acquisition professionals has at least 31 years of experience in the evaluation, acquisition and operational assimilation of oil and gas properties.
Commitment to Technology. In each of our core operating areas, we have accumulated extensive geologic and geophysical knowledge and have developed significant technical and operational expertise. In recent years, we have developed considerable expertise in conventional and 3-D seismic imaging and interpretation. In 2011, we completed the build-out and installation of an in-house, state-of-the-art rock analysis laboratory. We continue to utilize the data from this rock lab to support real-time drilling and completion decisions, and to help us to further understand unconventional oil plays. Our technical team has access to approximately 9,200 square miles of 3-D seismic data, digital well logs and other subsurface information. This data is analyzed with advanced geophysical and geological computer resources dedicated to the accurate and efficient characterization of the subsurface oil and gas reservoirs that comprise our asset base. In addition, our information systems enable us to update our production databases through daily uploads from hand-held computers in the field. We have a team of 10 professionals averaging over 27 years of experience managing CO2 floods. This commitment to technology has increased the productivity and efficiency of our field operations and development activities.
As a result of our successful testing of cemented liner and plug-and-perf completion designs across all of our prospect areas, in January 2014 we began using this technique for all of our completions in the Williston Basin, resulting in a significant improvement in initial production rates. During 2015, we continued to advance our completion techniques, including significantly increasing proppant volumes, utilizing diverting agents to better distribute fluid and proppant across individual zones, varying the number of completion stages, and employing new fracture stimulation fluids, including slickwater. In 2016, we plan to continue use of these state-of-the-art completion designs on wells we drill in the Williston Basin and the DJ Basin, while also testing new diversion technology and more efficient placement and drillout of down-hole plugs.
8
Proved Reserves
Our estimated proved reserves as of December 31, 2015 are summarized in the table below. See “Reserves” in Item 2 of this Annual Report on Form 10-K for information relating to the uncertainties surrounding these reserve categories.
|
Estimated |
|||||||||||||
|
Future Capital |
|||||||||||||
|
Oil |
NGLs |
Natural Gas |
Total |
% of Total |
Expenditures |
||||||||
|
Rocky Mountains (1): |
(MMBbl) |
(MMBbl) |
(Bcf) |
(MMBOE) |
Proved |
(in millions) |
|||||||
|
PDP |
229.3 | 44.8 | 288.1 | 322.1 | 46% | ||||||||
|
PDNP |
3.7 | 0.2 | 3.2 | 4.4 | 1% | ||||||||
|
PUD |
259.7 | 48.9 | 360.9 | 368.8 | 53% | ||||||||
|
Total proved |
492.7 | 93.9 | 652.2 | 695.3 | 100% |
$ |
5,150.4 | ||||||
|
Permian Basin: |
|||||||||||||
|
PDP |
50.5 | 8.7 | 4.3 | 59.9 | 50% | ||||||||
|
PDNP |
10.5 | 1.6 | 2.1 | 12.5 | 10% | ||||||||
|
PUD |
38.6 | 8.6 | 4.1 | 47.9 | 40% | ||||||||
|
Total proved |
99.6 | 18.9 | 10.5 | 120.3 | 100% |
$ |
1,004.7 | ||||||
|
Other (2): |
|||||||||||||
|
PDP |
4.0 | 0.1 | 2.3 | 4.5 | 90% | ||||||||
|
PDNP |
0.4 | 0.0 | 0.7 | 0.5 | 10% | ||||||||
|
PUD |
0.0 | 0.0 | 0.0 | 0.0 |
-% |
||||||||
|
Total proved |
4.4 | 0.1 | 3.0 | 5.0 | 100% |
$ |
11.3 | ||||||
|
Total Company: |
|||||||||||||
|
PDP |
283.8 | 53.6 | 294.7 | 386.5 | 47% | ||||||||
|
PDNP |
14.6 | 1.8 | 6.0 | 17.4 | 2% | ||||||||
|
PUD |
298.3 | 57.5 | 365.0 | 416.7 | 51% | ||||||||
|
Total proved |
596.7 | 112.9 | 665.7 | 820.6 | 100% |
$ |
6,166.4 | ||||||
_____________________
|
(1) |
Includes oil and gas properties located in Colorado, Montana, and North Dakota. |
|
(2) |
Other primarily includes non-core oil and gas properties located in Colorado, Mississippi, North Dakota, Texas and Wyoming. |
The estimated future capital expenditures in the table above incorporate numerous assumptions and are subject to many uncertainties, including oil and natural gas prices, costs of oil field goods and services, drilling results and several other factors.
Marketing and Major Customers
We principally sell our oil and gas production to end users, marketers and other purchasers that have access to nearby pipeline facilities. In areas where there is no practical access to pipelines, oil is trucked or transported by rail to terminals, market hubs, refineries or storage facilities. For the year ended December 31, 2015, no individual purchaser accounted for 10% or more of our total oil, NGL and natural gas sales. The table below presents percentages by purchaser that accounted for 10% or more of our total oil, NGL and natural gas sales for the years ended December 31, 2014 and 2013. We believe that the loss of any individual purchaser would not have a long-term material adverse impact on our financial position or results of operations.
|
2014 |
2013 |
|||
|
Plains Marketing LP |
17% |
21% |
||
|
Shell Trading US |
10% |
14% |
||
|
Bridger Trading LLC |
10% |
8% |
||
|
Eighty Eight Oil Company |
6% |
11% |
9
Title to Properties
Our properties are subject to customary royalty interests, liens securing indebtedness, liens incident to operating agreements, liens for current taxes and other burdens, including other mineral encumbrances and restrictions. Our credit agreement is also secured by a first lien on substantially all of our assets. We do not believe that any of these burdens materially interfere with the use of our properties or the operation of our business.
We believe that we have satisfactory rights or title to all of our producing properties. As is customary in the oil and gas industry, limited investigation of title is made at the time of acquisition of undeveloped properties. In most cases, we investigate title and obtain title opinions from counsel only when we acquire producing properties or before commencement of drilling operations.
Competition
The oil and gas industry is a highly competitive environment for acquiring properties, obtaining investment capital, securing oil field goods and services, marketing oil and natural gas products and attracting and retaining qualified personnel. Many of our competitors possess and employ financial, technical and personnel resources substantially greater than ours, which can be particularly important in the areas in which we operate. Those companies may be able to pay more for productive oil and gas properties and exploratory prospects and to evaluate, bid for and purchase a greater number of properties and prospects than our financial or personnel resources permit. In addition, the unavailability or high cost of drilling rigs or other equipment and services could delay or adversely affect our development and exploration operations. Our ability to acquire additional prospects and to find and develop reserves in the future will depend on our ability to evaluate and select suitable properties and to consummate transactions in a highly competitive environment.
Regulation
Regulation of Production
The production of oil and gas is subject to regulation under a wide range of local, state and federal statutes, rules, orders and regulations. Federal, state and local statutes and regulations require permits for drilling operations, drilling bonds and periodic report submittals during operations. All of the states in which we own and operate properties have regulations governing conservation matters, including provisions for the unitization or pooling of oil and gas properties, the establishment of maximum allowable rates of production from oil and gas wells, the regulation of well spacing and the plugging and abandonment of wells. The effect of these regulations is to limit the amount of oil and gas that we can produce from our wells and to limit the number of wells or the locations that we can drill, although we can apply for exceptions to such regulations or to have reductions in well spacing. Moreover, each state generally imposes a production or severance tax with respect to the production or sale of oil, NGLs and natural gas within its jurisdiction.
Currently, none of our total production volumes are produced from offshore leases, however, some of our prior offshore operations were conducted on federal leases that are administered by the Bureau of Ocean Energy Management (the “BOEM”). The present value of our future abandonment obligations associated with offshore properties was $29 million as of December 31, 2015. Whiting is therefore required to comply with the regulations and orders issued by the BOEM under the Outer Continental Shelf Lands Act. Among other things, we are required to obtain prior BOEM approval for any exploration plans we pursue and for our lease development and production plans. BOEM regulations also establish construction requirements for production facilities located on our federal offshore leases and govern the plugging and abandonment of wells and the removal of production facilities from these leases.
The BOEM also establishes the basis for royalty payments due under federal oil and gas leases through regulations issued under applicable statutory authority. State regulatory authorities establish similar standards for royalty payments due under state oil and gas leases. The basis for royalty payments established by the BOEM and the state regulatory authorities is generally applicable to all federal and state oil and gas lessees. Accordingly, we believe that the impact of royalty regulation on our operations should generally be the same as the impact on our competitors.
Regulation of Transportation and Sale of Oil
Sales of crude oil, condensate and NGLs are not currently regulated and are made at negotiated prices, however, Congress could reenact price controls or enact other legislation in the future.
Our crude oil sales are affected by the availability, terms and cost of transportation. The transportation of oil in common carrier pipelines is also subject to rate regulation. The Federal Energy Regulatory Commission (the “FERC”) regulates interstate oil pipeline transportation rates under the Interstate Commerce Act. In general, interstate oil pipeline rates must be cost-based, although settlement rates agreed to by all shippers are permitted and market-based rates may be permitted in certain circumstances. Effective January 1, 1995, the FERC implemented regulations establishing an indexing system (based on inflation) for crude oil transportation
10
rates that allowed for an increase or decrease in the cost of transporting oil to the purchaser. The FERC’s regulations include a methodology for oil pipelines to change their rates through the use of an index system that establishes ceiling levels for such rates. The most recent mandatory five-year review period resulted in an order from the FERC for the index to be based on Producer Price Index for Finished Goods (the “PPI-FG”) plus a 1.23% adjustment for the five-year period from July 1, 2016 through June 30, 2021. This represents a decrease from the PPI-FG plus 2.65% adjustment from the prior five-year period. The FERC determined that it would now use a calculation based on what it determined to be a superior data source, reflecting actual cost-of-service data as opposed to the accounting data historically used as a proxy for such information under the prior index methodology. The regulations provide that each year the Commission will publish the oil pipeline index after the PPI-FG becomes available. Intrastate oil pipeline transportation rates are subject to regulation by state regulatory commissions. The basis for intrastate oil pipeline regulation and the degree of regulatory oversight and scrutiny given to intrastate oil pipeline rates varies from state to state. Insofar as effective interstate and intrastate rates are equally applicable to all comparable shippers, we believe that the regulation of oil transportation rates will not affect our operations in any way that is of material difference from those of our competitors.
Further, interstate and intrastate common carrier oil pipelines must provide service on a non-discriminatory basis. Under this open access standard, common carriers must offer service to all shippers requesting service on the same terms and under the same rates. When oil pipelines operate at full capacity, access is governed by prorationing provisions set forth in the pipelines’ published tariffs. In addition, the FERC has emergency authority under the Interstate Commerce Act to intervene and direct priority use of oil pipeline transportation capacity, and the FERC exercised this authority over a specific pipeline in February 2014 in response to significant disruptions in the supply of propane. Accordingly, we believe that access to oil pipeline transportation services generally will be available to us to the same extent as to our competitors.
Transportation and safety of oil and hazardous liquid is subject to regulation by the Department of Transportation (the “DOT”) under the Pipeline Integrity, Protection, Enforcement and Safety Act of 2006 and the Pipeline Safety, Regulatory Certainty and Job Creation Act of 2012. The Pipeline and Hazardous Material Safety Administration (“PHMSA”), an agency within the DOT, enforces regulations on all interstate liquids transportation and some intrastate liquids transportation. PHMSA does not enforce the regulations in states that are capable of enforcing the same regulations themselves. The effect of regulatory changes under the DOT and their effect on interstate and intrastate oil and hazardous liquid transportation will not affect our operations in any way that is of material difference from those of our competitors.
A portion of our crude oil production may be shipped to market centers using rail transportation facilities owned and operated by third parties. The DOT and PHMSA establish safety regulations relating to crude-by-rail transportation. In addition, third-party rail operators are subject to the regulatory jurisdiction of the Surface Transportation Board of the DOT, the Federal Railroad Administration (the “FRA”) of the DOT, the Occupational Safety and Health Administration and other federal regulatory agencies. Additionally, various state and local agencies have jurisdiction over disposal of hazardous waste and seek to regulate movement of hazardous materials in ways not preempted by federal law.
In response to rail accidents occurring between 2002 and 2008, the U.S. Congress passed the Rail Safety and Improvement Act of 2008, which implemented regulations governing different areas related to railroad safety. In response to train derailments occurring in the United States and Canada in 2013 and 2014, U.S. regulators have taken a number of actions to address the safety risks of transporting crude oil by rail.
On February 25, 2014, the DOT issued an emergency order requiring all persons to ensure crude oil is properly tested and classed prior to offering such product into transportation, and to assure all shipments by rail of crude oil be handled as a Packing Group I or II hazardous material. Also in February 2014, the Association of American Railroads entered into a voluntary agreement with the DOT to implement certain restrictions around the movement of crude oil by rail. In May 2014, the DOT issued an Emergency Restriction/Prohibition Order requiring each railroad carrier operating trains transporting 1,000,000 gallons or more of Bakken crude oil to provide notice to state officials regarding the expected movement of the trains through the counties in each state. The PHMSA and FRA have also issued safety advisories and alerts regarding oil transportation and have issued a report focused on the increased volatility and flammability of Bakken crude oil as compared with other crudes in the U.S. In May 2015, PHMSA issued new rules applicable to “high-hazard flammable trains”, defined as a continuous block of 20 or more tank cars loaded with a flammable liquid or 35 or more tank cars loaded with a flammable liquid dispersed throughout a train. Among other requirements, the new rules require enhanced braking systems, enhanced standards for newly constructed tank cars and retrofitting of existing tank cars, restricted operating speeds, a documented testing and sampling program, and routine assessments that evaluate 27 safety and security factors. Also in May 2015, the DOT issued an Emergency Restriction/Prohibition Order obligating certain railroad carriers operating trains transporting 1,000,000 gallons or more of Bakken crude oil to provide certain route information to state emergency authorities.
We do not currently own or operate rail transportation facilities or rail cars. However, the adoption of any regulations that impact the testing or rail transportation of crude oil could increase our costs of doing business and limit our ability to transport and sell our crude oil at favorable prices at market centers throughout the U.S., the consequences of which could have a material adverse effect on our financial condition, results of operations and cash flows. The effect of any such regulatory changes will not affect our operations in any way that is of material difference from those of our competitors.
11
Regulation of Transportation, Storage, Sale and Gathering of Natural Gas
The FERC regulates the transportation, and to a lesser extent, the sale for resale of natural gas in interstate commerce pursuant to the Natural Gas Act of 1938 and the Natural Gas Policy Act of 1978 and regulations issued under those Acts. In 1989, however, Congress enacted the Natural Gas Wellhead Decontrol Act, which removed all remaining price and non-price controls affecting wellhead sales of natural gas, effective January 1, 1993. While sales by producers of natural gas can currently be made at unregulated market prices, in the future Congress could reenact price controls or enact other legislation with detrimental impact on many aspects of our business.
Our natural gas sales are affected by the availability, terms and cost of transportation. The price and terms of access to pipeline transportation and underground storage are subject to extensive federal and state regulation. From 1985 to the present, several major regulatory changes have been implemented by Congress and the FERC that affect the economics of natural gas production, transportation and sales. In addition, the FERC is continually proposing and implementing new rules and regulations affecting those segments of the natural gas industry that remain subject to the FERC's jurisdiction, most notably interstate natural gas transmission companies and certain underground storage facilities. These initiatives may also affect the intrastate transportation of natural gas under certain circumstances. The stated purpose of many of these regulatory changes is to promote competition among the various sectors of the natural gas industry by making natural gas transportation more accessible to natural gas buyers and sellers on an open and non-discriminatory basis.
The FERC implements The Outer Continental Shelf Lands Act pertaining to transportation and pipeline issues, which requires that all pipelines operating on or across the outer continental shelf provide open access and non-discriminatory transportation service. One of the FERC’s principal goals in carrying out this Act’s mandate is to increase transparency in the market to provide producers and shippers on the outer continental shelf with greater assurance of open access services on pipelines located on the outer continental shelf and non-discriminatory rates and conditions of service on such pipelines.
We cannot accurately predict whether the FERC’s actions will achieve the goal of increasing competition in the markets in which our natural gas is sold. In addition, many aspects of these regulatory developments have not become final but are still pending judicial and final FERC decisions. Regulations implemented by the FERC in recent years could result in an increase in the cost of transportation service on certain petroleum product pipelines. In addition, the natural gas industry historically has always been heavily regulated. Therefore, we cannot provide any assurance that the less stringent regulatory approach recently established by the FERC will continue. However, we do not believe that any action taken will affect us in a way that materially differs from the way it affects other natural gas producers.
Transportation and safety of natural gas is subject to regulation by the DOT under the Pipeline Inspection, Protection, Enforcement and Safety Act of 2006 and the Pipeline Safety, Regulatory Certainty and Job Creation Act of 2012. In addition, intrastate natural gas transportation is subject to enforcement by state regulatory agencies, and PHMSA enforces regulations on interstate natural gas transportation. State regulatory agencies can also create their own transportation and safety regulations as long as they meet PHMSA’s minimum requirements. The basis for intrastate regulation of natural gas transportation and the degree of regulatory oversight and scrutiny given to intrastate natural gas pipeline rates and services varies from state to state. Insofar as such regulation within a particular state will generally affect all intrastate natural gas shippers within the state on a comparable basis, we believe that the regulation of similarly situated intrastate natural gas transportation in any of the states in which we operate and ship natural gas on an intrastate basis will not affect our operations in any way that is of material difference from those of our competitors. Likewise, the effect of regulatory changes by the DOT and their effect on interstate natural gas transportation will not affect our operations in any way that is of material difference from those of our competitors. We use the latest tools and technologies to remain compliant with current pipeline safety regulations.
The failure to comply with these rules and regulations can result in substantial penalties.
In October 2015, a failure at an underground natural gas storage facility in Southern California prompted PHMSA to issue an advisory bulletin reminding owners and operators of underground storage facilities to review operations, identify the potential for facility leaks and failures, and to review and update emergency plans. The State of California proclaimed the underground natural gas storage facility an emergency situation in January 2016. Increased attention to and requirements for underground storage safety and infrastructure by state and federal regulators that may result from this incident will not affect us in a way that materially differs from the way it affects other natural gas producers.
Environmental Regulations
General. Our oil and gas exploration, development and production operations are subject to stringent federal, state and local laws and regulations governing the discharge or release of materials into the environment or otherwise relating to environmental protection. Numerous governmental agencies, such as the U.S. Environmental Protection Agency (the “EPA”), issue regulations to implement and enforce such laws, which often require difficult and costly compliance measures that carry substantial administrative, civil and criminal penalties or that may result in injunctive relief for failure to comply. These laws and regulations may require the acquisition
12
of a permit before drilling or facility construction commences; restrict the types, quantities and concentrations of various materials that can be released into the environment in connection with drilling and production activities; limit or prohibit project siting, construction or drilling activities on certain lands located within wilderness, wetlands, ecologically sensitive and other protected areas; require remedial action to prevent pollution from former operations, such as plugging abandoned wells or closing pits; and impose substantial liabilities for unauthorized pollution resulting from our operations. The EPA and analogous state agencies may delay or refuse the issuance of required permits or otherwise include onerous or limiting permit conditions that may have a significant adverse impact on our ability to conduct operations. The regulatory burden on the oil and gas industry increases the cost of doing business and consequently affects its profitability.
Changes in environmental laws and regulations occur frequently, and any changes that result in more stringent and costly material handling, storage, transport, disposal or cleanup requirements could materially and adversely affect our operations and financial position, as well as those of the oil and gas industry in general. While we believe that we are in compliance, in all material respects, with current applicable environmental laws and regulations and have not experienced any material adverse effect from compliance with these environmental requirements, there is no assurance that this trend will continue in the future.
The environmental laws and regulations which have the most significant impact on the oil and gas exploration and production industry are as follows:
Superfund. The Comprehensive Environmental Response, Compensation and Liability Act of 1980, as amended (“CERCLA” or “Superfund”), and comparable state laws impose strict joint and several liability, without regard to fault or the legality of conduct, on classes of persons who are considered to be responsible for the release of a “hazardous substance” into the environment. These persons include the owner or operator of the site where a release occurred and anyone who disposed or arranged for the disposal of the hazardous substance released at the site. Under CERCLA, such persons may be subject to joint and several liability for the costs of cleaning up the hazardous substances that have been released into the environment, for damages to natural resources and for the costs of certain health studies. It is not uncommon for neighboring landowners and other third parties to file claims for personal injury and property damage allegedly caused by hazardous substances released into the environment. In the course of our ordinary operations, we may generate material that may be regulated as “hazardous substances”. Consequently, we may be jointly and severally liable under CERCLA or comparable state statutes for all or part of the costs required to clean up sites at which these materials have been disposed or released.
We currently own or lease, and in the past have owned or leased, properties that for many years have been used for the exploration and production of oil and gas. Although we and our predecessors have used operating and disposal practices that were standard in the industry at the time, hazardous substances, wastes or hydrocarbons may have been released on, under or from the properties owned or leased by us or on, under or from other locations where such substances have been taken for recycling or disposal. In addition, many of these owned and leased properties have been operated by third parties or by previous owners or operators whose treatment and disposal of hazardous substances, wastes or hydrocarbons was not under our control. Similarly, the disposal facilities where discarded materials are sent are also often operated by third parties whose waste treatment and disposal practices may not be adequate. While we only use what we consider to be reputable disposal facilities, we might not know of a potential problem if the disposal occurred before we acquired the property or business, and if the problem itself is not discovered until years later. Our properties, adjacent affected properties, the offsite disposal facilities and the substances disposed or released on them may be subject to CERCLA and analogous state laws. Under these laws, we could be required:
|
· |
to remove or remediate previously disposed materials, including materials disposed or released by prior owners or operators or other third parties; |
|
· |
to clean up contaminated property, including contaminated groundwater; |
|
· |
to perform remedial operations to prevent future contamination, including the plugging and abandonment of wells drilled and left inactive by prior owners and operators; or |
|
· |
to pay some or all of the costs of any such action. |
At this time, we do not believe that we are a potentially responsible party with respect to any Superfund site and we have not been notified of any claim, liability or damages under CERCLA.
Oil Pollution Act. The Oil Pollution Act of 1990 (“OPA”) and regulations issued under OPA impose strict, joint and several liability on “responsible parties” for removal costs and damages resulting from oil spills into or upon navigable waters, adjoining shorelines or in the exclusive economic zone of the United States. A “responsible party” includes the owner or operator of an onshore facility and the lessee, permittee or holder of a right of use and easement of the area in which an offshore facility is located. OPA establishes a liability limit for onshore facilities of $350 million per spill, while the liability limit for offshore facilities is the payment of all removal costs plus $75 million per spill damages. These limits do not apply if the spill is caused by a responsible party’s gross negligence or willful misconduct; the spill resulted from a responsible party’s violation of a federal safety, construction or operating regulation; a responsible party fails to report a spill or to cooperate fully in a cleanup; or a responsible party fails to comply with an order issued under the authority of the Intervention on the High Seas Act. OPA also requires the lessee or permittee of the offshore
13
area in which a covered offshore facility is located to establish and maintain evidence of financial responsibility in the amount of $35 million to cover liabilities related to an oil spill for which such responsible party is statutorily responsible. The President may increase the amount of financial responsibility required under OPA by up to $150 million, depending on the risk represented by the quantity or quality of oil that is handled by the facility. Any failure to comply with OPA’s requirements or inadequate cooperation during a spill response action may subject a responsible party to administrative penalties up to $25,000 per day per violation. We believe we are in compliance with all applicable OPA financial responsibility obligations. Moreover, we are not aware of any action or event that would subject us to liability under OPA, and we believe that compliance with OPA’s financial responsibility and other operating requirements will not have a material adverse effect on us.
Resource Conservation Recovery Act. The Resource Conservation and Recovery Act (“RCRA”) and comparable state statutes regulate the generation, transportation, treatment, storage, disposal and cleanup of hazardous and non-hazardous wastes. Under the auspices of the EPA, the individual states administer some or all of the provisions of RCRA, sometimes in conjunction with their own more stringent requirements. We generate solid and hazardous wastes that are subject to RCRA and comparable state laws. Drilling fluids, produced water and most of the other wastes associated with the exploration, development and production of crude oil or natural gas are currently regulated under RCRA’s non-hazardous waste provisions. However, it is possible that certain oil and natural gas exploration and production wastes now classified as non-hazardous could be classified as hazardous waste in the future. In September 2010, the Natural Resources Defense Council filed a petition with the EPA, requesting them to reconsider the RCRA exemption for exploration, production and development wastes but, to date, the agency has not taken any action on the petition. The EPA has not formally responded to this petition yet. Any such change in the current RCRA exemption and comparable state laws could result in an increase in the costs to manage and dispose of wastes. Additionally, these exploration and production wastes may be regulated by state agencies as solid waste. Also, ordinary industrial wastes such as paint wastes, waste solvents, laboratory wastes and waste compressor oils may be regulated as hazardous waste. Although we do not believe the current costs of managing our materials constituting wastes (as they are presently classified) to be significant, any repeal or modification of the oil and gas exploration and production exemption by administrative, legislative or judicial process, or modification of similar exemptions in analogous state statutes would increase the volume of hazardous waste we are required to manage and dispose of and would cause us, as well as our competitors, to incur increased operating expenses.
Clean Water Act. The Federal Water Pollution Control Act, or the Clean Water Act, as amended (“CWA”), and analogous state laws impose restrictions and strict controls with respect to the discharge of pollutants, including spills and leaks of oil and other substances, into state waters or other waters of the United States. The discharge of pollutants into regulated waters is prohibited, except in accordance with the terms of a permit issued by the EPA or an analogous state agency. Spill prevention, control and countermeasure requirements under federal law require appropriate containment berms and similar structures to help prevent the contamination of navigable waters in the event of a petroleum hydrocarbon tank spill, rupture or leak. In addition, CWA and analogous state laws require individual permits or coverage under general permits for discharges of storm water runoff from certain types of facilities.
The EPA had regulations under the authority of CWA that required certain oil and gas exploration and production projects to obtain permits for construction projects with storm water discharges. However, the Energy Policy Act of 2005 nullified most of the EPA regulations that required storm water permitting of oil and gas construction projects. There are still some state and federal rules that regulate the discharge of storm water from some oil and gas construction projects. Costs may be associated with the treatment of wastewater and/or developing and implementing storm water pollution prevention plans. Federal and state regulatory agencies can impose administrative, civil and criminal penalties for non-compliance with discharge permits or other requirements of CWA and analogous state laws and regulations. In Section 40 CFR 112 of the regulations, the EPA promulgated the Spill Prevention, Control and Countermeasure regulations, which require certain oil containing facilities to prepare plans and meet construction and operating standards.
Air Emissions. The Federal Clean Air Act, as amended (the “CAA”), and comparable state laws regulate emissions of various air pollutants from various industrial sources through air emissions permitting programs and also impose other monitoring and reporting requirements. We may be required to incur certain capital expenditures in the future for air pollution control equipment in connection with obtaining and maintaining pre-construction and operating permits and approvals for air emissions. In addition, the EPA has developed, and continues to develop, stringent regulations governing emissions of toxic air pollutants at specified sources. For example, in 2012, the EPA finalized rules establishing new air emission controls for oil and natural gas production operations. Specifically, the EPA’s rule includes New Source Performance Standards to address emissions of sulfur dioxide and volatile organic compounds and a separate set of emission standards to address hazardous air pollutants frequently associated with oil and natural gas production and processing activities. Among other things, these standards require the application of reduced emission completion techniques associated with the completion of newly drilled and fractured wells in addition to existing wells that are refractured. The rules also establish specific requirements regarding emissions from compressors, dehydrators, storage tanks and other production equipment. These rules could require a number of modifications to operations at certain of our oil and gas properties including the installation of new equipment. Compliance with such rules could result in significant costs, including increased capital expenditures and operating costs, which may adversely impact our business. Federal and state regulatory agencies can impose administrative, civil and criminal penalties for non-compliance with air permits or other requirements of the CAA and associated state laws and regulations.
14
The EPA announced in 2015 that it would directly regulate methane emissions from oil and natural gas wells for the first time as part of President Obama’s Climate Action Plan. As part of this strategy, on August 18, 2015, the EPA proposed requirements relating to methane and volatile organic compound (“VOC”) emissions from the oil and natural gas industry. These include: (i) proposed updates to the New Source Performance Standards and Draft Control Techniques Guidelines for new and modified sources in the oil and gas industry, (ii) Draft Control Techniques Guidelines for reducing VOC emissions from existing oil and gas sources in certain ozone nonattainment areas and states in the Ozone Transport Region, (iii) a proposed Source Determination Rule to clarify the EPA’s air permitting rules as they apply to the oil and natural gas industry, and (iv) a proposed Federal Implementation Plan for the EPA’s Indian Country Minor New Source Review program for oil and gas production sources. In July 2015, the EPA also finalized two updates to the 2012 New Source Performance Standards for the oil and natural gas industry to address the definition of low-pressure wells and references to tanks that are connected to one another. In November 2015, the EPA also issued a request for additional data and information on emissions of hazardous air pollutants that were not available in 2012 when the EPA updated its major source air toxics standards for oil and natural gas production facilities and natural gas transmission and storage facilities. The final rule is expected in 2016.
After the closing of the Kodiak Acquisition, the EPA contacted us to discuss Kodiak’s responses to a June 2014 information request from the EPA under Section 114(a) of the CAA. In addition, in July 2015, we received an information request from the EPA under Section 114(a) of the CAA. The information requests relate to tank batteries used in our Williston Basin operations and our compliance with certain regulatory requirements at those locations, including the control of air pollutant emissions from those facilities. We have responded to the EPA’s information requests and are in settlement discussions with the EPA and the North Dakota Department of Health (the “NDDoH”) regarding potential noncompliance with the federal CAA at our Williston Basin facilities, as implemented by the EPA and the NDDoH. To date, no formal federal or state enforcement action has been commenced in connection with this matter beyond receipt of the noted letters. We anticipate that resolution of this matter will result in civil penalties of an undetermined amount and may require us to undertake corrective actions which may increase our development and/or operating costs. Given the uncertainty in matters such as these, we are unable to predict the ultimate outcome of this matter at this time. However, we do not believe that any penalties or corrective action expenditures that may result from this matter will have a material adverse effect on our financial position, results of operations or cash flows.
Hydraulic Fracturing. Hydraulic fracturing is an important and common practice that is used to stimulate production of hydrocarbons from tight rock formations. The process involves the injection of water, sand and chemicals under pressure into formations to fracture the surrounding rock and stimulate production. Hydraulic fracturing has been utilized to complete wells in our most active areas located in the states of Colorado, Montana, North Dakota and Texas, and we expect it will also be used in the future. Should our exploration and production activities expand to other states, it is likely that we will utilize hydraulic fracturing to complete or recomplete wells in those areas. The process is typically regulated by state oil and gas commissions. However, the EPA recently issued guidance, which was published in the Federal Register on February 12, 2014, for permitting authorities and the industry regarding the process for obtaining a permit for hydraulic fracturing involving diesel.
In June 2015, the EPA released for public comment and peer review a draft assessment of the potential impacts of oil and gas fracturing activities on the quality and quantity of drinking water resources in the United States. In addition, the EPA is currently studying wastewater and stormwater discharges from hydraulic fracturing facilities. In April 2015, the EPA issued a proposed rule to amend the Effluent Limitations Guidelines and Standards for the oil and gas extraction category which would address discharges of wastewater pollutants from onshore unconventional oil and gas extraction facilities to publicly-owned treatment works. The EPA is also conducting a study of private wastewater treatment facilities accepting oil and gas extraction wastewater. Additionally, the EPA is collecting data and information regarding the extent to which these facilities accept such wastewater, available treatment technologies (and their associated costs), discharge characteristics, financial characteristics of the facilities, the environmental impacts of discharges and other information.
Other federal agencies are also examining hydraulic fracturing, including the U.S. Department of Energy, the U.S. Government Accountability Office and the White House Council for Environmental Quality. In March 2015, the U.S. Department of the Interior released a final rule addressing (i) hydraulic fracturing on federal and Indian oil and natural gas leases to require validation of well integrity and strong cement barriers between the wellbore and water zones through which the wellbore passes, (ii) disclosure of chemicals used in hydraulic fracturing to the Bureau of Land Management, (iii) higher standards for interim storage of recovered waste fluids from hydraulic fracturing and (iv) measures to lower the risk of cross-well contamination with chemicals and fluids used in fracturing operations. In addition, legislation has been introduced in Congress from time to time to provide for federal regulation of hydraulic fracturing and to require disclosure of the chemicals used in the fracturing process. Also, some states have adopted, and other states are considering adopting, regulations that could ban, restrict or impose additional requirements on activities relating to hydraulic fracturing in certain circumstances. For example, on June 17, 2011, Texas enacted a law that requires the disclosure of information regarding the substances used in the hydraulic fracturing process to the Railroad Commission of Texas (the entity that regulates oil and natural gas production in Texas) and the public. Such federal or state legislation could require the disclosure of chemical constituents used in the fracturing process to state or federal regulatory authorities who could then make such information publicly available. Disclosure of chemicals used in the fracturing process could make it easier for third parties opposing hydraulic fracturing to pursue legal proceedings against producers and service providers based on allegations that specific chemicals used in the
15
fracturing process could adversely affect human health or the environment, including groundwater. In addition, if hydraulic fracturing is regulated at the federal level, our fracturing activities could become subject to additional permit requirements or operational restrictions and also to associated permitting delays, litigation risk and potential increases in costs. Further, local governments may seek to adopt, and some have adopted, ordinances within their jurisdictions restricting the use of or regulating the time, place and manner of drilling or hydraulic fracturing. No assurance can be given as to whether or not similar measures might be considered or implemented in the jurisdictions in which our properties are located. If new laws, regulations or ordinances that significantly restrict or otherwise impact hydraulic fracturing are passed by Congress or adopted in the states or local municipalities where our properties are located, such legal requirements could prohibit or make it more difficult or costly for us to perform hydraulic fracturing activities and thereby could affect the determination of whether a well is commercially viable. In addition, restrictions on hydraulic fracturing could reduce the amount of oil and natural gas that we are ultimately able to produce in commercially paying quantities and the calculation of our reserves.
In addition, on July 3, 2014, a major university and U.S. Geological Survey researchers published a study purporting to find a causal connection between the deep well injection of hydraulic fracturing wastewater and a sharp increase in seismic activity in Oklahoma since 2008. Such studies may trigger new legislation or regulations that would limit or ban the disposal of hydraulic fracturing wastewater in deep injection wells. If such new laws or rules are adopted, our operations may be curtailed while alternative treatment and disposal methods are developed and approved.
Further, on May 19, 2014, the EPA published an Advance Notice of Proposed Rulemaking under the Toxic Substances Control Act, relating to the disclosure of chemical substances and mixtures used in oil and gas exploration and production. Depending on the precise disclosure requirements the EPA elects to impose, if any, we may be obliged to disclose valuable proprietary information, and failure to do so may subject us to penalties.
Global Warming and Climate Change. On December 15, 2009, the EPA published its findings that emissions of carbon dioxide, methane and other greenhouse gases (“GHG”) present an endangerment to public health and the environment because emissions of such gases are, according to the EPA, contributing to the warming of the earth’s atmosphere and other climate changes. Based on these findings, the EPA has begun adopting and implementing regulations that restrict emissions of GHG under existing provisions of the CAA, including one rule that limits emissions of GHG from motor vehicles beginning with the 2012 model year. The EPA has asserted that these final motor vehicle GHG emission standards trigger the CAA construction and operating permit requirements for stationary sources, commencing when the motor vehicle standards took effect on January 2, 2011. On June 3, 2010, the EPA published its final rule to address the permitting of GHG emissions from stationary sources under the Prevention of Significant Deterioration (the “PSD”) and Title V permitting programs. This rule “tailors” these permitting programs to apply to certain stationary sources of GHG emissions in a multi-step process, with the largest sources first becoming subject to permitting. Further, facilities required to obtain PSD permits for their GHG emissions are required to reduce those emissions consistent with guidance for determining “best available control technology” standards for GHG, which guidance was published by the EPA in November 2010. Also in November 2010, the EPA expanded its existing GHG reporting rule to include onshore oil and natural gas production, processing, transmission, storage and distribution facilities. This rule requires reporting of GHG emissions from such facilities on an annual basis with reporting beginning in 2012 for emissions occurring in 2011. We believe that we are in compliance with all substantial applicable emissions requirements.
In June 2014, the Supreme Court upheld most of the EPA’s GHG permitting requirements, allowing the agency to regulate the emission of GHG from stationary sources already subject to the PSD and Title V requirements. Certain of our equipment and installations may currently be subject to PSD and Title V requirements and hence, under the Supreme Court’s ruling, may also be subject to the installation of controls to capture GHG. For any equipment or installation so subject, we may have to incur increased compliance costs to capture related GHG emissions.
In accordance with President Obama’s Climate Action Plan, on August 3, 2015, the EPA issued a rule to reduce carbon emissions from electric generating units. The rule, commonly called the “Clean Power Plan”, requires states to develop plans to reduce carbon emissions from fossil fuel-fired generating units commencing in 2022, with the reductions to be fully phased in by 2030. Each state is given a different carbon reduction target, but the EPA expects that, in the aggregate, the overall proposal will reduce carbon emissions from electric generating units by 32% from 2005 levels. States are given substantial flexibility in meeting their emission reduction targets and can generally choose to lower carbon emissions by replacing higher carbon generation, such as coal or natural gas, with lower carbon generation, such as efficient natural gas units or renewable energy alternatives. Several industry groups and states have challenged the Clean Power Plan in the Court of Appeals for the D.C. Circuit, and on February 9, 2016, the U.S. Supreme Court stayed the implementation of the Clean Power Plan while it is being challenged in court.
In addition, both houses of Congress have actively considered legislation to reduce emissions of GHG, and many states have already taken legal measures to reduce emissions of GHG, primarily through the development of GHG inventories, GHG permitting and/or regional GHG “cap and trade” programs. Most of these “cap and trade” programs work by requiring either major sources of emissions or major producers of fuels to acquire and surrender emission allowances, with the number of allowances available for purchase reduced each year until the overall GHG emission reduction goal is achieved. In the absence of new legislation, the EPA is issuing
16
new regulations that limit emissions of GHG associated with our operations, which will require us to incur costs to inventory and reduce emissions of GHG associated with our operations and which could adversely affect demand for the oil, NGLs and natural gas that we produce. Finally, it should be noted that many scientists have concluded that increasing concentrations of GHG in the atmosphere may produce climate changes that have significant physical effects, such as increased frequency and severity of storms, droughts, floods and other climatic events. If any such effects were to occur, they could have an adverse effect on our assets and operations.
Consideration of Environmental Issues in Connection with Governmental Approvals. Our operations frequently require licenses, permits and/or other governmental approvals. Several federal statutes, including the Outer Continental Shelf Lands Act (“OCSLA”), the National Environmental Policy Act (“NEPA”) and the Coastal Zone Management Act (“CZMA”) require federal agencies to evaluate environmental issues in connection with granting such approvals and/or taking other major agency actions. OCSLA, for instance, requires the U.S. Department of Interior to evaluate whether certain proposed activities would cause serious harm or damage to the marine, coastal or human environment. Similarly, NEPA requires the Department of Interior and other federal agencies to evaluate major agency actions having the potential to significantly impact the environment. In the course of such evaluations, an agency would have to prepare an environmental assessment and potentially an environmental impact statement. The CZMA, on the other hand, aids states in developing a coastal management program to protect the coastal environment from growing demands associated with various uses, including offshore oil and gas development. In obtaining various approvals from the Department of Interior, we must certify that we will conduct our activities in a manner consistent with all applicable regulations.
Employees
As of December 31, 2015, we had approximately 1,200 full-time employees, including approximately 40 senior level geoscientists and 80 petroleum engineers. Our employees are not represented by any labor unions. We consider our relations with our employees to be satisfactory and have never experienced a work stoppage or strike.
Available Information
We maintain a website at the address www.whiting.com. We are not including the information contained on our website as part of, or incorporating it by reference into, this report. We make available free of charge (other than an investor’s own Internet access charges) through our website our annual reports on Form 10-K, quarterly reports on Form 10-Q and current reports on Form 8-K, including exhibits and amendments to these reports, as soon as reasonably practicable after we electronically file such material with, or furnish such material to, the SEC.
17
Each of the risks described below should be carefully considered, together with all of the other information contained in this Annual Report on Form 10-K, before making an investment decision with respect to our securities. In the event of the occurrence, reoccurrence, continuation or increased severity of any of the risks described below, our business, financial condition or results of operations could be materially and adversely affected, and you may lose all or part of your investment.
Oil and natural gas prices are very volatile. An extended period of low oil and natural gas prices may adversely affect our business, financial condition, results of operations or cash flows.
The oil and gas markets are very volatile, and we cannot predict future oil and natural gas prices. The price we receive for our oil, NGL and natural gas production heavily influences our revenue, profitability, access to capital and future rate of growth. The prices we receive for our production depend on numerous factors beyond our control. These factors include, but are not limited to, the following:
|
· |
changes in regional, domestic and global supply and demand for oil and natural gas; |
|
· |
the level of global oil and natural gas inventories; |
|
· |
the actions of the Organization of Petroleum Exporting Countries; |
|
· |
the price and quantity of imports of foreign oil and natural gas; |
|
· |
political and economic conditions, including embargoes, in oil-producing countries or affecting other oil-producing activity, such as the recent lifting of international crude oil-related sanctions against Iran and recent conflicts in the Middle East; |
|
· |
the level of global oil and natural gas exploration and production activity; |
|
· |
the effects of global credit, financial and economic issues; |
|
· |
developments of United States energy infrastructure; |
|
· |
weather conditions; |
|
· |
technological advances affecting energy consumption; |
|
· |
domestic and foreign governmental regulations, such as the recent passing of legislation to lift the ban on U.S. crude oil exports; |
|
· |
proximity and capacity of oil and natural gas pipelines and other transportation facilities; |
|
· |
the price and availability of competitors’ supplies of oil and natural gas in captive market areas; |
|
· |
the price and availability of alternative fuels; and |
|
· |
acts of force majeure. |
Moreover, government regulations, such as regulation of oil and natural gas gathering and transportation, can adversely affect commodity prices in the long term.
These factors and the volatility of the energy markets generally make it extremely difficult to predict future oil and natural gas price movements. Also, prices for oil and prices for natural gas do not necessarily move in tandem. Declines in oil or natural gas prices would not only reduce revenue but could reduce the amount of oil and natural gas that we can economically produce. If the oil and natural gas industry continues to experience low prices, we may, among other things, be unable to meet all of our financial obligations or make planned expenditures.
Oil prices have fallen significantly since reaching highs of over $105.00 per Bbl in June 2014, dropping below $27.00 per Bbl in February 2016. Natural gas prices have also declined from over $4.80 per Mcf in April 2014 to below $1.80 per Mcf in December 2015. In addition, forecasted prices for both oil and natural gas for 2016 have also declined.
Lower oil, NGL and natural gas prices may not only decrease our revenues on a per unit basis but also may ultimately reduce the amount of oil and natural gas that we can produce economically and therefore potentially lower our reserve quantities. A substantial or extended decline in oil, NGL or natural gas prices may result in impairments of our proved oil and gas properties, undeveloped acreage or goodwill and may materially and adversely affect our future business, financial condition, cash flows, results of operations, liquidity or ability to finance planned capital expenditures. To the extent commodity prices received from production are insufficient to fund planned capital expenditures, we will be required to reduce spending, sell assets or borrow any such shortfall. Lower commodity prices may also reduce the amount of our borrowing base under our credit agreement, which is determined at the discretion of the lenders based on the collateral value of our proved reserves that have been mortgaged to the lenders, and is subject to regular redeterminations on May 1 and November 1 of each year, as well as special redeterminations described in the credit agreement. Upon a redetermination, if borrowings in excess of the revised borrowing capacity were outstanding, we could be forced to immediately repay a portion of the debt outstanding under our credit agreement. At the time of the last redetermination, which resulted in our borrowing base being reduced from $4.5 billion to $4.0 billion, the applicable oil and gas prices were $38.60 per Bbl and $2.70 per Mcf, whereas the quoted NYMEX prices for oil and gas on February 16, 2016 were $29.04 per Bbl and $1.90 per Mcf.
18
Lower commodity prices may also make it more difficult for us to comply with the covenants and other restrictions in the agreements governing our debt as described under “The instruments governing our indebtedness contain various covenants limiting the discretion of our management in operating our business.”
Alternatively, higher oil prices may result in significant mark-to-market losses being incurred on our commodity-based derivatives, which may in turn cause us to experience net losses.
Drilling for and producing oil and natural gas are high risk activities with many uncertainties that could adversely affect our business, financial condition or results of operations.
Our future success will depend on the success of our exploration, development and production activities. Our oil and natural gas exploration and production activities are subject to numerous risks beyond our control, including the risk that drilling will not result in commercially viable oil or natural gas production. Our decisions to purchase, explore, develop or otherwise exploit prospects or properties will depend in part on the evaluation of data obtained through geophysical and geological analyses, production data and engineering studies, the results of which are often inconclusive or subject to varying interpretations. Please read “— Reserve estimates depend on many assumptions that may turn out to be inaccurate...” later in these Risk Factors for a discussion of the uncertainty involved in these processes. Our cost of drilling, completing and operating wells is often uncertain before drilling commences. Overruns in budgeted expenditures are common risks that can make a particular project uneconomical. Further, many factors may curtail, delay or cancel drilling, including the following:
|
· |
reductions in, or a sustained period of low, oil, NGL and natural gas prices; |
|
· |
delays imposed by or resulting from compliance with regulatory requirements; |
|
· |
delays or limits on the issuance of drilling permits on our federal leases, including as a result of government shutdowns; |
|
· |
pressure or irregularities in geological formations; |
|
· |
shortages of or delays in obtaining qualified personnel or equipment, including drilling rigs, completion services and CO2; |
|
· |
equipment failures or accidents; |
|
· |
adverse weather conditions, such as freezing temperatures, hurricanes and storms; |
|
· |
pipeline takeaway and refining and processing capacity; and |
|
· |
title problems. |
Our debt level and the covenants in the agreements governing our debt could negatively impact our financial condition, results of operations, cash flows and business prospects.
As of December 31, 2015, we had $800 million in borrowings and $2 million in letters of credit outstanding under Whiting Oil and Gas Corporation’s (“Whiting Oil and Gas”) credit facility with $2.7 billion of available borrowing capacity, as well as $3,050 million of senior notes outstanding, $1,250 million of convertible senior notes outstanding and $350 million of senior subordinated notes outstanding. We are allowed to incur additional indebtedness, provided that we meet certain requirements in the indentures governing our senior notes and our senior subordinated notes and Whiting Oil and Gas’ credit agreement.
Our level of indebtedness and the covenants contained in the agreements governing our debt could have important consequences for our operations, including:
|
· |
making it more difficult for us to satisfy our obligations with respect to our indebtedness, and any failure to comply with the obligations of any of our debt agreements, including financial and other restrictive covenants, which could result in an event of default under Whiting Oil and Gas’ credit agreement and the indentures governing our senior notes and our senior subordinated notes; |
|
· |
requiring us to dedicate a substantial portion of our cash flow from operations to required payments on debt, thereby reducing the availability of cash flow for working capital, capital expenditures and other general business activities; |
|
· |
limiting our ability to obtain additional financing in the future for working capital, capital expenditures, acquisitions and general corporate and other activities; |
|
· |
limiting our flexibility in planning for, or reacting to, changes in our business and the industry in which we operate; |
|
· |
placing us at a competitive disadvantage relative to other less leveraged competitors; |
|
· |
making us vulnerable to increases in interest rates, because debt under Whiting Oil and Gas’ credit agreement is subject to certain rate variability; |
|
· |
making us more vulnerable to economic downturns and adverse developments in our industry or the economy in general, especially declines in oil and natural gas prices; and |
|
· |
when oil and natural gas prices decline, our ability to maintain compliance with our financial covenants becomes more difficult and our borrowing base is subject to reductions, which may reduce or eliminate our ability to fund our operations. |
We may be required to repay all or a portion of our debt on an accelerated basis in certain circumstances. If we fail to comply with the covenants and other restrictions in the agreements governing our debt, it could lead to an event of default and the acceleration of our
19
repayment of outstanding debt. In addition, if we are in default under the agreements governing our indebtedness, we would not be able to pay dividends on our capital stock. Our ability to comply with these covenants and other restrictions may be affected by events beyond our control, including prevailing economic and financial conditions. Moreover, the borrowing base limitation on Whiting Oil and Gas’ credit agreement is redetermined on May 1 and November 1 of each year, and may be the subject of special redeterminations described in such credit agreement based on an evaluation of our oil and gas reserves. Because oil and gas prices are principal inputs into the valuation of our reserves, if oil and gas prices remain at their current levels for a prolonged period or go lower, our borrowing base could be reduced at the next redetermination date or during future redeterminations. Upon a redetermination, if borrowings in excess of the revised borrowing capacity were outstanding, we could be forced to immediately repay a portion of our debt outstanding under the credit agreement.
We may not have sufficient funds to make such repayments. If we are unable to repay our debt out of cash on hand, we could attempt to refinance such debt, sell assets or repay such debt with the proceeds from an equity offering. We may not be able to generate sufficient cash flow to pay the interest on our debt or future borrowings, and equity financings or proceeds from the sale of assets may not be available to pay or refinance such debt. The terms of our debt, including Whiting Oil and Gas’ credit agreement, may also prohibit us from taking such actions. Factors that will affect our ability to raise cash through an offering of our capital stock or debt securities, a refinancing of our debt or a sale of assets include financial market conditions and our market value and operating performance at the time of such offering or other financing. We may not be able to successfully complete any such offering, refinancing or sale of assets.
If we cannot make scheduled payments on our indebtedness or otherwise fail to comply with the covenants and other restrictions in the agreements governing our debt, we will be in default and the lenders under Whiting Oil and Gas’ credit agreement and the holders of our senior notes, our convertible senior notes and our senior subordinated notes could declare all outstanding principal and interest to be due and payable, and the lenders under Whiting Oil and Gas’ credit agreement could terminate their commitments to loan money and could foreclose against the assets securing their borrowings and we could be forced into bankruptcy or liquidation. Our inability to generate sufficient cash flows to satisfy our debt obligations, or to refinance our indebtedness on commercially reasonable terms or at all, would materially and adversely affect our financial position and results of operations. Further, failing to comply with the financial and other restrictive covenants in Whiting Oil and Gas’ credit agreement and the indentures governing our senior notes, our convertible senior notes and our senior subordinated notes could result in an event of default, which could adversely affect our business, financial condition and results of operations.
The instruments governing our indebtedness contain various covenants limiting the discretion of our management in operating our business.
The indentures governing our senior notes, our convertible senior notes and our senior subordinated notes and Whiting Oil and Gas’ credit agreement contain various restrictive covenants that may limit our management’s discretion in certain respects. In particular, these agreements will limit our and our subsidiaries’ ability to, among other things:
|
· |
pay dividends on, redeem or repurchase our capital stock or redeem or repurchase our senior or subordinated debt; |
|
· |
make loans to others; |
|
· |
make investments; |
|
· |
incur additional indebtedness or issue preferred stock; |
|
· |
create certain liens; |
|
· |
sell assets; |
|
· |
enter into agreements that restrict dividends or other payments from our restricted subsidiaries to us; |
|
· |
consolidate, merge or transfer all or substantially all of our assets and those of our restricted subsidiaries taken as a whole; |
|
· |
engage in transactions with affiliates; |
|
· |
enter into hedging contracts; |
|
· |
create unrestricted subsidiaries; and |
|
· |
enter into sale and leaseback transactions. |
In addition, Whiting Oil and Gas’ credit agreement requires us, as of the last day of any quarter, to maintain the following ratios (as defined in the credit agreement): (i) a consolidated current assets to consolidated current liabilities ratio (which includes an add back of the available borrowing capacity under the credit agreement) of not less than 1.0 to 1.0, (ii) a total senior secured debt to the last four quarters’ EBITDAX ratio of less than 2.5 to 1.0 during the Interim Covenant Period (defined below), and thereafter a total debt to EBITDAX ratio of less than 4.0 to 1.0 and (iii) a ratio of the last four quarters’ EBITDAX to consolidated interest charges of not less than 2.25 to 1.0 during the Interim Covenant Period. Under the credit agreement, the “Interim Covenant Period” is defined as the period from June 30, 2015 until the earlier of (a) April 1, 2018 or (b) the commencement of an investment-grade debt rating period. Also, the indentures under which we issued our senior notes and our senior subordinated notes restrict us from incurring additional indebtedness and making certain restricted payments, subject to certain exceptions, unless our fixed charge coverage ratio (as defined in the indentures) is at least 2.0 to 1.0. If we were in violation of these covenants, then we may not be able to incur additional
20
indebtedness, including under Whiting Oil and Gas’ credit agreement. A substantial or extended decline in oil or natural gas prices may adversely affect our ability to comply with these covenants.
If we fail to comply with the restrictions in the indentures governing our senior notes, our convertible senior notes and our senior subordinated notes or Whiting Oil and Gas’ credit agreement or any other subsequent financing agreements, a default may allow the creditors to accelerate the related indebtedness as well as any other indebtedness to which a cross-acceleration or cross-default provision applies. In addition, lenders may be able to terminate any commitments they had made to make further funds available to us. Furthermore, if we were unable to repay the amounts due and payable under Whiting Oil and Gas’ credit agreement, those lenders could proceed against the collateral granted to them to secure that indebtedness. In the event that our lenders or noteholders accelerate the repayment of our borrowings, we and our subsidiaries may not have sufficient assets or be able to borrow sufficient funds to repay or refinance that indebtedness. Also, if we are in default under the agreements governing our indebtedness, we will not be able to pay dividends on our capital stock.
If oil, NGL and natural gas prices decrease, we may be required to take write-downs of the carrying values of our oil and gas properties.
Accounting rules require that we periodically review the carrying value of our producing oil and gas properties for possible impairment. Based on specific market factors and circumstances at the time of prospective impairment reviews (which may include depressed oil, NGL and natural gas prices and the continuing evaluation of development plans, production data, economics and other factors) we may be required to write down the carrying value of our oil and gas properties. For example, we recorded a $1.5 billion impairment charge during 2015 for the partial write-down of our North Ward Estes field in Texas and other non-core proved oil and gas properties primarily in Texas, Wyoming, North Dakota and Colorado that are not currently being developed due to depressed oil and gas prices. Additionally, we recorded a $62 million impairment charge during 2015 for the partial write-down of our CO2 development properties in New Mexico and Colorado whose net book values exceeded their undiscounted future net cash flows. A write-down constitutes a non-cash charge to earnings. Oil and gas prices have continued to decline since December 31, 2015 which may cause us to incur additional impairments that could have a material adverse effect on our results of operations in the period recognized.
Federal, state and local legislative and regulatory initiatives relating to hydraulic fracturing could result in increased costs and additional operating restrictions or delays.
Hydraulic fracturing is an important and common practice that is used to stimulate production of hydrocarbons from tight rock formations. The process involves the injection of water, sand and chemicals under pressure into formations to fracture the surrounding rock and stimulate production. Hydraulic fracturing has been utilized to complete wells in our most active areas located in the states of Colorado, Montana, North Dakota and Texas, and we expect it will also be used in the future. Should our exploration and production activities expand to other states, it is likely that we will utilize hydraulic fracturing to complete or recomplete wells in those areas. The process is typically regulated by state oil and gas commissions. However, the U.S. Environmental Protection Agency (the “EPA”) recently issued guidance, which was published in the Federal Register on February 12, 2014, for permitting authorities and the industry regarding the process for obtaining a permit for hydraulic fracturing involving diesel.
In June 2015, the EPA released for public comment and peer review a draft assessment of the potential impacts of oil and gas fracturing activities on the quality and quantity of drinking water resources in the United States. In addition, the EPA is currently studying wastewater and stormwater discharges from hydraulic fracturing facilities. In April 2015, the EPA issued a proposed rule to amend the Effluent Limitations Guidelines and Standards for the oil and gas extraction category which would address discharges of wastewater pollutants from onshore unconventional oil and gas extraction facilities to publicly-owned treatment works. The EPA is also conducting a study of private wastewater treatment facilities accepting oil and gas extraction wastewater. Additionally, the EPA is collecting data and information regarding the extent to which these facilities accept such wastewater, available treatment technologies (and their associated costs), discharge characteristics, financial characteristics of the facilities, the environmental impacts of discharges and other information.
Other federal agencies are also examining hydraulic fracturing, including the U.S. Department of Energy, the U.S. Government Accountability Office and the White House Council for Environmental Quality. In March 2015, the U.S. Department of the Interior released a final rule addressing (i) hydraulic fracturing on federal and Indian oil and natural gas leases to require validation of well integrity and strong cement barriers between the wellbore and water zones through which the wellbore passes, (ii) disclosure of chemicals used in hydraulic fracturing to the Bureau of Land Management, (iii) higher standards for interim storage of recovered waste fluids from hydraulic fracturing and (iv) measures to lower the risk of cross-well contamination with chemicals and fluids used in fracturing operations. In addition, legislation has been introduced in Congress from time to time to provide for federal regulation of hydraulic fracturing and to require disclosure of the chemicals used in the fracturing process. Also, some states have adopted, and other states are considering adopting, regulations that could ban, restrict or impose additional requirements on activities relating to hydraulic fracturing in certain circumstances. For example, on June 17, 2011, Texas enacted a law that requires the disclosure of information regarding the substances used in the hydraulic fracturing process to the Railroad Commission of Texas (the entity that
21
regulates oil and natural gas production in Texas) and the public. Such federal or state legislation could require the disclosure of chemical constituents used in the fracturing process to state or federal regulatory authorities who could then make such information publicly available. Disclosure of chemicals used in the fracturing process could make it easier for third parties opposing hydraulic fracturing to pursue legal proceedings against producers and service providers based on allegations that specific chemicals used in the fracturing process could adversely affect human health or the environment, including groundwater. In addition, if hydraulic fracturing is regulated at the federal level, our fracturing activities could become subject to additional permit requirements or operational restrictions and also to associated permitting delays, litigation risk and potential increases in costs. Further, local governments may seek to adopt, and some have adopted, ordinances within their jurisdictions restricting the use of or regulating the time, place and manner of drilling or hydraulic fracturing. No assurance can be given as to whether or not similar measures might be considered or implemented in the jurisdictions in which our properties are located. If new laws, regulations or ordinances that significantly restrict or otherwise impact hydraulic fracturing are passed by Congress or adopted in the states or local municipalities where our properties are located, such legal requirements could prohibit or make it more difficult or costly for us to perform hydraulic fracturing activities and thereby could affect the determination of whether a well is commercially viable. In addition, restrictions on hydraulic fracturing could reduce the amount of oil and natural gas that we are ultimately able to produce in commercially paying quantities and the calculation of our reserves.
In addition, on July 3, 2014, a major university and U.S. Geological Survey researchers published a study purporting to find a causal connection between the deep well injection of hydraulic fracturing wastewater and a sharp increase in seismic activity in Oklahoma since 2008. Such studies may trigger new legislation or regulations that would limit or ban the disposal of hydraulic fracturing wastewater in deep injection wells. If such new laws or rules are adopted, our operations may be curtailed while alternative treatment and disposal methods are developed and approved.
Further, on May 19, 2014, the EPA published an Advance Notice of Proposed Rulemaking under the Toxic Substances Control Act, relating to the disclosure of chemical substances and mixtures used in oil and gas exploration and production. Depending on the precise disclosure requirements the EPA elects to impose, if any, we may be obliged to disclose valuable proprietary information, and failure to do so may subject us to penalties.
Refer to “Hydraulic Fracturing” in Item 2 of this Annual Report on Form 10-K for more information on hydraulic fracturing.
We have entered into physical delivery contracts and do not expect to be able to deliver all the oil required under such contracts and, as a result, we expect we will be required to make deficiency payments.
We have entered into three physical delivery contracts which require us to deliver fixed volumes of crude oil. One of these contracts is tied to oil production at our Sanish field in Mountrail County, North Dakota, and two are tied to oil production at our Redtail field in Weld County, Colorado. Although, we believe that our production and reserves are sufficient to fulfill the delivery commitment at our Sanish field in North Dakota, if we fail to deliver the committed volumes, we would be required to pay a deficiency payment of $7.00 per undelivered barrel. At our Redtail field, we have determined that it is no longer probable that future oil production will be sufficient to meet the minimum volume requirements and we expect to make periodic deficiency payments that total $4.75 per undelivered Bbl under one contract and $4.00 per undelivered Bbl under the other contract. During 2015, total deficiency payments under these contracts amounted to $15 million. See “Properties – Delivery Commitments” for more information about these delivery contracts.
Reserve estimates depend on many assumptions that may turn out to be inaccurate. Any material inaccuracies in these reserve estimates or underlying assumptions will materially affect the quantities and present value of our reserves. For example, the value of our reserves as of December 31, 2015 was calculated using SEC pricing which may be higher than the fair market value of our reserves calculated using current market prices.
The process of estimating oil and natural gas reserves is complex. It requires interpretations of available technical data and many assumptions, including assumptions relating to economic factors. Any significant inaccuracies in these interpretations or assumptions could materially affect the estimated quantities and present value of reserves referred to in this Annual Report on Form 10-K.
In order to prepare our estimates, we must project production rates and timing of development expenditures. We must also analyze available geological, geophysical, production and engineering data. The extent, quality and reliability of this data can vary. The process also requires economic assumptions about matters such as the following:
|
· |
historical production from the area compared with production rates from other producing areas; |
|
· |
the assumed effect of governmental regulation; and |
|
· |
assumptions about future prices of oil, NGLs and natural gas including differentials, production and development costs, gathering and transportation costs, severance and excise taxes, capital expenditures and availability of funds. |
22
Therefore, estimates of oil and natural gas reserves are inherently imprecise. Actual future production; oil, NGL and natural gas prices; revenues; taxes; exploration and development expenditures; operating expenses; and quantities of recoverable oil and natural gas reserves will most likely vary from our estimates. Any significant variance could materially affect the estimated quantities and present value of reserves referred to in this Annual Report on Form 10-K. In addition, we may adjust estimates of proved reserves to reflect production history, results of exploration and development, prevailing oil and natural gas prices and other factors, many of which are beyond our control.
You should not assume that the present value of future net revenues from our proved reserves, as referred to in this report, is the current market value of our estimated proved oil and natural gas reserves. In accordance with SEC requirements, we base the estimated discounted future net cash flows from our proved reserves on 12-month average prices and current costs as of the date of the estimate. The 12-month average prices used for the year ended December 31, 2015 were $50.28 per Bbl and $2.58 per Mcf. Actual future prices and costs may differ materially from those used in the estimate. If the 12-month average oil prices used to calculate our oil reserves decline by $1.00 per Bbl, then the standardized measure of discounted future net cash flows of our estimated proved reserves as of December 31, 2015 would have decreased by $198 million. If the 12-month average natural gas prices used to calculate our natural gas reserves decline by $0.10 per Mcf, then the standardized measure of discounted future net cash flows of our estimated proved reserves as of December 31, 2015 would have decreased by $24 million.
Our exploration and development operations require substantial capital, and we may be unable to obtain needed capital or financing on satisfactory terms, which could lead to a loss of properties and a decline in our oil and natural gas reserves.
The oil and gas industry is capital intensive. We make and expect to continue to make substantial capital expenditures in our business and operations for the exploration, development, production and acquisition of oil and natural gas reserves. To date, we have financed capital expenditures through a combination of equity and debt issuances, bank borrowings, internally generated cash flows, agreements with industry partners and oil and gas property divestments. We intend to finance future capital expenditures with cash flow from operations, cash on hand and financing arrangements. Our cash flow from operations and access to capital is subject to a number of variables, including:
|
· |
the prices at which oil and natural gas are sold; |
|
· |
our proved reserves; |
|
· |
the level of oil and natural gas we are able to produce from existing wells; |
|
· |
the costs of producing oil and natural gas; and |
|
· |
our ability to acquire, locate and produce new reserves. |
If our revenues or the borrowing base under our credit agreement decrease as a result of lower oil and natural gas prices, operating difficulties, declines in reserves, or for any other reason, then we may have limited ability to obtain the capital necessary to sustain our operations at current levels.
We may, from time to time, need to seek additional financing. There can be no assurance as to the availability or terms of any additional financing. If additional capital is needed, we may not be able to obtain debt or equity financing on terms favorable to us, or at all. If cash generated by operations or available under our revolving credit facility is not sufficient to meet our capital requirements, the failure to obtain additional financing could result in a curtailment of our operations relating to the exploration and development of our prospects, which in turn could lead to a possible loss of properties and a decline in our oil and natural gas reserves.
Risks associated with the production, gathering, transportation and sale of oil, NGLs and natural gas could adversely affect net income and cash flows.
Our net income and cash flows will depend upon, among other things, oil, NGL and natural gas production and the prices and costs incurred to develop and produce oil and natural gas reserves. Drilling, production or transportation accidents that temporarily or permanently halt the production and sale of oil, NGLs and natural gas will decrease revenues and increase expenditures. For example, accidents may occur that result in personal injuries, property damage, damage to productive formations or equipment and environmental damages. Any costs incurred in connection with any such accidents that are not insured against will have the effect of reducing net income. Also, we do not have insurance policies in effect that are intended to provide coverage for losses solely related to hydraulic fracturing operations. Please read “— Federal, state and local legislative and regulatory initiatives relating to hydraulic fracturing...” above in these Risk Factors for a discussion of the uncertainty involved in the regulation of hydraulic fracturing. Also, our oil, NGL and natural gas production depends in large part on the proximity and capacity of pipeline systems and transportation facilities which are mostly owned by third parties. The lack of availability or the lack of capacity on these systems and facilities could result in the curtailment of production or the delay or discontinuance of drilling plans. Similarly, curtailments or damage to pipelines and other transportation facilities used to transport oil, NGLs and natural gas production to markets for sale could decrease revenues or increase transportation expenses. Any such curtailments or damage to the gathering systems could also require finding alternative means to transport the oil, NGLs and natural gas production, which alternative means could result in additional costs that will have the effect of increasing transportation expenses.
23
Also, in response to accidents involving rail cars carrying Bakken formation crude oil, the U.S. Department of Transportation (the “DOT”) issued an emergency order on February 25, 2014 that requires rail shippers to test the makeup of such crude oil before transporting it. This move follows the safety alert the DOT issued in January 2014 that Bakken formation crude oil is more flammable than other types of crude oil and has been followed by additional emergency orders and safety advisories and alerts. An accident involving rail cars could result in significant personal injuries and property and environmental damage. In May 2015, the Pipeline and Hazardous Material Safety Administration issued new rules applicable to “high-hazard flammable trains”, discussed in “Item 1 Business – Regulation – Regulation of Transportation and Sale of Oil” above, which could increase transportation expenses. Similarly, regulatory responses to the October 2015 failure at a Southern California underground natural gas storage facility could also lead to increased expenses for underground storage.
In addition, drilling, production and transportation of hydrocarbons bear the inherent risk of loss of containment. Potential consequences include loss of reserves, loss of production, loss of economic value associated with the affected wellbore, contamination of soil, ground water and surface water, as well as potential fines, penalties or damages associated with any of the foregoing consequences.
Our acreage must be drilled before lease expiration, generally within three to five years, in order to hold the acreage by production. Failure to drill sufficient wells in order to hold acreage will result in substantial lease renewal costs, or if renewal is not feasible, loss of our lease and prospective drilling opportunities.
Unless production is established on our undeveloped acreage, the underlying leases will expire. As of December 31, 2015, the portion of our net undeveloped acreage that is subject to expiration over the next three years, if not successfully developed or renewed, is approximately 29% in 2016, 18% in 2017 and 22% in 2018. The cost to renew such leases may increase significantly, and we may not be able to renew such leases on commercially reasonable terms or at all. In addition, on certain portions of our acreage, third-party leases become immediately effective if our leases expire. As such, our actual drilling activities may materially differ from our current expectations, which could adversely affect our business.
Our use of enhanced recovery methods creates uncertainties that could adversely affect our results of operations and financial condition.
One of our business strategies is to commercially develop oil reservoirs using enhanced recovery technologies. For example, we inject water and CO2 into formations on some of our properties to increase the production of oil and natural gas. The additional production and reserves attributable to the use of these enhanced recovery methods are inherently difficult to predict. If our enhanced recovery programs do not allow for the extraction of oil and gas in the manner or to the extent that we anticipate, our future results of operations and financial condition could be materially adversely affected. Additionally, our ability to utilize CO2 injection as an enhanced recovery technique is subject to our ability to obtain sufficient quantities of CO2. Under our CO2 contracts, if the supplier suffers an inability to deliver its contractually required quantities of CO2 to us and other parties with whom it has CO2 contracts, then the supplier may reduce the amount of CO2 on a pro rata basis it provides to us and such other parties. If this occurs or if we are otherwise limited in the quantities of CO2 available to us, we may not have sufficient CO2 to produce oil and natural gas in the manner or to the extent that we anticipate, and our future oil and gas production volumes could be negatively impacted. These contracts are also structured as “take-or-pay” arrangements, which require us to continue to make payments even if we decide to terminate or reduce our use of CO2 as part of our enhanced recovery techniques.
The development of the proved undeveloped reserves in the North Ward Estes field may take longer and may require higher levels of capital expenditures than we currently anticipate.
As of December 31, 2015, proved undeveloped reserves comprised 40% of the North Ward Estes field’s total estimated proved reserves. To fully develop these reserves, we expect to incur future development costs of $736 million at the North Ward Estes field as of December 31, 2015. This field encompasses 13% of our total estimated future development costs related to proved undeveloped reserves. Development of these reserves may take longer and require higher levels of capital expenditures than we currently anticipate. In addition, the development of these reserves will require the use of enhanced recovery techniques, including waterflood and CO2 injection installations, the success of which is less predictable than traditional development techniques.
Our acquisition activities may not be successful.
As part of our growth strategy, we have made and may continue to make acquisitions of businesses and properties. However, suitable acquisition candidates may not continue to be available on terms and conditions we find acceptable, and acquisitions pose substantial risks to our business, financial condition and results of operations. In pursuing acquisitions, we compete with other companies, many of which have greater financial and other resources to acquire attractive companies and properties. The following are some of the risks associated with acquisitions, including any completed or future acquisitions:
|
· |
some of the acquired businesses or properties may not produce revenues, reserves, earnings or cash flow at anticipated levels; |
24
|
· |
we may assume liabilities that were not disclosed to us or that exceed our estimates; |
|
· |
we may be unable to integrate acquired businesses successfully and realize anticipated economic, operational and other benefits in a timely manner, which could result in substantial costs and delays or other operational, technical or financial problems; |
|
· |
acquisitions could disrupt our ongoing business, distract management, divert resources and make it difficult to maintain our current business standards, controls and procedures; |
|
· |
we may issue additional equity or debt securities in order to fund future acquisitions; and |
|
· |
we may incur losses as a result of title defects. |
The unavailability or high cost of additional drilling rigs, equipment, supplies, personnel and oil field services could adversely affect our ability to execute our exploration and development plans on a timely basis or within our budget.
The demand for qualified and experienced field personnel to conduct field operations, geologists, geophysicists, engineers and other professionals in the oil and natural gas industry can fluctuate significantly, often in correlation with oil and natural gas prices, causing periodic shortages. Historically, there have been shortages of drilling rigs and other oilfield equipment as demand for rigs and equipment has increased along with the number of wells being drilled. These factors also cause significant increases in costs for equipment, services and personnel. Higher oil and natural gas prices generally stimulate demand and result in increased prices for drilling rigs, crews and associated supplies, equipment and services. Additionally, our operations in some instances require supply materials for production, such as CO2, which could become subject to shortage and increasing costs. Shortages of field personnel and other professionals, drilling rigs, equipment or supplies or price increases could delay or adversely affect our exploration and development operations, which could have a material adverse effect on our business, financial condition, results of operations or cash flows, or restrict operations.
Our identified drilling locations are scheduled out over several years, making them susceptible to uncertainties that could materially alter the occurrence or timing of their drilling.
We have specifically identified and scheduled drilling locations as an estimation of our future multi-year drilling activities on our existing acreage. As of December 31, 2015, we had identified a drilling inventory of over 3,000 gross drilling locations. These scheduled drilling locations represent a significant part of our growth strategy. Our ability to drill and develop these locations depends on a number of uncertainties, including oil and natural gas prices, the availability of capital, costs of oil field goods and services, drilling results, our ability to extend drilling acreage leases beyond expiration, regulatory approvals and other factors. Because of these uncertainties, we do not know if the numerous potential drilling locations we have identified will ever be drilled or if we will be able to produce oil or gas from these or any other potential drilling locations. As such, our actual drilling activities may materially differ from those presently identified, which could in turn adversely affect our business.
We have been an early entrant into new or emerging plays. As a result, our drilling results in these areas are uncertain, the value of our undeveloped acreage may decline and we may incur impairment charges if drilling results are unsuccessful.
While our costs to acquire undeveloped acreage in new or emerging plays have generally been less than those of later entrants into a developing play, our drilling results in these areas are more uncertain than drilling results in areas that are developed and producing. Since new or emerging plays have limited or no production history, we are unable to use past drilling results in those areas to help predict our future drilling results. Therefore, our cost of drilling, completing and operating wells in these areas may be higher than initially expected, and the value of our undeveloped acreage will decline if drilling results are unsuccessful. Furthermore, if drilling results are unsuccessful, we may be required to write down the carrying value of our undeveloped acreage in new or emerging plays. For example, during 2015 we recorded a $49 million non-cash charge for the impairment of undeveloped oil and gas properties where we have no current or future plans to drill. We may also incur such impairment charges in the future, which could have a material adverse effect on our results of operations in the period taken. Additionally, our rights to develop a portion of our undeveloped acreage may expire if not successfully developed or renewed. See “Acreage” in Item 2 of this Annual Report on Form 10-K for more information relating to the expiration of our rights to develop undeveloped acreage.
Properties that we acquire may not produce as projected, and we may be unable to identify liabilities associated with the properties or obtain indemnities from sellers for liabilities they may have created.
Our business strategy includes a continuing acquisition program. From 2004 through 2015, we completed 21 separate significant acquisitions of producing properties with a combined purchase price of $6.4 billion for estimated proved reserves as of the effective dates of the acquisitions of 445.2 MMBOE. The successful acquisition of producing properties requires assessment of many factors, which are inherently inexact and may be inaccurate, including the following:
|
· |
the amount of recoverable reserves; |
|
· |
future oil and natural gas prices; |
|
· |
estimates of operating costs; |
|
· |
estimates of future development costs; |
25
|
· |
timing of future development costs; |
|
· |
estimates of the costs and timing of plugging and abandonment; and |
|
· |
the assumption of unknown potential environmental and other liabilities, losses or costs, including for example, historical spills or releases for which we are not indemnified or for which our indemnity is inadequate. |
Our assessment will not reveal all existing or potential problems, nor will it permit us to become familiar enough with the properties to assess fully their capabilities and deficiencies. In the course of our due diligence, we may not inspect every well, platform, facility or pipeline. Inspections may not reveal structural and environmental problems, such as pipeline corrosion or groundwater contamination, when they are made. We may not be able to obtain contractual indemnities from the seller for liabilities that it created. We may be required to assume the risk of the physical condition of the properties in addition to the risk that the properties may not perform in accordance with our expectations.
Part of our business strategy includes selling properties which subjects us to various risks.
Part of our business strategy includes selling properties when we believe that the sales price realized will provide an above average rate of return for the property or when the property no longer matches the profile of properties we desire to own. We are currently exploring asset sales of non-core properties, but there is no assurance that such sales will occur, and if they do occur, they may not occur on the time frames or with the economic terms we expect. Unless we conduct successful exploration, development and production activities or acquire properties containing proved reserves, divestitures of our properties will reduce our proved reserves and potentially our production. We may not be able to develop, find or acquire additional reserves sufficient to replace such reserves and production from any of the properties we sell. Additionally, agreements pursuant to which we sell properties may include terms that survive closing of the sale, including indemnification provisions, which could obligate us to substantial liabilities.
Our use of oil and natural gas price hedging contracts involves only a portion of our anticipated production and credit risk and may limit higher revenues in the future in connection with commodity price increases and may result in significant fluctuations in our net income.
We enter into hedging transactions of our oil and natural gas production revenues to reduce our exposure to fluctuations in the price of oil and natural gas. Our hedging transactions to date have consisted of financially settled crude oil and natural gas options contracts, primarily costless collars and swap contracts, placed with major financial institutions. As of January 1, 2016, we had contracts covering the sale of 1,650,000 barrels of oil per month for all of 2016, which represents approximately 54% of our forecasted 2016 oil production volumes. All of our oil hedges will expire by December 2017. See “Quantitative and Qualitative Disclosures about Market Risk” in Item 7A of this Annual Report on Form 10-K for pricing information and a more detailed discussion of our hedging transactions.
We may in the future enter into these and other types of hedging arrangements to reduce our exposure to fluctuations in the market prices of oil and natural gas, or alternatively, we may decide to unwind or restructure the hedging arrangements we previously entered into. Hedging transactions expose us to risk of financial loss in some circumstances, including if production is less than expected, the other party to the contract defaults on its obligations or there is a change in the expected differential between the underlying price in the hedging agreement and actual prices received. Hedging transactions may limit the benefit we may otherwise receive from increases in the price for oil and natural gas. Our three-way collars only provide partial protection against declines in market prices due to the fact that when the market price falls below the sub-floor, the minimum price we will receive will be NYMEX plus the difference between the floor and the sub-floor. Furthermore, if we do not engage in hedging transactions or unwind hedging transactions we previously entered into, then we may be more adversely affected by declines in oil and natural gas prices than our competitors who engage in hedging transactions. Additionally, hedging transactions may expose us to cash margin requirements.
We recognize all gains and losses from changes in commodity derivative fair values immediately in earnings rather than deferring any such amounts in accumulated other comprehensive income (loss). Consequently, we may experience significant net losses, on a non-cash basis, due to changes in the value of our hedges as a result of commodity price volatility.
Seasonal weather conditions and lease stipulations adversely affect our ability to conduct drilling activities in some of the areas where we operate.
Oil and gas operations in the Rocky Mountains are adversely affected by seasonal weather conditions and lease stipulations designed to protect various wildlife. In certain areas, drilling and other oil and gas activities can only be conducted during the spring and summer months. This limits our ability to operate in those areas and can intensify competition during those months for drilling rigs, oil field equipment, services, supplies and qualified personnel, which may lead to periodic shortages. Resulting shortages or high costs could delay our operations, cause temporary declines in our oil and gas production and materially increase our operating and capital costs.
26
An increase in the differential or decrease in the premium between the NYMEX or other benchmark prices of oil and natural gas and the wellhead price we receive could have a material adverse effect on our results of operations, financial condition and cash flows.
The prices that we receive for our oil and natural gas production generally trade at a discount, but sometimes at a premium, to the relevant benchmark prices such as NYMEX. A negative difference between the benchmark price and the price received is called a differential and a positive difference is called a premium. The differential and premium may vary significantly due to market conditions, the quality and location of production and other risk factors. We cannot accurately predict oil and natural gas differentials and premiums. Increases in the differential and decreases in the premium between the benchmark price for oil and natural gas and the wellhead price we receive could have a material adverse effect on our results of operations, financial condition and cash flows.
We may incur substantial losses and be subject to substantial liability claims as a result of our oil and gas operations.
We are not insured against all risks. Losses and liabilities arising from uninsured and underinsured events could materially and adversely affect our business, financial condition or results of operations. Our oil and natural gas exploration and production activities are subject to all of the operating risks associated with drilling for and producing oil and natural gas, including the possibility of:
|
· |
environmental hazards, such as uncontrollable flows of oil, gas, brine, well fluids, toxic gas or other pollution into the environment, including groundwater and shoreline contamination; |
|
· |
abnormally pressured formations; |
|
· |
mechanical difficulties, such as stuck oil field drilling and service tools and casing collapse; |
|
· |
the loss of well control; |
|
· |
fires and explosions; |
|
· |
personal injuries and death; and |
|
· |
natural disasters. |
Any of these risks could adversely affect our ability to conduct operations or result in substantial losses to our company. We may elect not to obtain insurance if we believe that the cost of available insurance is excessive relative to the risks presented. In addition, pollution and environmental risks generally are not fully insurable. If a significant accident or other event occurs and is not fully covered by insurance, then it could adversely affect us.
We have limited control over activities on properties we do not operate, which could reduce our production and revenues and increase capital expenditures.
We operate 92% of our net productive oil and natural gas wells, which represents 88% of our proved developed producing reserves as of December 31, 2015. If we do not operate the properties in which we own an interest, we do not have control over normal operating procedures, expenditures or future development of our properties. The failure of an operator of our wells to adequately perform operations or an operator’s breach of the applicable agreements could reduce our production and revenues. The success and timing of our drilling and development activities on properties operated by others therefore depends upon a number of factors outside of our control, including the operator’s decisions with respect to the timing and amount of capital expenditures, the period of time over which the operator seeks to generate a return on capital expenditures, inclusion of other participants in drilling wells, and the use of technology, as well as the operator’s expertise and financial resources and the operator’s relative interest in the field. Operators may also opt to decrease operational activities following a significant decline in, or a sustained period of low, oil or natural gas prices. Because we do not have a majority interest in most wells we do not operate, we may not be in a position to remove the operator in the event of poor performance. Accordingly, while we use commercially reasonable efforts to cause the operator to act as a reasonably prudent operator, we are limited in our ability to do so.
Our use of 3-D seismic data is subject to interpretation and may not accurately identify the presence of oil and gas, which could adversely affect the results of our drilling operations.
Even when properly used and interpreted, 3-D seismic data and visualization techniques are only tools used to assist geoscientists in identifying subsurface structures and hydrocarbon indicators and do not enable the interpreter to know whether hydrocarbons are, in fact, present in those structures. In addition, the use of 3-D seismic and other advanced technologies requires greater predrilling expenditures than traditional drilling strategies do, and we could incur losses as a result of such expenditures. Thus, some of our drilling activities may not be successful or economical, and our overall drilling success rate or our drilling success rate for activities in a particular area could decline. We often gather 3-D seismic data over large areas. Our interpretation of seismic data delineates for us those portions of an area that we believe are desirable for drilling. Therefore, we may choose not to acquire option or lease rights prior to acquiring seismic data, and in many cases, we may identify hydrocarbon indicators before seeking option or lease rights in the location. If we are not able to lease those locations on acceptable terms, it would result in our having made substantial expenditures to acquire and analyze 3-D seismic data without having an opportunity to attempt to benefit from those expenditures.
27
Market conditions or operational impediments may hinder our access to oil and gas markets or delay our production.
In connection with our continued development of oil and gas properties, we may be disproportionately exposed to the impact of delays or interruptions of production from wells in these properties, caused by transportation capacity constraints, curtailment of production or the interruption of transporting oil and gas volumes produced. In addition, market conditions or a lack of satisfactory oil and gas transportation arrangements may hinder our access to oil and gas markets or delay our production. The availability of a ready market for our oil, NGL and natural gas production depends on a number of factors, including the demand for and supply of oil, NGLs and natural gas and the proximity of reserves to pipelines and terminal facilities. Our ability to market our production depends substantially on the availability and capacity of gathering systems, pipelines and processing facilities owned and operated by third-parties. Additionally, entering into arrangements for these services exposes us to the risk that third parties will default on their obligations under such arrangements. Our failure to obtain such services on acceptable terms or the default by a third party on their obligation to provide such services could materially harm our business. We may be required to shut in wells for a lack of a market or because access to gas pipelines, gathering systems or processing facilities may be limited or unavailable. If that were to occur, then we would be unable to realize revenue from those wells until production arrangements were made to deliver the production to market.
We are subject to complex laws that can affect the cost, manner or feasibility of doing business.
Exploration, development, production and sale of oil and natural gas are subject to extensive federal, state, local and international regulation. We may be required to make large expenditures to comply with governmental regulations. Matters subject to regulation include:
|
· |
discharge permits for drilling operations; |
|
· |
drilling bonds; |
|
· |
reports concerning operations; |
|
· |
the spacing of wells; |
|
· |
unitization and pooling of properties; and |
|
· |
taxation. |
Under these laws, we could be liable for personal injuries, property damage and other damages. Failure to comply with these laws also may result in the suspension or termination of our operations and subject us to administrative, civil and criminal penalties. Moreover, these laws could change in ways that could substantially increase our costs. Any such liabilities, penalties, suspensions, terminations or regulatory changes could materially and adversely affect our financial condition and results of operations.
Our operations may incur substantial costs and liabilities to comply with environmental laws and regulations.
Our oil and gas operations are subject to stringent federal, state and local laws and regulations relating to the release or disposal of materials into the environment or otherwise relating to environmental protection. These laws and regulations may require the acquisition of a permit before drilling commences; restrict the types, quantities and concentration of materials that can be released into the environment in connection with drilling and production activities; limit or prohibit drilling activities on certain lands lying within wilderness, wetlands and other protected areas; and impose substantial liabilities for pollution resulting from our operations. Failure to comply with these laws and regulations may result in the assessment of administrative, civil and criminal penalties, incurrence of investigatory or remedial obligations, or the imposition of injunctive relief. Under these environmental laws and regulations, we could be held strictly liable for the removal or remediation of previously released materials or property contamination regardless of whether we were responsible for the release or if our operations were standard in the industry at the time they were performed. Private parties, including the surface owners of properties upon which we drill, may also have the right to pursue legal actions to enforce compliance as well as to seek damages for non-compliance with environmental laws and regulations or for personal injury or property damage. We may not be able to recover some or any of these costs from insurance. Moreover, federal law and some state laws allow the government to place a lien on real property for costs incurred by the government to address contamination on the property.
Changes in environmental laws and regulations occur frequently and may have a materially adverse impact on our business. For example, in 2012, the EPA published final rules under the Federal Clean Air Act (the “CAA”) that subject oil and natural gas production, processing, transmission and storage operations to regulation under the New Source Performance Standards and National Emission Standards for Hazardous Air Pollutants. With regards to production activities, these rules require, among other things, the reduction of volatile organic compound emissions from certain fractured and refractured gas wells for which well completion operations are conducted and, in particular, requiring some of these wells to use reduced emission completions, also known as “green completions”, after January 1, 2015. These regulations also establish specific new requirements regarding emissions from production-related wet seal and reciprocating compressors, pneumatic controllers and storage vessels. Additionally, the EPA announced in 2015 that it would directly regulate methane emissions from oil and natural gas wells for the first time as part of President Obama’s Climate Action Plan. As part of this strategy, on August 18, 2015, the EPA proposed a suite of requirements relating to methane and volatile organic compounds (“VOC”) emissions from the oil and natural gas industry. These include: (i) proposed updates to the New Source Performance Standards and Draft Control Techniques Guidelines for new and modified sources in the oil and gas industry, (ii) Draft
28
Control Techniques Guidelines for reducing VOC emissions from existing oil and gas sources in certain ozone nonattainment areas and states in the Ozone Transport Region, (iii) a proposed Source Determination Rule to clarify the EPA’s air permitting rules as they apply to the oil and natural gas industry, and (iv) a proposed Federal Implementation Plan for the EPA’s Indian Country Minor New Source Review program for oil and gas production sources. In July 2015, the EPA also finalized two updates to the 2012 New Source Performance Standards for the oil and natural gas industry to address the definition of low-pressure wells and references to tanks that are connected to one another. In November 2015, the EPA also issued a request for additional data and information on emissions of hazardous air pollutants that were not available in 2012 when the EPA updated its major source air toxics standards for oil and natural gas production facilities and natural gas transmission and storage facilities. The final rule is expected in 2016.
After the closing of the Kodiak Acquisition, the EPA contacted us to discuss Kodiak’s responses to a June 2014 information request from the EPA under Section 114(a) of the CAA. In addition, in July 2015, we received an information request from the EPA under Section 114(a) of the CAA. The information requests relate to tank batteries used in our Williston Basin operations and our compliance with certain regulatory requirements at those locations, including the control of air pollutant emissions from those facilities. We have responded to the EPA’s information requests and are in settlement discussions with the EPA and the North Dakota Department of Health (the “NDDoH”) regarding potential noncompliance with the federal CAA at our Williston Basin facilities, as implemented by the EPA and the NDDoH. To date, no formal federal or state enforcement action has been commenced in connection with this matter beyond receipt of the noted letters. We anticipate that resolution of this matter will result in civil penalties of an undetermined amount and may require us to undertake corrective actions which may increase our development and/or operating costs. Given the uncertainty in matters such as these, we are unable to predict the ultimate outcome of this matter at this time. While we do not believe that any penalties or corrective action expenditures that may result from this matter will have a material adverse effect on our financial position, results of operations or cash flows, we cannot provide any assurance that this will be the case.
Any increased governmental regulation or suspension of oil and natural gas exploration or production activities that arises out of these incidents could result in higher operating costs, which could in turn adversely affect our operating results. Also, for instance, any changes in laws or regulations that result in more stringent or costly material handling, storage, transport, disposal or cleanup requirements could require us to make significant expenditures to maintain compliance and may otherwise have a material adverse effect on our results of operations, competitive position or financial condition as well as those of the oil and gas industry in general.
Climate change legislation or regulations restricting emissions of greenhouse gases could result in increased operating costs and reduced demand for oil and gas that we produce.
On December 15, 2009, the EPA published its findings that emissions of carbon dioxide, methane and other greenhouse gases (“GHG”) present an endangerment to public health and the environment because emissions of such gases are, according to the EPA, contributing to the warming of the earth’s atmosphere and other climate changes. Based on these findings, the EPA has begun adopting and implementing regulations that restrict emissions of GHG under existing provisions of the CAA, including one rule that limits emissions of GHG from motor vehicles beginning with the 2012 model year. The EPA has asserted that these final motor vehicle GHG emission standards trigger the CAA construction and operating permit requirements for stationary sources, commencing when the motor vehicle standards took effect on January 2, 2011. On June 3, 2010, the EPA published its final rule to address the permitting of GHG emissions from stationary sources under the Prevention of Significant Deterioration (the “PSD”) and Title V permitting programs. This rule “tailors” these permitting programs to apply to certain stationary sources of GHG emissions in a multi-step process, with the largest sources first subject to permitting. Further, facilities required to obtain PSD permits for their GHG emissions are required to reduce those emissions consistent with guidance for determining “best available control technology” standards for GHG, which guidance was published by the EPA in November 2010. Also in November 2010, the EPA expanded its existing GHG reporting rule to include onshore oil and natural gas production, processing, transmission, storage and distribution facilities. This rule requires reporting of GHG emissions from such facilities on an annual basis with reporting beginning in 2012 for emissions occurring in 2011.
In June 2014, the Supreme Court upheld most of the EPA’s GHG permitting requirements, allowing the agency to regulate the emission of GHG from stationary sources already subject to the PSD and Title V requirements. Certain of our equipment and installations may currently be subject to PSD and Title V requirements and hence, under the Supreme Court’s ruling, may also be subject to the installation of controls to capture GHGs. For any equipment or installation so subject, we may have to incur increased compliance costs to capture related GHG emissions.
In accordance with President Obama’s Climate Action Plan, on August 3, 2015, the EPA issued a rule to reduce carbon emissions from electric generating units. The rule, commonly called the “Clean Power Plan”, requires states to develop plans to reduce carbon emissions from fossil fuel-fired generating units commencing in 2022, with the reductions to be fully phased in by 2030. Each state is given a different carbon reduction target, but the EPA expects that, in the aggregate, the overall proposal will reduce carbon emissions from electric generating units by 32% from 2005 levels. States are given substantial flexibility in meeting their emission reduction targets and can generally choose to lower carbon emissions by replacing higher carbon generation, such as coal or natural gas, with lower carbon generation, such as efficient natural gas units or renewable energy alternatives. Several industry groups and states have
29
challenged the Clean Power Plan in the Court of Appeals for the D.C. Circuit, and on February 9, 2016, the U.S. Supreme Court stayed the implementation of the Clean Power Plan while it is being challenged in court.
In addition, both houses of Congress have actively considered legislation to reduce emissions of GHG, and many states have already taken legal measures to reduce emissions of GHG, primarily through the development of GHG inventories, greenhouse gas permitting and/or regional GHG “cap and trade” programs. Most of these “cap and trade” programs work by requiring either major sources of emissions or major producers of fuels to acquire and surrender emission allowances, with the number of allowances available for purchase reduced each year until the overall GHG emission reduction goal is achieved. In the absence of new legislation, the EPA is issuing new regulations that limit emissions of GHG associated with our operations which will require us to incur costs to inventory and reduce emissions of GHG associated with our operations and which could adversely affect demand for the oil, NGLs and natural gas that we produce. Finally, it should be noted that many scientists have concluded that increasing concentrations of GHG in the atmosphere may produce climate changes that have significant physical effects, such as increased frequency and severity of storms, droughts, floods and other climatic events. If any such effects were to occur, they could have an adverse effect on our assets and operations.
Unless we replace our oil and natural gas reserves, our reserves and production will decline, which would adversely affect our cash flows and results of operations.
Unless we conduct successful exploration, development and production activities or acquire properties containing proved reserves, our proved reserves will decline as those reserves are produced. Producing oil and natural gas reservoirs generally are characterized by declining production rates that vary depending upon reservoir characteristics and other factors. Our future oil and natural gas reserves and production, and therefore our cash flow and income, are highly dependent on our success in efficiently developing and producing our current reserves and economically finding or acquiring additional recoverable reserves. We may not be able to develop, find or acquire additional reserves to replace our current and future production.
The loss of senior management or technical personnel could adversely affect us.
To a large extent, we depend on the services of our senior management and technical personnel. The loss of the services of our senior management or technical personnel, including James J. Volker, Chairman, President and Chief Executive Officer; Peter W. Hagist, Senior Vice President, Planning; Rick A. Ross, Senior Vice President, Operations; Michael J. Stevens, Senior Vice President and Chief Financial Officer; Mark R. Williams, Senior Vice President, Exploration and Development; Brent P. Jensen, Vice President, Finance and Treasurer; Steven A. Kranker, Vice President, Reservoir Engineering/Acquisitions; or David M. Seery, Vice President, Land, could have a material adverse effect on our operations. We do not maintain, nor do we plan to obtain, any insurance against the loss of any of these individuals.
Substantial acquisitions or other transactions could require significant external capital and could change our risk and property profile.
In order to finance acquisitions of additional producing or undeveloped properties, we may need to alter or increase our capitalization substantially through the issuance of debt or equity securities, the sale of production payments or other means. These changes in capitalization may significantly affect our risk profile. Additionally, significant acquisitions or other transactions can change the character of our operations and business. The character of the new properties may be substantially different in operating or geological characteristics or geographic location than our existing properties. Furthermore, we may not be able to obtain external funding for additional future acquisitions or other transactions or to obtain external funding on terms acceptable to us.
Competition in the oil and gas industry is intense, which may adversely affect our ability to compete.
We operate in a highly competitive environment for acquiring properties, obtaining investment capital, securing oilfield goods and services, marketing oil and natural gas products and attracting and retaining qualified personnel. Many of our competitors possess and employ financial, technical and personnel resources substantially greater than ours, which can be particularly important in the areas in which we operate. Those companies may be able to pay more for productive oil and gas properties and exploratory prospects and to evaluate, bid for and purchase a greater number of properties and prospects than our financial or personnel resources allow for. Our ability to acquire additional prospects and to find and develop reserves in the future will depend on our ability to evaluate and select suitable properties and to consummate transactions in a highly competitive environment. We may not be able to compete successfully in the future in acquiring prospective reserves, developing reserves, marketing hydrocarbons, attracting and retaining quality personnel and raising additional capital.
30
Certain federal income tax deductions currently available with respect to oil and gas exploration and development may be eliminated or deferred as a result of future legislation.
In February 2016, President Obama’s Administration released its proposed federal budget for fiscal year 2017 that would, if enacted into law, make significant changes to United States tax laws, including the elimination of certain key U.S. federal income tax preferences currently available to oil and gas exploration and production companies. Such changes include, but are not limited to:
|
· |
the repeal of the percentage depletion allowance for oil and gas properties; |
|
· |
the elimination of current deductions for intangible drilling and development costs; |
|
· |
the elimination of the deduction for U.S. oil and gas production activities; |
|
· |
an extension of the amortization period for certain geological and geophysical expenditures; and |
|
· |
the repeal of the enhanced oil recovery credit. |
It is unclear, however, whether any such changes will be enacted or how soon such changes could be effective. The passage of any legislation containing these or similar changes in U.S. federal income tax law could eliminate or defer certain tax deductions that are currently available with respect to oil and gas exploration and development, and any such changes could negatively affect our financial condition and results of operations.
An additional fee on oil may be imposed as a result of future legislation.
The Obama Administration’s proposed federal budget for fiscal year 2017 would, if enacted into law, impose an additional $10.25 per barrel fee on oil to be phased-in over five years. Details on this proposal have not been made publicly available. It is unclear whether this proposed fee will be enacted or how soon it would be effective. The passage of an additional fee on oil could negatively affect our financial condition and results of operations.
In connection with the passage of the Dodd-Frank Wall Street Reform and Consumer Protection Act, new regulations forthcoming in this area may result in increased costs and cash collateral requirements for the types of oil and gas derivative instruments we use to manage our risks related to oil and gas commodity price volatility.
On July 21, 2010, the Dodd-Frank Wall Street Reform and Consumer Protection Act was enacted into law. This financial reform legislation includes provisions that require over-the-counter derivative transactions to be executed through an exchange or centrally cleared. In addition, the legislation provides an exemption from mandatory clearing requirements based on regulations to be developed by the Commodity Futures Trading Commission (the “CFTC”) and the SEC for transactions by non-financial institutions to hedge or mitigate commercial risk. At the same time, the legislation includes provisions under which the CFTC may impose collateral requirements for transactions, including those that are used to hedge commercial risk. However, during drafting of the legislation, members of Congress adopted report language and issued a public letter stating that it was not their intention to impose margin and collateral requirements on counterparties that utilize transactions to hedge commercial risk. Final rules on major provisions in the legislation, like new margin requirements, will be established through rulemakings and will not take effect until 12 months after the date of enactment. Although we cannot predict the ultimate outcome of these rulemakings, new regulations in this area may result in increased costs and cash collateral requirements for the types of oil and gas derivative instruments we use to hedge and to otherwise manage our financial risks related to volatility in oil and gas commodity prices.
We depend on computer and telecommunications systems, and failures in our systems or cyber security attacks could significantly disrupt our business operations.
We have entered into agreements with third parties for hardware, software, telecommunications and other information technology services in connection with our business. In addition, we have developed proprietary software systems, management techniques and other information technologies incorporating software licensed from third parties. It is possible we could incur interruptions from cyber security attacks, computer viruses or malware. We believe that we have positive relations with our related vendors and maintain adequate anti-virus and malware software and controls; however, any interruptions to our arrangements with third parties for our computing and communications infrastructure or any other interruptions to our information systems could lead to data corruption, communication interruption or otherwise significantly disrupt our business operations.
Our convertible senior notes may adversely affect the market price of our common stock.
The market price of our common stock is likely to be influenced by our convertible senior notes. For example, the market price of our common stock could become more volatile and could be depressed by:
|
· |
investors’ anticipation of the potential resale in the market of a substantial number of additional shares of our common stock received upon conversion of our convertible senior notes; |
31
|
· |
possible sales of our common stock by investors who view our convertible senior notes as a more attractive means of equity participation in us than owning shares of our common stock; and |
|
· |
hedging or arbitrage trading activity that may develop involving our convertible senior notes and our common stock. |
Item 1B. Unresolved Staff Comments
None.
32
Summary of Oil and Gas Properties and Projects
Rocky Mountains Region
Our Rocky Mountains operations include assets in the states of Colorado, Montana and North Dakota. As of December 31, 2015, our estimated proved reserves in the Rocky Mountains region were 695.3 MMBOE (71% oil), which represented 85% of our total estimated proved reserves and contributed 142.9 MBOE/d of average daily production in the fourth quarter of 2015.
Williston Basin
Our properties in the Williston Basin of North Dakota and Montana target the Bakken and Three Forks formations and encompass approximately 778,900 gross (454,800 net) developed and undeveloped acres as of December 31, 2015. Net production from the Williston Basin averaged 128.6 MBOE/d for the fourth quarter of 2015. As of December 31, 2015, we had five rigs active in the Williston Basin. As a result of the sustained decline in crude oil prices, we plan to decrease the number of rigs operating in this area to two for most of 2016, while suspending our completion activity beginning in the second quarter. Across our acreage in the Williston Basin, we have implemented our new completion design which utilizes cemented liners, plug-and-perf technology, significantly higher sand volumes, new diversion technology and both hybrid and slickwater fracture stimulation methods and has resulted in improved initial production rates.
In order to process the produced gas stream from our wells in the Sanish field, we constructed the Robinson Lake gas plant. The plant has a current processing capacity of 130 MMcf/d and fractionation equipment that allows us to convert NGLs into propane and butane, which end products can then be sold locally for higher realized prices. As of December 31, 2015, the plant was processing over 118 MMcf/d.
We also hold a 50% ownership interest in a gas processing plant, gathering systems and related facilities located south of Belfield, North Dakota, which primarily processes production from our Pronghorn field. There is currently inlet compression in place to process 35 MMcf/d, and as of December 31, 2015, the plant was processing over 15 MMcf/d.
Denver Julesburg Basin
Our Redtail field in the DJ Basin in Weld County, Colorado targets the Niobrara and Codell/Fort Hays formations and encompasses approximately 154,300 gross (126,400 net) developed and undeveloped acres as of December 31, 2015. In the fourth quarter of 2015, net production from the Redtail field averaged 14.3 MBOE/d. We have established production in the Niobrara “A”, “B” and “C” zones and the Codell/Fort Hays formations, and we began testing our new slickwater fracture stimulation method in this field in 2015. Our development plan at Redtail currently includes drilling up to eight wells per spacing unit in the Niobrara “A”, “B” and “C” zones and up to four wells per spacing unit in the Codell/Fort Hays formations. Additionally, we are currently evaluating the Codell/Fort Hays formation, which is prospective throughout our acreage in the Redtail field. The next significant round of completions at Redtail is planned for the first quarter of 2016. As of December 31, 2015, we had two drilling rigs operating in the DJ Basin, and we plan to maintain a two-rig drilling program in this area during 2016, while suspending our completion activity beginning in the second quarter.
In April 2014, we brought online the Redtail gas plant to process the associated gas produced from our wells in this area. During the third quarter of 2015, the plant’s inlet capacity was expanded to 50 MMcf/d from 20 MMcf/d. As of December 31, 2015, the plant was processing over 25 MMcf/d.
Permian Basin Region
Our Permian Basin operations include our North Ward Estes field in the Ward and Winkler counties of Texas. As of December 31, 2015, the Permian Basin region contributed 120.3 MMBOE (83% oil) of estimated proved reserves to our portfolio of operations, which represented 14% of our total estimated proved reserves and contributed 9.2 MBOE/d of average daily production in the fourth quarter of 2015.
Our North Ward Estes field encompasses approximately 64,900 gross (62,900 net) developed and undeveloped acres as of December 31, 2015. This field has responded positively to the water and CO2 floods that we initiated in May 2007. Production from this EOR project is primarily from the Yates formation, with additional production from other zones including the Queen formation. We are currently injecting CO2 into one of the largest phases of our eight-phase project at this field. As of December 31, 2015, we were injecting approximately 370 MMcf/d of CO2 into the field, over half of which is recycled.
33
Other
Our other operations primarily relate to non-core assets in Colorado, Mississippi, North Dakota, Texas and Wyoming. As of December 31, 2015, these properties contributed 5.0 MMBOE (88% oil) of proved reserves to our portfolio of operations, which represented 1% of our total estimated proved reserves and contributed 3.1 MBOE/d of average daily production in the fourth quarter of 2015.
Reserves
As of December 31, 2015, all of our oil and gas reserves are attributable to properties within the United States. A summary of our proved oil and gas reserves as of December 31, 2015 based on average fiscal-year prices (calculated as the unweighted arithmetic average of the first-day-of-the-month price for each month within the 12-month period ended December 31, 2015) is as follows:
|
Oil |
NGLs |
Natural Gas |
Total |
|||||
|
(MBbl) |
(MBbl) |
(MMcf) |
(MBOE) |
|||||
|
Proved reserves |
||||||||
|
Developed |
298,444 | 55,437 | 300,631 | 403,986 | ||||
|
Undeveloped |
298,233 | 57,510 | 365,029 | 416,581 | ||||
|
Total proved |
596,677 | 112,947 | 665,660 | 820,567 |
Proved reserves. Estimates of proved developed and undeveloped reserves are inherently imprecise and are continually subject to revision based on production history, results of additional exploration and development, price changes and other factors.
In 2015, total extensions and discoveries of 189.3 MMBOE were primarily attributable to successful drilling in the Williston Basin and DJ Basin. Both the new wells drilled in these areas as well as the PUD locations added as a result of drilling increased our proved reserves.
In 2015, total sales of minerals in place of 53.2 MMBOE were primarily attributable to the disposition of various non-core properties across all our operating areas as further described in “Acquisitions and Divestitures” within Item 1 of this Annual Report on Form 10-K, which decreased our proved reserves.
In 2015, revisions to previous estimates decreased proved developed and undeveloped reserves by a net amount of 36.3 MMBOE. Included in these revisions were (i) 82.3 MMBOE of downward adjustments caused by lower crude oil, NGL and natural gas prices incorporated into our reserve estimates at December 31, 2015 as compared to December 31, 2014 and (ii) 46.0 MMBOE of net upward adjustments attributable to reservoir analysis and well performance.
Proved undeveloped reserves. Our PUD reserves increased 13% or 48.5 MMBOE on a net basis from December 31, 2014 to December 31, 2015. The following table provides a reconciliation of our PUDs for the year ended December 31, 2015:
|
Total |
||
|
(MBOE) |
||
|
PUD balance—December 31, 2014 |
368,082 | |
|
Converted to proved developed through drilling |
(49,654) | |
|
Converted to proved developed at EOR project |
(4,156) | |
|
Added from extensions and discoveries |
141,120 | |
|
Removed for five-year rule |
(3,494) | |
|
Removed due to low commodity prices |
(15,178) | |
|
Purchased |
- |
|
|
Sold |
(20,456) | |
|
Revisions |
317 | |
|
PUD balance—December 31, 2015 |
416,581 |
During 2015, we incurred $1.1 billion in capital expenditures, or $22.29 per BOE, to drill and bring on-line 49.7 MMBOE of PUD reserves. Also during 2015, 4.2 MMBOE of PUD volumes became proved developed reserves at our EOR project in the North Ward Estes field, at a cost of $37.96 per BOE. Combining the PUD drilling conversions with the PUD EOR conversions, we converted PUDs to proved developed reserves at a cost of $23.50 per BOE during 2015.
34
In addition, we added 141.1 MMBOE of PUD volumes from extensions and discoveries during the year, and this increase in proved undeveloped reserves was primarily due to additional PUD locations added based on successful drilling in the Williston Basin and DJ Basin.
Based on our 2015 year end independent engineering reserve report, we will drill all of our individual PUD drilling locations within five years of the date such PUDs were added. However, we do have certain quantities of proved undeveloped reserves in the North Ward Estes field that will remain in the PUD category for periods extending beyond five years because of certain external factors that preclude the development of the North Ward Estes EOR PUDs all at once. Due to the large areal extent of the field, this EOR project will progress through the field in a sequential manner as earlier injection areas are completed and new injection areas are initiated. External factors that preclude the execution of the CO2 project throughout the field all at the same time include: (i) the volume of injection water necessary to re-pressure the reservoir in advance of the CO2 injection, (ii) the volume of purchased and recycled CO2 necessary to be injected to process the oil in the reservoir, and (iii) the equipment and manpower necessary to build the infrastructure and prepare the wells for the EOR project.
Preparation of reserves estimates. We maintain adequate and effective internal controls over the reserve estimation process as well as the underlying data upon which reserve estimates are based. The primary inputs to the reserve estimation process are comprised of technical information, financial data, ownership interests and production data. All field and reservoir technical information, which is updated annually, is assessed for validity when the reservoir engineers hold technical meetings with geoscientists, operations and land personnel to discuss field performance and to validate future development plans. Current revenue and expense information is obtained from our accounting records, which are subject to our internal controls over financial reporting. Internal controls over financial reporting are assessed for effectiveness annually using the criteria set forth in Internal Control – Integrated Framework (2013) issued by the Committee of Sponsoring Organizations of the Treadway Commission. All current financial data such as commodity prices, lease operating expenses, production taxes and field commodity price differentials are updated in the reserve database and then analyzed to ensure that they have been entered accurately and that all updates are complete. Our current ownership in mineral interests and well production data are also subject to the aforementioned internal controls over financial reporting, and they are incorporated into the reserve database as well and verified to ensure their accuracy and completeness. Once the reserve database has been entirely updated with current information, and all relevant technical support material has been assembled, our independent engineering firm Cawley, Gillespie & Associates, Inc. (“CG&A”) meets with our technical personnel in our Denver and Midland offices to review field performance and future development plans. Following these reviews, the reserve database and supporting data is furnished to CG&A so that they can prepare their independent reserve estimates and final report. Access to our reserve database is restricted to specific members of the reservoir engineering department.
CG&A is a Texas Registered Engineering Firm. Our primary contacts at CG&A are Mr. Robert D. Ravnaas, President, and Mr. W. Todd Brooker, Senior Vice President. Mr. Ravnaas and Mr. Brooker are State of Texas Licensed Professional Engineers. See Exhibit 99.2 of this Annual Report on Form 10-K for the Report of Cawley, Gillespie & Associates, Inc. and further information regarding the professional qualifications of Mr. Ravnaas and Mr. Brooker.
Our Vice President of Reservoir Engineering and Acquisitions is responsible for overseeing the preparation of the reserves estimates. He has over 31 years of experience, the majority of which has involved reservoir engineering and reserve estimation, and he holds a Bachelor’s degree in petroleum engineering from the Colorado School of Mines. He is also a member of the Society of Petroleum Engineers.
35
Acreage
The following table summarizes gross and net developed and undeveloped acreage by state at December 31, 2015. Net acreage represents our percentage ownership of gross acreage. Acreage in which our interest is limited to royalty and overriding royalty interests has been excluded.
|
Developed Acreage |
Undeveloped Acreage (2) |
Total Acreage |
||||||||||
|
Gross |
Net |
Gross |
Net |
Gross |
Net |
|||||||
|
Colorado |
72,692 | 53,181 | 156,407 | 108,167 | 229,099 | 161,348 | ||||||
|
Louisiana |
15,922 | 5,435 | 11,177 | 8,023 | 27,099 | 13,458 | ||||||
|
Michigan |
3,918 | 2,882 | 285,436 | 175,968 | 289,354 | 178,850 | ||||||
|
Montana |
52,719 | 39,989 | 43,694 | 19,240 | 96,413 | 59,229 | ||||||
|
New Mexico |
6,437 | 5,117 | 122,018 | 112,450 | 128,455 | 117,567 | ||||||
|
North Dakota |
652,439 | 374,693 | 29,998 | 20,860 | 682,437 | 395,553 | ||||||
|
Texas |
108,751 | 91,317 | 8,118 | 4,154 | 116,869 | 95,471 | ||||||
|
Utah |
10,118 | 4,362 | 331,745 | 217,962 | 341,863 | 222,324 | ||||||
|
Wyoming |
22,075 | 14,847 | 13,842 | 7,336 | 35,917 | 22,183 | ||||||
|
Other (1) |
3,480 | 2,086 | 1,110 | 793 | 4,590 | 2,879 | ||||||
|
Total |
948,551 | 593,909 | 1,003,545 | 674,953 | 1,952,096 | 1,268,862 | ||||||
_____________________
|
(1) |
Other includes Arkansas, Mississippi, Nebraska and Oklahoma. |
|
(2) |
Out of a total of 1,003,545 gross (674,953 net) undeveloped acres as of December 31, 2015, the portion of our net undeveloped acreage that is subject to expiration over the next three years, if not successfully developed or renewed, is approximately 29% in 2016, 18% in 2017 and 22% in 2018. |
Production History
The following table presents historical information about our produced oil and gas volumes:
|
Year Ended December 31, |
|||||||||
|
2015 |
2014 |
2013 |
|||||||
|
Oil production (MMBbl) |
47.2 | 33.5 | 27.0 | ||||||
|
NGL production (MMBbl) |
5.5 | 3.3 | 2.8 | ||||||
|
Natural gas production (Bcf) |
41.1 | 30.2 | 26.9 | ||||||
|
Total production (MMBOE) |
59.6 | 41.8 | 34.3 | ||||||
|
Daily production (MBOE/d) |
163.2 | 114.5 | 94.1 | ||||||
|
Sanish field production (1) |
|||||||||
|
Oil production (MMBbl) |
9.4 | 9.9 | 9.8 | ||||||
|
NGL production (MMBbl) |
1.2 | 1.1 | 1.1 | ||||||
|
Natural gas production (Bcf) |
7.3 | 5.9 | 4.8 | ||||||
|
Total production (MMBOE) |
11.8 | 12.0 | 11.7 | ||||||
|
North Ward Estes field production (1) |
|||||||||
|
Oil production (MMBbl) |
3.0 | 3.1 | 2.9 | ||||||
|
NGL production (MMBbl) |
0.4 | 0.4 | 0.4 | ||||||
|
Natural gas production (Bcf) |
0.2 | 0.3 | 0.3 | ||||||
|
Total production (MMBOE) |
3.4 | 3.6 | 3.4 | ||||||
|
Average sales prices (before the effects of hedging): |
|||||||||
|
Oil (per Bbl) |
$ |
40.95 |
$ |
81.50 |
$ |
90.39 | |||
|
NGLs (per Bbl) |
$ |
12.67 |
$ |
39.17 |
$ |
40.41 | |||
|
Natural gas (per Mcf) |
$ |
2.20 |
$ |
5.53 |
$ |
4.04 | |||
|
Average production costs: |
|||||||||
|
Production costs (per BOE) (2) |
$ |
9.02 |
$ |
11.24 |
$ |
11.94 | |||
_____________________
|
(1) |
The Sanish and North Ward Estes fields were our only fields that contained 15% or more of our total proved reserve volumes. |
36
|
(2) |
Production costs reported above exclude from lease operating expenses ad valorem taxes of $18 million ($0.30 per BOE), $27 million ($0.65 per BOE) and $20 million ($0.59 per BOE) for the years ended December 31, 2015, 2014 and 2013, respectively. |
Productive Wells
The following table summarizes gross and net productive oil and natural gas wells by core area at December 31, 2015. A net well represents our percentage ownership of a gross well. Wells in which our interest is limited to royalty and overriding royalty interests are excluded.
|
Oil Wells |
Natural Gas Wells |
Total Wells(1) |
||||||||||
|
Gross |
Net |
Gross |
Net |
Gross |
Net |
|||||||
|
Rocky Mountains |
2,982 | 1,403 |
- |
- |
2,982 | 1,403 | ||||||
|
Permian Basin |
1,215 | 1,202 | 17 | 13 | 1,232 | 1,215 | ||||||
|
Other (2) |
1,544 | 481 | 131 | 78 | 1,675 | 559 | ||||||
|
Total |
5,741 | 3,086 | 148 | 91 | 5,889 | 3,177 | ||||||
_____________________
|
(1) |
51 wells have multiple completions. These 51 wells contain a total of 148 completions. One or more completions in the same bore hole are counted as one well. |
|
(2) |
Other primarily includes non-core oil and gas properties located in Colorado, New Mexico, North Dakota, Texas and Wyoming. |
We have an interest in or operate ten EOR projects, which include either secondary (waterflood) or tertiary (CO2 injection) recovery efforts, and aggregate production from such EOR fields averaged 9.4 MBOE/d during 2015 or 6% of our 2015 daily production. For these areas, we need to use enhanced recovery techniques in order to maintain oil and gas production from these fields.
Oil and Gas Drilling Activity
We are engaged in numerous drilling activities on properties presently owned, and we intend to drill or develop other properties acquired in the future. The following table sets forth our oil and gas drilling activity for the last three years. Wells drilled to develop our CO2 reserves at our Bravo Dome field in New Mexico have not been included in the drilling activity table below. A dry well is an exploratory, development or extension well that proves to be incapable of producing either oil or gas in sufficient quantities to justify completion as an oil or gas well. A productive well is an exploratory, development or extension well that is not a dry well. The information below should not be considered indicative of future performance, nor should it be assumed that there is necessarily any correlation between the number of productive wells drilled and quantities of reserves found.
|
Gross Wells |
Net Wells |
|||||||||||||
|
Productive |
Dry |
Total |
Productive |
Dry |
Total |
|||||||||
|
2015: |
||||||||||||||
|
Development |
531 | 1 | 532 | 260.1 | 1.0 | 261.1 | ||||||||
|
Exploratory |
7 | 1 | 8 | 5.7 | 1.0 | 6.7 | ||||||||
|
Total |
538 | 2 | 540 | 265.8 | 2.0 | 267.8 | ||||||||
|
2014: |
||||||||||||||
|
Development |
571 | 1 | 572 | 231.5 | 0.4 | 231.9 | ||||||||
|
Exploratory |
34 | 5 |
(1) |
39 | 21.5 | 3.7 | 25.2 | |||||||
|
Total |
605 | 6 | 611 | 253.0 | 4.1 | 257.1 | ||||||||
|
2013: |
||||||||||||||
|
Development |
376 | 1 | 377 | 185.5 | 1.0 | 186.5 | ||||||||
|
Exploratory |
43 | 8 | 51 | 35.2 | 7.5 | 42.7 | ||||||||
|
Total |
419 | 9 | 428 | 220.7 | 8.5 | 229.2 | ||||||||
_____________________
|
(1) |
During 2014, we drilled six CO2 wells at our Bravo Dome field that were exploratory dry holes and that have not been included in the drilling results above. |
37
As of December 31, 2015, we had seven operated drilling rigs active on our properties. The breakdown of our operated rigs by geographic area is as follows:
|
Drilling Rigs |
||
|
Northern Rocky Mountains |
5 |
|
|
Central Rocky Mountains |
2 |
|
|
Total |
7 |
As of December 31, 2015, we had 161 gross (77.4 net) operated and non-operated wells in the process of drilling, completing or waiting on completion.
Hydraulic Fracturing
Hydraulic fracturing is a common practice in the oil and gas industry that is used to stimulate production of hydrocarbons from tight oil and gas formations. The process involves the injection of water, sand and chemicals under pressure into formations to fracture the surrounding rock and stimulate production. This process has typically been regulated by state oil and gas commissions. However, as described in more detail in “Business – Regulation – Environmental Regulations – Hydraulic Fracturing” in Item 1 of this Annual Report on Form 10-K, the EPA has initiated the regulation of hydraulic fracturing, other federal agencies are examining hydraulic fracturing, and federal legislation is pending with respect to hydraulic fracturing. We have utilized hydraulic fracturing in the completion of our wells in our most active areas located in the states of Colorado, Montana, North Dakota and Texas and we plan to continue to utilize this completion methodology.
Whiting’s proved undeveloped reserve quantities that are associated with hydraulic fracture treatments consist of substantially all of our proved undeveloped reserves, or 416.6 MMBOE.
On February 13, 2014, we had a well control incident during drilling operations involving one well in our Hidden Bench field in North Dakota. The well was quickly brought under control with no liquids leaving the location, and there were no resulting injuries. Appropriate regulatory agencies were notified of the incident. Other than this incident, we are not aware of any environmental incidents, citations or suits that have occurred during the last three years related to hydraulic fracturing operations involving oil and gas properties that we operate or in which we own a non-operated interest.
In order to minimize any potential environmental impact from hydraulic fracture treatments, we have taken the following steps:
|
· |
we follow fracturing and flowback procedures that comply with or exceed North Dakota Industrial Commission or other state requirements; |
|
· |
we train all company and contract personnel, who are responsible for well preparation, fracture stimulation and flowback, on our procedures; |
|
· |
we have implemented the incremental procedures of running a well casing caliper, visually inspecting the surface joint of intermediate casing and, if a lighter wall joint of casing or drilling wear is detected, reducing the minimum burst pressure accordingly; |
|
· |
for wells that are within one mile of major bodies of water or locations that lead to bodies of water, we construct sufficient berming around the well location prior to initiating fracturing operations; |
|
· |
we run fracturing strings in certain situations when extra precaution is warranted, such as where the anticipated maximum treating pressure for the well is greater than the pressure rating of the intermediate casing or in areas located within one mile of major bodies of water; |
|
· |
we conduct annual emergency incident response drills in all of our active areas; and |
|
· |
we are a member of the Sakakawea Area Spill Response LLC (“SASR”), which is composed of 13 oil and gas related companies operating in the Missouri River and Lake Sakakawea regions of North Dakota. Members agreed to share spill response resources and maintain SASR-owned water response equipment that can be accessed quickly in the early stages of a spill. |
While we do not have insurance policies in effect that are intended to provide coverage for losses solely related to hydraulic fracturing operations, we do have general liability and excess liability insurance policies that we believe would cover third-party claims related to hydraulic fracturing operations and associated legal expenses in accordance with, and subject to, the terms of such policies.
Delivery Commitments
Our production sales agreements contain customary terms and conditions for the oil and natural gas industry, generally provide for sales based on prevailing market prices in the area, and generally have terms of one year or less.
38
We have entered into three physical delivery contracts which require us to deliver fixed volumes of crude oil. One of these contracts is tied to oil production at our Sanish field in Mountrail County, North Dakota, and two are tied to oil production at our Redtail field in Weld County, Colorado. The following table summarizes our delivery commitments as of December 31, 2015:
|
Sanish |
Redtail 1 |
Redtail 2 |
As a Percentage of |
|||||
|
Crude Oil Volumes |
Crude Oil Volumes |
Crude Oil Volumes |
Total 2015 |
|||||
|
Period |
(Bbl) |
(Bbl) |
(Bbl) |
Oil Production |
||||
|
Jan - Dec 2016 |
1,380,000 |
6,865,000 |
7,320,000 |
33% |
||||
|
Jan - Dec 2017 |
5,475,000 |
12,325,000 |
7,300,000 |
53% |
||||
|
Jan - Dec 2018 |
5,475,000 |
14,150,000 |
7,300,000 |
57% |
||||
|
Jan - Dec 2019 |
5,475,000 |
15,975,000 |
7,300,000 |
61% |
||||
|
Jan - Dec 2020 |
5,490,000 |
4,140,000 |
1,820,000 |
24% |
||||
|
Jan - Dec 2021 |
5,475,000 |
- |
- |
12% |
||||
|
Jan - Dec 2022 |
5,475,000 |
- |
- |
12% |
||||
|
Jan - Dec 2023 |
4,095,000 |
- |
- |
9% |
Under the terms of the Sanish contract, if we fail to deliver the committed volumes we will be required to pay a deficiency payment of $7.00 per undelivered Bbl, subject to upward adjustment, over the duration of the contract. However, we believe that our production and reserves are sufficient to fulfill the delivery commitment at our Sanish field, and we therefore expect to avoid any payments for deficiencies under this contract.
Under the terms of the first Redtail contract, if we fail to deliver the committed volumes we are required to pay a deficiency payment of $4.75 per undelivered Bbl over the duration of the contract. Under the terms of the second Redtail contract, if we fail to deliver the committed volumes we are required to pay a deficiency payment equal to the terminal and pipeline transportation fees paid by the counterparty on such undelivered barrels, or approximately $4.00 per undelivered Bbl, subject to adjustment. We have determined that it is no longer probable that future oil production from our Redtail field will be sufficient to meet the minimum volume requirements specified in the related physical delivery contracts, and as a result, we expect to make periodic deficiency payments for any shortfalls in delivering the minimum committed volumes. We recognize any monthly deficiency payments in the period in which the underdelivery takes place and the related liability has been incurred. During 2015, total deficiency payments under these contracts amounted to $15 million.
Whiting is subject to litigation claims and governmental and regulatory proceedings arising in the ordinary course of business. While the outcome of these lawsuits and claims cannot be predicted with certainty, it is management’s opinion that the loss for any litigation matters and claims we are involved in that are reasonably possible to occur will not have a material adverse effect, individually or in the aggregate, on our consolidated financial position, cash flows or results of operations.
After the closing of the Kodiak Acquisition, the EPA contacted us to discuss Kodiak’s responses to a June 2014 information request from the EPA under Section 114(a) of the CAA. In addition, in July 2015, we received an information request from the EPA under Section 114(a) of the CAA. The information requests relate to tank batteries used in our Williston Basin operations and our compliance with certain regulatory requirements at those locations, including the control of air pollutant emissions from those facilities. We have responded to the EPA’s information requests and are in settlement discussions with the EPA and the North Dakota Department of Health (the “NDDoH”) regarding potential noncompliance with the federal CAA at our Williston Basin facilities, as implemented by the EPA and the NDDoH. To date, no formal federal or state enforcement action has been commenced in connection with this matter beyond receipt of the noted letters. We anticipate that resolution of this matter will result in civil penalties of an undetermined amount and may require us to undertake corrective actions which may increase our development and/or operating costs. Given the uncertainty in matters such as these, we are unable to predict the ultimate outcome of this matter at this time. However, we do not believe that any penalties or corrective action expenditures that may result from this matter will have a material adverse effect on our financial position, results of operations or cash flows.
Item 4. Mine Safety Disclosures
Not applicable.
39
Executive Officers of the Registrant
The following table sets forth certain information, as of February 16, 2016, regarding the executive officers of Whiting Petroleum Corporation:
|
Name |
Age |
Position |
|
James J. Volker |
69 |
Chairman, President and Chief Executive Officer |
|
Peter W. Hagist |
55 |
Senior Vice President, Planning |
|
Rick A. Ross |
57 |
Senior Vice President, Operations |
|
Michael J. Stevens |
50 |
Senior Vice President and Chief Financial Officer |
|
Mark R. Williams |
59 |
Senior Vice President, Exploration and Development |
|
Bruce R. DeBoer |
63 |
Vice President, General Counsel and Corporate Secretary |
|
Heather M. Duncan |
45 |
Vice President, Human Resources |
|
Brent P. Jensen |
46 |
Vice President, Finance and Treasurer |
|
Steven A. Kranker |
54 |
Vice President, Reservoir Engineering and Acquisitions |
|
David M. Seery |
61 |
Vice President, Land |
The following biographies describe the business experience of our executive officers:
James J. Volker joined us in August 1983 as Vice President of Corporate Development and served in that position through April 1993. In March 1993, he became a contract consultant to us and served in that capacity until August 2000, at which time he became Executive Vice President and Chief Operating Officer. Mr. Volker was appointed President and Chief Executive Officer and a director in January 2002 and Chairman of the Board in January 2004. Effective January 1, 2011, Mr. Volker stepped down as President, but continued as Chairman and Chief Executive Officer. Effective June 2014, he was again elected President and Chief Executive Officer. Mr. Volker was co-founder, Vice President and later President of Energy Management Corporation from 1971 through 1982. He has 44 years of experience in the oil and gas industry. Mr. Volker has a Bachelor’s degree in finance from the University of Denver, an MBA from the University of Colorado and has completed H. K. VanPoolen and Associates’ course of study in reservoir engineering.
Peter W. Hagist joined us in October 2005 as Vice President, Operations-Midland. In June 2014, he was elected Senior Vice President of Planning. Mr. Hagist has 34 years of experience in the oil and gas industry and 26 years of experience managing tertiary recovery operations. Prior to joining Whiting, he held management and professional positions with Kinder Morgan CO2 Company and Pennzoil Exploration and Production Company. Mr. Hagist holds a Bachelor of Science degree in petroleum engineering from the Colorado School of Mines. He is a registered Professional Engineer and a member of the Society of Petroleum Engineers.
Rick A. Ross joined us in March 1999 as an Operations Manager. In May 2007, he became Vice President of Operations and in June 2014, he was elected Senior Vice President of Operations. Mr. Ross has 33 years of oil and gas experience, including 17 years with Amoco Production Company where he served in various technical and managerial positions. Mr. Ross holds a Bachelor of Science degree in mechanical engineering from the South Dakota School of Mines and Technology. He is a registered Professional Engineer, a member of the Society of Petroleum Engineers and was a past Chairman of the North Dakota Petroleum Council.
Michael J. Stevens joined us in May 2001 as Controller, became Treasurer in January 2002 and became Vice President and Chief Financial Officer in March 2005. Mr. Stevens was elected Senior Vice President and Chief Financial Officer effective March 1, 2015. His 29 years of oil and gas experience includes eight years of service in various positions including Chief Financial Officer, Controller, Secretary and Treasurer at Inland Resources Inc., a company engaged in oil and gas exploration and development. He spent seven years in public accounting with Coopers & Lybrand in Minneapolis, Minnesota. He is a graduate of Mankato State University of Minnesota and is a Certified Public Accountant.
Mark R. Williams joined us in December 1983 as Exploration Geologist and has been Vice President of Exploration and Development since December 1999. Mr. Williams was elected Senior Vice President, Exploration and Development effective January 1, 2011. He has 35 years of domestic and international experience in the oil and gas industry. Mr. Williams holds a Master’s degree in geology from the Colorado School of Mines and a Bachelor’s degree in geology from the University of Utah.
Bruce R. DeBoer joined us as Vice President, General Counsel and Corporate Secretary in January 2005. From January 1997 to May 2004, Mr. DeBoer served as Vice President, General Counsel and Corporate Secretary of Tom Brown, Inc., an independent oil and gas exploration and production company. Mr. DeBoer has 36 years of experience in managing the legal departments of several independent oil and gas companies. He holds a Bachelor of Science degree in political science from South Dakota State University and received his J.D. and MBA degrees from the University of South Dakota.
Heather M. Duncan joined us in February 2002 as Assistant Director of Human Resources and in January 2003 became Director of Human Resources. In January 2008, she was appointed Vice President of Human Resources. Ms. Duncan has 19 years of human
40
resources experience in the oil and gas industry. She holds a Bachelor of Arts degree in anthropology and an MBA from the University of Colorado. She is a certified Senior Professional in Human Resources.
Brent P. Jensen joined us in August 2005 as Controller, and he became Controller and Treasurer in January 2006. Mr. Jensen was elected Vice President, Finance and Treasurer effective March 1, 2015. He was previously with PricewaterhouseCoopers L.L.P. in Houston, Texas, where he held various positions in their oil and gas audit practice since 1994, which included assignments of four years in Moscow, Russia and three years in Milan, Italy. He has 22 years of oil and gas accounting experience and is a Certified Public Accountant. Mr. Jensen holds a Bachelor of Arts degree from the University of California, Los Angeles.
Steven A. Kranker joined us in March 2013 as First Director – Acquisitions and Reservoir Engineering and became Vice President of Reservoir Engineering and Acquisitions in July 2013. Prior to joining Whiting, Mr. Kranker held positions at several companies engaged in oil and gas exploration and development, including Manager of Reserves at Bill Barrett Corporation from June 2012 to March 2013, President of Earth Energy Reserves, Inc. from July 2010 to June 2012, and various positions at Forest Oil Corporation, including Corporate Engineering Manager, from May 2001 to July 2010. Mr. Kranker has 31 years of acquisition and reservoir engineering experience, including Brunei Shell Petroleum, Arco Alaska Inc., Maxus Exploration, Conoco Inc. and Shell Western E&P Inc. He received his Bachelor of Science degree in petroleum engineering from the Colorado School of Mines. Mr. Kranker is a member of the Society of Petroleum Engineers.
David M. Seery joined us as our Manager of Land in July 2004 as a result of our acquisition of Equity Oil Company, where he was Manager of Land and Manager of Equity’s Exploration Department, positions he had held for more than five years. He became our Vice President of Land in January 2005. Mr. Seery has 35 years of land experience including staff and managerial positions with Marathon Oil Company. Mr. Seery holds a Bachelor of Science degree in business administration from the University of Montana. He is a registered Land Professional and has held various duties with the Denver Association of Petroleum Landmen.
Executive officers are elected by, and serve at the discretion of, the Board of Directors. There are no family relationships between any of our directors or executive officers.
41
Item 5. Market for the Registrant’s Common Equity, Related Stockholder Matters and Issuer Purchases of Equity Securities
Whiting Petroleum Corporation’s common stock is traded on the New York Stock Exchange under the symbol “WLL”. The following table shows the high and low sale prices for our common stock for the periods presented.
|
High |
Low |
|||||
|
Fiscal Year Ended December 31, 2015 |
||||||
|
Fourth quarter (ended December 31, 2015) |
$ |
22.80 |
$ |
8.12 | ||
|
Third quarter (ended September 30, 2015) |
$ |
33.79 |
$ |
13.50 | ||
|
Second quarter (ended June 30, 2015) |
$ |
39.15 |
$ |
30.95 | ||
|
First quarter (ended March 31, 2015) |
$ |
41.57 |
$ |
26.14 | ||
|
Fiscal Year Ended December 31, 2014 |
||||||
|
Fourth quarter (ended December 31, 2014) |
$ |
78.99 |
$ |
24.13 | ||
|
Third quarter (ended September 30, 2014) |
$ |
92.92 |
$ |
76.28 | ||
|
Second quarter (ended June 30, 2014) |
$ |
82.35 |
$ |
68.46 | ||
|
First quarter (ended March 31, 2014) |
$ |
72.32 |
$ |
54.93 | ||
On February 16, 2016, there were 826 holders of record of our common stock.
We have not paid any cash dividends on our common stock since we were incorporated in July 2003, and we do not anticipate paying any such dividends on our common stock in the foreseeable future. We currently intend to retain future earnings, if any, to finance the expansion of our business. Our future dividend policy is within the discretion of our board of directors and will depend upon various factors, including our financial position, cash flows, results of operations, capital requirements and investment opportunities. Except for limited exceptions, our credit agreement restricts our ability to make any cash dividends or distributions on our common stock. Additionally, the indentures governing our senior notes and our senior subordinated notes contain restrictive covenants that may limit our ability to pay cash dividends on our common stock.
Information relating to compensation plans under which our equity securities are authorized for issuance is set forth in Part III, Item 12 of this Annual Report on Form 10-K.
The following information in this Item 5 of this Annual Report on Form 10-K is not deemed to be “soliciting material” or to be “filed” with the SEC or subject to Regulation 14A or 14C under the Securities Exchange Act of 1934 or to the liabilities of Section 18 of the Securities Exchange Act of 1934, and will not be deemed to be incorporated by reference into any filing under the Securities Act of 1933 or the Securities Exchange Act of 1934, except to the extent we specifically incorporate it by reference into such a filing.
The following graph compares on a cumulative basis changes since December 31, 2010 in (a) the total stockholder return on our common stock with (b) the total return on the Standard & Poor’s Composite 500 Index and (c) the total return on the Dow Jones U.S. Exploration & Production Index. Such changes have been measured by dividing (a) the sum of (i) the cumulative amount of dividends for the measurement period, assuming dividend reinvestment, and (ii) the difference between the price per share at the end of and the beginning of the measurement period, by (b) the price per share at the beginning of the measurement period. The graph assumes $100 was invested on December 31, 2010 in our common stock, the Standard & Poor’s Composite 500 Index and the Dow Jones U.S. Exploration & Production Index, respectively.
42
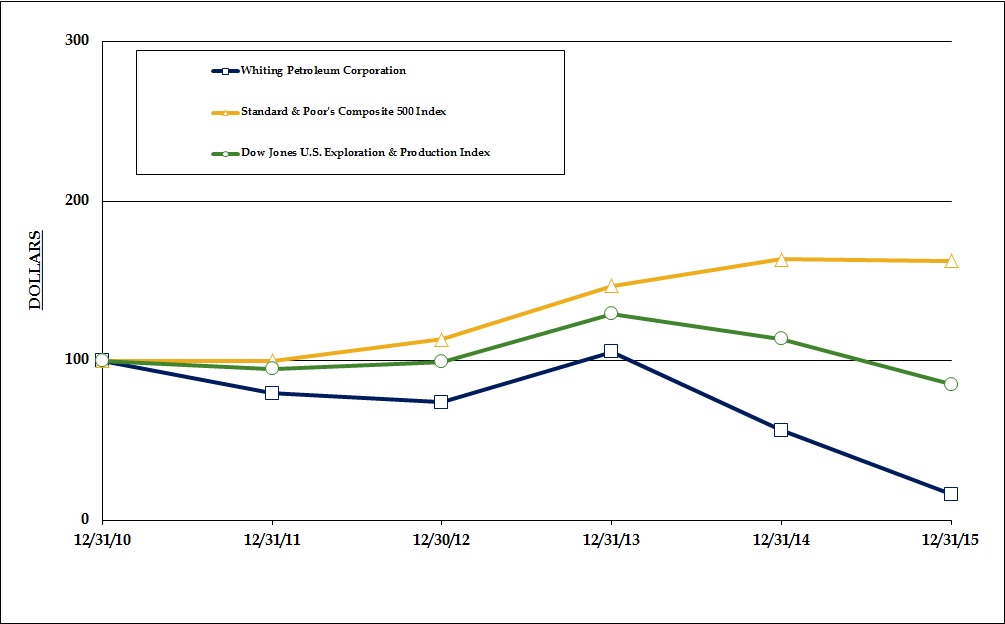
|
12/31/2010 |
12/31/2011 |
12/31/2012 |
12/31/2013 |
12/31/2014 |
12/31/2015 |
|||||||||||||
|
Whiting Petroleum Corporation |
$ |
100 |
$ |
80 |
$ |
74 |
$ |
106 |
$ |
56 |
$ |
16 | ||||||
|
Standard & Poor’s Composite 500 Index |
100 | 100 | 113 | 147 | 164 | 163 | ||||||||||||
|
Dow Jones U.S. Exploration & Production Index |
100 | 95 | 99 | 129 | 114 | 85 | ||||||||||||
43
Item 6. Selected Financial Data
The consolidated statements of operations and statements of cash flows information for the years ended December 31, 2015, 2014 and 2013 and the consolidated balance sheet information at December 31, 2015 and 2014 are derived from our audited financial statements included elsewhere in this report. The consolidated statements of operations and statements of cash flows information for the years ended December 31, 2012 and 2011 and the consolidated balance sheet information at December 31, 2013, 2012 and 2011 are derived from audited financial statements that are not included in this report. Our historical results include the results from our recent proved property acquisitions beginning on the following closing dates: properties related to the Kodiak Acquisition, December 8, 2014, and properties in North Dakota and Montana, September 20, 2013. In addition, our historical results also include the effects of our recent proved property divestitures beginning on the following closing dates: water facilities in Colorado, December 16, 2015; non-core properties in various fields across multiple states, December 15, 2015, November 12, 2015 and June 10, 2015; the underlying properties of Whiting USA Trust I, April 15, 2015; properties in the Postle field, July 15, 2013; and properties in Texas, October 31, 2013.
|
Year Ended December 31, |
|||||||||||||||
|
2015 |
2014 |
2013 |
2012 |
2011 |
|||||||||||
|
(in millions, except per share data) |
|||||||||||||||
|
Consolidated Statements of Operations Information: |
|||||||||||||||
|
Revenues and other income: |
|||||||||||||||
|
Oil, NGL and natural gas sales |
$ |
2,092.5 |
$ |
3,024.6 |
$ |
2,666.5 |
$ |
2,137.7 |
$ |
1,860.1 | |||||
|
Gain (loss) on hedging activities |
- |
- |
(1.9) | 2.3 | 8.8 | ||||||||||
|
Amortization of deferred gain on sale |
16.8 | 30.5 | 31.7 | 29.5 | 13.9 | ||||||||||
|
Gain (loss) on sale of properties |
(60.8) | 27.6 | 128.6 | 3.4 | 16.3 | ||||||||||
|
Interest income and other |
2.3 | 2.3 | 3.4 | 0.5 | 0.5 | ||||||||||
|
Total revenues and other income |
2,050.8 | 3,085.0 | 2,828.3 | 2,173.4 | 1,899.6 | ||||||||||
|
Costs and expenses: |
|||||||||||||||
|
Lease operating |
555.4 | 496.9 | 430.2 | 376.4 | 305.5 | ||||||||||
|
Production taxes |
183.0 | 253.0 | 225.4 | 171.6 | 139.2 | ||||||||||
|
Depreciation, depletion and amortization |
1,243.3 | 1,089.5 | 891.5 | 684.7 | 468.2 | ||||||||||
|
Exploration and impairment (1) |
1,881.7 | 854.4 | 453.2 | 167.0 | 84.6 | ||||||||||
|
Goodwill impairment |
873.8 |
- |
- |
- |
- |
||||||||||
|
General and administrative |
172.6 | 177.2 | 138.0 | 108.6 | 85.0 | ||||||||||
|
Interest expense |
334.1 | 170.6 | 112.9 | 75.2 | 62.5 | ||||||||||
|
Loss on early extinguishment of debt |
18.4 |
- |
4.4 |
- |
- |
||||||||||
|
Change in Production Participation Plan liability |
- |
- |
(7.0) | 13.8 | (0.9) | ||||||||||
|
Commodity derivative (gain) loss, net |
(218.0) | (100.5) | 7.8 | (85.9) | (24.8) | ||||||||||
|
Total costs and expenses |
5,044.3 | 2,941.1 | 2,256.4 | 1,511.4 | 1,119.3 | ||||||||||
|
Income (loss) before income taxes |
(2,993.5) | 143.9 | 571.9 | 662.0 | 780.3 | ||||||||||
|
Income tax expense (benefit) |
(774.2) | 79.2 | 205.9 | 247.9 | 288.7 | ||||||||||
|
Net income (loss) |
(2,219.3) | 64.7 | 366.0 | 414.1 | 491.6 | ||||||||||
|
Net loss attributable to noncontrolling interest |
0.1 | 0.1 | 0.1 | 0.1 | 0.1 | ||||||||||
|
Net income (loss) available to shareholders |
(2,219.2) | 64.8 | 366.1 | 414.2 | 491.7 | ||||||||||
|
Preferred stock dividends |
- |
- |
(0.5) | (1.1) | (1.1) | ||||||||||
|
Net income (loss) available to common shareholders |
$ |
(2,219.2) |
$ |
64.8 |
$ |
365.5 |
$ |
413.1 |
$ |
490.6 | |||||
|
Earnings (loss) per common share, basic |
$ |
(11.35) |
$ |
0.53 |
$ |
3.09 |
$ |
3.51 |
$ |
4.18 | |||||
|
Earnings (loss) per common share, diluted |
$ |
(11.35) |
$ |
0.53 |
$ |
3.06 |
$ |
3.48 |
$ |
4.14 | |||||
|
Other Financial Information: |
|||||||||||||||
|
Net cash provided by operating activities |
$ |
1,051.4 |
$ |
1,815.3 |
$ |
1,744.7 |
$ |
1,401.2 |
$ |
1,192.1 | |||||
|
Net cash used in investing activities |
$ |
(1,982.1) |
$ |
(2,860.5) |
$ |
(1,902.5) |
$ |
(1,780.3) |
$ |
(1,760.0) | |||||
|
Net cash provided by financing activities |
$ |
868.7 |
$ |
423.9 |
$ |
812.4 |
$ |
408.1 |
$ |
564.8 | |||||
|
Capital expenditures |
$ |
2,483.7 |
$ |
2,888.4 |
$ |
2,772.7 |
$ |
2,171.5 |
$ |
1,804.3 | |||||
|
Consolidated Balance Sheet Information: |
|||||||||||||||
|
Total assets (2) |
$ |
11,389.1 |
$ |
13,993.1 |
$ |
8,802.5 |
$ |
7,265.7 |
$ |
6,037.5 | |||||
|
Long-term debt (2) |
$ |
5,197.7 |
$ |
5,602.4 |
$ |
2,622.9 |
$ |
1,793.2 |
$ |
1,371.9 | |||||
|
Total equity (3) |
$ |
4,758.6 |
$ |
5,703.0 |
$ |
3,836.7 |
$ |
3,453.2 |
$ |
3,029.1 | |||||
_____________________
44
|
(1) |
Includes proved oil and gas property impairments of $1.5 billion, $587 million, $267 million and $47 million for the years ended December 31, 2015, 2014, 2013 and 2012, respectively, and CO2 property impairments of $62 million and $42 million for the years ended December 31, 2015 and 2014, respectively. |
|
(2) |
As of December 31, 2015, the Company adopted on a retrospective basis Accounting Standards Update No. 2015-03, Simplifying the Presentation of Debt Issuance Costs, and Accounting Standards Update 2015-15, Presentation and Subsequent Measurement of Debt Issuance Costs Associated with Line-of-Credit Arrangements. Accordingly, $26 million, $31 million, $7 million and $8 million of debt issuance costs related to our senior notes, convertible senior notes and senior subordinated notes as of December 31, 2014, 2013, 2012 and 2011, respectively, were reclassified from other long-term assets to long-term debt in our consolidated balance sheets. Refer to “Adopted and Recently Issued Accounting Pronouncements” in the “Summary of Significant Accounting Policies” footnote in the notes to the consolidated financial statements. |
|
(3) |
No cash dividends were declared or paid on our common stock during the periods presented. |
45
Item 7. Management’s Discussion and Analysis of Financial Condition and Results of Operations
Unless the context otherwise requires, the terms “Whiting”, “we”, “us”, “our” or “ours” when used in this Item refer to Whiting Petroleum Corporation, together with its consolidated subsidiaries, Whiting Oil and Gas Corporation (“Whiting Oil and Gas”), Whiting US Holding Company, Whiting Canadian Holding Company ULC (formerly Kodiak Oil & Gas Corp., “Kodiak”), Whiting Resources Corporation (formerly Kodiak Oil & Gas (USA) Inc.) and Whiting Programs, Inc. When the context requires, we refer to these entities separately. This document contains forward-looking statements, which give our current expectations or forecasts of future events. Please refer to “Forward-Looking Statements” at the end of this Item for an explanation of these types of statements.
Overview
We are an independent oil and gas company engaged in development, production, acquisition and exploration activities primarily in the Rocky Mountains and Permian Basin regions of the United States. Since 2006, we have increased our focus on organic drilling activity and on the development of previously acquired properties, specifically on projects that we believe provide the opportunity for repeatable successes and production growth, while selectively pursuing acquisitions that complement our existing core properties, such as the acquisition of Kodiak (the “Kodiak Acquisition”). As a result of the sustained decline in crude oil prices during 2015 and continuing into 2016, we have significantly reduced our level of capital spending to more closely align with our cash flows generated from operations, and have focused our drilling activity on projects that provide the highest rate of return. In addition, we continually evaluate our property portfolio and sell properties when we believe that the sales price realized will provide an above average rate of return for the property or when the property no longer matches the profile of properties we desire to own, such as the asset sales discussed below under “Acquisition and Divestiture Highlights”. We are currently exploring additional asset sales of non-core properties and anticipate further sales during 2016.
We have historically acquired operated and non-operated properties that exceed our rate of return criteria. For acquisitions of properties with additional development and exploration potential, our focus has been on acquiring operated properties so that we can better control the timing and implementation of capital spending. In some instances, we have been able to acquire non-operated property interests at attractive rates of return that established a presence in a new area of interest or that have complemented our existing operations. We intend to continue to acquire both operated and non-operated interests to the extent we believe they meet our return criteria.
Our revenue, profitability and future growth rate depend on many factors which are beyond our control, such as oil and gas prices as well as economic, political and regulatory developments and competition from other sources of energy, as well as other items discussed under the caption “Risk Factors” in Item 1A of this Annual Report on Form 10-K. Oil and gas prices historically have been volatile and may fluctuate widely in the future. The following table highlights the quarterly average NYMEX price trends for crude oil and natural gas prices since the first quarter of 2014:
|
2014 |
2015 |
|||||||||||||||||||||||
|
Q1 |
Q2 |
Q3 |
Q4 |
Q1 |
Q2 |
Q3 |
Q4 |
|||||||||||||||||
|
Crude oil |
$ |
98.62 |
$ |
102.98 |
$ |
97.21 |
$ |
73.12 |
$ |
48.57 |
$ |
57.96 |
$ |
46.44 |
$ |
42.17 | ||||||||
|
Natural gas |
$ |
4.93 |
$ |
4.68 |
$ |
4.07 |
$ |
4.04 |
$ |
2.99 |
$ |
2.61 |
$ |
2.74 |
$ |
2.17 | ||||||||
Oil prices have fallen significantly since reaching highs of over $105.00 per Bbl in June 2014, dropping below $27.00 per Bbl in February 2016. Natural gas prices have also declined from over $4.80 per Mcf in April 2014 to below $1.80 per Mcf in December 2015. In addition, forecasted prices for both oil and gas for 2016 have also declined. Lower oil, NGL and natural gas prices may not only decrease our revenues, but may also reduce the amount of oil and natural gas that we can produce economically and therefore potentially lower our oil and gas reserve quantities. Substantial and extended declines in oil, NGL and natural gas prices have resulted and may continue to result in impairments of our proved oil and gas properties or undeveloped acreage (such as the impairments discussed below under “Results of Operations”) and may materially and adversely affect our future business, financial condition, cash flows, results of operations, liquidity or ability to finance planned capital expenditures. Lower commodity prices may also reduce the amount of our borrowing base under our credit agreement (such as the reduction discussed below under “Financing Highlights”), which is determined at the discretion of the lenders and which is based on the collateral value of our proved reserves that have been mortgaged to the lenders. Upon a redetermination, if borrowings in excess of the revised borrowing capacity were outstanding, we could be forced to immediately repay a portion of the debt outstanding under our credit agreement. Alternatively, higher oil prices may result in significant mark-to-market losses being incurred on our commodity-based derivatives, which may in turn cause us to experience net losses.
For a discussion of material changes to our proved reserves from December 31, 2014 to December 31, 2015 and our ability to convert PUDs to proved developed reserves, see “Reserves” in Item 2 of this Annual Report on Form 10-K. Additionally, for a discussion relating to the minimum remaining terms of our leases, see “Acreage” in Item 2 of this Annual Report on Form 10-K, and for a discussion on our need to use enhanced recovery techniques, see “Productive Wells” in Item 2 of this Annual Report on Form 10-K.
46
2015 Highlights and Future Considerations
Operational Highlights.
Williston Basin
Our properties in the Williston Basin of North Dakota and Montana target the Bakken and Three Forks formations. Net production from the Williston Basin averaged 128.6 MBOE/d for the fourth quarter of 2015, which represents a 2% decrease from 130.9 MBOE/d in the third quarter of 2015. As of December 31, 2015, we had five rigs active in the Williston Basin. As a result of the sustained decline in crude oil prices, we plan to decrease the number of rigs operating in this area to two for most of 2016, while suspending our completion activity beginning in the second quarter. Across our acreage in the Williston Basin, we have implemented our new completion design which utilizes cemented liners, plug-and-perf technology, significantly higher sand volumes, new diversion technology and both hybrid and slickwater fracture stimulation methods and has resulted in improved initial production rates.
In order to process the produced gas stream from our wells in the Sanish field, we constructed the Robinson Lake gas plant. The plant has a current processing capacity of 130 MMcf/d and fractionation equipment that allows us to convert NGLs into propane and butane, which end products can then be sold locally for higher realized prices. As of December 31, 2015, the plant was processing over 118 MMcf/d.
We also hold a 50% ownership interest in a gas processing plant, gathering systems and related facilities located south of Belfield, North Dakota, which primarily processes production from our Pronghorn field. There is currently inlet compression in place to process 35 MMcf/d, and as of December 31, 2015, the plant was processing over 15 MMcf/d.
Denver Julesburg Basin
Our Redtail field in the Denver Julesburg Basin (“DJ Basin”) in Weld County, Colorado targets the Niobrara and Codell/Fort Hays formations. In the fourth quarter of 2015, net production from the Redtail field averaged 14.3 MBOE/d, representing a 13% decrease from 16.6 MBOE/d in the third quarter of 2015. We have established production in the Niobrara “A”, “B” and “C” zones and the Codell/Fort Hays formations, and we began testing our new slickwater fracture stimulation method in this field in 2015. Our development plan at Redtail currently includes drilling up to eight wells per spacing unit in the Niobrara “A”, “B” and “C” zones and up to four wells per spacing unit in the Codell/Fort Hays formations. Additionally, the Codell/Fort Hays formation is prospective throughout our acreage in the Redtail field, and we are currently evaluating that formation. As of December 31, 2015, we had two drilling rigs operating in the DJ Basin, and we plan to maintain a two-rig drilling program in this area during 2016, while suspending our completion activity beginning in the second quarter.
In April 2014, we brought online the Redtail gas plant to process the associated gas produced from our wells in this area. During the third quarter of 2015, the plant’s inlet capacity was expanded to 50 MMcf/d from 20 MMcf/d. As of December 31, 2015, the plant was processing over 25 MMcf/d.
Permian Basin
Our North Ward Estes field in the Ward and Winkler counties in Texas has responded positively to the water and CO2 floods that we initiated in May 2007. Production from this EOR project is primarily from the Yates formation, with additional production from other zones including the Queen formation. We are currently injecting CO2 into one of the largest phases of our eight-phase project at this field. As of December 31, 2015, we were injecting approximately 370 MMcf/d of CO2 into the field, over half of which is recycled. Net production from North Ward Estes averaged 9.2 MBOE/d for the fourth quarter of 2015, which represents a 2% decrease from 9.4 MBOE/d in the third quarter of 2015.
Other Non-Core Properties
Whiting USA Trust I. On January 28, 2015, the net profits interest that Whiting conveyed to Whiting USA Trust I (“Trust I”) terminated as a result of 9.11 MMBOE (which amount is equivalent to 8.20 MMBOE attributable to the 90% net profits interest) having been produced and sold from the underlying properties. Upon termination, the net profits interest in the underlying properties reverted back to Whiting, resulting in an increase in our production volumes of approximately 2.3 MBOE/d as of the termination of the net profits interest. However, these properties were sold effective May 1, 2015, as discussed below under “Acquisition and Divestiture Highlights”.
47
Financing Highlights.
In October 2015, we entered into an amendment to our existing credit agreement in connection with the November 1, 2015 regular borrowing base redetermination that (i) decreased our borrowing base under the facility from $4.5 billion to $4.0 billion, with no change to our aggregate commitments of $3.5 billion, (ii) extended the interim covenant period (as defined in the credit agreement) until April 1, 2018 and (iii) added a requirement that we maintain a ratio of the last four quarters’ EBITDAX to consolidated interest charges (as defined in the credit agreement) of not less than 2.25 to 1.0 during the interim covenant period.
In March 2015, we completed a public offering of our common stock, selling 35,000,000 shares of common stock at a price of $30.00 per share and providing net proceeds of approximately $1.0 billion after underwriter’s fees. In addition, we granted the underwriter a 30-day option to purchase up to an additional 5,250,000 shares of common stock. On April 1, 2015, the underwriter exercised its right to purchase an additional 2,000,000 shares of common stock, providing additional net proceeds of $61 million. Concurrent with the common stock offering in March, we issued at par $1,250 million of 1.25% Convertible Senior Notes due April 2020 (the “Convertible Senior Notes”). The notes will mature on April 1, 2020 unless earlier converted in accordance with their terms. In addition, we issued at par $750 million of 6.25% Senior Notes due April 2023. We used the net proceeds from these offerings to repay all of the debt then outstanding under our credit agreement, as well as for general corporate purposes.
On January 7, 2015, as required under the terms of the indentures governing the Kodiak Notes (the “Kodiak Indentures”) upon a change in control of Kodiak, we offered to repurchase at 101% of par all $800 million principal amount of the 8.125% Senior Notes due December 2019 (the “2019 Kodiak Notes”), $350 million principal amount of the 5.5% Senior Notes due 2021 (the “2021 Kodiak Notes”) and $400 million principal amount of the 5.5% Senior Notes due 2022 (the “2022 Kodiak Notes” and together with the 2019 Kodiak Notes and the 2021 Kodiak Notes, the “Kodiak Notes”). On March 6, 2015, we paid $760 million to repurchase $2 million aggregate principal amount of the 2019 Kodiak Notes, $346 million aggregate principal amount of the 2021 Kodiak Notes and $399 million aggregate principal amount of the 2022 Kodiak Notes, which payment consisted of the 101% redemption price and all accrued and unpaid interest on such notes. On May 1, 2015, we paid $5 million to repurchase the remaining $4 million aggregate principal amount of the 2021 Kodiak Notes and $1 million aggregate principal amount of the 2022 Kodiak Notes, which payment consisted of the 101% redemption price and all accrued and unpaid interest on such notes. We financed the repurchases with borrowings under our revolving credit facility, which borrowings were subsequently repaid with proceeds from the equity and debt offerings discussed above, and with cash on hand. On December 24, 2015, we paid $834 million to repurchase the remaining $798 million aggregate principal amount of the 2019 Kodiak Notes, which payment consisted of the 104.063% redemption price and all accrued and unpaid interest on such notes. We financed the December repurchase with borrowings under our credit agreement. As a result of the repurchases, we recognized an $18 million loss on early extinguishment of debt, which consisted of a $40 million cash charge related to the redemption premium on the Kodiak Notes, partially offset by a $22 million non-cash credit related to the acceleration of unamortized debt premiums on such notes.
2016 Exploration and Development Budget.
Our 2016 exploration and development (“E&D”) budget is $500 million, which we expect to fund substantially with net cash provided by operating activities, proceeds from property divestitures, cash on hand and, if necessary, borrowings under our credit facility. This represents a substantial decrease from the $2.3 billion incurred on E&D during 2015. This reduced capital budget is in response to the significantly lower crude oil prices experienced during 2015 and continuing into 2016 and our plan to more closely align our capital spending with cash flows generated from operations, including our plan to suspend completion operations beginning in the second quarter. We expect to allocate $440 million of our 2016 budget to exploration and development activity and $17 million to facilities. We plan to incur the majority of our budgeted E&D expenditures during the first half of 2016 as we complete projects that were initiated in 2015 and wind down our completion operations. We currently anticipate that our E&D expenditures will total approximately $80 million per quarter during the second half of 2016. To the extent net cash provided by operating activities is higher or lower than currently anticipated, we would adjust our E&D budget accordingly, enter into agreements with industry partners, divest certain oil and gas property interests or adjust borrowings outstanding under our credit facility as necessary. Our 2016 E&D budget currently is allocated among our major development areas as indicated in the table below. Of our existing potential projects, we believe these present the opportunity for the highest return and most efficient use of our capital expenditures.
48
|
2016 Exploration and |
|||
|
Development Budget |
|||
|
Development Area |
(in millions) |
||
|
Northern Rocky Mountains |
$ |
182 | |
|
Central Rocky Mountains |
163 | ||
|
Non-operated properties |
24 | ||
|
CO2 EOR project (1) |
60 | ||
|
Exploration (2) |
50 | ||
|
Facilities |
17 | ||
|
Undeveloped acreage |
4 | ||
|
Total |
$ |
500 | |
_____________________
|
(1) |
Comprised primarily of CO2 purchases at our North Ward Estes CO2 EOR project. |
|
(2) |
Comprised primarily of exploration salaries, seismic activities, lease delay rentals and rig termination fees. |
Acquisition and Divestiture Highlights.
In December 2015, we completed the sale of a fresh water delivery system, a produced water gathering system and four saltwater disposal wells located in Weld County, Colorado, effective December 16, 2015, for a purchase price of $75 million (before closing adjustments).
In June 2015, we completed the sale of our interests in certain non-core oil and gas wells, effective June 1, 2015, for a purchase price of $150 million (before closing adjustments) and resulting in a pre-tax loss on sale of $118 million. The properties included over 2,000 gross wells in 132 fields across 10 states. The properties had estimated proved reserves of 20.9 MMBOE as of December 31, 2014, representing 3% of our proved reserves as of that date, and generated 5.3 MBOE/d (or 3%) of our May 2015 average daily production.
In April 2015, we completed the sale of our interests in certain non-core oil and gas wells, effective May 1, 2015, for a purchase price of $108 million (before closing adjustments) and resulting in a pre-tax gain on sale of $29 million. The properties are located in 187 fields across 14 states, and predominately consisted of assets that were previously included in the underlying properties of Whiting USA Trust I. The properties had estimated proved reserves of 8.9 MMBOE as of December 31, 2014, representing 1% of our total proved reserves as of that date, and generated 2.7 MBOE/d (or 2%) of our March 2015 average daily net production.
Also during the year ended December 31, 2015, we completed several immaterial divestiture transactions for the sale of our interests in certain non-core oil and gas wells and undeveloped acreage, for a total purchase price of $176 million (before closing adjustments) and resulting in a pre-tax gain on sale of $28 million. These properties had estimated proved reserves of 23.4 MMBOE as of December 31, 2014, representing 3% of our total proved reserves as of that date. The properties generated a combined total of approximately 4.4 MBOE/d of average daily net production, based on production rates at each of the respective closing dates.
49
Results of Operations
The following table sets forth selected operating data for the periods indicated:
|
Year Ended |
|||||||||
|
December 31, |
|||||||||
|
2015 |
2014 |
2013 |
|||||||
|
Net production: |
|||||||||
|
Oil (MMBbl) |
47.2 | 33.5 | 27.0 | ||||||
|
NGLs (MMBbl) |
5.5 | 3.3 | 2.8 | ||||||
|
Natural gas (Bcf) |
41.1 | 30.2 | 26.9 | ||||||
|
Total production (MMBOE) |
59.6 | 41.8 | 34.3 | ||||||
|
Net sales (in millions): |
|||||||||
|
Oil (1) |
$ |
1,931.9 |
$ |
2,729.0 |
$ |
2,443.7 | |||
|
NGLs |
70.2 | 128.6 | 114.0 | ||||||
|
Natural gas |
90.4 | 167.0 | 108.8 | ||||||
|
Total oil, NGL and natural gas sales |
$ |
2,092.5 |
$ |
3,024.6 |
$ |
2,666.5 | |||
|
Average sales prices: |
|||||||||
|
Oil (per Bbl) (1) |
$ |
40.95 |
$ |
81.50 |
$ |
90.39 | |||
|
Effect of oil hedges on average price (per Bbl) |
4.59 | 1.29 | (1.13) | ||||||
|
Oil net of hedging (per Bbl) |
$ |
45.54 |
$ |
82.79 |
$ |
89.26 | |||
|
Weighted average NYMEX price (per Bbl) (2) |
$ |
49.06 |
$ |
91.55 |
$ |
98.02 | |||
|
NGLs (per Bbl) |
$ |
12.67 |
$ |
39.17 |
$ |
40.41 | |||
|
Natural gas (per Mcf) |
$ |
2.20 |
$ |
5.53 |
$ |
4.04 | |||
|
Weighted average NYMEX price (per Mcf) (2) |
$ |
2.62 |
$ |
4.40 |
$ |
3.66 | |||
|
Costs and expenses (per BOE): |
|||||||||
|
Lease operating expenses |
$ |
9.32 |
$ |
11.89 |
$ |
12.53 | |||
|
Production taxes |
$ |
3.07 |
$ |
6.05 |
$ |
6.56 | |||
|
Depreciation, depletion and amortization |
$ |
20.87 |
$ |
26.06 |
$ |
25.96 | |||
|
General and administrative |
$ |
2.90 |
$ |
4.24 |
$ |
4.02 | |||
_____________________
|
(1) |
Before consideration of hedging transactions. |
|
(2) |
Average NYMEX pricing weighted for monthly production volumes. |
50
Year Ended December 31, 2015 Compared to Year Ended December 31, 2014
Oil, NGL and Natural Gas Sales. Our oil, NGL and natural gas sales revenue decreased $932 million to $2.1 billion when comparing 2015 to 2014. Sales revenue is a function of oil, NGL and gas volumes sold and average commodity prices realized. Our oil sales volumes increased 41%, our NGL sales volumes increased 69% and our natural gas sales volumes increased 36% between periods. The oil volume increase between periods resulted primarily from producing properties acquired in the Kodiak Acquisition, as well as drilling success across our two core development areas. The Kodiak Acquisition, which closed on December 8, 2014, added 10,540 MBbl of oil production during 2015 across several of our Northern Rockies areas. In addition, oil production from our Williston Basin and DJ Basin properties increased 4,420 MBbl and 1,950 MBbl, respectively, from 2014 to 2015 as a result of new wells drilled and completed in those areas. These production increases were partially offset by normal field production decline, as well as decreases in production volumes resulting from the property divestitures discussed above under “Acquisition and Divestiture Highlights”, which negatively impacted oil production by 790 MBbl during 2015. Our NGLs are generally produced concurrently with our crude oil volumes, resulting in a high correlation between fluctuations in our oil quantities sold and our NGL quantities sold. As a result, our NGL sales volume increases generally related to NGL production added from properties acquired in the Kodiak Acquisition, as well as increases in production from our Williston and DJ Basin properties. Similar to the trends noted for crude oil and NGL production, the gas volume increase between periods was also primarily the result of producing properties acquired in the Kodiak Acquisition, as well as drilling success across our two core development areas. The Kodiak Acquisition added 8,165 MMcf of gas production during 2015. In addition, gas production increased 6,265 MMcf at our Williston Basin properties and 3,050 MMcf at our DJ Basin properties from 2014 to 2015 as a result of new wells drilled and completed in those areas. These gas volume increases were partially offset by decreases in production volumes resulting from the property divestitures discussed above under “Acquisition and Divestiture Highlights”, which negatively impacted gas production by 5,880 MMcf during 2015, as well as normal field production decline.
These crude oil, NGL and natural gas production-related increases in net revenue were offset by significant decreases in the average sales price realized for oil, NGLs and natural gas in 2015 compared to 2014. Our average price for oil before the effects of hedging decreased 50%, our average sales price for NGLs decreased 68% and our average sales price for natural gas decreased 60% between periods.
Gain (Loss) on Sale of Properties. During 2015, we sold our interests in certain non-core oil and gas wells and undeveloped acreage across many of our operating areas, as well as a water system in Colorado for aggregate proceeds of $515 million, which resulted in a pre-tax loss on sale of $61 million. During 2014, we sold undeveloped acreage as well as our interests in certain producing oil and gas wells in the Big Tex prospect for net proceeds of $76 million in cash, which resulted in a pre-tax gain on sale of $12 million. Also during 2014, we sold certain non-core properties in the Rocky Mountains region for aggregate sales proceeds of $33 million, resulting in a pre-tax gain on sale of $17 million. There were no other property divestitures resulting in a significant gain or loss on sale during 2015 or 2014.
Amortization of Deferred Gain on Sale. Amortization of deferred gain on sale during 2015 was $17 million, a $14 million decrease over the same period in 2014. This decrease was primarily the result of the deferred gain on sale related to Trust I becoming fully amortized in January 2015 in connection with the termination of the Trust I net profits interest.
Lease Operating Expenses. Our lease operating expenses (“LOE”) during 2015 were $555 million, a $58 million increase over 2014. Higher LOE in 2015 were primarily related to a $63 million increase in oil field goods and services associated with net wells we added during the last twelve months as a result of the Kodiak Acquisition and through drilling, partially offset by the impact of our property divestitures in 2015 and a decrease in well workover activity between periods. Workovers decreased from $57 million in 2014 to $52 million in 2015, primarily due to a reduction in well workover activity at our EOR project at North Ward Estes.
Our lease operating expenses on a BOE basis, however, decreased when comparing 2015 to 2014. LOE per BOE amounted to $9.32 during 2015, which represents a decrease of $2.57 per BOE (or 22%) from 2014. This decrease was mainly due to declining costs of goods and services in the industry combined with higher overall production volumes between periods, lower well workover costs and the impact of property divestitures discussed above. The properties sold during 2015 consisted mainly of mature oil and gas producing properties with LOE per BOE rates that were higher than our overall rate.
Production Taxes. Our production taxes during 2015 were $183 million, a $70 million decrease over the same period in 2014, which decrease was primarily due to lower oil, NGL and natural gas sales between periods. Our production taxes, however, are generally calculated as a percentage of net sales revenue before the effects of hedging, and this percentage on a company-wide basis was 8.7% and 8.4% for 2015 and 2014, respectively.
51
Depreciation, Depletion and Amortization. Our depreciation, depletion and amortization (“DD&A”) expense increased $154 million in 2015 as compared to 2014. The components of our DD&A expense were as follows (in thousands):
|
Year Ended |
||||||
|
December 31, |
||||||
|
2015 |
2014 |
|||||
|
Depletion |
$ |
1,213,355 |
$ |
1,070,503 | ||
|
Depreciation |
9,664 | 5,494 | ||||
|
Accretion of asset retirement obligations |
20,274 | 13,548 | ||||
|
Total |
$ |
1,243,293 |
$ |
1,089,545 | ||
DD&A increased between periods primarily due to $143 million in higher depletion expense. This increase was mainly attributable to $362 million of incremental expense in 2015 related to the increase in our overall production volumes during that period, which was partially offset by a $219 million decrease in expense related to our lower depletion rate between periods. On a BOE basis, our overall DD&A rate of $20.87 for 2015 was 20% lower than the rate of $26.06 for the same period in 2014. The primary factors contributing to this lower DD&A rate were additions to proved and proved developed reserves over the last twelve months, including reserves that were added as a result of the Kodiak Acquisition, as well as impairment write-downs on proved oil and gas properties recognized in the fourth quarter of 2014 and the third quarter of 2015. These positive factors that lowered our DD&A rate were partially offset by $2.5 billion in drilling and development expenditures during the past twelve months.
Exploration and Impairment Costs. Our exploration and impairment costs increased $1.0 billion in 2015 as compared to 2014. The components of our exploration and impairment costs were as follows (in thousands):
|
Year Ended |
||||||
|
December 31, |
||||||
|
2015 |
2014 |
|||||
|
Exploration |
$ |
143,363 |
$ |
86,803 | ||
|
Impairment |
1,738,308 | 767,627 | ||||
|
Total |
$ |
1,881,671 |
$ |
854,430 | ||
Exploration costs increased $57 million during 2015 as compared to 2014 primarily due to rig termination fees incurred in 2015 totaling $95 million, which were partially offset by lower exploratory dry hole costs and decreases in geological and geophysical (“G&G”) activity between periods. During 2015, we drilled one exploratory dry hole in Michigan totaling $9 million. Exploratory dry hole costs for 2014, on the other hand, totaled $26 million due to five exploratory dry holes we drilled on our oil and gas properties, including three in Michigan and two in the Rocky Mountains region, as well as six exploratory dry holes at our CO2 development project in New Mexico. G&G costs, such as seismic studies, amounted to $8 million during 2015 as compared to $23 million during 2014.
Impairment expense in 2015 was primarily related to (i) $1.5 billion in non-cash impairment charges for the partial write-down of our North Ward Estes field in Texas and other non-core proved oil and gas properties primarily in Texas, Wyoming, North Dakota and Colorado that are not currently being developed due to depressed oil and gas prices, (ii) $86 million of leasehold amortization associated with individually insignificant unproved properties, (iii) $62 million of impairment write-downs on our CO2 development properties whose net book values exceeded their undiscounted future net cash flows, and (iv) $49 million in impairment write-downs of undeveloped acreage costs for leases where we have no current or future plans to drill. Impairment expense in 2014 primarily related to (i) $587 million in non-cash impairment charges for the partial write-down of non-core proved oil and gas properties primarily in Colorado, Louisiana, North Dakota and Utah which were not being developed due to depressed oil and gas prices at December 31, 2014, (ii) $70 million of leasehold amortization associated with individually insignificant unproved properties, (iii) $66 million in impairment write-downs of undeveloped acreage costs for leases where we had no future plans to drill and (iv) $42 million of impairment write-downs on our CO2 development properties.
Goodwill Impairment. As a result of a sustained decrease in the price of our common stock during the third quarter of 2015 caused by a significant decline in crude oil and natural gas prices over that same period, we performed a goodwill impairment test as of September 30, 2015. The impairment test indicated that the fair value of our reporting unit was less than its carrying amount, and further that there was no remaining implied fair value attributable to goodwill. Based on these results, we recorded a non-cash impairment charge of $874 million in 2015 to reduce the carrying value of goodwill to zero.
52
General and Administrative Expenses. We report general and administrative (“G&A”) expenses net of third-party reimbursements and internal allocations. The components of our G&A expenses were as follows (in thousands):
|
Year Ended |
||||||
|
December 31, |
||||||
|
2015 |
2014 |
|||||
|
General and administrative expenses |
$ |
309,987 |
$ |
300,814 | ||
|
Reimbursements and allocations |
(137,371) | (123,603) | ||||
|
General and administrative expenses, net |
$ |
172,616 |
$ |
177,211 | ||
G&A expense before reimbursements and allocations increased $9 million during 2015 as compared to 2014 primarily due to higher employee compensation, as well as general increases in G&A expense between periods as a result of the Kodiak Acquisition. These increases were partially offset by lower transaction-related costs incurred on the Kodiak Acquisition. Employee compensation increased $49 million in 2015 as compared to 2014 primarily due to personnel added as a result of the Kodiak Acquisition, as well as general pay increases. Transaction costs incurred for the Kodiak Acquisition totaled $53 million during 2014. The increase in reimbursements and allocations for 2015 was the result of higher salary costs and a greater number of field workers on Whiting-operated properties, primarily related to the Kodiak Acquisition.
Our general and administrative expenses on a BOE basis, however, decreased when comparing 2015 to 2014. G&A expense per BOE amounted to $2.90 during 2015, which represents a decrease of $1.34 per BOE (or 32%) from 2014. This decrease was mainly due to higher overall production volumes between periods, as well as savings realized as a result of our cost reduction measures.
Interest Expense. The components of our interest expense were as follows (in thousands):
|
Year Ended |
||||||
|
December 31, |
||||||
|
2015 |
2014 |
|||||
|
Senior Notes, Convertible Senior Notes and Senior Subordinated Notes |
$ |
265,358 |
$ |
153,260 | ||
|
Credit agreement |
26,071 | 9,419 | ||||
|
Amortization of debt issue costs, discounts and premiums |
46,525 | 11,984 | ||||
|
Other |
453 | 63 | ||||
|
Capitalized interest |
(4,282) | (4,084) | ||||
|
Total |
$ |
334,125 |
$ |
170,642 | ||
The increase in interest expense of $163 million between periods was mainly attributable to higher interest costs incurred on our notes during 2015, an increase in amortization of debt issue costs, discounts and premiums, and an increase in the amount of interest incurred on our credit agreement during 2015 as compared to 2014. The increase in note interest of $112 million was due to interest costs incurred on the $1.6 billion of Kodiak Notes we assumed on December 8, 2014 as part of the Kodiak Acquisition, as well as our March 2015 issuance of $1,250 million of 1.25% Convertible Senior Notes due 2020. The increase in amortization of debt issue costs, discounts and premiums of $35 million was primarily due to the amortization of the discount on our Convertible Senior Notes. Our credit agreement interest was $17 million higher in 2015 due to a greater amount of average borrowings outstanding under this facility. During 2015, all of the $1.6 billion Kodiak Notes were repurchased using proceeds from our debt and equity issuances, as well as borrowings under our credit agreement. Refer to “2015 Highlights and Future Considerations – Financing Highlights” above for more information.
Our weighted average debt outstanding during 2015 was $5.7 billion versus $2.9 billion for 2014. Our weighted average effective cash interest rate was 5.2% during 2015 compared to 5.5% during 2014.
Loss on Early Extinguishment of Debt. During 2015, we repurchased all $1.6 billion aggregate principal amount of the Kodiak Notes. As a result of the repurchases, we recognized an $18 million loss on early extinguishment of debt, which consisted of a $40 million cash charge related to the redemption premium on the Kodiak Notes, partially offset by a $22 million non-cash credit related to the acceleration of unamortized debt premiums on such notes.
Commodity Derivative (Gain) Loss, Net. All of our commodity derivative contracts as well as our embedded derivatives are marked-to-market each quarter with fair value gains and losses recognized immediately in earnings, as commodity derivative (gain) loss, net. Cash flow, however, is only impacted to the extent that settlements under these contracts result in making or receiving a payment to or from the counterparty. Commodity derivative (gain) loss, net amounted to a gain of $218 million for 2015 mainly due to the significant downward shift in the futures curve of forecasted commodity prices (“forward price curve”) for crude oil from January 1, 2015 (or the 2015 date on which new contracts were entered into) to December 31, 2015. Commodity derivative (gain) loss, net for
53
2014, resulted in a gain of $101 million mainly due to the recognition of a $54 million asset related to two crude oil sales and delivery contracts that failed the “normal purchase normal sale” exclusion during the fourth quarter of 2014, as well as the less significant downward shift in the same forward price curve from January 1, 2014 (or the 2014 date on which prior year contracts were entered into) to December 31, 2014.
See Item 7A, “Quantitative and Qualitative Disclosures about Market Risk”, for a list of our outstanding derivatives as of January 1, 2016.
Income Tax Expense. Income tax benefit for 2015 totaled $774 million as compared to $79 million of income tax expense for 2014, a decrease of $853 million that was mainly related to $3.1 billion in lower pre-tax income between periods.
Our effective tax rates for 2015 and 2014 differ from the U.S. statutory income tax rate primarily due to the effects of state income taxes and permanent taxable differences. Our overall effective tax rate decreased from 55.0% in 2014 to 25.9% for 2015. This decrease is mainly the result of $874 million in goodwill impairment recognized during the current year, which is not tax deductible, the impact of pre-tax earnings shifting from net income in 2014 to a net loss in 2015, and merger costs that were incurred in 2014 related to the Kodiak Acquisition, which are not tax deductible.
Year Ended December 31, 2014 Compared to Year Ended December 31, 2013
Oil, NGL and Natural Gas Sales. Our oil, NGL and natural gas sales revenue increased $358 million to $3.0 billion when comparing 2014 to 2013. Sales revenue is a function of oil, NGL and gas volumes sold and average commodity prices realized. Our oil sales volumes increased 24%, our NGL sales volumes increased 16% and our natural gas sales volumes increased 12% between periods. The oil volume increase resulted primarily from drilling success across our two core development areas. Oil production from our Williston Basin and DJ Basin properties increased 5,700 MBbl and 1,450 MBbl, respectively, from 2013 to 2014 as a result of new wells drilled and completed in those areas. In addition, 850 MBbl of oil production was added across several of our Northern Rockies areas as a result of the Kodiak Acquisition, which closed on December 8, 2014. These production increases were partially offset by the sale of our Postle field, which had oil production of 1,270 MBbl in 2013 but which was fully divested in July 2013, as well as normal field production decline. Our NGLs are generally produced concurrently with our crude oil volumes, resulting in a high correlation between fluctuations in our oil quantities sold and our NGL quantities sold. As a result, our NGL sales volume increases generally related to increases in production from our Williston and DJ Basin properties. Similar to the trends noted for crude oil and NGL production, the gas volume increase between periods was also primarily the result of new wells drilled and completed during the twelve months ended December 31, 2014, which caused increases in associated gas production of 3,865 MMcf at our Williston Basin properties and 1,455 MMcf at our DJ Basin properties from 2013 to 2014. In addition, 615 MMcf of gas production was added as a result of the Kodiak Acquisition. These gas volume increases were partially offset by normal field production decline.
In addition to the above crude oil, NGL and natural gas production-related increases in net revenue was an increase in the average sales price realized for natural gas of 37% in 2014 compared to 2013. These increases were partially offset by decreases in the average sales prices realized for oil and NGLs. Our average price for oil before the effects of hedging decreased 10%, and our average sales price for NGLs decreased 3% between periods.
Gain on Sale of Properties. During 2014, we sold undeveloped acreage as well as our interests in certain producing oil and gas wells in the Big Tex prospect for net proceeds of $76 million in cash, which resulted in a pre-tax gain on sale of $12 million. Also during 2014, we sold certain non-core properties in the Rocky Mountains region for aggregate sales proceeds of $33 million, resulting in a pre-tax gain on sale of $17 million. In July 2013, we sold our interest in the Postle Properties for net proceeds of $810 million, which resulted in a pre-tax gain on sale of $110 million. Additionally during 2013, we sold our interest in certain producing oil and gas wells and undeveloped acreage in the Big Tex prospect for net proceeds of $152 million, which resulted in a pre-tax gain on sale of $13 million for the year ended December 31, 2013. There were no other property divestitures resulting in a significant gain or loss on sale during 2014 or 2013.
Lease Operating Expenses. Our LOE during 2014 were $497 million, a $67 million increase over 2013. Higher LOE in 2014 were primarily related to a $92 million increase in the cost of oil field goods and services associated with net wells we added during the twelve months ended December 31, 2014, partially offset by a decrease in well workover activity. Workovers decreased from $82 million in 2013 to $57 million in 2014, primarily due to a reduction in well workover activity at our EOR project at North Ward Estes.
Our lease operating expenses on a BOE basis, however, decreased when comparing 2014 to 2013. LOE per BOE amounted to $11.89 during 2014, which represented a decrease of $0.64 per BOE (or 5%) from 2013. This decrease was mainly due to higher overall production volumes between periods combined with the decline in well workover costs discussed above.
Production Taxes. Our production taxes during 2014 were $253 million, a $28 million increase over the same period in 2013, which increase was primarily due to higher oil, NGL and natural gas sales between periods. Our production taxes, however, are generally
54
calculated as a percentage of net sales revenue before the effects of hedging, and this percentage on a company-wide basis was 8.4% and 8.5% for 2014 and 2013, respectively.
Depreciation, Depletion and Amortization. Our DD&A expense increased $198 million in 2014 as compared to 2013. The components of our DD&A expense were as follows (in thousands):
|
Year Ended |
||||||
|
December 31, |
||||||
|
2014 |
2013 |
|||||
|
Depletion |
$ |
1,070,503 |
$ |
876,208 | ||
|
Depreciation |
5,494 | 4,700 | ||||
|
Accretion of asset retirement obligations |
13,548 | 10,608 | ||||
|
Total |
$ |
1,089,545 |
$ |
891,516 | ||
DD&A in 2014 increased over 2013 primarily due to $194 million in higher depletion expense between periods. Of this increase, $191 million related to an increase in our overall production volumes during 2014 and $3 million related to a higher depletion rate between periods. On a BOE basis, our overall DD&A rate of $26.06 for 2014 represented a slight increase over the 2013 rate of $25.96 due to $2.8 billion in drilling and development expenditures during the twelve months ended December 31, 2014, which were largely offset by additions to proved and proved developed reserves over this same time period.
Exploration and Impairment Costs. Our exploration and impairment costs increased $401 million in 2014 as compared to 2013. The components of our exploration and impairment costs were as follows (in thousands):
|
Year Ended |
||||||
|
December 31, |
||||||
|
2014 |
2013 |
|||||
|
Exploration |
$ |
86,803 |
$ |
94,755 | ||
|
Impairment |
767,627 | 358,455 | ||||
|
Total |
$ |
854,430 |
$ |
453,210 | ||
Exploration costs decreased $8 million during 2014 as compared to 2013 primarily due to decreases in G&G activity, lower delay lease rentals paid and lower exploratory dry hole costs, partially offset by rig termination fees of $3 million incurred during 2014. G&G costs, such as seismic studies, amounted to $23 million during 2014 as compared to $30 million during 2013. Delay lease rentals decreased $6 million between periods. Exploratory dry hole costs for 2014 totaled $26 million, primarily related to five exploratory dry holes drilled on our oil and gas properties in 2014, including three in Michigan and two in the Rocky Mountains region, as well as six exploratory dry holes at our CO2 development project in New Mexico. During 2013, on the other hand, we drilled eight exploratory dry holes in the Rocky Mountains and Permian Basin regions totaling $29 million.
Impairment expense in 2014 was primarily related to (i) $587 million in non-cash impairment charges for the partial write-down of non-core proved oil and gas properties primarily in Colorado, Louisiana, North Dakota and Utah which were not being developed due to depressed oil and gas prices at December 31, 2014, (ii) $70 million of leasehold amortization associated with individually insignificant unproved properties, (iii) $66 million in impairment write-downs of undeveloped acreage costs for leases where we had no future plans to drill and (iv) $42 million of impairment write-downs on our CO2 development properties whose net book values exceeded their undiscounted future net cash flows. Impairment expense in 2013 primarily related to (i) $267 million in non-cash impairment charges for the partial write-down of proved properties, primarily attributable to gas reserves in the Rocky Mountains region and in Michigan, (ii) $71 million of leasehold amortization associated with individually insignificant unproved properties, and (iii) $19 million of impairment write-downs of undeveloped acreage costs for leases where we had no future plans to drill.
General and Administrative Expenses. We report G&A expenses net of third-party reimbursements and internal allocations. The components of our G&A expenses were as follows (in thousands):
|
Year Ended |
||||||
|
December 31, |
||||||
|
2014 |
2013 |
|||||
|
General and administrative expenses |
$ |
300,814 |
$ |
251,593 | ||
|
Reimbursements and allocations |
(123,603) | (113,599) | ||||
|
General and administrative expenses, net |
$ |
177,211 |
$ |
137,994 | ||
55
G&A expense before reimbursements and allocations increased $49 million during 2014 as compared to 2013 primarily due to transaction-related costs totaling $53 million incurred in 2014 for the Kodiak Acquisition as well as higher employee compensation between periods. Employee compensation increased $31 million in 2014 as compared to 2013 due to personnel hired during 2014, as well as general pay increases.
These increases were offset by a decrease in accrued distributions under our Production Participation Plan (the “Plan”) between periods. G&A expense for 2014 and 2013 includes $24 million and $66 million, respectively, for accrued Plan compensation. On June 11, 2014, the Plan was terminated effective December 31, 2013. Accordingly, there will be no compensation expense incurred under the Plan going forward. Refer to the “Deferred Compensation” footnote in the notes to consolidated financial statements for more information. Beginning January 1, 2015, we implemented a new cash bonus structure for our employees to replace the terminated Plan.
Our general and administrative expenses on a BOE basis also increased when comparing 2014 to 2013. G&A expense per BOE amounted to $4.24 during 2014, which represents an increase of $0.22 per BOE (or 5%) from 2013. This increase was mainly due to the increase in G&A expense discussed above, partially offset by higher overall production volumes between periods.
Interest Expense. The components of our interest expense were as follows (in thousands):
|
Year Ended |
||||||
|
December 31, |
||||||
|
2014 |
2013 |
|||||
|
Senior Notes and Senior Subordinated Notes |
$ |
153,260 |
$ |
73,983 | ||
|
Credit agreement |
9,419 | 27,978 | ||||
|
Amortization of debt issue costs and premium |
11,984 | 12,405 | ||||
|
Other |
63 | 85 | ||||
|
Capitalized interest |
(4,084) | (1,515) | ||||
|
Total |
$ |
170,642 |
$ |
112,936 | ||
The increase in interest expense of $58 million between periods was mainly attributable to higher interest costs incurred on our notes during 2014. This increase in note interest of $79 million was due to our September 2013 issuance of $1.1 billion of 5% Senior Notes due 2019 and $1.2 billion of 5.75% Senior Notes due 2021, as well as interest costs incurred on the $1.6 billion of Kodiak Notes we assumed on December 8, 2014 as part of the Kodiak Acquisition. This increase was partially offset by a $19 million decrease in the amount of interest incurred on our credit agreement during 2014 as compared to 2013 due to lower average borrowings outstanding under this facility during 2014.
Our weighted average debt outstanding during 2014 was $2.9 billion versus $2.3 billion for 2013. Our weighted average effective cash interest rate was 5.5% during 2014 compared to 4.5% during 2013.
Commodity Derivative (Gain) Loss, Net. All of our commodity derivative contracts as well as our embedded derivatives are marked-to-market each quarter with fair value gains and losses recognized immediately in earnings, as commodity derivative (gain) loss, net. Cash flow, however, is only impacted to the extent that settlements under these contracts result in making or receiving a payment from the counterparty. Commodity derivative (gain) loss, net amounted to a gain of $101 million for 2014 mainly due to the recognition of a $54 million asset related to two crude oil sales and delivery contracts that failed the “normal purchase normal sale” exclusion during the fourth quarter of 2014, as well as the significant downward shift in the forward price curve for crude oil from January 1, 2014 (or the 2014 date on which new contracts were entered into) to December 31, 2014. Commodity derivative (gain) loss, net for 2013, however, resulted in a loss of $8 million due to an upward shift in the same forward price curve from January 1, 2013 (or the 2013 date on which prior year contracts were entered into) to December 31, 2013.
Income Tax Expense. Income tax expense totaled $79 million for 2014 as compared to $206 million of income tax for 2013, a decrease of $127 million that was mainly related to $428 million in lower pre-tax income between periods.
Our effective tax rates for 2014 and 2013 differ from the U.S. statutory income tax rate primarily due to the effects of state income taxes and permanent taxable differences. Our overall effective tax rate increased from 36.0% in 2013 to 55.0% for 2014. This increase is mainly the result of expanded activity in states with higher corporate tax rates; merger costs in 2014 related to the Kodiak Acquisition, which are not tax deductible; and reduced state tax credits.
Liquidity and Capital Resources
Overview. At December 31, 2015, we had $16 million of cash on hand and $4.8 billion of equity, while at December 31, 2014, we had $78 million of cash on hand and $5.7 billion of equity.
56
One of the primary sources of variability in our cash flows from operating activities is commodity price volatility, which we partially mitigate through the use of commodity hedge contracts. Oil accounted for 79% and 80% of our total production in 2015 and 2014, respectively. As a result, our operating cash flows are more sensitive to fluctuations in oil prices than they are to fluctuations in NGL or natural gas prices. As of January 1, 2016, we had derivative contracts covering the sale of approximately 54% of our forecasted 2016 oil production volumes. For a list of all of our outstanding derivatives as of January 1, 2016, see Item 7A, “Quantitative and Qualitative Disclosures about Market Risk”.
Cash Flows from 2015 Compared to 2014. During 2015, we generated $1.1 billion of cash provided by operating activities, a decrease of $764 million from 2014. Cash provided by operating activities decreased primarily due to lower realized sales prices for oil, NGLs and natural gas, as well as increased lease operating expenses, exploration costs and cash interest expense during 2015. These negative factors were partially offset by higher crude oil, NGL and natural gas production volumes and an increase in cash settlements received on our derivative contracts, as well as lower production taxes and general and administrative expenses in 2015 as compared to 2014. Refer to “Results of Operations” for more information on the impact of volumes and prices on revenues and for more information on increases and decreases in certain expenses during 2015.
During 2015, cash flows from operating activities plus $2.0 billion in proceeds from the issuance of our Convertible Senior Notes and 2023 Senior Notes, $1.1 billion in proceeds from the issuance of our common stock and $515 million in proceeds from the sale of non-core oil and gas properties were used to finance $2.5 billion of drilling and development expenditures, $1.6 billion for the redemption of the Kodiak Notes, $600 million of net repayments under our credit agreement, $54 million of debt and equity issuance costs and $28 million of oil and gas property acquisitions.
Cash Flows from 2014 Compared to 2013. During 2014, we generated $1.8 billion of cash provided by operating activities, an increase of $71 million from 2013. Cash provided by operating activities increased primarily due to higher crude oil, NGL and natural gas production volumes, higher realized sales prices for natural gas and an increase in cash settlements received on our derivative contracts, as well as lower exploration costs during 2014. These positive factors were partially offset by lower realized sales prices for oil and NGLs, as well as increased lease operating expenses, production taxes, general and administrative expenses and cash interest expense in 2014 as compared to 2013.
During 2014, cash flows from operating activities and cash on hand plus $475 million in net borrowings under our credit agreement and $108 million of proceeds from the sale of properties were used to finance $2.8 billion of drilling and development expenditures, $80 million for purchases of other property and equipment, $46 million of oil and gas property acquisitions (net of cash acquired), $26 million for the final payment under our Tax Sharing and Indemnification Agreement with Alliant Energy Corporation and $15 million of debt issuance costs.
Exploration and Development Expenditures. The following chart details our E&D expenditures incurred by region (in thousands):
|
Year Ended |
|||||||||
|
December 31, |
|||||||||
|
2015 |
2014 |
2013 |
|||||||
|
Rocky Mountains |
|
$ |
2,159,913 |
|
$ |
2,756,647 |
|
$ |
2,172,462 |
|
Permian Basin (1) |
94,940 | 379,702 | 346,812 | ||||||
|
Other (2) |
58,749 | 45,589 | 155,918 | ||||||
|
Total incurred |
$ |
2,313,602 |
$ |
3,181,938 |
$ |
2,675,192 | |||
_____________________
|
(1) |
For the years ended December 31, 2014 and 2013, amount includes $76 million and $21 million, respectively, related to the acquisition of undeveloped CO2 acreage and the development of CO2 reserves and related facilities at our Bravo Dome field in New Mexico. |
|
(2) |
Other primarily includes non-core oil and gas properties located in Colorado, Mississippi, North Dakota, Texas and Wyoming. |
We continually evaluate our capital needs and compare them to our capital resources. Our 2016 E&D budget is $500 million, which we expect to fund substantially with net cash provided by operating activities, proceeds from property divestitures, cash on hand and, if necessary, borrowings under our credit facility. The overall budget represents a substantial decrease from the $2.3 billion incurred on E&D expenditures during 2015. This reduced capital budget is in response to the significantly lower crude oil prices experienced during 2015 and continuing into 2016 and our plan to more closely align our capital spending with cash flows generated from operations, including our plan to suspend completion operations beginning in the second quarter. We expect to allocate $440 million of our 2016 budget to exploration and development activity and $17 million to facilities. We plan to incur the majority of our budgeted E&D expenditures during the first half of 2016 as we complete projects that were initiated in 2015 and wind down our completion operations. We currently anticipate that our E&D expenditures will total approximately $80 million per quarter during the second half of 2016. We believe that should additional attractive acquisition opportunities arise or E&D expenditures exceed $500
57
million, we will be able to finance additional capital expenditures with borrowings under our credit agreement, agreements with industry partners or divestitures of certain oil and gas property interests. Our level of E&D expenditures is largely discretionary, and the amount of funds devoted to any particular activity may increase or decrease significantly depending on commodity prices, cash flows, available opportunities and development results, among other factors. We believe that we have sufficient liquidity and capital resources to execute our business plan over the next 12 months and for the foreseeable future. With our expected cash flow streams, commodity price hedging strategies, current liquidity levels (including availability under our credit agreement), access to debt and equity markets and flexibility to modify future capital expenditure programs, we expect to be able to fund all planned capital programs and debt repayments, comply with our debt covenants, and meet other obligations that may arise from our oil and gas operations.
Credit Agreement. Whiting Oil and Gas, our wholly-owned subsidiary, has a credit agreement with a syndicate of banks that as of December 31, 2015 had a borrowing base of $4.0 billion, with aggregate commitments of $3.5 billion. We may increase the maximum aggregate amount of commitments under the credit agreement up to the $4.0 billion borrowing base if certain conditions are satisfied, including the consent of lenders participating in the increase. As of December 31, 2015, we had $2.7 billion of available borrowing capacity, which was net of $800 million in borrowings and $2 million in letters of credit outstanding.
The borrowing base under the credit agreement is determined at the discretion of the lenders, based on the collateral value of our proved reserves that have been mortgaged to such lenders, and is subject to regular redeterminations on May 1 and November 1 of each year, as well as special redeterminations described in the credit agreement, in each case which may reduce the amount of the borrowing base. At the time of the last redetermination, the applicable oil and gas prices were $38.60 per Bbl and $2.70 per Mcf, whereas the quoted NYMEX prices for oil and gas on February 16, 2016 were $29.04 per Bbl and $1.90 per Mcf. Because oil and gas prices are principal inputs into the valuation of our reserves, if oil and gas prices remain at their current levels for a prolonged period or further decline, our borrowing base could be reduced at the next redetermination date or during future redeterminations. Upon a redetermination of our borrowing base, either on a periodic or special redetermination date, if borrowings in excess of the revised borrowing capacity were outstanding, we could be forced to immediately repay a portion of our debt outstanding under the credit agreement.
A portion of the revolving credit facility in an aggregate amount not to exceed $100 million may be used to issue letters of credit for the account of Whiting Oil and Gas or other designated subsidiaries of ours. As of December 31, 2015, $98 million was available for additional letters of credit under the agreement.
The credit agreement provides for interest only payments until December 2019, when the credit agreement expires and all outstanding borrowings are due. Interest under the revolving credit facility accrues at our option at either (i) a base rate for a base rate loan plus the margin in the table below, where the base rate is defined as the greatest of the prime rate, the federal funds rate plus 0.5% per annum, or an adjusted LIBOR rate plus 1.0% per annum, or (ii) an adjusted LIBOR rate for a Eurodollar loan plus the margin in the table below. Additionally, we also incur commitment fees as set forth in the table below on the unused portion of the aggregate commitments of the lenders under the revolving credit facility.
|
Applicable |
Applicable |
|||||
|
Margin for Base |
Margin for |
Commitment |
||||
|
Ratio of Outstanding Borrowings to Borrowing Base |
Rate Loans |
Eurodollar Loans |
Fee |
|||
|
Less than 0.25 to 1.0 |
0.50% |
1.50% |
0.375% |
|||
|
Greater than or equal to 0.25 to 1.0 but less than 0.50 to 1.0 |
0.75% |
1.75% |
0.375% |
|||
|
Greater than or equal to 0.50 to 1.0 but less than 0.75 to 1.0 |
1.00% |
2.00% |
0.50% |
|||
|
Greater than or equal to 0.75 to 1.0 but less than 0.90 to 1.0 |
1.25% |
2.25% |
0.50% |
|||
|
Greater than or equal to 0.90 to 1.0 |
1.50% |
2.50% |
0.50% |
The credit agreement contains restrictive covenants that may limit our ability to, among other things, incur additional indebtedness, sell assets, make loans to others, make investments, enter into mergers, enter into hedging contracts, incur liens and engage in certain other transactions without the prior consent of our lenders. Except for limited exceptions, the credit agreement also restricts our ability to make any dividend payments or distributions on our common stock. These restrictions apply to all of the net assets of the subsidiaries. The credit agreement requires us, as of the last day of any quarter, to maintain the following ratios (as defined in the credit agreement): (i) a consolidated current assets to consolidated current liabilities ratio (which includes an add back of the available borrowing capacity under the credit agreement) of not less than 1.0 to 1.0, (ii) a total senior secured debt to the last four quarters’ EBITDAX ratio of less than 2.5 to 1.0 during the Interim Covenant Period (defined below), and thereafter a total debt to EBITDAX ratio of less than 4.0 to 1.0 and (iii) a ratio of the last four quarters’ EBITDAX to consolidated interest charges of not less than 2.25 to 1.0 during the Interim Covenant Period. Under the credit agreement, the “Interim Covenant Period” is defined as the period from June 30, 2015 until the earlier of (a) April 1, 2018 or (b) the commencement of an investment-grade debt rating period as described below. We were in compliance with our covenants under the credit agreement as of December 31, 2015. However, a substantial or extended decline in oil, NGL or natural gas prices may adversely affect our ability to comply with these covenants in the future.
58
Under the terms of the credit agreement, at any time during which we have an investment-grade debt rating from Moody’s Investors Service, Inc. or Standard & Poor’s Ratings Group and we have elected, at our discretion, to effect an investment-grade rating period, (i) certain security requirements, including the borrowing base requirement, and restrictive covenants will cease to apply, (ii) certain other restrictive covenants will become less restrictive, (iii) an asset coverage covenant will be imposed, and (iv) the interest rate margin applicable to all revolving borrowings as well as the commitment fee with respect to the revolving facility will be based upon our debt rating rather than the ratio of outstanding borrowings to the borrowing base.
For further information on the loan security related to our credit agreement, refer to the “Long-Term Debt” footnote in the notes to consolidated financial statements.
Senior Notes and Senior Subordinated Notes. In March 2015, we issued at par $750 million of 6.25% Senior Notes due April 2023 (the “2023 Senior Notes”). In September 2013, we issued at par $1.1 billion of 5% Senior Notes due March 2019 (the “2019 Senior Notes”) and $800 million of 5.75% Senior Notes due March 2021, and also in September 2013, we issued at 101% of par an additional $400 million of 5.75% Senior Notes due March 2021 (collectively the “2021 Senior Notes”). In September 2010, we issued at par $350 million of 6.5% Senior Subordinated Notes due October 2018 (the “2018 Senior Subordinated Notes” and together with the 2023 Senior Notes, the 2021 Senior Notes and the 2019 Senior Notes the “Nonconvertible Whiting Notes”).
Convertible Senior Notes. In March 2015, we issued at par $1,250 million of 1.25% Convertible Senior Notes due April 2020 (the “Convertible Senior Notes”).
We have the option to settle conversions of the Convertible Senior Notes with cash, shares of common stock or a combination of cash and common stock at our election. Our intent is to settle the principal amount of the Convertible Senior Notes in cash upon conversion. Prior to January 1, 2020, the Convertible Senior Notes will be convertible only under the following circumstances: (i) during any calendar quarter commencing after the calendar quarter ending on June 30, 2015 (and only during such calendar quarter), if the last reported sale price of our common stock for at least 20 trading days (whether or not consecutive) during the period of 30 consecutive trading days ending on the last trading day of the immediately preceding calendar quarter is greater than or equal to 130% of the conversion price on each applicable trading day; (ii) during the five business day period after any five consecutive trading day period (the “measurement period”) in which the trading price per $1,000 principal amount of the Convertible Senior Notes for each trading day of the measurement period is less than 98% of the product of the last reported sale price of our common stock and the conversion rate on each such trading day; or (iii) upon the occurrence of specified corporate events. On or after January 1, 2020, the Convertible Senior Notes will be convertible at any time until the second scheduled trading day immediately preceding the April 1, 2020 maturity date of the notes. The notes will be convertible at an initial conversion rate of 25.6410 shares of our common stock per $1,000 principal amount of the notes, which is equivalent to an initial conversion price of approximately $39.00. The conversion rate will be subject to adjustment in some events. In addition, following certain corporate events that occur prior to the maturity date, we will increase, in certain circumstances, the conversion rate for a holder who elects to convert its Convertible Senior Notes in connection with such corporate event. As of December 31, 2015, none of the contingent conditions allowing holders of the Convertible Senior Notes to convert these notes had been met.
Kodiak Senior Notes. In conjunction with the Kodiak Acquisition, Whiting US Holding Company, our wholly-owned subsidiary, became a co-issuer of the Kodiak Notes. Upon closing of the Kodiak Acquisition, the Kodiak Indentures were amended to (i) modify certain covenants and restrictions, (ii) provide for unconditional and irrevocable guarantees by Whiting Petroleum Corporation and Whiting Oil and Gas of the prompt payment, when due, of any amounts owed under the Kodiak Notes and the Kodiak Indentures, and (iii) allow Whiting US Holding Company to become a co-issuer of the Kodiak Notes. During 2015, we repurchased all of the outstanding Kodiak Notes and such notes were cancelled.
Also in conjunction with the Kodiak Acquisition, in December 2014, each of the indentures governing our 2019 Senior Notes, 2021 Senior Notes and 2018 Senior Subordinated Notes were amended to include Whiting US Holding Company, Kodiak and Whiting Resources Corporation as guarantors. The indentures governing our 2023 Senior Notes and Convertible Senior Notes issued in March 2015 also include Whiting Oil and Gas, Whiting US Holding Company, Kodiak and Whiting Resources Corporation as guarantors.
The indentures governing the Nonconvertible Whiting Notes restrict us from incurring additional indebtedness, subject to certain exceptions, unless our fixed charge coverage ratio (as defined in the indentures) is at least 2.0 to 1. If we were in violation of this covenant, then we may not be able to incur additional indebtedness, including under Whiting Oil and Gas’ credit agreement. Additionally, the indentures governing the Nonconvertible Whiting Notes contain restrictive covenants that may limit our ability to, among other things, pay cash dividends, make certain other restricted payments, redeem or repurchase our capital stock or our subordinated debt, make investments or issue preferred stock, sell assets, consolidate, merge or transfer all or substantially all of the assets of ours and our restricted subsidiaries taken as a whole, and enter into hedging contracts. These covenants may potentially limit the discretion of our management in certain respects. We were in compliance with these covenants as of December 31, 2015. However, a substantial or extended decline in oil, NGL or natural gas prices may adversely affect our ability to comply with these covenants in the future.
59
Shelf Registration Statement. We have on file with the SEC a universal shelf registration statement to allow us to offer an indeterminate amount of securities in the future. Under the registration statement, we may periodically offer from time to time debt securities, common stock, preferred stock, warrants and other securities or any combination of such securities in amounts, prices and on terms announced when and if the securities are offered. The specifics of any future offerings, along with the use of proceeds of any securities offered, will be described in detail in a prospectus supplement at the time of any such offering.
Contractual Obligations and Commitments
Schedule of Contractual Obligations. The table below does not include any penalties that may be incurred under our physical delivery contracts since we cannot predict with accuracy the amount and timing of any such penalties if incurred. For further information on our physical delivery contracts, refer to “Delivery Commitments” in Item 2 of this Annual Report on Form 10-K. The following table summarizes our obligations and commitments as of December 31, 2015 to make future payments under certain contracts, aggregated by category of contractual obligation, for the time periods specified below (in thousands):
|
Payments due by period |
|||||||||||||||
|
Less than 1 |
More than 5 |
||||||||||||||
|
Contractual Obligations |
Total |
year |
1-3 years |
3-5 years |
years |
||||||||||
|
Long-term debt (1) |
$ |
5,450,000 |
$ |
- |
$ |
350,000 |
$ |
3,150,000 |
$ |
1,950,000 | |||||
|
Cash interest expense on debt (2) |
1,065,169 | 224,623 | 443,559 | 277,144 | 119,843 | ||||||||||
|
Derivative contract liability fair value (3) |
4,027 | 1,165 | 1,883 | 979 |
- |
||||||||||
|
Asset retirement obligations (4) |
161,908 | 6,358 | 15,827 | 12,861 | 126,862 | ||||||||||
|
Water disposal agreements (5) |
145,615 | 8,174 | 34,360 | 40,635 | 62,446 | ||||||||||
|
Purchase obligations (6) |
106,708 | 52,815 | 38,581 | 15,312 |
- |
||||||||||
|
Pipeline transportation agreements (7) |
122,701 | 12,178 | 29,021 | 26,799 | 54,703 | ||||||||||
|
Drilling rig contracts (8) |
95,634 | 70,120 | 25,514 |
- |
- |
||||||||||
|
Leases (9) |
27,180 | 7,710 | 13,410 | 6,060 |
- |
||||||||||
|
Total |
$ |
7,178,942 |
$ |
383,143 |
$ |
952,155 |
$ |
3,529,790 |
$ |
2,313,854 | |||||
_____________________
|
(1) |
Long-term debt consists of the principal amounts of the Nonconvertible Whiting Notes and the Convertible Senior Notes and the outstanding borrowings under our credit agreement. |
|
(2) |
Cash interest expense on the Nonconvertible Whiting Notes is estimated assuming no principal repayment until the due dates of the instruments. Cash interest expense on the Convertible Senior Notes is estimated assuming no conversion prior to maturity. Cash interest expense on the credit agreement is estimated assuming no principal repayment until the December 2019 instrument due date and is estimated at a fixed interest rate of 1.9%. |
|
(3) |
The above derivative obligation at December 31, 2015 consists of a $4 million fair value liability for a crude oil sales and delivery contract for oil volumes produced from our Redtail field. |
|
(4) |
Asset retirement obligations represent the present value of estimated amounts expected to be incurred in the future to plug and abandon oil and gas wells, remediate oil and gas properties and dismantle their related plants and facilities. |
|
(5) |
We have one water disposal agreement which expires in 2024, whereby we have contracted for the transportation and disposal of the produced water from our Redtail field. Under the terms of the agreement, we are obligated to provide a minimum volume of produced water or else pay for any deficiencies at the price stipulated in the contract. The obligations reported above represent our minimum financial commitments pursuant to the terms of this contract, however, our actual expenditures under this contract may exceed the minimum commitments presented above. |
|
(6) |
We have three take-or-pay purchase agreements, of which one agreement expires in 2016, one expires in 2017 and one expires in 2020. One of these agreements contains commitments to buy certain volumes of CO2 for use in our North Ward Estes EOR project in Texas. Under the remaining two take-or-pay agreements, we have committed to buy certain volumes of water for use in the fracture stimulation process of wells in our Redtail field. Under the terms of these agreements, we are obligated to purchase a minimum volume of CO2 or water, as the case may be, or else pay for any deficiencies at the price stipulated in the contract. The purchasing obligations reported above represent our minimum financial commitments pursuant to the terms of these contracts, however, our actual expenditures under these contracts may exceed the minimum commitments presented above. |
60
|
(7) |
We have three ship-or-pay agreements with two different suppliers, one expiring in 2017 and two expiring in 2026, whereby we have committed to transport a minimum daily volume of crude oil, CO2 or water, as the case may be, via certain pipelines or else pay for any deficiencies at a price stipulated in the contracts. In addition, we have two pipeline transportation agreements with one supplier, expiring in 2024 and 2025, whereby we have committed to pay fixed monthly reservation fees on dedicated pipelines from our Redtail field for natural gas and NGL transportation capacity, plus a variable charge based on actual transportation volumes. |
|
(8) |
As of December 31, 2015, we had seven drilling rigs under long-term contract. Subsequent to December 31, 2015, we early terminated three of these contracts incurring early termination penalties of approximately $24 million. These penalties have been included as contractual commitment amounts in the table above. The remaining four long-term contracts expire in 2017. As of December 31, 2015, early termination of the four remaining contracts would require termination penalties of $55 million, which would be in lieu of paying the remaining drilling commitments under these contracts. |
|
(9) |
We lease 204,000 square feet of administrative office space in Denver, Colorado under an operating lease arrangement expiring in 2019, 47,900 square feet of office space in Midland, Texas expiring in 2020, an additional 36,300 square feet of administrative office space in Denver, Colorado assumed in the Kodiak Acquisition expiring in 2016, and 20,000 square feet of office space in Dickinson, North Dakota expiring in 2016. |
Based on current oil and natural gas prices and anticipated levels of production, we believe that the estimated net cash generated from operations, together with cash on hand and amounts available under our credit agreement, will be adequate to meet future liquidity needs, including satisfying our financial obligations and funding our operating, development and exploration activities.
New Accounting Pronouncements
For further information on the effects of recently adopted accounting pronouncements and the potential effects of new accounting pronouncements, refer to the “Summary of Significant Accounting Policies” footnote in the notes to consolidated financial statements.
Critical Accounting Policies and Estimates
Our discussion of financial condition and results of operations is based upon the information reported in our consolidated financial statements. The preparation of these statements requires us to make certain assumptions and estimates that affect the reported amounts of assets, liabilities, revenues and expenses as well as the disclosure of contingent assets and liabilities at the date of our financial statements. We base our assumptions and estimates on historical experience and other sources that we believe to be reasonable at the time. Actual results may vary from our estimates due to changes in circumstances, weather, politics, global economics, mechanical problems, general business conditions and other factors. A summary of our significant accounting policies is detailed in Note 1 to our consolidated financial statements. We have outlined below certain of these policies as being of particular importance to the portrayal of our financial position and results of operations and which require the application of significant judgment by our management.
Successful Efforts Accounting. We account for our oil and gas operations using the successful efforts method of accounting. Under this method, the fair value of property acquired and all costs associated with successful exploratory wells and all development wells are capitalized. Items charged to expense generally include geological and geophysical costs, costs of unsuccessful exploratory wells and oil and gas production costs. All of our properties are located within the continental United States.
Oil and Natural Gas Reserve Quantities. Reserve quantities and the related estimates of future net cash flows affect our periodic calculations of depletion, impairment of our oil and natural gas properties and our asset retirement obligations. Proved oil and gas reserves are those quantities of oil and gas which, by analysis of geoscience and engineering data, can be estimated with reasonable certainty to be economically producible—from a given date forward, from known reservoirs and under existing economic conditions, operating methods, and government regulations—prior to the time at which contracts providing the right to operate expire, unless evidence indicates that renewal is reasonably certain, regardless of whether deterministic or probabilistic methods are used for the estimation. Reserve quantities and future cash flows included in this report are prepared in accordance with guidelines established by the SEC and the FASB. The accuracy of our reserve estimates is a function of:
|
· |
the quality and quantity of available data; |
|
· |
the interpretation of that data; |
|
· |
the accuracy of various mandated economic assumptions; and |
|
· |
the judgments of the persons preparing the estimates. |
External petroleum engineers independently estimated all of the proved reserve quantities included in this Annual Report on Form 10-K. In connection with our external petroleum engineers performing their independent reserve estimations, we furnish them with the following information that they review: (1) technical support data, (2) technical analysis of geologic and engineering support
61
information, (3) economic and production data and (4) our well ownership interests. The independent petroleum engineers, Cawley, Gillespie & Associates, Inc., evaluated 100% of our estimated proved reserve quantities and their related pre-tax future net cash flows as of December 31, 2015. Estimates prepared by others may be higher or lower than our estimates. Because these estimates depend on many assumptions, all of which may differ substantially from actual results, reserve estimates may be different from the quantities of oil and gas that are ultimately recovered. We continually make revisions to reserve estimates throughout the year as additional information becomes available. We make changes to depletion rates and impairment calculations (when impairment indicators arise) in the same period that changes to reserve estimates are made.
Depreciation, Depletion and Amortization. Our rate of recording DD&A is dependent upon our estimates of total proved and proved developed reserves, which estimates incorporate various assumptions and future projections. If our estimates of total proved or proved developed reserves decline, the rate at which we record DD&A expense increases, which in turn reduces our net income. Such a decline in reserves may result from lower commodity prices or other changes to reserve estimates, as discussed above, and we are unable to predict changes in reserve quantity estimates as such quantities are dependent on the success of our exploration and development program, as well as future economic conditions.
Impairment of Oil and Gas Properties. We review the value of our oil and gas properties whenever management judges that events and circumstances indicate that the recorded carrying value of properties may not be recoverable. Impairments of producing properties are determined by comparing their future net undiscounted cash flows to their net book values at the end of each period. If their net capitalized costs exceed undiscounted future cash flows, the cost of the property is written down to “fair value”, which is determined using net discounted future cash flows from the producing property. Different pricing assumptions or discount rates could result in a different calculated impairment. In addition to proved property impairments, we provide for impairments on significant undeveloped properties when we determine that the property will not be developed or a permanent impairment in value has occurred. Individually insignificant unproved properties are amortized on a composite basis, based on past success, experience and average lease-term lives.
Goodwill Impairment. We test goodwill for impairment annually in the second quarter or whenever events or changes in circumstances indicate that the fair value of our reporting unit may have been reduced below its carrying value. When testing goodwill for impairment, if our qualitative analysis indicates that it is more likely than not that the fair value of the reporting unit is less than its carrying value, we then perform a quantitative impairment test. If the carrying value of the reporting unit exceeds its fair value, goodwill is written down to its implied fair value with an offsetting charge to earnings.
The fair value of our reporting unit is ascribed using an income approach analysis based on net discounted future cash flows and a market approach analysis. The income approach analysis is dependent on a number of factors including estimates of future oil and gas production from our reserve reports, future commodity prices based on sales contract terms or NYMEX forward price curves as of the date of the estimate (adjusted for basis differentials), operating and development costs, the successful development of proved and unproved reserves, an inflation rate and a discount rate based on our weighted-average cost of capital. The market approach is dependent on our market capitalization as of the date of the estimate, an estimate of the control premium that a market participant would apply to value our reporting unit as a whole and the fair value of our outstanding debt.
There is considerable judgment involved in estimating fair values, particularly in determining the valuation methodologies to utilize and the weighting applied to such methodologies. Although we base the fair value estimate of our reporting unit on assumptions we believe to be reasonable, those assumptions are inherently uncertain, and actual results could differ from our estimates. A sustained decrease in crude oil or natural gas prices, negative revisions to estimated reserve quantities, increases in future cost estimates, significant declines in the trading price of our common stock or a substantial decrease in the fair value of our debt could lead to a reduction in the estimated fair value of our reporting unit, which could result in a goodwill impairment.
We performed our annual goodwill impairment test as of June 30, 2015, and determined that no impairment had occurred. However, as a result of a sustained decrease in the price of Whiting’s common stock during the third quarter of 2015 caused by a significant decline in crude oil and natural gas prices over that same period, we performed another goodwill impairment test as of September 30, 2015. The impairment test indicated that the fair value of our reporting unit was less than its carrying amount, and further that there was no remaining implied fair value attributable to goodwill. Based on these results, we recorded a non-cash impairment charge to reduce the carrying value of goodwill to zero.
Asset Retirement Obligation. Our asset retirement obligations (“ARO”) consist of estimated future costs associated with the plugging and abandonment of oil and gas wells, removal of equipment and facilities from leased acreage and land restoration in accordance with applicable local, state and federal laws. The discounted fair value of an ARO liability is required to be recognized in the period in which it is incurred, with the associated asset retirement cost capitalized as part of the carrying cost of the oil and gas asset. The recognition of an ARO requires that management make numerous assumptions regarding such factors as the estimated probabilities, amounts and timing of settlements; the credit-adjusted risk-free discount rate; the inflation rate; and future advances in technology. In periods subsequent to the initial measurement of an ARO, we must recognize period-to-period changes in the liability resulting from the passage of time and revisions to either the timing or the amount of the original estimate of undiscounted cash flows. Increases in
62
the ARO liability due to the passage of time impact net income as accretion expense. The related capitalized cost, including revisions thereto, is charged to expense through DD&A over the life of the oil and gas property.
Production Participation Plan. On June 11, 2014, the Board of Directors terminated our Production Participation Plan (the “Plan”), in which all employees participated, effective December 31, 2013. Prior to Plan termination, interests in oil and gas properties acquired, developed or sold during the year were allocated to the Plan on an annual basis as determined by the Compensation Committee of the Board of Directors. Once allocated, the interests (not legally conveyed) were fixed. Pursuant to the terms of the Plan, upon Plan termination all employees became fully vested, and the fully vested amount due to Plan participants was reflected as a current payable in the “Production Participation Plan liability” line item in our consolidated balance sheet as of December 31, 2014, as it was distributed to Plan participants during 2015. This liability included the value of proved undeveloped oil and gas properties awarded upon Plan termination, and was based on reserve report estimates and forecasted commodity prices for crude oil, NGLs and natural gas as of the December 31, 2013 termination effective date.
Derivative Instruments and Hedging Activity. We periodically enter into commodity derivative contracts to manage our exposure to oil and natural gas price volatility. We use hedging to help ensure that we have adequate cash flow to fund our capital programs and manage returns on our acquisitions and drilling programs. Our decision on the quantity and price at which we choose to hedge our production is based in part on our view of current and future market conditions. While the use of these hedging arrangements limits the downside risk of adverse price movements, it may also limit future revenues from favorable price movements. We primarily utilize costless collars and swaps contracts, which are generally placed with major financial institutions, as well as crude oil sales and delivery contracts.
All derivative instruments are recorded on the consolidated balance sheet at fair value, other than the derivative instruments that meet the “normal purchase normal sale” exclusion. Changes in the derivatives’ fair value are recognized currently in earnings unless specific hedge accounting criteria are met. For qualifying cash flow hedges, the fair value gain or loss on the derivative is deferred in accumulated other comprehensive income (loss) to the extent the hedge is effective and is reclassified to the gain (loss) on hedging activities line item in our consolidated statements of operations in the period that the hedged production is delivered.
We value our costless collars and swaps using industry-standard models that consider various assumptions, including quoted forward prices for commodities, time value, volatility factors and contractual prices for the underlying instruments, as well as other relevant economic measures. We value our long-term crude oil sales and delivery contracts based on an income approach, which considers various assumptions, including quoted forward prices for commodities, market differentials for crude oil and U.S. Treasury rates. The discount rate used in the fair values of these instruments includes a measure of nonperformance risk by the counterparty or us, as appropriate.
We utilize the counterparties’ valuations to assess the reasonableness of our valuations. The values we report in our financial statements change as these estimates are revised to reflect changes in market conditions (particularly those for oil and natural gas futures) or other factors, many of which are beyond our control.
The use of hedging transactions also involves the risk that the counterparties will be unable to meet the financial terms of such transactions. We evaluate the ability of our counterparties to perform at the inception of a hedging relationship and on a periodic basis as appropriate.
Income Taxes and Uncertain Tax Positions. We provide for income taxes in accordance with FASB ASC Topic 740, Income Taxes (“ASC 740”). We record deferred tax assets and liabilities to account for the expected future tax consequences of events that have been recognized in our financial statements and our tax returns. We routinely assess the realizability of our deferred tax assets. If we conclude that it is more likely than not that some portion or all of our deferred tax assets will not be realized, the tax asset is reduced by a valuation allowance. We consider future taxable income in making such assessments. Numerous judgments and assumptions are inherent in the determination of future taxable income, including factors such as future operating conditions (particularly as they relate to prevailing oil and natural gas prices).
ASC 740 requires uncertain income tax positions to meet a more-likely-than-not recognition threshold to be recognized in the financial statements. Under ASC 740, uncertain tax positions that previously failed to meet the more-likely-than-not threshold should be recognized in the first subsequent financial reporting period in which that threshold is met. Previously recognized uncertain tax positions that no longer meet the more-likely-than-not threshold should be derecognized in the first subsequent financial reporting period in which that threshold is no longer met.
We are subject to taxation in many jurisdictions, and the calculation of our tax liabilities involves dealing with uncertainties in the application of complex tax laws and regulations in various taxing jurisdictions. If we ultimately determine that the payment of these liabilities will be unnecessary, we reverse the liability and recognize a tax benefit during the period in which we determine the liability no longer applies. Conversely, we record additional tax charges in a period in which we determine that a recorded tax liability is less than we expect the ultimate assessment to be.
63
Revenue Recognition. We predominantly derive our revenue from the sale of produced oil, NGLs and natural gas. Revenue is recorded in the month the product is delivered to the purchaser. We receive payment from one to three months after delivery. At the end of each month, we estimate the amount of production delivered to purchasers and the price we will receive. Variances between our estimated revenue and actual payment are recorded in the month the payment is received. However, differences have been and are insignificant.
Accounting for Business Combinations. We account for all of our business combinations using the acquisition method, which is the only method permitted under FASB ASC Topic 805, Business Combinations, and involves the use of significant judgment.
Under the acquisition method of accounting, a business combination is accounted for at a purchase price based upon the fair value of the consideration given. The assets and liabilities acquired are measured at their fair values, and the purchase price is allocated to the assets and liabilities based upon these fair values. The excess, if any, of the cost of an acquired entity over the net amounts assigned to assets acquired and liabilities assumed is recognized as goodwill. The excess, if any, of the fair value of assets acquired and liabilities assumed over the cost of an acquired entity is recognized immediately to earnings as a gain from bargain purchase.
Determining the fair values of the assets and liabilities acquired involves the use of judgment, since some of the assets and liabilities acquired do not have fair values that are readily determinable. Different techniques may be used to determine fair values, including market prices (where available), appraisals, comparisons to transactions for similar assets and liabilities, and present values of estimated future cash flows, among others. Since these estimates involve the use of significant judgment, they can change as new information becomes available.
With the exception of the Kodiak Acquisition, the business combinations completed during the past three years consisted of oil and gas properties. In general, the consideration we have paid to acquire these properties or companies was entirely allocated to the fair value of the assets acquired and liabilities assumed at the time of acquisition and consequently, there was no goodwill nor any bargain purchase gains recognized on our business combinations. However, the purchase price allocation associated with the Kodiak Acquisition resulted in the recognition of goodwill. For further information on the Kodiak Acquisition, refer to the “Acquisitions and Divestitures” footnote in the notes to consolidated financial statements.
Effects of Inflation and Pricing
We experienced increased costs during 2014 due to increased demand for oil field products and services, however, these costs declined in 2015 and have further declined in early 2016 following a decrease in demand for these same products and services. The oil and gas industry is very cyclical, and the demand for goods and services of oil field companies, suppliers and others associated with the industry puts extreme pressure on the economic stability and pricing structure within the industry. Typically, as prices for oil and natural gas increase, so do all associated costs. Conversely, in a period of declining prices, associated cost declines are likely to lag and not adjust downward in proportion to prices. Material changes in prices also impact our current revenue stream, estimates of future reserves, borrowing base calculations of bank loans, depletion expense, impairment assessments of oil and gas properties and goodwill, and values of properties in purchase and sale transactions. Material changes in prices can impact the value of oil and gas companies and their ability to raise capital, borrow money and retain personnel. While we do not currently expect business costs to materially increase, higher prices for oil and natural gas could result in increases in the costs of materials, services and personnel.
Forward-Looking Statements
This report contains statements that we believe to be “forward-looking statements” within the meaning of Section 27A of the Securities Act of 1933 and Section 21E of the Securities Exchange Act of 1934. All statements other than historical facts, including, without limitation, statements regarding our future financial position, business strategy, projected revenues, earnings, costs, capital expenditures and debt levels, and plans and objectives of management for future operations, are forward-looking statements. When used in this report, words such as we “expect”, “intend”, “plan”, “estimate”, “anticipate”, “believe” or “should” or the negative thereof or variations thereon or similar terminology are generally intended to identify forward-looking statements. Such forward-looking statements are subject to risks and uncertainties that could cause actual results to differ materially from those expressed in, or implied by, such statements.
These risks and uncertainties include, but are not limited to: declines in, or extended periods of low oil, NGL or natural gas prices; our level of success in exploration, development and production activities; risks related to our level of indebtedness, ability to comply with debt covenants and periodic redeterminations of the borrowing base under our credit agreement; impacts to financial statements as a result of impairment write-downs; our ability to successfully complete asset dispositions and the risks related thereto; revisions to reserve estimates as a result of changes in commodity prices, regulation and other factors; adverse weather conditions that may negatively impact development or production activities; the timing of our exploration and development expenditures; inaccuracies of our reserve estimates or our assumptions underlying them; risks relating to any unforeseen liabilities of ours; our ability to generate sufficient cash flows from operations to meet the internally funded portion of our capital expenditures budget; our ability to obtain external capital to finance exploration and development operations and acquisitions; federal and state initiatives relating to the
64
regulation of hydraulic fracturing and air emissions; the potential impact of federal debt reduction initiatives and tax reform legislation being considered by the U.S. Federal Government that could have a negative effect on the oil and gas industry; our ability to identify and complete acquisitions and to successfully integrate acquired businesses; unforeseen underperformance of or liabilities associated with acquired properties; the impacts of hedging on our results of operations; failure of our properties to yield oil or gas in commercially viable quantities; availability of, and risks associated with, transport of oil and gas; our ability to drill producing wells on undeveloped acreage prior to its lease expiration; our ability to obtain sufficient quantities of CO2 necessary to carry out our EOR projects; shortages of or delays in obtaining qualified personnel or equipment, including drilling rigs and completion services; uninsured or underinsured losses resulting from our oil and gas operations; our inability to access oil and gas markets due to market conditions or operational impediments; the impact and costs of compliance with laws and regulations governing our oil and gas operations; our ability to replace our oil and natural gas reserves; any loss of our senior management or technical personnel; competition in the oil and gas industry; cyber security attacks or failures of our telecommunication systems; and other risks described under the caption “Risk Factors” in Item 1A of this Annual Report on Form 10‑K. We assume no obligation, and disclaim any duty, to update the forward-looking statements in this Annual Report on Form 10-K.
65
Item 7A. Quantitative and Qualitative Disclosures about Market Risk
Commodity Price Risk
The price we receive for our oil and gas production heavily influences our revenue, profitability, access to capital and future rate of growth. Crude oil and natural gas are commodities, and therefore, their prices are subject to wide fluctuations in response to relatively minor changes in supply and demand. Historically, the markets for oil and gas have been volatile, and these markets will likely continue to be volatile in the future. Based on 2015 production, our income (loss) before income taxes for 2015 would have moved up or down $193 million for each 10% change in oil prices per Bbl, $7 million for each 10% change in NGL prices per Bbl and $9 million for each 10% change in natural gas prices per Mcf.
We periodically enter into derivative contracts to achieve a more predictable cash flow by reducing our exposure to oil and natural gas price volatility. Our derivative contracts have traditionally been costless collars and swap contracts, although we evaluate and have entered into other forms of derivative instruments as well. Currently, we do not apply hedge accounting, and therefore all changes in commodity derivative fair values are recorded immediately to earnings.
Commodity Derivative Contracts
Crude Oil Costless Collars. The collared hedges shown in the table below have the effect of providing a protective floor while allowing us to share in upward pricing movements. The three-way collars, however, do not provide complete protection against declines in crude oil prices due to the fact that when the market price falls below the sub-floor, the minimum price we would receive would be NYMEX plus the difference between the floor and the sub-floor. While these hedges are designed to reduce our exposure to price decreases, they also have the effect of limiting the benefit of price increases above the ceiling. For the crude oil collars outstanding as of December 31, 2015, a hypothetical upward or downward shift of 10% per Bbl in the NYMEX forward curve as of December 31, 2015 would cause a decrease or increase, respectively, of $42 million in our commodity derivative (gain) loss.
Our outstanding hedges as of January 1, 2016 are summarized below:
|
Derivative |
Monthly Volume |
Weighted Average |
||||||
|
Instrument |
Commodity |
Period |
(Bbl) |
NYMEX Sub-Floor/Floor/Ceiling |
||||
|
Three-way collars (1) |
Crude oil |
01/2016 to 03/2016 |
1,400,000 |
$43.75/$53.75/$74.40 |
||||
|
Crude oil |
04/2016 to 06/2016 |
1,400,000 |
$43.75/$53.75/$74.40 |
|||||
|
Crude oil |
07/2016 to 09/2016 |
1,400,000 |
$43.75/$53.75/$74.40 |
|||||
|
Crude oil |
10/2016 to 12/2016 |
1,400,000 |
$43.75/$53.75/$74.40 |
|||||
|
Collars |
Crude oil |
01/2016 to 03/2016 |
250,000 |
$51.00/$63.48 |
||||
|
Crude oil |
04/2016 to 06/2016 |
250,000 |
$51.00/$63.48 |
|||||
|
Crude oil |
07/2016 to 09/2016 |
250,000 |
$51.00/$63.48 |
|||||
|
Crude oil |
10/2016 to 12/2016 |
250,000 |
$51.00/$63.48 |
|||||
|
Crude oil |
01/2017 to 03/2017 |
250,000 |
$53.00/$70.44 |
|||||
|
Crude oil |
04/2017 to 06/2017 |
250,000 |
$53.00/$70.44 |
|||||
|
Crude oil |
07/2017 to 09/2017 |
250,000 |
$53.00/$70.44 |
|||||
|
Crude oil |
10/2017 to 12/2017 |
250,000 |
$53.00/$70.44 |
_____________________
|
(1) |
A three-way collar is a combination of options: a sold call, a purchased put and a sold put. The sold call establishes a maximum price (ceiling) we will receive for the volumes under contract. The purchased put establishes a minimum price (floor), unless the market price falls below the sold put (sub-floor), at which point the minimum price would be NYMEX plus the difference between the purchased put and the sold put strike price. |
Interest Rate Risk
Market risk is estimated as the change in fair value resulting from a hypothetical 100 basis point change in the interest rate on the outstanding balance under our credit agreement. Our credit agreement allows us to fix the interest rate for all or a portion of the principal balance for a period up to six months. To the extent that the interest rate is fixed, interest rate changes affect the instrument’s fair market value but do not impact results of operations or cash flows. Conversely, for the portion of the credit agreement that has a floating interest rate, interest rate changes will not affect the fair market value but will impact future results of operations and cash flows. At December 31, 2015, our outstanding principal balance under our credit agreement was $800 million, and the weighted average interest rate on the outstanding principal balance was 1.9%. At December 31, 2015, the carrying amount approximated fair market value. Assuming a constant debt level of $800 million, the cash flow impact resulting from a 100 basis point change in interest rates during periods when the interest rate is not fixed would be $7 million over a 12-month time period. Changes in interest rates do
66
not affect the amount of interest we pay on our fixed-rate senior notes, convertible senior notes or senior subordinated notes, but changes in interest rates do affect the fair values of these notes.
67
Item 8. Financial Statements and Supplementary Data
68
REPORT OF INDEPENDENT REGISTERED PUBLIC ACCOUNTING FIRM
To the Board of Directors and Stockholders of
Whiting Petroleum Corporation
Denver, Colorado
We have audited the accompanying consolidated balance sheets of Whiting Petroleum Corporation and subsidiaries (the "Company") as of December 31, 2015 and 2014, and the related consolidated statements of operations, comprehensive income (loss), cash flows, and equity for each of the three years in the period ended December 31, 2015. These financial statements are the responsibility of the Company's management. Our responsibility is to express an opinion on the financial statements based on our audits.
We conducted our audits in accordance with the standards of the Public Company Accounting Oversight Board (United States). Those standards require that we plan and perform the audit to obtain reasonable assurance about whether the financial statements are free of material misstatement. An audit includes examining, on a test basis, evidence supporting the amounts and disclosures in the financial statements. An audit also includes assessing the accounting principles used and significant estimates made by management, as well as evaluating the overall financial statement presentation. We believe that our audits provide a reasonable basis for our opinion.
In our opinion, such consolidated financial statements present fairly, in all material respects, the financial position of Whiting Petroleum Corporation and subsidiaries as of December 31, 2015 and 2014, and the results of their operations and their cash flows for each of the three years in the period ended December 31, 2015, in conformity with accounting principles generally accepted in the United States of America.
We have also audited, in accordance with the standards of the Public Company Accounting Oversight Board (United States), the Company's internal control over financial reporting as of December 31, 2015, based on the criteria established in Internal Control—Integrated Framework (2013) issued by the Committee of Sponsoring Organizations of the Treadway Commission and our report dated February 25, 2016 expressed an unqualified opinion on the Company's internal control over financial reporting.
/s/ DELOITTE & TOUCHE LLP
Denver, Colorado
February 25, 2016
69
WHITING PETROLEUM CORPORATION
(in thousands, except share and per share data)
|
December 31, |
||||||
|
2015 |
2014 |
|||||
|
ASSETS |
||||||
|
Current assets: |
||||||
|
Cash and cash equivalents |
$ |
16,053 |
$ |
78,100 | ||
|
Accounts receivable trade, net |
332,428 | 543,172 | ||||
|
Derivative assets |
158,729 | 135,577 | ||||
|
Prepaid expenses and other |
27,980 | 86,150 | ||||
|
Total current assets |
535,190 | 842,999 | ||||
|
Property and equipment: |
||||||
|
Oil and gas properties, successful efforts method |
13,904,525 | 14,949,702 | ||||
|
Other property and equipment |
168,277 | 276,582 | ||||
|
Total property and equipment |
14,072,802 | 15,226,284 | ||||
|
Less accumulated depreciation, depletion and amortization |
(3,323,102) | (3,083,572) | ||||
|
Total property and equipment, net |
10,749,700 | 12,142,712 | ||||
|
Goodwill |
- |
875,676 | ||||
|
Other long-term assets |
104,195 | 131,724 | ||||
|
TOTAL ASSETS |
$ |
11,389,085 |
$ |
13,993,111 | ||
|
LIABILITIES AND EQUITY |
||||||
|
Current liabilities: |
||||||
|
Accounts payable trade |
$ |
77,276 |
$ |
62,664 | ||
|
Accrued capital expenditures |
94,105 | 429,970 | ||||
|
Revenues and royalties payable |
179,601 | 254,018 | ||||
|
Production Participation Plan liability |
- |
113,391 | ||||
|
Accrued interest |
62,661 | 67,913 | ||||
|
Accrued lease operating expenses |
55,291 | 85,590 | ||||
|
Accrued liabilities and other |
50,261 | 80,401 | ||||
|
Taxes payable |
47,789 | 63,822 | ||||
|
Accrued employee compensation and benefits |
32,829 | 3,202 | ||||
|
Total current liabilities |
599,813 | 1,160,971 | ||||
|
Long-term debt |
5,197,704 | 5,602,389 | ||||
|
Deferred income taxes |
593,792 | 1,278,175 | ||||
|
Asset retirement obligations |
155,550 | 167,741 | ||||
|
Deferred gain on sale |
48,974 | 60,305 | ||||
|
Other long-term liabilities |
34,664 | 20,486 | ||||
|
Total liabilities |
6,630,497 | 8,290,067 | ||||
|
Commitments and contingencies |
||||||
|
Equity: |
||||||
|
Common stock, $0.001 par value, 300,000,000 shares authorized; 206,441,303 issued and 204,147,647 outstanding as of December 31, 2015 and 168,346,020 issued and 166,889,152 outstanding as of December 31, 2014 |
|
|
206 |
|
|
168 |
|
Additional paid-in capital |
4,659,868 | 3,385,094 | ||||
|
Retained earnings |
90,530 | 2,309,712 | ||||
|
Total Whiting shareholders' equity |
4,750,604 | 5,694,974 | ||||
|
Noncontrolling interest |
7,984 | 8,070 | ||||
|
Total equity |
4,758,588 | 5,703,044 | ||||
|
TOTAL LIABILITIES AND EQUITY |
$ |
11,389,085 |
$ |
13,993,111 | ||
See notes to consolidated financial statements.
70
WHITING PETROLEUM CORPORATION
CONSOLIDATED STATEMENTS OF OPERATIONS
(in thousands, except per share data)
|
Year Ended |
|||||||||
|
December 31, |
|||||||||
|
2015 |
2014 |
2013 |
|||||||
|
REVENUES AND OTHER INCOME: |
|||||||||
|
Oil, NGL and natural gas sales |
$ |
2,092,482 |
$ |
3,024,617 |
$ |
2,666,549 | |||
|
Loss on hedging activities |
- |
- |
(1,958) | ||||||
|
Gain (loss) on sale of properties |
(60,791) | 27,657 | 128,648 | ||||||
|
Amortization of deferred gain on sale |
16,751 | 30,494 | 31,737 | ||||||
|
Interest income and other |
2,356 | 2,329 | 3,409 | ||||||
|
Total revenues and other income |
2,050,798 | 3,085,097 | 2,828,385 | ||||||
|
COSTS AND EXPENSES: |
|||||||||
|
Lease operating expenses |
555,392 | 496,925 | 430,221 | ||||||
|
Production taxes |
183,035 | 253,008 | 225,403 | ||||||
|
Depreciation, depletion and amortization |
1,243,293 | 1,089,545 | 891,516 | ||||||
|
Exploration and impairment |
1,881,671 | 854,430 | 453,210 | ||||||
|
Goodwill impairment |
873,772 |
- |
- |
||||||
|
General and administrative |
172,616 | 177,211 | 137,994 | ||||||
|
Interest expense |
334,125 | 170,642 | 112,936 | ||||||
|
Loss on early extinguishment of debt |
18,361 |
- |
4,412 | ||||||
|
Change in Production Participation Plan liability |
- |
- |
(6,980) | ||||||
|
Commodity derivative (gain) loss, net |
(217,972) | (100,579) | 7,802 | ||||||
|
Total costs and expenses |
5,044,293 | 2,941,182 | 2,256,514 | ||||||
|
INCOME (LOSS) BEFORE INCOME TAXES |
(2,993,495) | 143,915 | 571,871 | ||||||
|
INCOME TAX EXPENSE (BENEFIT): |
|||||||||
|
Current |
(357) | 2,625 | 986 | ||||||
|
Deferred |
(773,870) | 76,545 | 204,882 | ||||||
|
Total income tax expense (benefit) |
(774,227) | 79,170 | 205,868 | ||||||
|
NET INCOME (LOSS) |
(2,219,268) | 64,745 | 366,003 | ||||||
|
Net loss attributable to noncontrolling interests |
86 | 62 | 52 | ||||||
|
NET INCOME (LOSS) AVAILABLE TO SHAREHOLDERS |
(2,219,182) | 64,807 | 366,055 | ||||||
|
Preferred stock dividends |
- |
- |
(538) | ||||||
|
NET INCOME (LOSS) AVAILABLE TO COMMON SHAREHOLDERS |
|
$ |
(2,219,182) |
|
$ |
64,807 |
|
$ |
365,517 |
|
EARNINGS (LOSS) PER COMMON SHARE: |
|||||||||
|
Basic |
$ |
(11.35) |
$ |
0.53 |
$ |
3.09 | |||
|
Diluted |
$ |
(11.35) |
$ |
0.53 |
$ |
3.06 | |||
|
WEIGHTED AVERAGE SHARES OUTSTANDING: |
|||||||||
|
Basic |
195,472 | 122,138 | 118,260 | ||||||
|
Diluted |
195,472 | 122,519 | 119,588 | ||||||
|
See notes to consolidated financial statements. |
|||||||||
71
WHITING PETROLEUM CORPORATION
CONSOLIDATED STATEMENTS OF COMPREHENSIVE INCOME (LOSS)
(in thousands)
|
Year Ended |
|||||||||
|
December 31, |
|||||||||
|
2015 |
2014 |
2013 |
|||||||
|
NET INCOME (LOSS) |
$ |
(2,219,268) |
$ |
64,745 |
$ |
366,003 | |||
|
OTHER COMPREHENSIVE INCOME, NET OF TAX: |
|
|
|
|
|
|
|
|
|
|
OCI amortization on de-designated hedges (1) (2) |
- |
- |
1,236 | ||||||
|
Total other comprehensive income, net of tax |
- |
- |
1,236 | ||||||
|
COMPREHENSIVE INCOME (LOSS) |
|
|
(2,219,268) |
|
|
64,745 |
|
|
367,239 |
|
Comprehensive loss attributable to noncontrolling interest |
86 | 62 | 52 | ||||||
|
COMPREHENSIVE INCOME (LOSS) ATTRIBUTABLE TO WHITING |
|
$ |
(2,219,182) |
|
$ |
64,807 |
|
$ |
367,291 |
_____________________
|
(1) |
Presented net of income tax expense of $722 for the year ended December 31, 2013. |
|
(2) |
Effective April 1, 2009, the Company de-designated all of its commodity derivative contracts that had been previously designated as cash flow hedges and elected to discontinue hedge accounting prospectively. As a result, such mark-to-market values at March 31, 2009 were frozen in accumulated other comprehensive income (“AOCI”) as of the de-designation date and were reclassified into earnings as the original hedged transactions affected income. The OCI amortization amount on the de-designated hedges was reclassified from AOCI to loss on hedging activities in the consolidated statements of operations. As of December 31, 2013, all amounts previously in AOCI had been reclassified into earnings. |
See notes to consolidated financial statements.
72
WHITING PETROLEUM CORPORATION
CONSOLIDATED STATEMENTS OF CASH FLOWS
(in thousands)
|
Year Ended |
|||||||||
|
December 31, |
|||||||||
|
2015 |
2014 |
2013 |
|||||||
|
CASH FLOWS FROM OPERATING ACTIVITIES: |
|||||||||
|
Net income (loss) |
$ |
(2,219,268) |
$ |
64,745 |
$ |
366,003 | |||
|
Adjustments to reconcile net income (loss) to net cash provided by operating activities: |
|
|
|
|
|
|
|
|
|
|
Depreciation, depletion and amortization |
1,243,293 | 1,089,545 | 891,516 | ||||||
|
Deferred income tax expense (benefit) |
(773,870) | 76,545 | 204,882 | ||||||
|
Amortization of debt issuance costs, debt discount and debt premium |
46,525 | 11,984 | 12,405 | ||||||
|
Stock-based compensation |
28,098 | 23,258 | 22,436 | ||||||
|
Amortization of deferred gain on sale |
(16,751) | (30,494) | (31,737) | ||||||
|
(Gain) loss on sale of properties |
60,791 | (27,657) | (128,648) | ||||||
|
Undeveloped leasehold and oil and gas property impairments |
1,738,308 | 767,627 | 358,455 | ||||||
|
Goodwill impairment |
873,772 |
- |
- |
||||||
|
Exploratory dry hole costs |
9,440 | 26,327 | 28,725 | ||||||
|
Loss on early extinguishment of debt |
18,361 |
- |
4,412 | ||||||
|
Change in Production Participation Plan liability |
- |
- |
(6,980) | ||||||
|
Non-cash portion of derivative gain |
(1,615) | (57,465) | (20,830) | ||||||
|
Other, net |
(9,337) | (9,030) | (16,118) | ||||||
|
Changes in current assets and liabilities: |
|||||||||
|
Accounts receivable trade, net |
207,367 | 17,618 | (22,912) | ||||||
|
Prepaid expenses and other |
54,027 | (50,352) | (15,981) | ||||||
|
Accounts payable trade and accrued liabilities |
(117,136) | (86,480) | 33,360 | ||||||
|
Revenues and royalties payable |
(74,417) | (1,963) | 48,988 | ||||||
|
Taxes payable |
(16,196) | 1,094 | 16,769 | ||||||
|
Net cash provided by operating activities |
1,051,392 | 1,815,302 | 1,744,745 | ||||||
|
CASH FLOWS FROM INVESTING ACTIVITIES: |
|||||||||
|
Drilling and development capital expenditures |
(2,455,218) | (2,842,837) | (2,349,819) | ||||||
|
Acquisition of oil and gas properties |
(28,449) | (45,573) | (422,923) | ||||||
|
Other property and equipment |
(13,266) | (79,955) | (45,304) | ||||||
|
Proceeds from sale of oil and gas properties |
514,814 | 107,848 | 968,606 | ||||||
|
Issuance of note receivable |
- |
- |
(10,530) | ||||||
|
Cash paid for investing derivatives |
- |
- |
(44,900) | ||||||
|
Cash settlements received on investing derivatives |
- |
- |
2,371 | ||||||
|
Net cash used in investing activities |
(1,982,119) | (2,860,517) | (1,902,499) | ||||||
|
CASH FLOWS FROM FINANCING ACTIVITIES: |
|||||||||
|
Issuance of common stock |
1,111,148 |
- |
- |
||||||
|
Issuance of 1.25% Convertible Senior Notes due 2020 |
1,250,000 |
- |
- |
||||||
|
Issuance of 6.25% Senior Notes due 2023 |
750,000 |
- |
- |
||||||
|
Issuance of 5.75% Senior Notes due 2021 |
- |
- |
1,204,000 | ||||||
|
Issuance of 5% Senior Notes due 2019 |
- |
- |
1,100,000 | ||||||
|
Redemption of 8.125% Senior Notes due 2019 |
(832,429) |
- |
- |
||||||
|
Redemption of 5.5% Senior Notes due 2022 |
(404,000) |
- |
- |
||||||
|
Redemption of 5.5% Senior Notes due 2021 |
(353,500) |
- |
- |
||||||
|
Redemption of 7% Senior Subordinated Notes due 2014 |
- |
- |
(253,988) | ||||||
|
Borrowings under credit agreement |
3,550,000 | 2,150,000 | 1,860,000 | ||||||
|
Repayments of borrowings under credit agreement |
(4,150,000) | (1,675,000) | (3,060,000) | ||||||
|
Debt and equity issuance costs |
(54,461) | (14,901) | (29,690) | ||||||
|
Repayment of tax sharing liability |
- |
(26,373) | (1,759) | ||||||
|
Proceeds from stock options exercised |
3,048 | 1,781 |
- |
||||||
|
Restricted stock used for tax withholdings |
(1,126) | (11,652) | (5,611) | ||||||
|
Preferred stock dividends paid |
- |
- |
(538) | ||||||
|
Net cash provided by financing activities |
$ |
868,680 |
$ |
423,855 |
$ |
812,414 | |||
|
See notes to consolidated financial statements. |
(Continued) |
||||||||
73
WHITING PETROLEUM CORPORATION
CONSOLIDATED STATEMENTS OF CASH FLOWS
(in thousands)
|
Year Ended |
|||||||||
|
December 31, |
|||||||||
|
2015 |
2014 |
2013 |
|||||||
|
NET CHANGE IN CASH AND CASH EQUIVALENTS |
|
$ |
(62,047) |
|
$ |
(621,360) |
|
$ |
654,660 |
|
CASH AND CASH EQUIVALENTS: |
|||||||||
|
Beginning of period |
78,100 | 699,460 | 44,800 | ||||||
|
End of period |
$ |
16,053 |
$ |
78,100 |
$ |
699,460 | |||
|
SUPPLEMENTAL CASH FLOW DISCLOSURES: |
|
|
|
|
|
|
|
|
|
|
Income taxes paid (refunded), net |
$ |
(604) |
$ |
1,380 |
$ |
3,681 | |||
|
Interest paid, net of amounts capitalized |
$ |
292,852 |
$ |
135,150 |
$ |
66,541 | |||
|
NONCASH INVESTING AND FINANCING ACTIVITIES: |
|
|
|
|
|
|
|
|
|
|
Accrued capital expenditures related to property additions |
$ |
94,105 |
$ |
429,970 |
$ |
158,739 | |||
|
Fair value of equity issued and debt assumed in the Kodiak Acquisition |
$ |
- |
$ |
4,289,088 |
$ |
- |
|||
|
See notes to consolidated financial statements. |
(Concluded) |
||||||||
74
WHITING PETROLEUM CORPORATION
CONSOLIDATED STATEMENTS OF EQUITY
(in thousands)
|
Accumulated |
Total |
|||||||||||||||||||||||||||
|
Preferred |
Common |
Additional |
Other |
Whiting |
||||||||||||||||||||||||
|
Stock |
Stock |
Paid-in |
Comprehensive |
Retained |
Shareholders' |
Noncontrolling |
Total |
|||||||||||||||||||||
|
Shares |
Amount |
Shares |
Amount |
Capital |
Income (Loss) |
Earnings |
Equity |
Interest |
Equity |
|||||||||||||||||||
|
BALANCES-January 1, 2013 |
172 |
$ |
- |
118,582 |
$ |
119 |
$ |
1,566,717 |
$ |
(1,236) |
$ |
1,879,388 |
$ |
3,444,988 |
$ |
8,184 |
$ |
3,453,172 | ||||||||||
|
Net income (loss) |
- |
- |
- |
- |
- |
- |
366,055 | 366,055 | (52) | 366,003 | ||||||||||||||||||
|
Other comprehensive income |
- |
- |
- |
- |
- |
1,236 |
- |
1,236 |
- |
1,236 | ||||||||||||||||||
|
Conversion of preferred stock to common |
(172) |
- |
794 | 1 |
- |
- |
- |
1 |
- |
1 | ||||||||||||||||||
|
Restricted stock issued |
- |
- |
941 |
- |
- |
- |
- |
- |
- |
- |
||||||||||||||||||
|
Restricted stock forfeited |
- |
- |
(100) |
- |
- |
- |
- |
- |
- |
- |
||||||||||||||||||
|
Restricted stock used for tax withholdings |
- |
- |
(115) |
- |
(5,611) |
- |
- |
(5,611) |
- |
(5,611) | ||||||||||||||||||
|
Stock-based compensation |
- |
- |
- |
- |
22,436 |
- |
- |
22,436 |
- |
22,436 | ||||||||||||||||||
|
Preferred dividends paid |
- |
- |
- |
- |
- |
- |
(538) | (538) |
- |
(538) | ||||||||||||||||||
|
BALANCES-December 31, 2013 |
- |
- |
120,102 | 120 | 1,583,542 |
- |
2,244,905 | 3,828,567 | 8,132 | 3,836,699 | ||||||||||||||||||
|
Net income (loss) |
- |
- |
- |
- |
- |
- |
64,807 | 64,807 | (62) | 64,745 | ||||||||||||||||||
|
Issuance of common stock for the Kodiak Acquisition |
|
- |
|
|
- |
|
47,546 |
|
|
48 |
|
|
1,771,046 |
|
|
- |
|
|
- |
|
|
1,771,094 |
|
|
- |
|
|
1,771,094 |
|
Fair value of restricted stock units assumed in the Kodiak Acquisition |
|
- |
|
|
- |
|
258 |
|
|
- |
|
|
9,596 |
|
|
- |
|
|
- |
|
|
9,596 |
|
|
- |
|
|
9,596 |
|
Fair value of stock options assumed in the Kodiak Acquisition |
|
- |
|
|
- |
|
- |
|
|
- |
|
|
7,523 |
|
|
- |
|
|
- |
|
|
7,523 |
|
|
- |
|
|
7,523 |
|
Exercise of stock options |
- |
- |
117 |
- |
1,781 |
- |
- |
1,781 |
- |
1,781 | ||||||||||||||||||
|
Restricted stock issued |
- |
- |
908 |
- |
- |
- |
- |
- |
- |
- |
||||||||||||||||||
|
Restricted stock forfeited |
- |
- |
(386) |
- |
- |
- |
- |
- |
- |
- |
||||||||||||||||||
|
Restricted stock used for tax withholdings |
|
- |
|
|
- |
|
(199) |
|
|
- |
|
|
(11,652) |
|
|
- |
|
|
- |
|
|
(11,652) |
|
|
- |
|
|
(11,652) |
|
Stock-based compensation |
- |
- |
- |
- |
23,258 |
- |
- |
23,258 |
- |
23,258 | ||||||||||||||||||
|
BALANCES-December 31, 2014 |
- |
- |
168,346 | 168 | 3,385,094 |
- |
2,309,712 | 5,694,974 | 8,070 | 5,703,044 | ||||||||||||||||||
|
Net loss |
- |
- |
- |
- |
- |
- |
(2,219,182) | (2,219,182) | (86) | (2,219,268) | ||||||||||||||||||
|
Issuance of common stock |
- |
- |
37,000 | 37 | 1,100,000 |
- |
- |
1,100,037 |
- |
1,100,037 | ||||||||||||||||||
|
Equity component of Convertible Senior Notes, net |
|
- |
|
|
- |
|
- |
|
|
- |
|
|
144,755 |
|
|
- |
|
|
- |
|
|
144,755 |
|
|
- |
|
|
144,755 |
|
Exercise of stock options |
- |
- |
149 |
- |
3,048 |
- |
- |
3,048 |
- |
3,048 | ||||||||||||||||||
|
Restricted stock issued |
- |
- |
1,216 | 1 | (1) |
- |
- |
- |
- |
- |
||||||||||||||||||
|
Restricted stock forfeited |
- |
- |
(230) |
- |
- |
- |
- |
- |
- |
- |
||||||||||||||||||
|
Restricted stock used for tax withholdings |
|
- |
|
|
- |
|
(40) |
|
|
- |
|
|
(1,126) |
|
|
- |
|
|
- |
|
|
(1,126) |
|
|
- |
|
|
(1,126) |
|
Stock-based compensation |
- |
- |
- |
- |
28,098 |
- |
- |
28,098 |
- |
28,098 | ||||||||||||||||||
|
BALANCES-December 31, 2015 |
- |
$ |
- |
206,441 |
$ |
206 |
$ |
4,659,868 |
$ |
- |
$ |
90,530 |
$ |
4,750,604 |
$ |
7,984 |
$ |
4,758,588 | ||||||||||
|
See notes to consolidated financial statements. |
||||||||||||||||||||||||||||
75
WHITING PETROLEUM CORPORATION
NOTES TO CONSOLIDATED FINANCIAL STATEMENTS
1. SUMMARY OF SIGNIFICANT ACCOUNTING POLICIES
Description of Operations—Whiting Petroleum Corporation, a Delaware corporation, is an independent oil and gas company engaged in the development, acquisition, exploration and production of crude oil, NGLs and natural gas primarily in the Rocky Mountains and Permian Basin regions of the United States. Unless otherwise specified or the context otherwise requires, all references in these notes to “Whiting” or the “Company” are to Whiting Petroleum Corporation and its consolidated subsidiaries, Whiting Oil and Gas Corporation (“Whiting Oil and Gas”), Whiting US Holding Company, Whiting Canadian Holding Company ULC (formerly Kodiak Oil & Gas Corp., “Kodiak”), Whiting Resources Corporation (formerly Kodiak Oil & Gas (USA) Inc.) and Whiting Programs, Inc.
Basis of Presentation of Consolidated Financial Statements—The consolidated financial statements include the accounts of Whiting Petroleum Corporation, its consolidated subsidiaries and Whiting’s pro rata share of the accounts of Whiting USA Trust I (“Trust I”) pursuant to Whiting’s 15.8% ownership interest in Trust I. On January 28, 2015, the net profits interest that Whiting conveyed to Trust I terminated and such interest in the underlying properties reverted back to Whiting. Investments in entities which give Whiting significant influence, but not control, over the investee are accounted for using the equity method. Under the equity method, investments are stated at cost plus the Company’s equity in undistributed earnings and losses. All intercompany balances and transactions have been eliminated upon consolidation.
Use of Estimates—The preparation of financial statements in conformity with generally accepted accounting principles requires management to make estimates and assumptions that affect the reported amounts of assets and liabilities, the disclosure of contingent assets and liabilities at the date of the financial statements, and the reported amounts of revenues and expenses during the reporting period. Items subject to such estimates and assumptions include (1) oil and natural gas reserves; (2) impairment tests of long-lived assets; (3) depreciation, depletion and amortization; (4) asset retirement obligations; (5) assigning fair value and allocating purchase price in connection with business combinations, including the determination of any resulting goodwill; (6) valuations of our business unit used in impairment tests of goodwill; (7) income taxes; (8) accrued liabilities; (9) valuation of derivative instruments; and (10) accrued revenue and related receivables. Although management believes these estimates are reasonable, actual results could differ from these estimates.
Cash and Cash Equivalents—Cash equivalents consist of demand deposits and highly liquid investments which have an original maturity of three months or less.
Accounts Receivable Trade—Whiting’s accounts receivable trade consist mainly of receivables from oil and gas purchasers and joint interest owners on properties the Company operates. For receivables from joint interest owners, Whiting typically has the ability to withhold future revenue disbursements to recover any non-payment of joint interest billings. Generally, the Company’s oil and gas receivables are collected within two months, and to date, the Company has had minimal bad debts.
The Company routinely assesses the recoverability of all material trade and other receivables to determine their collectability. At December 31, 2015 and 2014, the Company had an allowance for doubtful accounts of $12 million and $9 million, respectively.
Inventories—Materials and supplies inventories consist primarily of tubular goods and production equipment, carried at weighted-average cost. Materials and supplies are included in other property and equipment. Crude oil in tanks inventory is carried at the lower of the estimated cost to produce or market value and is included in prepaid expenses and other.
Oil and Gas Properties
Proved. The Company follows the successful efforts method of accounting for its oil and gas properties. Under this method of accounting, all property acquisition costs and development costs are capitalized when incurred and depleted on a unit-of-production basis over the remaining life of proved reserves and proved developed reserves, respectively. Costs of drilling exploratory wells are initially capitalized but are charged to expense if the well is determined to be unsuccessful.
The Company assesses its proved oil and gas properties for impairment whenever events or circumstances indicate that the carrying value of the assets may not be recoverable. The impairment test compares undiscounted future net cash flows to the assets’ net book value. If the net capitalized costs exceed future net cash flows, then the cost of the property is written down to fair value. Fair value for oil and gas properties is generally determined based on discounted future net cash flows. Impairment expense for proved properties is reported in exploration and impairment expense.
Net carrying values of retired, sold or abandoned properties that constitute less than a complete unit of depreciable property are charged or credited, net of proceeds, to accumulated depreciation, depletion and amortization unless doing so significantly affects the
76
unit-of-production amortization rate, in which case a gain or loss is recognized in income. Gains or losses from the disposal of complete units of depreciable property are recognized to earnings.
Interest cost is capitalized as a component of property cost for development projects that require greater than six months to be readied for their intended use. During 2015, 2014 and 2013, the Company capitalized interest of $4 million, $4 million and $2 million, respectively.
Unproved. Unproved properties consist of costs to acquire undeveloped leases as well as purchases of unproved reserves. Undeveloped lease costs and unproved reserve acquisitions are capitalized, and individually insignificant unproved properties are amortized on a composite basis, based on average lease-term lives and the historical experience of developing acreage in a particular prospect. The Company evaluates significant unproved properties for impairment based on remaining lease term, drilling results, reservoir performance, seismic interpretation or future plans to develop acreage. When successful wells are drilled on undeveloped leaseholds, unproved property costs are reclassified to proved properties and depleted on a unit-of-production basis. Impairment expense for unproved properties is reported in exploration and impairment expense.
Exploratory. Geological and geophysical costs, including exploratory seismic studies, and the costs of carrying and retaining unproved acreage are expensed as incurred. Costs of seismic studies that are utilized in development drilling within an area of proved reserves are capitalized as development costs. Amounts of seismic costs capitalized are based on only those blocks of data used in determining development well locations. To the extent that a seismic project covers areas of both developmental and exploratory drilling, those seismic costs are proportionately allocated between development costs and exploration expense.
Costs of drilling exploratory wells are initially capitalized, pending determination of whether the well has found proved reserves. If an exploratory well has not found proved reserves, the costs of drilling the well and other associated costs are charged to expense. Cost incurred for exploratory wells that find reserves, which cannot yet be classified as proved, continue to be capitalized if (a) the well has found a sufficient quantity of reserves to justify completion as a producing well, and (b) the Company is making sufficient progress assessing the reserves and the economic and operating viability of the project. If either condition is not met, or if the Company obtains information that raises substantial doubt about the economic or operational viability of the project, the exploratory well costs, net of any salvage value, are expensed.
Enhanced recovery activities. The Company carries out tertiary recovery methods on certain of its oil and gas properties in order to recover additional hydrocarbons that are not recoverable from primary or secondary recovery methods. Acquisition costs of tertiary injectants, such as purchased CO2, for EOR activities that are used during a project’s pilot phase, or prior to a project’s technical and economic viability (i.e. prior to the recognition of proved tertiary recovery reserves) are expensed as incurred. After a project has been determined to be technically feasible and economically viable, all acquisition costs of tertiary injectants are capitalized as development costs and depleted, as they are incurred solely for obtaining access to reserves not otherwise recoverable and have future economic benefits over the life of the project. As CO2 is recovered together with oil and gas production, it is extracted and re-injected, and all the associated CO2 recycling costs are expensed as incurred. Likewise costs incurred to maintain reservoir pressure are also expensed.
Other Property and Equipment—Other property and equipment consists of (i) materials and supplies inventories, (ii) leasehold costs and development costs of our CO2 source properties and (iii) other property and equipment including, furniture and fixtures, buildings, leasehold improvements and automobiles, which are stated at cost and depreciated using the straight-line method over their estimated useful lives ranging from 4 to 30 years.
Goodwill—Goodwill represents the excess of the purchase price over the estimated fair value of the net assets acquired in a business combination. Goodwill has an indefinite useful life and is not amortized, but rather is tested by the Company for impairment annually in the second quarter or whenever events or changes in circumstances indicate that the fair value of the reporting unit may have been reduced below its carrying value. If the Company’s qualitative analysis indicates that it is more likely than not that the fair value of the reporting unit is less than its carrying value, the Company then performs a quantitative impairment test. If the carrying value of the reporting unit exceeds its fair value, goodwill is written down to its implied fair value with an offsetting charge to earnings.
The Company performed its annual goodwill impairment test as of June 30, 2015, and determined that no impairment had occurred. However, as a result of a sustained decrease in the price of Whiting’s common stock during the third quarter of 2015 caused by a significant decline in crude oil and natural gas prices over that same period, the Company performed another goodwill impairment test as of September 30, 2015. The impairment test performed by the Company indicated that the fair value of its reporting unit was less than its carrying amount, and further that there was no remaining implied fair value attributable to goodwill. Based on these results, the Company recorded a non-cash impairment charge to reduce the carrying value of goodwill to zero.
Debt Issuance Costs—Debt issuance costs related to the Company’s senior notes, convertible senior notes and senior subordinated notes are included as a deduction from the carrying amount of long-term debt in the consolidated balance sheets, and are amortized to
77
interest expense using the effective interest method over the term of the related debt. Debt issuance costs related to the credit facility are included in other long-term assets, and are amortized to interest expense on a straight-line basis over the term of the agreement.
Derivative Instruments—The Company enters into derivative contracts, primarily costless collars and swap contracts, to manage its exposure to commodity price risk. All derivative instruments, other than those that meet the “normal purchase normal sale” exclusion, are recorded on the balance sheet as either an asset or liability measured at fair value. Gains and losses from changes in the fair value of derivative instruments are recognized immediately in earnings, unless the derivative meets specific hedge accounting criteria, and the derivative has been designated as a hedge. Effective April 1, 2009, however, the Company elected to discontinue all hedge accounting prospectively, and as of December 31, 2013, all amounts related to de-designated cash flow hedges had been reclassified into earnings.
Cash flows from derivatives used to manage commodity price risk are classified in operating activities along with the cash flows of the underlying hedged transactions. The Company does not enter into derivative instruments for speculative or trading purposes.
Asset Retirement Obligations and Environmental Costs—Asset retirement obligations relate to future costs associated with the plugging and abandonment of oil and gas wells, removal of equipment and facilities from leased acreage and returning such land to its original condition. The fair value of a liability for an asset retirement obligation is recorded in the period in which it is incurred (typically when a well is completed or acquired or when an asset is installed at the production location), and the cost of such liability increases the carrying amount of the related long-lived asset by the same amount. The liability is accreted each period through charges to depreciation, depletion and amortization expense, and the capitalized cost is depleted on a unit-of-production basis over the proved developed reserves of the related asset. Revisions to estimated retirement obligations result in adjustments to the related capitalized asset and corresponding liability.
Liabilities for environmental costs are recorded on an undiscounted basis when it is probable that obligations have been incurred and the amounts can be reasonably estimated. These liabilities are not reduced by possible recoveries from third parties.
Deferred Gain on Sale—The deferred gain on sale relates to the sale of 11,677,500 Trust I units and 18,400,000 Whiting USA Trust II (“Trust II”) units, and is amortized to income based on the unit-of-production method. In January 2015, the deferred gain on sale related to Trust I was fully amortized in connection with the termination of the trust’s net profits interest.
Revenue Recognition—Oil and gas revenues are recognized when production volumes are sold to a purchaser at a fixed or determinable price, delivery has occurred and title has transferred, persuasive evidence of a sales arrangement exists and collectability of the revenue is reasonably assured. Revenues from the production of gas properties in which the Company has an interest with other producers are recognized on the basis of the Company’s net working interest (entitlement method). Net deliveries in excess of entitled amounts are recorded as liabilities, while net under deliveries are reflected as receivables. The Company’s aggregate imbalance positions as of December 31, 2015 and 2014 were not significant.
Taxes collected and remitted to governmental agencies on behalf of customers are not included in revenues or costs and expenses.
General and Administrative Expenses—General and administrative expenses are reported net of reimbursements of overhead costs that are allocated to the working interest owners that participate in oil and gas properties operated by Whiting.
Acquisition Costs—Acquisition related expenses, which consist of external costs directly related to the Company’s acquisitions, such as advisory, legal, accounting, valuation and other professional fees, are expensed as incurred.
Maintenance and Repairs—Maintenance and repair costs that do not extend the useful lives of property and equipment are charged to expense as incurred. Major replacements, renewals and betterments are capitalized.
Income Taxes—Income taxes are recognized based on earnings reported for tax return purposes in addition to a provision for deferred income taxes. Deferred income taxes are accounted for using the liability method. Under this method, deferred tax assets and liabilities are determined by applying the enacted statutory tax rates in effect at the end of a reporting period to the cumulative temporary differences between the tax bases of assets and liabilities and their reported amounts in the Company’s financial statements. The effect on deferred taxes for a change in tax rates is recognized in income in the period that includes the enactment date. A valuation allowance for deferred tax assets is established when it is more likely than not that some portion of the benefit from deferred tax assets will not be realized. The Company’s uncertain tax positions must meet a more-likely-than-not realization threshold to be recognized, and any potential accrued interest and penalties related to unrecognized tax benefits are recognized within income tax expense.
Earnings Per Share—Basic earnings per common share is calculated by dividing net income available to common shareholders by the weighted average number of common shares outstanding during each period. Diluted earnings per common share is calculated by dividing adjusted net income available to common shareholders by the weighted average number of diluted common shares
78
outstanding, which includes the effect of potentially dilutive securities. Potentially dilutive securities for the diluted earnings per share calculations consist of unvested restricted stock awards, outstanding stock options and contingently issuable shares of convertible debt, all using the treasury stock method. In the computation of diluted earnings per share, excess tax benefits that would be created upon the assumed vesting of unvested restricted shares or the assumed exercise of stock options (i.e. hypothetical excess tax benefits) are included in the assumed proceeds component of the treasury stock method to the extent that such excess tax benefits are more likely than not to be realized. In addition, to the extent the conversion value of the convertible debt exceeds the aggregate principal amount of the notes, such conversion spread is included in the diluted earnings per share computation under the treasury stock method. When a loss from continuing operations exists, all potentially dilutive securities are anti-dilutive and are therefore excluded from the computation of diluted earnings per share.
Industry Segment and Geographic Information—The Company has evaluated how it is organized and managed and has identified only one operating segment, which is the exploration and production of crude oil, NGLs and natural gas. The Company considers its gathering, processing and marketing functions as ancillary to its oil and gas producing activities. All of the Company’s operations and assets are located in the United States, and substantially all of its revenues are attributable to United States customers.
Concentration of Credit Risk—Whiting is exposed to credit risk in the event of nonpayment by counterparties, a significant portion of which are concentrated in energy related industries. The creditworthiness of customers and other counterparties is subject to continuing review. For the year ended December 31, 2015, no individual purchaser accounted for 10% or more of the Company’s total oil, NGL and natural gas sales. The following table presents the percentages by purchaser that accounted for 10% or more of the Company’s total oil, NGL and natural gas sales for the years ended December 31, 2014 and 2013:
|
2014 |
2013 |
|||
|
Plains Marketing LP |
17% |
21% |
||
|
Shell Trading US |
10% |
14% |
||
|
Bridger Trading LLC |
10% |
8% |
||
|
Eighty Eight Oil Company |
6% |
11% |
Commodity derivative contracts held by the Company are with six counterparties, all of which are participants in Whiting’s credit facility as well, and all of which have investment-grade ratings from Moody’s and Standard & Poor. As of December 31, 2015, outstanding derivative contracts with JP Morgan Chase Bank, N.A. represented 76% of total crude oil volumes hedged.
Reclassifications—Certain prior period balances in the consolidated balance sheets have been reclassified to conform to the current year presentation. Such reclassifications had no impact on net income, cash flows or shareholders’ equity previously reported.
Adopted and Recently Issued Accounting Pronouncements—In May 2014, the FASB issued Accounting Standards Update No. 2014-09, Revenue from Contracts with Customers (“ASU 2014‑09”). The objective of ASU 2014-09 is to clarify the principles for recognizing revenue and to develop a common revenue standard for U.S. GAAP and International Financial Reporting Standards. ASU 2014-09 was effective for fiscal years, and interim periods within those years, beginning after December 15, 2016, however, in August 2015, the FASB issued Accounting Standards Update No. 2015-14, Revenue from Contracts with Customers: Deferral of the Effective Date (“ASU 2015-14”), which deferred the effective date of ASU 2014‑09 for one year. ASU 2015-14 is effective for fiscal years, and interim periods within those years, beginning after December 15, 2017. The standards permit retrospective application using either of the following methodologies: (i) restatement of each prior reporting period presented or (ii) recognition of a cumulative-effect adjustment as of the date of initial application. The Company is currently evaluating the impact of adopting ASU 2014‑09 and ASU 2015-14, including the transition method to be applied, however the standards are not expected to have a significant effect on its consolidated financial statements.
In August 2014, the FASB issued Accounting Standards Update No. 2014-15, Presentation of Financial Statements – Going Concern (“ASU 2014-15”). The objective of ASU 2014-15 is to provide guidance on management’s responsibility to evaluate whether there is substantial doubt about a company’s ability to continue as a going concern and to provide related footnote disclosures. ASU 2014-15 is effective for fiscal years ending after December 15, 2016 and annual and interim periods thereafter. This standard is not expected to have an impact on the Company’s consolidated financial statements.
In April 2015, the FASB issued Accounting Standards Update No. 2015-03, Simplifying the Presentation of Debt Issuance Costs (“ASU 2015-03”). The objective of ASU 2015-03 is to simplify the presentation of debt issuance costs in financial statements by presenting such costs in the balance sheet as a direct deduction from the related debt liability rather than as an asset. In August 2015, the FASB issued Accounting Standards Update No. 2015-15, Presentation and Subsequent Measurement of Debt Issuance Costs Associated with Line-of-Credit Arrangements (“ASU 2015-15”). This ASU amends ASU 2015-03 which had not addressed the balance sheet presentation of debt issuance costs incurred in connection with line-of-credit arrangements. Under ASU 2015-15, a Company may defer debt issuance costs associated with line-of-credit arrangements and present such costs as an asset, subsequently amortizing the deferred debt issuance costs ratably over the term of the line-of-credit arrangement, regardless of whether there are any
79
outstanding borrowings. ASU 2015-03 and ASU 2015-15 are effective for fiscal years, and interim periods within those fiscal years, beginning after December 15, 2015, should be applied retrospectively and represent a change in accounting principle. Early adoption is permitted. The Company adopted ASU 2015-03 and ASU 2015-15 as of December 31, 2015, and as a result, $26 million of debt issuance costs related to the Company’s senior notes, convertible senior notes, and senior subordinated notes were reclassified from other long-term assets to long-term debt in the Company’s consolidated balance sheet as of December 31, 2014. The Company elected to continue presenting the debt issuance costs associated with its credit facility as other long-term assets in the consolidated balance sheets.
In July 2015, the FASB issued Accounting Standards Update No. 2015-11, Simplifying the Measurement of Inventory (“ASU 2015-11”). This ASU requires entities to measure most inventory at the lower of cost and net realizable value, thereby simplifying the current guidance under which an entity must measure inventory at the lower of cost or market. ASU 2015-11 is effective for fiscal years beginning after December 15, 2016, including interim periods within those fiscal years and should be applied prospectively. Early adoption is permitted. The adoption of this standard will not have a material impact on the Company’s consolidated financial statements.
In September 2015, the FASB issued Accounting Standards Update No. 2015-16, Simplifying the Accounting for Measurement-Period Adjustments (“ASU 2015-16”). This ASU eliminates the requirement to retrospectively apply measurement-period adjustments made to provisional amounts recognized in a business combination. Under ASU 2015-16, the cumulative impact of a measurement-period adjustment (including the impact on prior periods) should instead be recognized in the reporting period in which the adjustment is identified. ASU 2015-16 is effective for fiscal years, and interim periods within those fiscal years, beginning after December 15, 2015. This standard should be applied prospectively, and early adoption is permitted. The adoption of this standard is not expected to have a significant impact on the Company’s consolidated financial statements.
In November 2015, the FASB issued Accounting Standards Update No. 2015-17, Balance Sheet Classification of Deferred Taxes (“ASU 2015-17”). The objective of this ASU is to simplify the financial statement presentation of deferred taxes by presenting both current and noncurrent deferred tax assets and liabilities as noncurrent on the balance sheet. ASU 2015-17 is effective for fiscal years, and interim periods within those fiscal years, beginning after December 15, 2016. This standard may be applied either prospectively or retrospectively to all periods presented, and early adoption is permitted. The Company adopted ASU 2015-17 as of December 31, 2015 on a retrospective basis, which represents a change in accounting principle. As a result, $48 million of deferred income taxes previously included within current liabilities were reclassified to noncurrent in the Company’s consolidated balance sheet as of December 31, 2014.
In January 2016, the FASB issued Accounting Standards Update No. 2016-01, Recognition and Measurement of Financial Assets and Financial Liabilities (“ASU 2016-01”). This ASU amends the guidance in U.S. GAAP on financial instruments specifically related to (i) the classification and measurement of investments in equity securities, (ii) the presentation of certain fair value changes for financial liabilities measured at fair value and (iii) certain disclosure requirements associated with the fair value of financial instruments. ASU 2016-01 is effective for fiscal years, and interim periods within those fiscal years, beginning after December 15, 2017. Early adoption is permitted only for the provisions of this ASU related to FASB ASC 825, Financial Instruments. A cumulative-effect adjustment to beginning retained earnings is required as of the beginning of the fiscal year in which this ASU is adopted. The adoption of this standard is not expected to have a significant impact on the Company’s consolidated financial statements.
2. OIL AND GAS PROPERTIES
Net capitalized costs related to the Company’s oil and gas producing activities at December 31, 2015 and 2014 are as follows (in thousands):
|
December 31, |
||||||
|
2015 |
2014 |
|||||
|
Proved leasehold costs |
$ |
3,206,237 |
$ |
3,637,026 | ||
|
Unproved leasehold costs |
689,754 | 1,232,040 | ||||
|
Costs of completed wells and facilities |
9,503,020 | 9,319,808 | ||||
|
Wells and facilities in progress |
505,514 | 760,828 | ||||
|
Total oil and gas properties, successful efforts method |
13,904,525 | 14,949,702 | ||||
|
Accumulated depletion |
(3,279,156) | (3,003,270) | ||||
|
Oil and gas properties, net |
$ |
10,625,369 |
$ |
11,946,432 | ||
80
3. ACQUISITIONS AND DIVESTITURES
2015 Acquisitions
There were no significant acquisitions during the year ended December 31, 2015.
2015 Divestitures
In December 2015, the Company completed the sale of a fresh water delivery system, a produced water gathering system and four saltwater disposal wells located in Weld County, Colorado, effective December 16, 2015, for a purchase price of $75 million (before closing adjustments).
In June 2015, the Company completed the sale of its interests in certain non-core oil and gas wells, effective June 1, 2015, for a purchase price of $150 million (before closing adjustments) and resulting in a pre-tax loss on sale of $118 million. The properties included over 2,000 gross wells in 132 fields across 10 states.
In April 2015, the Company completed the sale of its interests in certain non-core oil and gas wells, effective May 1, 2015, for a purchase price of $108 million (before closing adjustments) and resulting in a pre-tax gain on sale of $29 million. The properties are located in 187 fields across 14 states, and predominately consist of assets that were previously included in the underlying properties of Whiting USA Trust I.
Also during the year ended December 31, 2015, the Company completed several immaterial divestiture transactions for the sale of its interests in certain non-core oil and gas wells and undeveloped acreage, for a total purchase price of $176 million (before closing adjustments) and resulting in a pre-tax gain on sale of $28 million.
2014 Acquisitions
On December 8, 2014, the Company completed the acquisition of Kodiak Oil & Gas Corp. (now known as Whiting Canadian Holding Company ULC, “Kodiak”), whereby Whiting acquired all of the outstanding common stock of Kodiak (the “Kodiak Acquisition”). Pursuant to the terms of the Kodiak Acquisition agreement, Kodiak shareholders received 0.177 of a share of Whiting common stock in exchange for each share of Kodiak common stock they owned. Total consideration for the Kodiak Acquisition was $1.8 billion, consisting of 47,546,139 Whiting common shares issued at the market price of $37.25 per share on the date of issuance plus the fair value of Kodiak’s outstanding equity awards assumed by Whiting. The aggregate purchase price of the transaction was $4.3 billion, which included the assumption of Kodiak’s outstanding debt of $2.5 billion as of December 8, 2014 and the net cash acquired of $19 million.
Kodiak was an independent energy company focused on exploration and production of crude oil and natural gas reserves, primarily in the Williston Basin region of the United States. As a result of the Kodiak Acquisition, Whiting acquired approximately 327,000 gross (178,000 net) acres located primarily in North Dakota, including interests in 778 producing oil and gas wells and undeveloped acreage. Approximately 10,000 of the net acres acquired were located in Wyoming and Colorado.
The Kodiak Acquisition was accounted for using the acquisition method of accounting for business combinations. Transaction costs relating to the Kodiak Acquisition were expensed as incurred. The allocation of the purchase price has been finalized, and is based upon management’s estimates and assumptions related to the fair value of assets acquired and liabilities assumed on the acquisition date using currently available information. Since the acquisition date, the Company has recorded adjustments to provisional amounts, and a corresponding decrease to goodwill, totaling $2 million. These adjustments did not have a material impact on the Company’s previously reported consolidated financial statements, and therefore the Company has not retrospectively adjusted those financial statements.
81
The consideration transferred, fair value of assets acquired and liabilities assumed, and the resulting goodwill as of the acquisition date are as follows (in thousands):
|
Consideration: |
|||
|
Fair value of Whiting’s common stock issued (1) |
$ |
1,771,094 | |
|
Fair value of Kodiak restricted stock units assumed by Whiting (2) |
9,596 | ||
|
Fair value of Kodiak options assumed by Whiting |
7,523 | ||
|
Total consideration |
$ |
1,788,213 | |
|
Fair value of liabilities assumed: |
|||
|
Accounts payable trade |
$ |
18,390 | |
|
Accrued capital expenditures |
97,848 | ||
|
Revenues and royalties payable |
57,423 | ||
|
Accrued interest |
18,070 | ||
|
Accrued liabilities and other |
43,563 | ||
|
Taxes payable |
12,807 | ||
|
Long-term debt |
2,500,875 | ||
|
Deferred tax liability |
31,034 | ||
|
Asset retirement obligations |
8,646 | ||
|
Other long-term liabilities |
15,735 | ||
|
Amount attributable to liabilities assumed |
$ |
2,804,391 | |
|
Fair value of assets acquired: |
|||
|
Cash and cash equivalents |
$ |
18,879 | |
|
Accounts receivable trade, net |
215,654 | ||
|
Derivative assets |
85,718 | ||
|
Prepaid expenses and other |
8,523 | ||
|
Oil and gas properties, successful efforts method: |
|||
|
Proved properties |
2,266,607 | ||
|
Unproved properties |
1,000,396 | ||
|
Other property and equipment |
11,347 | ||
|
Deferred tax asset |
106,758 | ||
|
Other long-term assets |
4,950 | ||
|
Amount attributable to assets acquired |
$ |
3,718,832 | |
|
Goodwill |
$ |
873,772 |
_____________________
|
(1) |
47,546,139 shares of Whiting common stock at $37.25 per share (closing price as of December 5, 2014), based on Kodiak’s 268,622,497 common shares outstanding at closing. |
|
(2) |
257,601 shares of Whiting common stock issued at $37.25 per share (closing price as of December 5, 2014), based on Kodiak’s 1,455,409 restricted stock units held by employees as of December 8, 2014. |
Goodwill recognized as a result of the Kodiak Acquisition totaled $874 million, none of which was deductible for income tax purposes. Goodwill was primarily attributable to the operational and financial synergies expected to be realized from the acquisition, including the employment of optimized completion techniques on Kodiak's undrilled acreage which improved hydrocarbon recovery, the realization of savings in drilling and well completion costs, the accelerated development of Kodiak’s asset base, and the acquisition of experienced oil and gas technical personnel. During the third quarter of 2015, the Company determined that the goodwill recognized as a result of the Kodiak Acquisition had become fully impaired and wrote its carrying value down to zero. Refer to the “Fair Value Measurements” footnote for further information regarding goodwill impairment.
82
The changes in the carrying amount of goodwill as of December 31, 2015 and 2014 are as follows (in thousands):
|
Gross Carrying Amount |
Accumulated Impairment Losses |
Net Carrying Amount |
|||||||
|
Balance, January 1, 2014 |
$ |
- |
$ |
- |
$ |
- |
|||
|
Goodwill acquired |
875,676 |
- |
875,676 | ||||||
|
Balance, December 31, 2014 |
875,676 |
- |
875,676 | ||||||
|
Adjustments to previously recorded goodwill |
(1,904) |
- |
(1,904) | ||||||
|
Impairment losses |
- |
(873,772) | (873,772) | ||||||
|
Balance, December 31, 2015 |
$ |
873,772 |
$ |
(873,772) |
$ |
- |
|||
The results of operations of Kodiak from the December 8, 2014 closing date through December 31, 2014, representing approximately $46 million of revenue and $17 million of net income, have been included in Whiting’s consolidated statements of operations for the year ended December 31, 2014.
2014 Divestitures
In March 2014, the Company completed the sale of approximately 49,900 gross (41,000 net) acres in its Big Tex prospect, which consisted mainly of undeveloped acreage as well as its interests in certain producing oil and gas wells, located in the Delaware Basin of Texas for a cash purchase price of $76 million resulting in a pre-tax gain on sale of $12 million.
2013 Acquisitions
In September 2013, the Company completed the acquisition of approximately 39,300 gross (17,300 net) acres in the Williston Basin, including interests in 121 producing oil and gas wells and undeveloped acreage, located in Williams and McKenzie counties of North Dakota and Roosevelt and Richland counties of Montana for an initial purchase price of $261 million. Revenue and earnings from these properties since the September 20, 2013 acquisition date are not material, and disclosures of pro forma revenues and net income for this acquisition are also not material and have not been presented accordingly.
The acquisition was recorded using the acquisition method of accounting. The initial purchase price has been adjusted for post-closing settlements that have occurred since the acquisition date totaling $6 million. The following table summarizes the allocation of the $256 million adjusted purchase price to the tangible assets acquired and liabilities assumed in this acquisition of oil and gas properties (in thousands):
|
Purchase price |
$ |
255,537 | |
|
Allocation of purchase price: |
|||
|
Oil and gas properties, successful efforts method: |
|||
|
Proved properties |
$ |
229,002 | |
|
Unproved properties |
27,335 | ||
|
Oil in tank inventory |
522 | ||
|
Accounts receivable |
578 | ||
|
Asset retirement obligations |
(1,900) | ||
|
Total |
$ |
255,537 |
2013 Divestitures
In October 2013, the Company completed the sale of approximately 45,000 gross (32,200 net) acres in its Big Tex prospect, which consisted mainly of undeveloped acreage as well as its interests in certain producing oil and gas wells, located in the Delaware Basin of Texas for a cash purchase price of $151 million, resulting in a pre-tax gain on sale of $11 million. Of the total net acres sold, approximately 30,800 net acres are located in Pecos County, Texas, and approximately 1,400 net acres are located in Reeves County, Texas.
In July 2013, the Company completed the sale of its interests in certain oil and gas producing properties located in its EOR projects in the Postle and Northeast Hardesty fields in Texas County, Oklahoma, including the related Dry Trail plant gathering and processing facility, oil delivery pipeline, its entire 60% interest in the Transpetco CO2 pipeline, crude oil swap contracts and certain other related assets and liabilities (collectively the “Postle Properties”) for a cash purchase price of $809 million after selling costs and post-closing
83
adjustments. This divestiture resulted in a pre-tax gain on sale of $109 million. The Company used the net proceeds from this sale to repay a portion of the debt outstanding under its credit agreement.
Unaudited Pro Forma Operating Results
The following unaudited pro forma combined results of operations for the years ended December 31, 2014 and 2013 are derived from the historical consolidated financial statements of Whiting and Kodiak and give effect to the Kodiak Acquisition as if it had occurred on January 1, 2013.
|
December 31, |
||||||
|
2014 |
2013 |
|||||
|
(in thousands, except per share data) |
||||||
|
Total revenues |
$ |
4,141,046 |
$ |
3,774,137 | ||
|
Net income available to common shareholders |
$ |
362,376 |
$ |
576,450 | ||
|
Earnings per common share: |
||||||
|
Basic |
$ |
2.18 |
$ |
3.48 | ||
|
Diluted |
$ |
2.17 |
$ |
3.46 | ||
The unaudited pro forma combined results of operations reflect pro forma adjustments based on available information and certain assumptions that the Company believes are reasonable, including (i) Whiting common stock and equity awards issued to convert Kodiak’s outstanding shares of common stock and equity awards as of the closing date of the transaction, (ii) adjustments to conform Kodiak’s historical policy of accounting for its oil and natural gas properties from the full cost method to the successful efforts method of accounting, (iii) depletion of Kodiak’s fair-valued proved oil and gas properties, (iv) adjustments to interest expense to reflect the assumption of Kodiak’s debt by Whiting, and (v) the estimated tax impacts of the pro forma adjustments. Additionally, pro forma earnings for the year ended December 31, 2014 were adjusted to exclude $86 million of acquisition-related costs incurred by Whiting and Kodiak, and the pro forma earnings for the year ended December 31, 2013 were adjusted to include these charges.
The unaudited pro forma financial information has been prepared for informational purposes only and does not purport to represent what Whiting’s results of operations would have been had the transactions actually been consummated on the assumed dates nor are they indicative of future results of operations. The unaudited pro forma combined financial information does not reflect future events that may occur after the transactions including, but not limited to, the anticipated realization of ongoing savings from operating efficiencies from the Kodiak Acquisition.
4. LONG-TERM DEBT
Long-term debt consisted of the following at December 31, 2015 and 2014 (in thousands):
|
December 31, |
||||||
|
2015 |
2014 |
|||||
|
Credit agreement |
$ |
800,000 |
$ |
1,400,000 | ||
|
6.5% Senior Subordinated Notes due 2018 |
350,000 | 350,000 | ||||
|
5% Senior Notes due 2019 |
1,100,000 | 1,100,000 | ||||
|
8.125% Senior Notes due 2019 |
- |
800,000 | ||||
|
1.25% Convertible Senior Notes due 2020 |
1,250,000 |
- |
||||
|
5.75% Senior Notes due 2021 |
1,200,000 | 1,200,000 | ||||
|
5.5% Senior Notes due 2021 |
- |
350,000 | ||||
|
5.5% Senior Notes due 2022 |
- |
400,000 | ||||
|
6.25% Senior Notes due 2023 |
750,000 |
- |
||||
|
Total principal |
5,450,000 | 5,600,000 | ||||
|
Debt discounts and premiums |
(203,082) | 28,782 | ||||
|
Debt issuance costs on notes |
(49,214) | (26,393) | ||||
|
Total long-term debt |
$ |
5,197,704 |
$ |
5,602,389 | ||
The following table shows five succeeding fiscal years of scheduled maturities for the Company’s long-term debt as of December 31, 2015 (in thousands):
84
|
2016 |
2017 |
2018 |
2019 |
2020 |
|||||||||||
|
Long-term debt |
$ |
- |
$ |
- |
$ |
350,000 |
$ |
1,900,000 |
$ |
1,250,000 | |||||
Credit Agreement—Whiting Oil and Gas, the Company’s wholly-owned subsidiary, has a credit agreement with a syndicate of banks that as of December 31, 2015 had a borrowing base of $4.0 billion, with aggregate commitments of $3.5 billion. The Company may increase the maximum aggregate amount of commitments under the credit agreement up to the $4.0 billion borrowing base if certain conditions are satisfied, including the consent of lenders participating in the increase. As of December 31, 2015, the Company had $2.7 billion of available borrowing capacity, which was net of $800 million in borrowings and $2 million in letters of credit outstanding.
In October 2015, the Company entered into an amendment to its existing credit agreement in connection with the November 1, 2015 regular borrowing base redetermination that (i) decreased the borrowing base under the facility from $4.5 billion to $4.0 billion, with no change to the aggregate commitments of $3.5 billion, (ii) extended the Interim Covenant Period (as defined in the credit agreement and below), and (iii) included an additional financial covenant requirement during the Interim Covenant Period.
The borrowing base under the credit agreement is determined at the discretion of the lenders, based on the collateral value of the Company’s proved reserves that have been mortgaged to such lenders, and is subject to regular redeterminations on May 1 and November 1 of each year, as well as special redeterminations described in the credit agreement, in each case which may reduce the amount of the borrowing base. Upon a redetermination of the borrowing base, either on a periodic or special redetermination date, if borrowings in excess of the revised borrowing capacity were outstanding, the Company could be forced to immediately repay a portion of its debt outstanding under the credit agreement.
A portion of the revolving credit facility in an aggregate amount not to exceed $100 million may be used to issue letters of credit for the account of Whiting Oil and Gas or other designated subsidiaries of the Company. As of December 31, 2015, $98 million was available for additional letters of credit under the agreement.
The credit agreement provides for interest only payments until December 2019, when the credit agreement expires and all outstanding borrowings are due. Interest under the revolving credit facility accrues at the Company’s option at either (i) a base rate for a base rate loan plus the margin in the table below, where the base rate is defined as the greatest of the prime rate, the federal funds rate plus 0.5% per annum, or an adjusted LIBOR rate plus 1.0% per annum, or (ii) an adjusted LIBOR rate for a Eurodollar loan plus the margin in the table below. Additionally, the Company also incurs commitment fees as set forth in the table below on the unused portion of the aggregate commitments of the lenders under the revolving credit facility, which are included as a component of interest expense. At December 31, 2015, the weighted average interest rate on the outstanding principal balance under the credit agreement was 1.9%.
|
Applicable |
Applicable |
|||||
|
Margin for Base |
Margin for |
Commitment |
||||
|
Ratio of Outstanding Borrowings to Borrowing Base |
Rate Loans |
Eurodollar Loans |
Fee |
|||
|
Less than 0.25 to 1.0 |
0.50% |
1.50% |
0.375% |
|||
|
Greater than or equal to 0.25 to 1.0 but less than 0.50 to 1.0 |
0.75% |
1.75% |
0.375% |
|||
|
Greater than or equal to 0.50 to 1.0 but less than 0.75 to 1.0 |
1.00% |
2.00% |
0.50% |
|||
|
Greater than or equal to 0.75 to 1.0 but less than 0.90 to 1.0 |
1.25% |
2.25% |
0.50% |
|||
|
Greater than or equal to 0.90 to 1.0 |
1.50% |
2.50% |
0.50% |
The credit agreement contains restrictive covenants that may limit the Company’s ability to, among other things, incur additional indebtedness, sell assets, make loans to others, make investments, enter into mergers, enter into hedging contracts, incur liens and engage in certain other transactions without the prior consent of its lenders. Except for limited exceptions, the credit agreement also restricts the Company’s ability to make any dividend payments or distributions on its common stock. These restrictions apply to all of the Company’s restricted subsidiaries (as defined in the credit agreement). As of December 31, 2015, there were no retained earnings free from restrictions. The amended credit agreement requires the Company, as of the last day of any quarter, to maintain the following ratios (as defined in the credit agreement): (i) a consolidated current assets to consolidated current liabilities ratio (which includes an add back of the available borrowing capacity under the credit agreement) of not less than 1.0 to 1.0, (ii) a total senior secured debt to the last four quarters’ EBITDAX ratio of less than 2.5 to 1.0 during the Interim Covenant Period (defined below), and thereafter a total debt to EBITDAX ratio of less than 4.0 to 1.0 and (iii) a ratio of the last four quarters’ EBITDAX to consolidated interest charges of not less than 2.25 to 1.0 during the Interim Covenant Period. Under the amended credit agreement, the “Interim Covenant Period” is defined as the period from June 30, 2015 until the earlier of (a) April 1, 2018 or (b) the commencement of an investment-grade debt rating period as described below. The Company was in compliance with its covenants under the credit agreement as of December 31, 2015.
Under the terms of the credit agreement, at any time during which Whiting has an investment-grade debt rating from Moody’s Investors Service, Inc. or Standard & Poor’s Ratings Group and Whiting has elected, at its discretion, to effect an investment-grade
85
rating period, (i) certain security requirements, including the borrowing base requirement, and restrictive covenants will cease to apply, (ii) certain other restrictive covenants will become less restrictive, (iii) an additional financial covenant will be imposed, and (iv) the interest rate margin applicable to all revolving borrowings as well as the commitment fee with respect to the revolving facility will be based upon the Company’s debt rating rather than the ratio of outstanding borrowings to the borrowing base.
The obligations of Whiting Oil and Gas under the credit agreement are secured by a first lien on substantially all of Whiting Oil and Gas’ and Whiting Resource Corporation’s properties included in the borrowing base for the credit agreement. The Company has guaranteed the obligations of Whiting Oil and Gas under the credit agreement and has pledged the stock of its subsidiaries as security for its guarantee.
Senior Notes and Senior Subordinated Notes—In September 2010, the Company issued at par $350 million of 6.5% Senior Subordinated Notes due October 2018 (the “2018 Senior Subordinated Notes”). The estimated fair value of these notes was $265 million and $345 million as of December 31, 2015 and 2014, respectively, based on quoted market prices for this debt security, and such fair value is therefore designated as Level 1 within the valuation hierarchy.
In September 2013, the Company issued at par $1.1 billion of 5% Senior Notes due March 2019 (the “2019 Senior Notes”) and $800 million of 5.75% Senior Notes due March 2021, and issued at 101% of par an additional $400 million of 5.75% Senior Notes due March 2021 (collectively, the “2021 Senior Notes”). The $4 million debt premium recorded in connection with the issuance of the 2021 Senior Notes is amortized to interest expense over the term of the notes using the effective interest method, with an effective interest rate of 5.5% per annum. The estimated fair value of the 2019 Senior Notes was $831 million and $1.0 billion as of December 31, 2015 and 2014, respectively. The estimated fair value of the 2021 Senior Notes was $870 million and $1.1 billion as of December 31, 2015 and 2014, respectively. These fair values are based on quoted market prices for these debt securities, and such fair values are therefore designated as Level 1 within the valuation hierarchy.
Issuance of Senior Notes. In March 2015, the Company issued at par $750 million of 6.25% Senior Notes due April 2023 (the “2023 Senior Notes” and together with the 2019 Senior Notes and 2021 Senior Notes, the “Whiting Senior Notes”). The Company used the net proceeds from this issuance to repay a portion of the debt outstanding under its credit agreement. The estimated fair value of the 2023 Senior Notes was $544 million as of December 31, 2015. The fair value is based on quoted market prices for this debt security, and such fair value is therefore designated as Level 1 within the valuation hierarchy.
Redemption of Senior Subordinated Notes. In October 2013, the Company paid $254 million to redeem its entire $250 million aggregate principal amount of the 7% Senior Subordinated Notes due February 2014 (the “2014 Senior Subordinated Notes”) at a redemption price of 101.595%. Concurrent with this redemption, the Company paid all accrued and unpaid interest on the 2014 Senior Subordinated Notes up to but not including the redemption date. The Company financed the redemption of these notes with proceeds from the issuance of the Whiting Senior Notes, as discussed above. As a result of the redemption, Whiting recognized a $4 million loss on early extinguishment of debt, which primarily consisted of a cash charge of $4 million related to the redemption premium on the 2014 Senior Subordinated Notes.
Kodiak Senior Notes. In conjunction with the Kodiak Acquisition, Whiting US Holding Company, a wholly-owned subsidiary of the Company, became a co-issuer of Kodiak’s $800 million of 8.125% Senior Notes due December 2019 (the “2019 Kodiak Notes”), $350 million of 5.5% Senior Notes due January 2021 (the “2021 Kodiak Notes”), and $400 million of 5.5% Senior Notes due February 2022 (the “2022 Kodiak Notes” and together with the 2019 Kodiak Notes and the 2021 Kodiak Notes, the “Kodiak Notes”). The Kodiak Notes were recorded at their fair values of $824 million, $351 million and $401 million, respectively, on December 8, 2014, the closing date of the acquisition.
Upon closing of the Kodiak Acquisition, the indentures under which the Kodiak Notes were issued (the “Kodiak Indentures”) were amended to (i) modify certain covenants and restrictions, (ii) provide for unconditional and irrevocable guarantees by Whiting Petroleum Corporation and Whiting Oil and Gas of the prompt payment, when due, of any amounts owed under the Kodiak Notes and the Kodiak Indentures, and (iii) allow Whiting US Holding Company to become a co-issuer of the Kodiak Notes. Also in conjunction with the Kodiak Acquisition, in December 2014, each of the indentures governing the Company’s 2019 Senior Notes, 2021 Senior Notes and 2018 Senior Subordinated Notes were amended to include Whiting US Holding Company, Kodiak and Whiting Resources Corporation as guarantors. Shortly after closing, the Kodiak Notes were deregistered in accordance with the Securities Exchange Act of 1934, and accordingly, the Company is exempt from the reporting requirements under Rule 3-10 of Regulation S-X of the SEC with respect to the Kodiak Notes.
Repurchase of Kodiak Notes. On January 7, 2015, as required under the Kodiak Indentures upon a change in control of Kodiak, Whiting offered to repurchase at 101% of par all $1,550 million principal amount of Kodiak Notes then outstanding. On March 6, 2015, Whiting paid $760 million to repurchase $2 million aggregate principal amount of the 2019 Kodiak Notes, $346 million aggregate principal amount of the 2021 Kodiak Notes and $399 million aggregate principal amount of the 2022 Kodiak Notes, which payment consisted of the 101% redemption price and all accrued and unpaid interest on such notes. On May 1, 2015, Whiting paid $5 million to repurchase the remaining $4 million aggregate principal amount of the 2021 Kodiak Notes and $1 million aggregate
86
principal amount of the 2022 Kodiak Notes, which payment consisted of the 101% redemption price and all accrued and unpaid interest on such notes. The Company financed the repurchases with borrowings under its revolving credit facility, which borrowings were subsequently repaid with proceeds from the equity offerings discussed within the “Shareholders’ Equity and Noncontrolling Interest” footnote and the debt offerings discussed within this footnote, and with cash on hand. On December 24, 2015, Whiting paid $834 million to repurchase the remaining $798 million aggregate principal amount of the 2019 Kodiak Notes, which payment consisted of the 104.063% redemption price and all accrued and unpaid interest on such notes. The Company financed the December note repurchase with borrowings under its credit agreement. As a result of the repurchases, Whiting recognized an $18 million loss on early extinguishment of debt, which consisted of a $40 million cash charge related to the redemption premium on the Kodiak Notes, partially offset by a $22 million non-cash credit related to the acceleration of unamortized debt premiums on such notes.
The estimated fair value of the 2019, 2021 and 2022 Kodiak Notes at December 31, 2014 was $812 million, $351 million and $401 million, respectively, based on quoted market prices for these debt securities, and such fair value was therefore designated as Level 1 within the valuation hierarchy.
Convertible Senior Notes—In March 2015, the Company issued at par $1,250 million of 1.25% Convertible Senior Notes due April 2020 (the “Convertible Senior Notes”) for net proceeds of $1.2 billion, net of initial purchasers’ fees of $25 million. The Company used the net proceeds from this issuance to repay a portion of the debt outstanding under its credit agreement. The notes will mature on April 1, 2020 unless earlier converted in accordance with their terms.
The Company has the option to settle conversions of these notes with cash, shares of common stock or a combination of cash and common stock at its election. The Company’s intent is to settle the principal amount of the Convertible Senior Notes in cash upon conversion. Prior to January 1, 2020, the Convertible Senior Notes will be convertible only under the following circumstances: (i) during any calendar quarter commencing after the calendar quarter ending on June 30, 2015 (and only during such calendar quarter), if the last reported sale price of the Company’s common stock for at least 20 trading days (whether or not consecutive) during the period of 30 consecutive trading days ending on the last trading day of the immediately preceding calendar quarter is greater than or equal to 130% of the conversion price on each applicable trading day; (ii) during the five business day period after any five consecutive trading day period (the “measurement period”) in which the trading price per $1,000 principal amount of the Convertible Senior Notes for each trading day of the measurement period is less than 98% of the product of the last reported sale price of the Company’s common stock and the conversion rate on each such trading day; or (iii) upon the occurrence of specified corporate events. On or after January 1, 2020, the Convertible Senior Notes will be convertible at any time until the second scheduled trading day immediately preceding the April 1, 2020 maturity date of the notes. The notes will be convertible at an initial conversion rate of 25.6410 shares of Whiting’s common stock per $1,000 principal amount of the notes, which is equivalent to an initial conversion price of approximately $39.00. The conversion rate will be subject to adjustment in some events. In addition, following certain corporate events that occur prior to the maturity date, the Company will increase, in certain circumstances, the conversion rate for a holder who elects to convert its Convertible Senior Notes in connection with such corporate event. As of December 31, 2015, none of the contingent conditions allowing holders of the Convertible Senior Notes to convert these notes had been met.
Upon issuance, the Company separately accounted for the liability and equity components of the Convertible Senior Notes. The liability component was recorded at the estimated fair value of a similar debt instrument without the conversion feature. The difference between the principal amount of the Convertible Senior Notes and the estimated fair value of the liability component was recorded as a debt discount and will be amortized to interest expense over the term of the notes using the effective interest method, with an effective interest rate of 5.6% per annum. The fair value of the Convertible Senior Notes as of the issuance date was estimated at $1.0 billion, resulting in a debt discount at inception of $238 million. The equity component, representing the value of the conversion option, was computed by deducting the fair value of the liability component from the initial proceeds of the Convertible Senior Notes issuance. This equity component was recorded, net of deferred taxes and issuance costs, in additional paid-in capital within shareholders’ equity, and will not be remeasured as long as it continues to meet the conditions for equity classification.
Transaction costs related to the Convertible Senior Notes issuance were allocated to the liability and equity components based on their relative fair values. Issuance costs attributable to the liability component were recorded as a reduction to the carrying value of long-term debt on the consolidated balance sheet and are being amortized to expense over the term of the notes using the effective interest method. Issuance costs attributable to the equity component were recorded as a charge to additional paid-in capital within shareholders’ equity.
The Convertible Senior Notes consist of the following at December 31, 2015 (in thousands):
|
Liability component: |
|||
|
Principal |
$ |
1,250,000 | |
|
Less: note discount |
(205,572) | ||
|
Net carrying value |
$ |
1,044,428 | |
|
Equity component (1) |
$ |
237,500 |
87
|
(1) |
Recorded in additional paid-in capital, net of $5 million of issuance costs and $88 million of deferred taxes. |
The estimated fair value of the Convertible Senior Notes was $850 million as of December 31, 2015. The fair value is based on quoted market prices for this debt security, and such fair value is therefore designated as Level 1 within the valuation hierarchy.
Interest expense recognized on the Convertible Senior Notes related to the stated interest rate and amortization of the debt discount totaled $44 million for the year ended December 31, 2015.
The Whiting Senior Notes and the Convertible Senior Notes are unsecured obligations of Whiting Petroleum Corporation and these unsecured obligations are subordinated to all of the Company’s secured indebtedness, which consists of Whiting Oil and Gas’ credit agreement. The 2018 Senior Subordinated Notes are also unsecured obligations of Whiting Petroleum Corporation and are subordinated to all of the Company’s senior debt, which currently consists of the Whiting Senior Notes, the Convertible Senior Notes and borrowings under Whiting Oil and Gas’ credit agreement.
The Company’s obligations under the 2018 Senior Subordinated Notes, the Whiting Senior Notes and the Convertible Senior Notes are guaranteed by the Company’s wholly-owned subsidiaries, Whiting Oil and Gas, Whiting US Holding Company, Whiting Canadian Holding Company ULC and Whiting Resources Corporation (the “Guarantors”). These guarantees are full and unconditional and joint and several among the Guarantors. Any subsidiaries other than these Guarantors are minor subsidiaries as defined by Rule 3-10(h)(6) of Regulation S‑X of the SEC. Whiting Petroleum Corporation has no assets or operations independent of this debt and its investments in its consolidated subsidiaries.
5. ASSET RETIREMENT OBLIGATIONS
The Company’s asset retirement obligations represent the present value of estimated future costs associated with the plugging and abandonment of oil and gas wells, removal of equipment and facilities from leased acreage, and land restoration (including removal of certain onshore and offshore facilities in California) in accordance with applicable local, state and federal laws. The Company follows FASB ASC Topic 410, Asset Retirement and Environmental Obligations, to determine its asset retirement obligation amounts by calculating the present value of the estimated future cash outflows associated with its plug and abandonment obligations. The current portions at December 31, 2015 and 2014 were $6 million and $12 million, respectively, and have been included in accrued liabilities and other. Revisions to the liability typically occur due to changes in estimated abandonment costs or well economic lives, or if federal or state regulators enact new requirements regarding the abandonment of wells. The following table provides a reconciliation of the Company’s asset retirement obligations for the years ended December 31, 2015 and 2014 (in thousands):
|
December 31, |
||||||
|
2015 |
2014 |
|||||
|
Asset retirement obligation at January 1 |
$ |
179,931 |
$ |
126,148 | ||
|
Additional liability incurred |
9,208 | 29,186 | ||||
|
Revisions to estimated cash flows (1) |
29,307 | 25,909 | ||||
|
Accretion expense |
20,274 | 13,548 | ||||
|
Obligations on sold properties |
(69,601) | (7,237) | ||||
|
Liabilities settled |
(7,211) | (7,623) | ||||
|
Asset retirement obligation at December 31 |
$ |
161,908 |
$ |
179,931 | ||
|
(1) |
Revisions in estimated cash flows during the years ended December 31, 2015 and 2014 are primarily attributable to increased estimates of future costs for oilfield goods and services required to plug and abandon wells in certain fields in the Rocky Mountains and Permian Basin regions. |
6. DERIVATIVE FINANCIAL INSTRUMENTS
The Company is exposed to certain risks relating to its ongoing business operations, and Whiting uses derivative instruments to manage its commodity price risk. Whiting follows FASB ASC Topic 815, Derivatives and Hedging, to account for its derivative financial instruments.
Commodity Derivative Contracts—Historically, prices received for crude oil and natural gas production have been volatile because of supply and demand factors, worldwide political factors, general economic conditions and seasonal weather patterns. Whiting enters into derivative contracts, such as costless collars, swaps and crude oil sales and delivery contracts, to achieve a more predictable cash flow by reducing its exposure to commodity price volatility. Commodity derivative contracts are thereby used to ensure adequate cash flow to fund the Company’s capital programs and to manage returns on drilling programs and acquisitions. The Company does not enter into derivative contracts for speculative or trading purposes.
88
Crude Oil Costless Collars. Costless collars are designed to establish floor and ceiling prices on anticipated future oil or gas production. While the use of these derivative instruments limits the downside risk of adverse price movements, they may also limit future revenues from favorable price movements.
The table below details the Company’s costless collar derivatives entered into to hedge forecasted crude oil production revenues as of January 1, 2016.
|
Whiting Petroleum Corporation |
||||||
|
Derivative |
Contracted Crude |
Weighted Average NYMEX Price |
||||
|
Instrument |
Period |
Oil Volumes (Bbl) |
Collar Ranges for Crude Oil (per Bbl) |
|||
|
Three-way collars (1) |
Jan - Dec 2016 |
16,800,000 |
$43.75 - $53.75 - $74.40 |
|||
|
Collars |
Jan - Dec 2016 |
3,000,000 |
$51.00 - $63.48 |
|||
|
Jan - Dec 2017 |
3,000,000 |
$53.00 - $70.44 |
||||
|
Total |
22,800,000 | |||||
_____________________
|
(1) |
A three-way collar is a combination of options: a sold call, a purchased put and a sold put. The sold call establishes a maximum price (ceiling) Whiting will receive for the volumes under contract. The purchased put establishes a minimum price (floor), unless the market price falls below the sold put (sub-floor), at which point the minimum price would be NYMEX plus the difference between the purchased put and the sold put strike price. |
In March 2013, Whiting entered into certain crude oil swap contracts in order to achieve more predictable cash flows and manage returns on certain oil and gas properties that the Company was considering for monetization. Accordingly, the acquisition of these swap contracts and cash receipts from settlements of these swap positions have been reflected as an investing activity in the statement of cash flows. On July 15, 2013, upon closing of the sale of the Postle Properties discussed in the “Acquisitions and Divestitures” footnote, these crude oil swaps were novated to the buyer. Cash settlements that do not relate to investing derivatives or that do not have a significant financing element are reflected as operating activities in the statement of cash flows.
Crude Oil Sales and Delivery Contract. The Company has a long-term crude oil sales and delivery contract for oil volumes produced from its Redtail field in Colorado. Under the terms of the agreement, Whiting has committed to deliver certain fixed volumes of crude oil through 2020. The Company determined that it was not probable that future oil production from its Redtail field would be sufficient to meet the minimum volume requirement specified in this contract, and accordingly, that the Company would not settle this contract through physical delivery of crude oil volumes. As a result, Whiting determined that this contract would not qualify for the “normal purchase normal sale” exclusion and has therefore reflected the contract at fair value in the consolidated financial statements. As of December 31, 2015, the estimated fair value of this derivative contract was a liability of $4 million.
Embedded Commodity Derivative Contract—In May 2011, Whiting entered into a long-term contract to purchase CO2 for use in its EOR project that is being carried out at its North Ward Estes field in Texas. This contract contained a price adjustment clause that was linked to changes in NYMEX crude oil prices. The Company had determined that the portion of this contract linked to NYMEX oil prices was not clearly and closely related to the host contract, and the Company therefore bifurcated this embedded pricing feature from its host contract and reflected it at fair value in the consolidated financial statements. This contract has been terminated, however, and the fair value of this embedded derivative is therefore zero.
Derivative Instrument Reporting—All derivative instruments are recorded in the consolidated financial statements at fair value, other than derivative instruments that meet the “normal purchase normal sale” exclusion. The following tables summarize the effects of commodity derivative instruments on the consolidated statements of operations for the years ended December 31, 2015, 2014 and 2013 (in thousands):
|
Loss Reclassified from AOCI into |
|||||||||||
|
Income (Effective Portion) |
|||||||||||
|
ASC 815 Cash Flow |
Statement of Operations |
Year Ended December 31, |
|||||||||
|
Hedging Relationships (1) |
Classification |
2015 |
2014 |
2013 |
|||||||
|
Commodity contracts |
Loss on hedging activities |
$ |
- |
$ |
- |
$ |
(1,958) | ||||
____________________
|
(1) |
Effective April 1, 2009, the Company de-designated all of its commodity derivative contracts that had been previously designated as cash flow hedges and elected to discontinue hedge accounting prospectively. As a result, such mark-to-market values at March 31, 2009 were frozen in AOCI as of the de-designation date and were reclassified into earnings as the original hedged transactions affected income. As of December 31, 2013, all amounts previously in AOCI had been reclassified into earnings. |
89
|
(Gain) Loss Recognized in Income |
|||||||||||
|
Not Designated as |
Statement of Operations |
Year Ended December 31, |
|||||||||
|
ASC 815 Hedges |
Classification |
2015 |
2014 |
2013 |
|||||||
|
Commodity contracts |
Commodity derivative (gain) loss, net |
$ |
(217,972) |
$ |
(136,995) |
$ |
20,503 | ||||
|
Embedded commodity contracts |
Commodity derivative (gain) loss, net |
- |
36,416 | (12,701) | |||||||
|
Total |
$ |
(217,972) |
$ |
(100,579) |
$ |
7,802 | |||||
Offsetting of Derivative Assets and Liabilities. The Company typically has numerous hedge positions with each individual financial derivative counterparty that span a several-month time period and that typically result in both fair value asset and liability positions held with that counterparty. These positions are all offset to a single fair value asset or liability amount at the end of each reporting period. The Company nets its financial derivative instrument fair value amounts executed with the same counterparty pursuant to ISDA master agreements, which provide for net settlement over the term of the contract and in the event of default or termination of the contract. The following tables summarize the location and fair value amounts of all derivative instruments in the consolidated balance sheets, as well as the gross recognized derivative assets, liabilities and amounts offset in the consolidated balance sheets (in thousands):
|
December 31, 2015 (1) |
|||||||||||
|
Net |
|||||||||||
|
Gross |
Recognized |
||||||||||
|
Recognized |
Gross |
Fair Value |
|||||||||
|
Not Designated as |
Assets/ |
Amounts |
Assets/ |
||||||||
|
ASC 815 Hedges |
Balance Sheet Classification |
Liabilities |
Offset |
Liabilities |
|||||||
|
Derivative assets: |
|||||||||||
|
Commodity contracts - current |
Derivative assets |
$ |
258,778 |
$ |
(100,049) |
$ |
158,729 | ||||
|
Commodity contracts - non-current |
Other long-term assets |
31,415 | (3,465) | 27,950 | |||||||
|
Total derivative assets |
$ |
290,193 |
$ |
(103,514) |
$ |
186,679 | |||||
|
Derivative liabilities: |
|||||||||||
|
Commodity contracts - current |
Accrued liabilities and other |
$ |
101,214 |
$ |
(100,049) |
$ |
1,165 | ||||
|
Commodity contracts - non-current |
Other long-term liabilities |
6,327 | (3,465) | 2,862 | |||||||
|
Total derivative liabilities |
$ |
107,541 |
$ |
(103,514) |
$ |
4,027 | |||||
|
December 31, 2014 (1) |
|||||||||||
|
Net |
|||||||||||
|
Gross |
Recognized |
||||||||||
|
Recognized |
Gross |
Fair Value |
|||||||||
|
Not Designated as |
Assets/ |
Amounts |
Assets/ |
||||||||
|
ASC 815 Hedges |
Balance Sheet Classification |
Liabilities |
Offset |
Liabilities |
|||||||
|
Derivative assets: |
|||||||||||
|
Commodity contracts - current |
Derivative assets |
$ |
154,329 |
$ |
(18,752) |
$ |
135,577 | ||||
|
Commodity contracts - non-current |
Other long-term assets |
45,459 |
- |
45,459 | |||||||
|
Total derivative assets |
$ |
199,788 |
$ |
(18,752) |
$ |
181,036 | |||||
|
Derivative liabilities: |
|||||||||||
|
Commodity contracts - current |
Accrued liabilities and other |
$ |
18,752 |
$ |
(18,752) |
$ |
- |
||||
|
Total derivative liabilities |
$ |
18,752 |
$ |
(18,752) |
$ |
- |
|||||
_____________________
|
(1) |
Because counterparties to the Company’s financial derivative contracts are lenders under Whiting Oil and Gas’ credit agreement, which eliminates its need to post or receive collateral associated with its derivative positions, columns for cash collateral pledged or received have not been presented in the tables above. |
Contingent Features in Financial Derivative Instruments. None of the Company’s derivative instruments contain credit-risk-related contingent features. Counterparties to the Company’s financial derivative contracts are high credit-quality financial institutions that are lenders under Whiting’s credit agreement. The Company uses only credit agreement participants to hedge with, since these institutions are secured equally with the holders of Whiting’s bank debt, which eliminates the potential need to post collateral when Whiting is in a derivative liability position. As a result, the Company is not required to post letters of credit or corporate guarantees for its derivative counterparties in order to secure contract performance obligations.
90
7. FAIR VALUE MEASUREMENTS
Cash and cash equivalents, accounts receivable and accounts payable are carried at cost, which approximates their fair value because of the short-term maturity of these instruments. The Company’s credit agreement has a recorded value that approximates its fair value since its variable interest rate is tied to current market rates. The Company’s senior notes, convertible senior notes and senior subordinated notes are recorded at cost, and the fair values of these instruments are included in the “Long-Term Debt” footnote. The Company’s derivative financial instruments are recorded at fair value and include a measure of the Company’s own nonperformance risk or that of its counterparties, as appropriate.
The Company follows FASB ASC Topic 820, Fair Value Measurement and Disclosure, which establishes a three-level valuation hierarchy for disclosure of fair value measurements. The valuation hierarchy categorizes assets and liabilities measured at fair value into one of three different levels depending on the observability of the inputs employed in the measurement. The three levels are defined as follows:
|
· |
Level 1: Quoted Prices in Active Markets for Identical Assets – inputs to the valuation methodology are quoted prices (unadjusted) for identical assets or liabilities in active markets. |
|
· |
Level 2: Significant Other Observable Inputs – inputs to the valuation methodology include quoted prices for similar assets and liabilities in active markets, and inputs that are observable for the asset or liability, either directly or indirectly, for substantially the full term of the financial instrument. |
|
· |
Level 3: Significant Unobservable Inputs – inputs to the valuation methodology are unobservable and significant to the fair value measurement. |
A financial instrument’s categorization within the valuation hierarchy is based upon the lowest level of input that is significant to the fair value measurement. The Company’s assessment of the significance of a particular input to the fair value measurement in its entirety requires judgment and considers factors specific to the asset or liability. The Company reflects transfers between the three levels at the beginning of the reporting period in which the availability of observable inputs no longer justifies classification in the original level.
The following tables present information about the Company’s financial assets and liabilities measured at fair value on a recurring basis as of December 31, 2015 and 2014, and indicate the fair value hierarchy of the valuation techniques utilized by the Company to determine such fair values (in thousands):
|
Total Fair Value |
||||||||||||
|
Level 1 |
Level 2 |
Level 3 |
December 31, 2015 |
|||||||||
|
Financial Assets |
||||||||||||
|
Commodity derivatives – current |
$ |
- |
$ |
158,729 |
$ |
- |
$ |
158,729 | ||||
|
Commodity derivatives – non-current |
- |
27,950 |
- |
27,950 | ||||||||
|
Total financial assets |
$ |
- |
$ |
186,679 |
$ |
- |
$ |
186,679 | ||||
|
Financial Liabilities |
||||||||||||
|
Commodity derivatives – current |
$ |
- |
$ |
- |
$ |
1,165 |
$ |
1,165 | ||||
|
Commodity derivatives – non-current |
- |
- |
2,862 | 2,862 | ||||||||
|
Total financial liabilities |
$ |
- |
$ |
- |
$ |
4,027 |
$ |
4,027 | ||||
|
Total Fair Value |
||||||||||||
|
Level 1 |
Level 2 |
Level 3 |
December 31, 2014 |
|||||||||
|
Financial Assets |
||||||||||||
|
Commodity derivatives – current |
$ |
- |
$ |
127,506 |
$ |
8,071 |
$ |
135,577 | ||||
|
Commodity derivatives – non-current |
- |
- |
45,459 | 45,459 | ||||||||
|
Total financial assets |
$ |
- |
$ |
127,506 |
$ |
53,530 |
$ |
181,036 | ||||
The following methods and assumptions were used to estimate the fair values of the Company’s financial assets and liabilities that are measured on a recurring basis:
Commodity Derivatives. Commodity derivative instruments consist mainly of costless collars and swap contracts for crude oil. The Company’s costless collars and swaps are valued based on an income approach. Both the option and swap models consider various assumptions, such as quoted forward prices for commodities, time value and volatility factors. These assumptions are observable in the marketplace throughout the full term of the contract, can be derived from observable data or are supported by observable levels at which transactions are executed in the marketplace, and are therefore designated as Level 2 within the valuation hierarchy. The discount rates used in the fair values of these instruments include a measure of either the Company’s or the counterparty’s
91
nonperformance risk, as appropriate. The Company utilizes its counterparties’ valuations to assess the reasonableness of its own valuations.
In addition, the Company has a long-term crude oil sales and delivery contract, whereby it has committed to deliver certain fixed volumes of crude oil through 2020. Whiting has determined that the contract did not meet the “normal purchase normal sale” exclusion, and has therefore reflected this contract at fair value in its consolidated financial statements. This commodity derivative was valued based on an income approach, which considers various assumptions, including quoted forward prices for commodities, market differentials for crude oil, U.S. Treasury rates and either the Company’s or the counterparty’s nonperformance risk, as appropriate.
The assumptions used in the valuation of the crude oil sales and delivery contract include certain market differential metrics that were unobservable during the term of the contract. Such unobservable inputs were significant to the contract valuation methodology, and the contract’s fair value was therefore designated as Level 3 within the valuation hierarchy.
Level 3 Fair Value Measurements. A third-party valuation specialist is utilized to determine the fair value of the commodity derivative instruments designated as Level 3. The Company reviews these valuations (including the related model inputs and assumptions) and analyzes changes in fair value measurements between periods. The Company corroborates such inputs, calculations and fair value changes using various methodologies, and reviews unobservable inputs for reasonableness utilizing relevant information from other published sources.
The following table presents a reconciliation of changes in the fair value of financial assets or liabilities designated as Level 3 in the valuation hierarchy for the years ended December 31, 2015 and 2014 (in thousands):
|
Year Ended |
||||||
|
December 31, |
||||||
|
2015 |
2014 |
|||||
|
Fair value asset, beginning of period |
$ |
53,530 |
$ |
36,416 | ||
|
Unrealized gains (losses) on commodity derivative contracts included in earnings (1) |
|
|
(24,018) |
|
|
17,114 |
|
Commodity derivative contract settlements |
(33,539) |
- |
||||
|
Transfers into (out of) Level 3 |
- |
- |
||||
|
Fair value asset (liability), end of period |
$ |
(4,027) |
$ |
53,530 | ||
_____________________
|
(1) |
Included in commodity derivative (gain) loss, net in the consolidated statements of operations. |
Quantitative Information About Level 3 Fair Value Measurements. The significant unobservable inputs used in the fair value measurement of the Company’s commodity derivative contract designated as Level 3 are as follows:
|
Fair Value at |
||||||||
|
December 31, 2015 |
Valuation |
Unobservable |
Amount |
|||||
|
(in thousands) |
Technique |
Input |
(per Bbl) |
|||||
|
Commodity derivative contract |
|
($4,027) |
|
Income approach |
|
Market differential for crude oil |
|
$5.25 |
Sensitivity to Changes In Significant Unobservable Inputs. As presented above, the significant unobservable inputs used in the fair value measurement of Whiting’s commodity derivative contract are the market differentials for crude oil over the term of the contract. Significant increases or decreases in these unobservable inputs in isolation would result in a significantly higher or lower, respectively, fair value liability measurement.
Non-recurring Fair Value Measurements. The Company applies the provisions of the fair value measurement standard on a non-recurring basis to its non-financial assets and liabilities, including proved property and goodwill. These assets and liabilities are not measured at fair value on an ongoing basis but are subject to fair value adjustments only in certain circumstances. The following tables present information about the Company’s non-financial assets measured at fair value on a non-recurring basis during the years ended December 31, 2015 and 2014, and indicates the fair value hierarchy of the valuation techniques utilized by the Company to determine such fair values (in thousands):
92
|
Loss (Before |
||||||||||||||||||||
|
Net Carrying |
Tax) Year |
|||||||||||||||||||
|
Value as of |
Ended |
|||||||||||||||||||
|
September 30, |
Fair Value Measurements Using |
December 31, |
||||||||||||||||||
|
2015 |
Level 1 |
Level 2 |
Level 3 |
2015 |
||||||||||||||||
|
Proved property (1) |
$ |
531,775 |
$ |
- |
$ |
- |
$ |
531,775 |
$ |
1,602,226 | ||||||||||
|
Goodwill (2) |
- |
- |
- |
- |
873,772 | |||||||||||||||
|
Total non-recurring assets at fair value |
$ |
531,775 |
$ |
- |
$ |
- |
$ |
531,775 |
$ |
2,475,998 | ||||||||||
_____________________
|
(1) |
During the third quarter of 2015, proved oil and gas properties with a previous carrying amount of $2.1 billion were written down to their fair value as of September 30, 2015 of $531 million, resulting in a non-cash impairment charge of $1.5 billion which was recorded within exploration and impairment expense. The impaired properties consisted of the Company’s North Ward Estes field in Texas and other non-core proved oil and gas properties primarily in Texas, Wyoming, North Dakota and Colorado that are not currently being developed due to depressed oil and gas prices. Also during the third quarter of 2015, proved CO2 properties at the Bravo Dome field in New Mexico and the McElmo Dome field in Colorado with a previous carrying amount of $63 million were written down to their fair value as of September 30, 2015 of $1 million, resulting in a non-cash impairment charge of $62 million which was also recorded within exploration and impairment expense. |
|
(2) |
During 2015, goodwill related to the Kodiak Acquisition with a carrying amount of $874 million was written down to its fair value of zero, resulting in a non-cash impairment charge of $874 million which was recorded as a separate line in the consolidated statements of operations. |
|
Loss (Before |
||||||||||||||||||||
|
Net Carrying |
Tax) Year |
|||||||||||||||||||
|
Value as of |
Ended |
|||||||||||||||||||
|
December 31, |
Fair Value Measurements Using |
December 31, |
||||||||||||||||||
|
2014 |
Level 1 |
Level 2 |
Level 3 |
2014 |
||||||||||||||||
|
Proved property (1) |
$ |
179,155 |
$ |
- |
$ |
- |
$ |
179,155 |
$ |
629,450 | ||||||||||
_____________________
|
(1) |
During the fourth quarter of 2014, proved oil and gas properties with a previous carrying amount of $763 million were written down to their fair value as of December 31, 2014 of $176 million, resulting in a non-cash impairment charge of $587 million which was recorded within exploration and impairment expense. The impaired properties consisted of non-core proved oil and gas properties primarily in Colorado, Louisiana, North Dakota and Utah that were not being developed due to depressed oil and gas prices as of December 31, 2014. Also during the fourth quarter of 2014, proved CO2 properties at the Bravo Dome field in New Mexico with a previous carrying amount of $45 million were written down to their fair value as of December 31, 2014 of $3 million, resulting in a non-cash impairment charge of $42 million which was also recorded within exploration and impairment expense. |
The following methods and assumptions were used to estimate the fair values of the non-financial assets in the tables above:
Proved Property Impairments. The Company tests proved property for impairment whenever events or changes in circumstances indicate that the fair value of these assets may be reduced below their carrying value. As a result of the significant decrease in the forward price curves for crude oil and natural gas during the third quarter of 2015 and during the fourth quarter of 2014, and the associated decline in oil and gas reserves over those same periods, the Company performed proved property impairment tests as of September 30, 2015 and December 31, 2014, respectively. The fair value was ascribed using income approach analyses based on the net discounted future cash flows from the producing property and a market approach analysis, which approaches have been probability-weighted. The discounted cash flows are based on management’s expectations for the future. Unobservable inputs include estimates of future oil and gas or CO2 production, as the case may be, from the Company’s reserve reports, commodity prices based on sales contract terms or forward price curves (adjusted for basis differentials), operating and development costs, and a discount rate based on the Company’s weighted-average cost of capital (all of which are designated as Level 3 inputs within the fair value hierarchy). The impairment tests indicated that a proved property impairment had occurred, and the Company therefore recorded a non-cash impairment charge to reduce the carrying value of the impaired property to its fair value at the measurement date.
Goodwill Impairment. The Company tests goodwill for impairment annually in the second quarter or whenever events or changes in circumstances indicate that the fair value of its reporting unit may have been reduced below its carrying value. The Company performed its annual goodwill impairment test as of June 30, 2015, and determined that no impairment had occurred. However, as a result of a sustained decrease in the price of Whiting’s common stock during the third quarter of 2015 caused by a significant decline in crude oil and natural gas prices over that same period, the Company performed another goodwill impairment test as of September
93
30, 2015. The fair value of the Company’s reporting unit was ascribed using an income approach analysis based on the Company’s net discounted future cash flows and a market approach analysis. The discounted cash flows are based on management’s expectations for the future. Unobservable inputs include estimates of future oil and gas production from the Company’s reserve reports, commodity prices based on sales contract terms or forward price curves (adjusted for basis differentials), operating and development costs, and a discount rate based on the Company’s weighted-average cost of capital (all of which are designated as Level 3 inputs within the fair value hierarchy). The impairment test performed by the Company indicated that the fair value of its reporting unit was less than its carrying amount, and further that there was no remaining implied fair value attributable to goodwill. Based on these results, the Company recorded a non-cash impairment charge to reduce the carrying value of goodwill to zero.
8. DEFERRED COMPENSATION
Production Participation Plan—The Company had a Production Participation Plan (the “Plan”) in which all employees participated. On June 11, 2014, the Board of Directors of the Company terminated the Plan effective December 31, 2013. Prior to Plan termination, interests in oil and gas properties acquired, developed or sold during the year were allocated to the Plan on an annual basis as determined by the Compensation Committee of the Company’s Board of Directors. Once allocated, the interests (not legally conveyed) were fixed. Interest allocations prior to 1995 consisted of 2%‑3% overriding royalty interests. Interest allocations after 1995 were 1.75%‑5% of oil and gas sales less lease operating expenses and production taxes.
Employees vested in the Plan ratably at 20% per year over a five-year period. However, pursuant to the terms of the Plan, upon Plan termination all employees fully vested, and the Company was required to distribute to each Plan participant an amount, based upon the valuation method set forth in the Plan, in a lump sum payment twelve months after the date of termination. This distribution included the value of proved undeveloped oil and gas properties awarded upon Plan termination and was based on forecasted commodity prices for crude oil, NGLs and natural gas as of December 31, 2013. The fully vested amount due to Plan participants totaling $113 million was reflected as a current payable as of December 31, 2014, and was paid to Plan participants in 2015.
Accrued compensation expense under the Plan for the year ended December 31, 2014 primarily related to the change in liability for employee vestings and PUDs assigned upon Plan termination and amounted to $24 million charged to general and administrative expense and $2 million charged to exploration expense.
Prior to Plan termination, the Company recorded non-cash changes in the present value of estimated future payments under the Plan as a separate line item in the consolidated statements of operations.
401(k) Plan—The Company has a defined contribution retirement plan for all employees. The plan is funded by employee contributions and discretionary Company contributions. The Company’s contributions for 2015, 2014 and 2013 were $12 million, $9 million and $8 million, respectively. Employees vest in employer contributions at 20% per year of completed service.
9. SHAREHOLDERS’ EQUITY AND NONCONTROLLING INTEREST
6.25% Convertible Perpetual Preferred Stock—In June 2009, the Company completed a public offering of 6.25% convertible perpetual preferred stock (“preferred stock”), selling 3,450,000 shares at a price of $100.00 per share. As a result of voluntary conversions and the Company exercising its right to mandatorily convert shares of preferred stock effective June 27, 2013, all 172,129 remaining shares of preferred stock outstanding on March 31, 2013 were converted into 792,919 shares of common stock. As of December 31, 2015 and 2014, no shares of preferred stock remain issued or outstanding.
Each holder of the preferred stock was entitled to an annual dividend of $6.25 per share to be paid quarterly in cash, common stock or a combination thereof on March 15, June 15, September 15 and December 15, once such dividend had been declared by Whiting’s board of directors.
Common Stock Offering—In March 2015, the Company completed a public offering of its common stock, selling 35,000,000 shares of common stock at a price of $30.00 per share and providing net proceeds of approximately $1.0 billion after underwriter’s fees. In addition, the Company granted the underwriter a 30-day option to purchase up to an additional 5,250,000 shares of common stock. On April 1, 2015, the underwriter exercised its right to purchase an additional 2,000,000 shares of common stock, providing additional net proceeds of $61 million. The Company used the net proceeds from these offerings to repay a portion of the debt outstanding under its credit agreement, as well as for general corporate purposes.
Equity Incentive Plan—At the Company’s 2013 Annual Meeting held on May 7, 2013, shareholders approved the Whiting Petroleum Corporation 2013 Equity Incentive Plan (the “2013 Equity Plan”), which replaced the Whiting Petroleum Corporation 2003 Equity Incentive Plan (the “2003 Equity Plan”) and includes the authority to issue 5,300,000 shares of the Company’s common stock. Upon shareholder approval of the 2013 Equity Plan, the 2003 Equity Plan was terminated. The 2003 Equity Plan continues to govern awards that were outstanding as of the date of its termination, which remain in effect pursuant to their terms. Any shares netted or forfeited after May 7, 2013 under the 2003 Equity Plan and any shares forfeited under the 2013 Equity Plan will be available for future
94
issuance under the 2013 Equity Plan. However, shares netted for tax withholding under the 2013 Equity Plan will be cancelled and will not be available for future issuance. Under the 2013 Equity Plan, no employee or officer participant may be granted options for more than 600,000 shares of common stock, stock appreciation rights relating to more than 600,000 shares of common stock, or more than 300,000 shares of restricted stock during any calendar year. On December 8, 2014, the Company increased the number of shares issuable under the 2013 Equity Plan by 978,161 shares to accommodate for the conversion of Kodiak’s outstanding equity awards to Whiting equity awards upon closing of the Kodiak Acquisition. Any shares netted or forfeited under this increased availability will be cancelled and will not be available for future issuance under the 2013 Equity Plan. As of December 31, 2015, 4,108,863 shares of common stock remained available for grant under the 2013 Equity Plan.
For the years ended December 31, 2015, 2014 and 2013, total stock compensation expense recognized for restricted share awards and stock options was $28 million, $23 million and $22 million, respectively.
Equity Awards Assumed in Kodiak Acquisition. Upon closing of the Kodiak Acquisition, the Company assumed all of Kodiak’s outstanding equity awards, including restricted stock awards, restricted stock units and stock options. Kodiak’s outstanding equity awards held by employees were converted into Whiting’s equity awards using a conversion ratio of 0.177. The outstanding restricted stock awards and restricted stock units vested upon closing of the transaction, and the $10 million estimated fair value as of the closing date of the 257,601 shares of Whiting common stock issued to convert these awards was recorded as part of the purchase consideration.
The estimated fair value as of the closing date of the 673,235 Whiting options issued in exchange for Kodiak’s outstanding options was approximately $8 million, based on a Black-Scholes option-pricing model. Of this value, approximately $7 million was attributable to service rendered prior to the date of acquisition and was recorded as part of the purchase consideration, and the remaining $1 million will be expensed over the remaining service term of the replacement stock option awards. The unvested stock option awards will vest over a one to three-year service period from the grant date and are exercisable immediately upon vesting through the tenth anniversary of the grant date. The following table summarizes the assumptions used to estimate the fair value of stock options assumed in the Kodiak Acquisition:
|
2014 |
||
|
Risk-free interest rate |
0.08% - 1.90% |
|
|
Expected volatility |
40.3% - 49.7% |
|
|
Expected term |
2.0 yrs. - 6.1 yrs. |
|
|
Dividend yield |
- |
The weighted average fair value of these options, as determined by the Black-Scholes valuation model, was $12.20 per share as of the December 8, 2014 closing date of the Kodiak Acquisition.
Restricted Shares. The Company grants service-based restricted stock awards to executive officers and employees, which generally vest ratably over a three-year service period, and to directors, which generally vest over a one-year service period. In addition, the Company grants restricted stock awards to executive officers that are subject to market-based vesting criteria as well as a three-year service period. The Company uses historical data and projections to estimate expected employee behaviors related to restricted stock forfeitures. The expected forfeitures are then included as part of the grant date estimate of compensation cost. The Company recognizes compensation expense for all awards subject to market conditions regardless of whether it becomes probable that these conditions will be achieved or not, and compensation expense is not reversed if vesting does not actually occur.
In January 2015, 391,773 shares of restricted stock subject to certain market-based vesting criteria were granted to executive officers under the 2013 Equity Plan. These market-based awards cliff vest on the third anniversary of the grant date, and the number of shares that will vest at the end of that three-year performance period will be determined based on the rank of Whiting’s cumulative stockholder return compared to the stockholder return of a peer group of companies over the same three-year period. The number of shares earned could range from zero up to two times the number of shares initially granted.
In January 2014 and 2013, 750,681 shares and 751,872 shares, respectively, of restricted stock subject to certain market-based vesting criteria in addition to the standard three-year service condition were granted to executive officers under the 2013 Equity Plan and the 2003 Equity Plan, respectively. Vesting each year is subject to the condition that Whiting’s stock price increases by a greater percentage (or decreases by a lesser percentage) than the average percentage increase (or decrease, respectively) of the stock prices of a peer group of companies. The market-based conditions must be met in order for the stock awards to vest, and it is therefore possible that no shares could vest in one or more of the three-year vesting periods.
For service-based restricted stock awards, the grant date fair value is determined based on the closing bid price of the Company’s common stock on the grant date. For the awards subject to market conditions, the grant date fair value was estimated using a Monte Carlo valuation model. The Monte Carlo model is based on random projections of stock price paths and must be repeated numerous
95
times to achieve a probabilistic assessment. Expected volatility was calculated based on the historical volatility of Whiting’s common stock, and the risk-free interest rate is based on U.S. Treasury yield curve rates with maturities consistent with the three-year vesting period. The key assumptions used in valuing the market-based restricted shares were as follows:
|
2015 |
2014 |
2013 |
||||
|
Number of simulations |
2,500,000 |
65,000 |
65,000 |
|||
|
Expected volatility |
40.3% |
42.3% |
43.1% |
|||
|
Risk-free interest rate |
0.99% |
0.86% |
0.41% |
|||
|
Dividend yield |
- |
- |
- |
The grant date fair value of the market-based restricted stock as determined by the Monte Carlo valuation model was $33.25 per share, $26.59 per share and $23.01 per share in January 2015, 2014 and 2013, respectively.
The following table shows a summary of the Company’s nonvested restricted stock as of December 31, 2013, 2014 and 2015 as well as activity during the years then ended:
|
Number of Shares |
Weighted Average |
||||||
|
Service-Based |
Market-Based |
Grant Date |
|||||
|
Restricted Stock |
Restricted Stock |
Fair Value |
|||||
|
Nonvested awards, January 1, 2013 |
244,801 | 706,225 |
$ |
37.02 | |||
|
Granted |
188,920 | 751,872 | 27.59 | ||||
|
Vested |
(139,353) | (208,471) | 35.32 | ||||
|
Forfeited |
(15,263) | (84,421) | 30.95 | ||||
|
Nonvested awards, December 31, 2013 |
279,105 | 1,165,205 | 31.71 | ||||
|
Granted |
157,175 | 750,681 | 32.41 | ||||
|
Assumed in Kodiak Acquisition (1) |
304,926 |
- |
37.25 | ||||
|
Vested |
(442,584) | (371,855) | 34.05 | ||||
|
Forfeited |
(17,033) | (368,752) | 34.86 | ||||
|
Nonvested awards, December 31, 2014 |
281,589 | 1,175,279 | 31.16 | ||||
|
Granted |
824,412 | 391,773 | 31.68 | ||||
|
Vested |
(148,838) |
- |
53.26 | ||||
|
Forfeited |
(64,470) | (166,089) | 30.85 | ||||
|
Nonvested awards, December 31, 2015 |
892,693 | 1,400,963 |
$ |
30.03 | |||
_____________________
|
(1) |
Kodiak’s existing restricted stock units and restricted stock awards held by employees, which automatically converted into 257,601 restricted stock units and 47,325 restricted stock awards of Whiting and vested upon closing of the Kodiak Acquisition. |
As of December 31, 2015, there was $21 million of total unrecognized compensation cost related to unvested restricted stock granted under the stock incentive plans. That cost is expected to be recognized over a weighted average period of 1.8 years. For the years ended December 31, 2015, 2014 and 2013, the total fair value of restricted stock vested was $4 million, $31 million and $17 million, respectively.
Stock Options. Stock options may be granted to certain executive officers of the Company with exercise prices equal to the closing market price of the Company’s common stock on the grant date. There were no stock options granted under either the 2003 Equity Plan or the 2013 Equity Plan during 2015, 2014 or 2013, other than the 673,235 stock options assumed in connection with the Kodiak Acquisition. The Company’s stock options vest ratably over a three-year service period from the grant date and are exercisable immediately upon vesting through the tenth anniversary of the grant date.
96
The following table shows a summary of the Company’s stock options outstanding as of December 31, 2013, 2014 and 2015 as well as activity during the years then ended:
|
Weighted |
||||||||||
|
Average |
||||||||||
|
Weighted |
Aggregate |
Remaining |
||||||||
|
Average |
Intrinsic |
Contractual |
||||||||
|
Number of |
Exercise Price |
Value |
Term |
|||||||
|
Options |
per Share |
(in thousands) |
(in years) |
|||||||
|
Options outstanding at January 1, 2013 |
422,695 |
$ |
28.79 | |||||||
|
Granted |
- |
- |
||||||||
|
Exercised |
- |
- |
$ |
- |
||||||
|
Forfeited or expired |
(1,855) | 60.28 | ||||||||
|
Options outstanding at December 31, 2013 |
420,840 | 28.65 | ||||||||
|
Granted |
- |
- |
||||||||
|
Assumed in Kodiak Acquisition |
673,235 | 44.48 | ||||||||
|
Exercised |
(117,123) | 15.21 |
$ |
6,203 | ||||||
|
Forfeited or expired |
(8,559) | 50.51 | ||||||||
|
Options outstanding at December 31, 2014 |
968,393 | 41.09 | ||||||||
|
Granted |
- |
- |
||||||||
|
Exercised |
(150,952) | 20.75 |
$ |
2,007 | ||||||
|
Forfeited or expired |
(229,266) | 53.81 | ||||||||
|
Options outstanding at December 31, 2015 |
588,175 |
$ |
41.35 |
$ |
45 | 5.5 | ||||
|
Options vested and expected to vest at December 31, 2015 |
558,149 |
$ |
40.84 |
$ |
40 | 5.5 | ||||
|
Options exercisable at December 31, 2015 |
527,317 |
$ |
39.30 |
$ |
45 | 5.3 | ||||
There was $0.1 million of unrecognized compensation cost related to unvested stock option awards as of December 31, 2015.
Rights Agreement—In 2006, the Board of Directors of the Company declared a dividend of one preferred share purchase right (a “Right”) for each outstanding share of common stock of the Company payable to the stockholders of record as of March 2, 2006. As a result of the two-for-one split of the Company’s common stock effective February 22, 2011, one-half of a Right is now associated with each share of common stock. Each Right entitles the registered holder to purchase from the Company one one-hundredth of a share of Series A Junior Participating Preferred Stock, par value $0.001 per share (“Preferred Shares”), of the Company at a price of $180.00 per one one-hundredth of a Preferred Share, subject to adjustment. If any person becomes a 15% or more stockholder of the Company, then each Right (subject to certain limitations) will entitle its holder to purchase, at the Right’s then current exercise price, a number of shares of common stock of the Company or of the acquirer having a market value at the time of twice the Right’s per share exercise price. The Company’s Board of Directors may redeem the Rights for $0.001 per Right at any time prior to the time when the Rights become exercisable. The Rights expired on February 23, 2016.
Noncontrolling Interest—The Company’s noncontrolling interest represents an unrelated third party’s 25% ownership interest in Sustainable Water Resources, LLC. The table below summarizes the activity for the equity attributable to the noncontrolling interest (in thousands):
|
Year Ended |
||||||
|
December 31, |
||||||
|
2015 |
2014 |
|||||
|
Balance at January 1 |
$ |
8,070 |
$ |
8,132 | ||
|
Net loss |
(86) | (62) | ||||
|
Balance at December 31 |
$ |
7,984 |
$ |
8,070 | ||
97
10. INCOME TAXES
Income tax expense (benefit) consists of the following (in thousands):
|
Year Ended December 31, |
|||||||||
|
2015 |
2014 |
2013 |
|||||||
|
Current income tax expense (benefit): |
|||||||||
|
Federal |
$ |
- |
$ |
(2,758) |
$ |
7,060 | |||
|
State |
(357) | 5,383 | (6,074) | ||||||
|
Total current income tax expense (benefit) |
(357) | 2,625 | 986 | ||||||
|
Deferred income tax expense (benefit): |
|||||||||
|
Federal |
(736,520) | 65,522 | 196,787 | ||||||
|
State |
(37,350) | 11,023 | 8,095 | ||||||
|
Total deferred income tax expense (benefit) |
(773,870) | 76,545 | 204,882 | ||||||
|
Total |
$ |
(774,227) |
$ |
79,170 |
$ |
205,868 | |||
Income tax expense (benefit) differed from amounts that would result from applying the U.S. statutory income tax rate (35%) to income before income taxes as follows (in thousands):
|
Year Ended December 31, |
|||||||||
|
2015 |
2014 |
2013 |
|||||||
|
U.S. statutory income tax expense (benefit) |
$ |
(1,047,723) |
$ |
50,371 |
$ |
200,155 | |||
|
State income taxes, net of federal benefit |
(44,654) | 12,705 | 13,962 | ||||||
|
State income tax credits |
- |
- |
(10,525) | ||||||
|
Statutory depletion |
(327) | (618) | (796) | ||||||
|
Enacted changes in state tax laws |
7,350 | 3,700 | (1,416) | ||||||
|
Market-based equity awards |
2,690 | 2,805 |
- |
||||||
|
Permanent items |
5,071 | 3,504 | 2,122 | ||||||
|
Transaction costs |
- |
6,936 |
- |
||||||
|
Goodwill impairment |
305,820 |
- |
- |
||||||
|
Other |
(2,454) | (233) | 2,366 | ||||||
|
Total |
$ |
(774,227) |
$ |
79,170 |
$ |
205,868 | |||
98
The principal components of the Company’s deferred income tax assets and liabilities at December 31, 2015 and 2014 were as follows (in thousands):
|
Year Ended December 31, |
||||||
|
2015 |
2014 |
|||||
|
Deferred income tax assets: |
||||||
|
Net operating loss carryforward |
$ |
835,995 |
$ |
588,330 | ||
|
Production Participation Plan liability |
- |
26,942 | ||||
|
Asset retirement obligations |
18,896 | 13,791 | ||||
|
Underwriter fees |
6,060 | 14,065 | ||||
|
Restricted stock compensation |
17,675 | 15,527 | ||||
|
Premium on senior notes |
- |
7,979 | ||||
|
EOR credit carryforwards |
7,946 | 7,946 | ||||
|
Alternative minimum tax credit carryforwards |
15,694 | 15,694 | ||||
|
Transaction costs |
6,395 | 7,957 | ||||
|
Other |
11,110 | 9,493 | ||||
|
Total deferred income tax assets |
919,771 | 707,724 | ||||
|
Less valuation allowance |
(5,061) | (5,638) | ||||
|
Net deferred income tax assets |
914,710 | 702,086 | ||||
|
Deferred income tax liabilities: |
||||||
|
Oil and gas properties |
1,264,598 | 1,785,926 | ||||
|
Trust distributions |
101,665 | 129,437 | ||||
|
Discount on convertible senior notes |
76,475 |
- |
||||
|
Derivative instruments |
65,764 | 64,898 | ||||
|
Total deferred income tax liabilities |
1,508,502 | 1,980,261 | ||||
|
Total net deferred income tax liabilities |
$ |
593,792 |
$ |
1,278,175 | ||
As of December 31, 2015, the Company had federal net operating loss (“NOL”) carryforwards of $2.3 billion. Of this amount, $70 million in NOL carryforwards relate to tax deductions for stock compensation that exceed stock compensation costs recognized for financial statement purposes. The benefit of these excess tax deductions will not be recognized as an NOL in the Company’s financial statements until the related deductions reduce taxes payable and are thereby realized. In addition, the utilization of $72 million of NOL carryforwards incurred as a result of the Kodiak Acquisition are limited for the next year. The Company also has various state NOL carryforwards. The determination of the state NOL carryforwards is dependent upon apportionment percentages and state laws that can change from year to year and that can thereby impact the amount of such carryforwards. If unutilized, the federal NOL will expire between 2023 and 2035, and the state NOLs will expire between 2016 and 2035.
EOR credits are a credit against federal income taxes for certain costs related to extracting high-cost oil, utilizing certain prescribed enhanced tertiary recovery methods. As of December 31, 2015, the Company had recognized aggregate EOR credits of $8 million that are available to offset regular federal income taxes in the future. These credits can be carried forward and will expire between 2023 and 2025. Federal EOR credits are subject to phase-out according to the level of average domestic crude oil prices. The EOR credit has been phased-out since 2006, but this phase-out affects only the periods for which EOR credits can be captured and not the periods in which such credits can be utilized.
The Company is subject to the alternative minimum tax (“AMT”) principally due to its significant intangible drilling cost deductions. As of December 31, 2015, the Company had AMT credits totaling $16 million that are available to offset future regular federal income taxes. These credits do not expire and can be carried forward indefinitely.
At December 31, 2015, the Company had a valuation allowance totaling $5 million, comprised of Canadian NOL carryforwards and foreign tax credit carryforwards, which will expire between 2016 and 2035. These valuation allowances have been recorded because the Company determined it was more likely than not that the benefit from these deferred tax assets will not be realized due to the divestiture of all foreign operations.
In conjunction with the Kodiak Acquisition, the Company acquired Kodiak, which is a Canadian entity that is disregarded for U.S. tax purposes. Kodiak holds an interest in Whiting Resources Corporation (formerly Kodiak Oil & Gas (USA) Inc.), a U.S. entity. Canadian taxes have not been recognized on the excess of the amount for financial reporting over the tax basis of the investment in Kodiak that is indefinitely reinvested outside the United States. This amount becomes taxable in Canada upon a repatriation of assets from the Canadian subsidiary or a sale or liquidation of the subsidiary. The amount of such temporary differences totaled $729 million as of December 31, 2015. Determination of the amount of any unrecognized deferred Canadian tax liability on this temporary
99
difference is not practicable. U.S. income taxes on Kodiak and its subsidiary, Whiting Resources Corporation, however, have been fully recognized on their cumulative losses to date.
In December 2015, the Company adopted ASU 2015-17 on a retrospective basis, which requires all deferred tax assets and liabilities to be presented in the balance sheet as noncurrent. As a result, $48 million of deferred income taxes previously included within current liabilities were reclassified to noncurrent in the Company’s consolidated balance sheet as of December 31, 2014.
The Company has an unrecognized tax benefit balance of $170,000 at December 31, 2015, 2014 and 2013 that includes certain tax positions, the allowance of which would positively affect the annual effective income tax rate. For the years ended December 31, 2015, 2014 and 2013, the Company did not recognize any interest or penalties with respect to unrecognized tax benefits, nor did the Company have any such interest or penalties previously accrued. The Company believes that it is reasonably possible that no increases or decreases to unrecognized tax benefits will occur in the next twelve months.
The Company files income tax returns in the U.S. federal jurisdiction and in various states, each with varying statutes of limitations. The 2012 through 2015 tax years generally remain subject to examination by federal and state tax authorities. Additionally, in conjunction with the Kodiak Acquisition, the Company has Canadian income tax filings which remain subject to examination by the related tax authorities for the 2010 through 2015 tax years.
11. EARNINGS PER SHARE
The reconciliations between basic and diluted earnings (loss) per share are as follows (in thousands, except per share data):
|
Year Ended |
|||||||||
|
December 31, |
|||||||||
|
2015 |
2014 |
2013 |
|||||||
|
Basic Earnings (Loss) Per Share |
|||||||||
|
Numerator: |
|||||||||
|
Net income (loss) available to shareholders |
$ |
(2,219,182) |
$ |
64,807 |
$ |
366,055 | |||
|
Preferred stock dividends (1) |
- |
- |
(494) | ||||||
|
Net income (loss) available to common shareholders, basic |
$ |
(2,219,182) |
$ |
64,807 |
$ |
365,561 | |||
|
Denominator: |
|||||||||
|
Weighted average shares outstanding, basic |
195,472 | 122,138 | 118,260 | ||||||
|
Diluted Earnings (Loss) Per Share |
|||||||||
|
Numerator: |
|||||||||
|
Net income (loss) available to common shareholders, basic |
$ |
(2,219,182) |
$ |
64,807 |
$ |
365,561 | |||
|
Preferred stock dividends |
- |
- |
538 | ||||||
|
Adjusted net income (loss) available to common shareholders, diluted |
|
$ |
(2,219,182) |
|
$ |
64,807 |
|
$ |
366,099 |
|
Denominator: |
|||||||||
|
Weighted average shares outstanding, basic |
195,472 | 122,138 | 118,260 | ||||||
|
Restricted stock and stock options |
- |
381 | 957 | ||||||
|
Convertible perpetual preferred stock |
- |
- |
371 | ||||||
|
Weighted average shares outstanding, diluted |
195,472 | 122,519 | 119,588 | ||||||
|
Earnings (loss) per common share, basic |
$ |
(11.35) |
$ |
0.53 |
$ |
3.09 | |||
|
Earnings (loss) per common share, diluted |
$ |
(11.35) |
$ |
0.53 |
$ |
3.06 | |||
_____________________
|
(1) |
For the year ended December 31, 2013, amount includes a decrease of $0.04 million in preferred stock dividends for preferred stock dividends accumulated. There were no accumulated dividend adjustments for the years ended December 31, 2015 or 2014. |
For the year ended December 31, 2015, the Company had a net loss and therefore the diluted earnings per share calculation for that period excludes the anti-dilutive effect of 516,139 shares of restricted stock and 85,564 stock options. In addition, the diluted earnings per share calculation for the year ended December 31, 2015 excludes (i) the anti-dilutive effect of 676,277 incremental shares of restricted stock that did not meet its market-based vesting criteria as of December 31, 2015 and (ii) the dilutive effect of 514,757 common shares for stock options that were out-of-the-money. For the year ended December 31, 2014, the diluted earnings per share calculation excludes (i) the dilutive effect of 803,902 incremental shares of restricted stock that did not meet its market-based vesting criteria as of December 31, 2014, and (ii) the anti-dilutive effect of 791 common shares for stock options that were out-of-the-money. For the year ended December 31, 2013, the diluted earnings per share calculation excludes the dilutive effect of (i) 173,778
100
incremental shares of restricted stock that did not meet its market-based vesting criteria as of December 31, 2013, and (ii) 8,689 common shares for stock options that were out-of-the-money.
12. RELATED PARTY TRANSACTIONS
Whiting USA Trust I—Whiting had a retained ownership of 15.8%, or 2,186,389 units in Trust I, and it was therefore a related party of the Company. On January 28, 2015, the net profits interest that Whiting conveyed to Trust I terminated causing such interest in the underlying properties to revert back to Whiting, and Trust I was no longer a related party. The following table summarizes the related party receivable and payable balances between the Company and Trust I as of December 31, 2014 (in thousands):
|
December 31, |
|||
|
2014 |
|||
|
Assets |
|||
|
Unit distributions due from Trust I (1) |
$ |
652 | |
|
Liabilities |
|||
|
Unit distributions payable to Trust I (2) |
$ |
4,133 | |
_____________________
|
(1) |
This amount represented Whiting’s 15.8% interest in the net proceeds due from Trust I and was included within accounts receivable trade, net in the Company’s consolidated balance sheet. |
|
(2) |
This amount represented net proceeds from Trust I’s underlying properties that the Company had received between the last Trust I distribution date and December 31, 2014, but which the Company had not yet distributed to Trust I as of December 31, 2014. This amount was included within accounts payable trade in the Company’s consolidated balance sheet as of December 31, 2014. Due to processing of Trust I revenues and expenses after December 31, 2014, the amount of Whiting’s actual distribution to Trust I, and the related distribution by Trust I to its unitholders, during the year ended December 31, 2015 was $5 million, net of state tax withholdings, and the Company received $1 million in distributions back from Trust I pursuant to its retained ownership in 2,186,389 Trust I units. |
Tax Sharing Liability—Prior to Whiting’s initial public offering in November 2003, it was a wholly-owned indirect subsidiary of Alliant Energy Corporation (“Alliant Energy”), and when the transactions discussed below were entered into, Alliant Energy was a related party of the Company. As of December 31, 2004 and thereafter, Alliant Energy was no longer a related party.
In 2003, the Company entered into a Tax Separation and Indemnification Agreement with Alliant Energy, whereby the Company and Alliant Energy made certain tax elections with the effect that the tax bases of Whiting’s assets were increased. Such additional tax bases have resulted in increased income tax deductions for Whiting and, accordingly, have reduced income taxes otherwise payable by Whiting. Under this Tax Separation and Indemnification Agreement, the Company agreed to pay to Alliant Energy (each year from 2004 to 2013) 90% of the tax benefits the Company realized annually as a result of this step-up in tax bases. In 2014, Whiting was obligated to pay Alliant the present value of 90% of the remaining tax benefits expected to result from its increased tax bases, which payout assumes all such tax benefits will be realized in future years.
In March 2014, the Company made the final payment due Alliant Energy under this agreement totaling $26 million, including $3 million of interest. During 2013, the Company made payments of $2 million under this agreement and recognized interest expense of $3 million.
Alliant Energy Guarantee—The Company holds a 6% working interest in three offshore platforms in California and the related onshore plant and equipment. Alliant Energy has guaranteed the Company’s obligation in the abandonment of these assets.
101
13. COMMITMENTS AND CONTINGENCIES
The table below shows the Company’s minimum future payments under non-cancelable operating leases and unconditional purchase obligations as of December 31, 2015 (in thousands):
|
Payments due by period |
|||||||||||||||||||||
|
2016 |
2017 |
2018 |
2019 |
2020 |
Thereafter |
Total |
|||||||||||||||
|
Non-cancelable leases |
$ |
7,710 |
$ |
6,717 |
$ |
6,693 |
$ |
5,844 |
$ |
216 |
$ |
- |
$ |
27,180 | |||||||
|
Drilling rig contracts |
70,120 | 25,514 |
- |
- |
- |
- |
95,634 | ||||||||||||||
|
Pipeline transportation agreements |
|
|
5,369 |
|
|
5,369 |
|
|
5,369 |
|
|
5,369 |
|
|
5,369 |
|
|
22,218 |
|
|
49,063 |
|
Total |
$ |
83,199 |
$ |
37,600 |
$ |
12,062 |
$ |
11,213 |
$ |
5,585 |
$ |
22,218 |
$ |
171,877 | |||||||
Non-cancelable Leases—The Company leases 204,000 square feet of administrative office space in Denver, Colorado under an operating lease arrangement expiring in 2019, 47,900 square feet of office space in Midland, Texas expiring in 2020, an additional 36,300 square feet of administrative office space in Denver, Colorado assumed in the Kodiak Acquisition expiring in 2016, and 20,000 square feet of office space in Dickinson, North Dakota expiring in 2016. Rental expense for 2015, 2014 and 2013 amounted to $9 million, $7 million and $5 million, respectively. Minimum lease payments under the terms of non-cancelable operating leases as of December 31, 2015 are shown in the table above.
Drilling Rig Contracts—As of December 31, 2015, the Company had seven drilling rigs under long-term contract. Subsequent to December 31, 2015, the Company early terminated three of these contracts incurring early termination fees of approximately $24 million. These penalties and the Company’s minimum drilling commitments under the terms of the seven contracts as of December 31, 2015 are shown in the table above. The remaining four long-term contracts expire in 2017. As of December 31, 2015, early termination of the remaining four contracts would require termination penalties of $55 million, which would be in lieu of paying the remaining drilling commitments under these contracts. During 2015, 2014 and 2013, the Company made payments of $161 million, $106 million and $93 million, respectively, under these long-term contracts, which are initially capitalized as a component of oil and gas properties and either depleted in future periods or written off as exploration expense.
Pipeline Transportation Agreements—The Company has three ship-or-pay agreements with two different suppliers, one expiring in 2017 and two expiring in 2026, whereby it has committed to transport a minimum daily volume of crude oil, CO2 or water, as the case may be, via certain pipelines or else pay for any deficiencies at a price stipulated in the contracts. Although minimum daily quantities are specified in the agreements, the actual crude oil, CO2 or water volumes transported and their corresponding unit prices are variable over the term of the contracts. As a result, the future minimum payments for each of the five succeeding fiscal years are not fixed and determinable and are not therefore included in the table above. As of December 31, 2015, the Company estimated the minimum future commitments under these ship-or-pay agreements to approximate $74 million through 2026.
In addition, the Company has two pipeline transportation agreements with one supplier, expiring in 2024 and 2025, whereby it has committed to pay fixed monthly reservation fees on dedicated pipelines for natural gas and NGL transportation capacity, plus a variable charge based on actual transportation volumes. These fixed monthly reservation fees totaling approximately $49 million have been included in the table above.
During 2015, 2014 and 2013, transportation of crude oil, natural gas, NGLs, CO2 and water under these contracts amounted to $15 million, $13 million and $4 million, respectively. As of December 31, 2015, the Company estimated the minimum future commitments under all of these pipeline transportation agreements to approximate $123 million through 2026.
Purchase Contracts—The Company has three take-or-pay purchase agreements, of which one agreement expires in 2016, one expires in 2017 and one expires in 2020. One of these agreements contains commitments to buy certain volumes of CO2 for use in the North Ward Estes EOR project in Texas. Under the remaining two take-or-pay agreements, the Company has committed to buy certain volumes of water for use in the fracture stimulation process of wells in its Redtail field. Under the terms of these agreements, the Company is obligated to purchase a minimum volume of CO2 or water, as the case may be, or else pay for any deficiencies at the price stipulated in the contract. During 2015, 2014 and 2013, purchases of CO2 and water amounted to $88 million, $105 million and $84 million, respectively. Although minimum daily quantities are specified in the agreements, the actual CO2 or water volumes purchased and their corresponding unit prices are variable over the term of the contracts. As a result, the future minimum payments for each of the five succeeding fiscal years are not fixed and determinable and are not therefore included in the table above. As of December 31, 2015, the Company estimated the minimum future commitments under all of these purchase agreements to approximate $107 million through 2020.
Water Disposal Agreement—The Company has a water disposal agreement which expires in 2024, whereby it has contracted for the transportation and disposal of the produced water from the Redtail field. Under the terms of the agreement, the Company is obligated
102
to provide a minimum volume of produced water or else pay for any deficiencies at the price stipulated in the contract. There were no water disposal costs incurred under this contract prior to December 31, 2015. Although minimum monthly quantities are specified in the agreements, the actual water volumes disposed of and their corresponding unit prices are variable over the term of the contract. As a result, the future minimum payments for each of the five succeeding fiscal years are not fixed and determinable and are not therefore included in the table above. As of December 31, 2015, the Company estimated the minimum future commitments under this disposal agreement to approximate $146 million through 2024.
Delivery Commitments—The Company has various physical delivery contracts which require the Company to deliver fixed volumes of crude oil. As of December 31, 2015, the Company had delivery commitments of 15.6 MMBbl, 25.1 MMBbl, 26.9 MMBbl, 28.8 MMBbl, 11.5 MMBbl, 5.5 MMBbl, 5.5 MMBbl and 4.1 MMBbl of crude oil for the years ended December 31, 2016 through 2023, respectively. One of these delivery commitments is tied to crude oil production at Whiting’s Sanish field in Mountrail County, North Dakota, and two are tied to crude oil production at Whiting’s Redtail field in Weld County, Colorado. The Company believes its production and reserves are sufficient to fulfill the delivery commitment at the Sanish field in North Dakota. However, the Company has determined that it is no longer probable that future oil production from its Redtail field will be sufficient to meet the minimum volume requirements specified in these physical delivery contracts, and as a result, the Company expects to make periodic deficiency payments for any shortfalls in delivering the minimum committed volumes. During 2015, total deficiency payments under these contracts amounted to $15 million. The Company recognizes any monthly deficiency payments in the period in which the underdelivery takes place and the related liability has been incurred. The table above does not include any such deficiency payments that may be incurred under the Company’s physical delivery contracts, since it cannot be predicted with accuracy the amount and timing of any such penalties incurred.
Litigation—The Company is subject to litigation, claims and governmental and regulatory proceedings arising in the ordinary course of business. The Company accrues a loss contingency for these lawsuits and claims when it is probable that a loss has been incurred and the amount of the loss can be reasonably estimated. While the outcome of these lawsuits and claims cannot be predicted with certainty, it is the opinion of the Company’s management that the loss for any litigation matters and claims that are reasonably possible to occur will not have a material adverse effect, individually or in the aggregate, on its consolidated financial position, cash flows or results of operations. Accordingly, no material amounts for loss contingencies associated with litigation, claims or assessments have been accrued at December 31, 2015 or 2014.
14. OIL AND GAS ACTIVITIES
The Company’s oil and gas activities for 2015, 2014 and 2013 were entirely within the United States. Costs incurred in oil and gas producing activities were as follows (in thousands):
|
Year Ended December 31, |
|||||||||
|
2015 |
2014 |
2013 |
|||||||
|
Development (1) |
$ |
2,137,755 |
$ |
2,891,893 |
$ |
2,132,824 | |||
|
Proved property acquisition (2) |
- |
2,278,855 | 232,572 | ||||||
|
Unproved property acquisition (2) |
29,050 | 1,035,439 | 174,103 | ||||||
|
Exploration |
192,422 | 216,587 | 363,234 | ||||||
|
Total |
$ |
2,359,227 |
$ |
6,422,774 |
$ |
2,902,733 | |||
_____________________
|
(1) |
During 2015, 2014 and 2013, non-cash additions to oil and gas properties of $48 million, $45 million and $30 million, respectively, which relate to estimated costs of the future plugging and abandonment of the Company’s oil and gas wells, are included in development costs in the table above. |
|
(2) |
During 2014, amounts include $2.3 billion of non-cash proved property additions and $1.0 billion of non-cash unproved property additions related to the Kodiak Acquisition. |
Net capitalized costs related to the Company’s oil and gas producing activities were as follows (in thousands):
|
Year Ended December 31, |
||||||
|
2015 |
2014 |
|||||
|
Proved oil and gas properties |
$ |
12,709,257 |
$ |
12,956,834 | ||
|
Unproved oil and gas properties |
1,195,268 | 1,992,868 | ||||
|
Accumulated depletion |
(3,279,156) | (3,003,270) | ||||
|
Oil and gas properties, net |
$ |
10,625,369 |
$ |
11,946,432 | ||
103
Exploratory well costs that are incurred and expensed in the same annual period have not been included in the table below. The net changes in capitalized exploratory well costs were as follows (in thousands):
|
Year Ended December 31, |
|||||||||
|
2015 |
2014 |
2013 |
|||||||
|
Beginning balance at January 1 |
$ |
14,293 |
$ |
85,378 |
$ |
108,861 | |||
|
Additions to capitalized exploratory well costs pending the determination of proved reserves |
|
|
54,707 |
|
|
145,336 |
|
|
281,951 |
|
Reclassifications to wells, facilities and equipment based on the determination of proved reserves |
|
|
(63,352) |
|
|
(200,869) |
|
|
(291,962) |
|
Capitalized exploratory well costs charged to expense |
(5,648) | (15,552) | (13,472) | ||||||
|
Ending balance at December 31 |
$ |
- |
$ |
14,293 |
$ |
85,378 | |||
At December 31, 2015, the Company had no costs capitalized for exploratory wells in progress for a period of greater than one year after the completion of drilling.
15. DISCLOSURES ABOUT OIL AND GAS PRODUCING ACTIVITIES (UNAUDITED)
For all years presented, our independent petroleum engineers independently estimated all of the proved reserve quantities included in this Annual Report on Form 10-K. In connection with our external petroleum engineers performing their independent reserve estimations, we furnish them with the following information that they review: (1) technical support data, (2) technical analysis of geologic and engineering support information, (3) economic and production data and (4) our well ownership interests. The independent petroleum engineers, Cawley, Gillespie & Associates, Inc., evaluated 100% of our estimated proved reserve quantities and their related pre-tax future net cash flows as of December 31, 2015. Proved reserve estimates included herein conform to the definitions prescribed by the SEC. Estimates of proved reserves are inherently imprecise and are continually subject to revision based on production history, results of additional exploration and development, price changes and other factors.
104
As of December 31, 2015, all of the Company’s oil and gas reserves are attributable to properties within the United States. A summary of the Company’s changes in quantities of proved oil and gas reserves for the years ended December 31, 2013, 2014 and 2015 are as follows:
|
Oil |
NGLs |
Natural Gas |
Total |
|||||
|
(MBbl) |
(MBbl) |
(MMcf) |
(MBOE) |
|||||
|
Balance—January 1, 2013 |
301,285 | 40,098 | 224,264 | 378,760 | ||||
|
Extensions and discoveries |
88,293 | 9,830 | 63,893 | 108,772 | ||||
|
Sales of minerals in place |
(36,992) | (4,777) | (12,411) | (43,838) | ||||
|
Purchases of minerals in place |
14,543 | 1,311 | 7,751 | 17,146 | ||||
|
Production |
(27,035) | (2,821) | (26,917) | (34,342) | ||||
|
Revisions to previous estimates |
7,327 | 1,228 | 20,934 | 12,044 | ||||
|
Balance—December 31, 2013 |
347,421 | 44,869 | 277,514 | 438,542 | ||||
|
Extensions and discoveries |
146,122 | 12,947 | 94,452 | 174,811 | ||||
|
Sales of minerals in place |
(1,642) |
- |
(2,925) | (2,130) | ||||
|
Purchases of minerals in place |
169,586 |
- |
156,140 | 195,609 | ||||
|
Production |
(33,485) | (3,283) | (30,218) | (41,804) | ||||
|
Revisions to previous estimates |
15,627 | 151 | (2,943) | 15,288 | ||||
|
Balance—December 31, 2014 |
643,629 | 54,684 | 492,020 | 780,316 | ||||
|
Extensions and discoveries |
131,134 | 26,074 | 192,575 | 189,304 | ||||
|
Sales of minerals in place |
(33,767) | (3,240) | (96,891) | (53,156) | ||||
|
Production |
(47,176) | (5,539) | (41,129) | (59,570) | ||||
|
Revisions to previous estimates |
(97,143) | 40,968 | 119,085 | (36,327) | ||||
|
Balance—December 31, 2015 |
596,677 | 112,947 | 665,660 | 820,567 | ||||
|
Proved developed reserves: |
||||||||
|
December 31, 2012 |
190,845 | 24,204 | 160,893 | 241,864 | ||||
|
December 31, 2013 |
198,204 | 23,721 | 183,129 | 252,446 | ||||
|
December 31, 2014 |
333,593 | 28,935 | 298,237 | 412,234 | ||||
|
December 31, 2015 |
298,444 | 55,437 | 300,631 | 403,986 | ||||
|
Proved undeveloped reserves: |
||||||||
|
December 31, 2012 |
110,440 | 15,894 | 63,371 | 136,896 | ||||
|
December 31, 2013 |
149,217 | 21,148 | 94,385 | 186,096 | ||||
|
December 31, 2014 |
310,036 | 25,749 | 193,783 | 368,082 | ||||
|
December 31, 2015 |
298,233 | 57,510 | 365,029 | 416,581 |
Notable changes in proved reserves for the year ended December 31, 2015 included:
|
· |
Extensions and discoveries. In 2015, total extensions and discoveries of 189.3 MMBOE were primarily attributable to successful drilling in the Williston Basin and DJ Basin. Both the new wells drilled in these areas as well as the PUD locations added as a result of drilling increased the Company’s proved reserves. |
|
· |
Sales of minerals in place. In 2015, total sales of minerals in place of 53.2 MMBOE were primarily attributable to the disposition of various non-core properties across all our operating areas as further described in the “Acquisitions and Divestitures” footnote, which decreased the Company’s proved reserves. |
|
· |
Revisions to previous estimates. In 2015, revisions to previous estimates decreased proved developed and undeveloped reserves by a net amount of 36.3 MMBOE. Included in these revisions were (i) 82.3 MMBOE of downward adjustments caused by lower crude oil, NGL and natural gas prices at December 31, 2015 as compared to December 31, 2014 incorporated into the Company’s reserve estimates and (ii) 46.0 MMBOE of net upward adjustments attributable to reservoir analysis and well performance. |
Notable changes in proved reserves for the year ended December 31, 2014 included:
|
· |
Extensions and discoveries. In 2014, total extensions and discoveries of 174.8 MMBOE were primarily attributable to successful drilling in the Williston Basin and DJ Basin. Both the new wells drilled in these areas as well as the PUD locations added as a result of drilling increased the Company’s proved reserves. |
105
|
· |
Sales of minerals in place. In 2014, total sales of minerals in place of 2.1 MMBOE were primarily attributable to the disposition of properties in the Big Tex prospect, further described in the “Acquisitions and Divestitures” footnote, as well as other property divestitures in the Lucky Ditch, Whiskey Springs and Bridger Lake fields, which decreased the Company’s proved reserves. |
|
· |
Purchases of minerals in place. In 2014, total purchases of minerals in place of 195.6 MMBOE were primarily attributable to the Kodiak Acquisition, whereby we acquired interests in 778 producing oil and gas wells and undeveloped acreage in the Williston Basin, further described in the “Acquisitions and Divestitures” footnote, which increased the Company’s proved reserves. |
|
· |
Revisions to previous estimates. In 2014, revisions to previous estimates increased proved developed and undeveloped reserves by a net amount of 15.3 MMBOE. Included in these revisions were (i) 15.6 MMBOE of net upward adjustments attributable to reservoir analysis and well performance and (ii) 0.3 MMBOE of downward adjustments caused by lower crude oil prices at December 31, 2014 as compared to December 31, 2013 incorporated into the Company’s reserve estimates. |
Notable changes in proved reserves for the year ended December 31, 2013 included:
|
· |
Extensions and discoveries. In 2013, total extensions and discoveries of 108.8 MMBOE were primarily attributable to successful drilling in the Williston Basin and DJ Basin. Both the new wells drilled in these areas as well as the PUD locations added as a result of drilling increased the Company’s proved reserves. |
|
· |
Sales of minerals in place. In 2013, total sales of minerals in place of 43.8 MMBOE were primarily attributable to the disposition of the Postle Properties, further described in the “Acquisitions and Divestitures” footnote, which decreased the Company’s proved reserves. |
|
· |
Purchases of minerals in place. In 2013, total purchases of minerals in place of 17.1 MMBOE were primarily attributable to the acquisition of 121 producing oil and gas wells and undeveloped acreage in the Williston Basin, further described in the “Acquisitions and Divestitures” footnote, which increased the Company’s proved reserves. |
|
· |
Revisions to previous estimates. In 2013, revisions to previous estimates increased proved developed and undeveloped reserves by a net amount of 12.0 MMBOE. Included in these revisions were (i) 4.9 MMBOE of upward adjustments caused by higher crude oil and natural gas prices at December 31, 2013 as compared to December 31, 2012 incorporated into the Company’s reserve estimates and (ii) 7.1 MMBOE of net upward adjustments attributable to reservoir analysis and well performance. |
As discussed in the “Deferred Compensation” footnote, the Company had a Production Participation Plan (the “Plan”) in which all employees participated. On June 11, 2014, the Board of Directors of the Company terminated the Plan effective December 31, 2013. The reserve disclosures above include oil and natural gas reserve volumes that were allocated to the Plan prior to its termination. Once allocated to Plan participants, the interests were fixed. Interest allocations prior to 1995 consisted of 2%–3% overriding royalty interests. Interest allocations after 1995 were 1.75%–5% of oil and gas sales less lease operating expenses and production taxes from the production allocated to the Plan.
The standardized measure of discounted future net cash flows relating to proved oil and gas reserves and the changes in standardized measure of discounted future net cash flows relating to proved oil and natural gas reserves were prepared in accordance with the provisions of FASB ASC Topic 932, Extractive Activities—Oil and Gas. Future cash inflows as of December 31, 2015, 2014 and 2013 were computed by applying average fiscal-year prices (calculated as the unweighted arithmetic average of the first-day-of-the-month price for each month within the 12-month period ended December 31, 2015, 2014 and 2013, respectively) to estimated future production. Future production and development costs are computed by estimating the expenditures to be incurred in developing and producing the proved oil and natural gas reserves at year end, based on year-end costs and assuming the continuation of existing economic conditions.
Future income tax expenses are calculated by applying appropriate year-end tax rates to future pretax net cash flows relating to proved oil and natural gas reserves, less the tax basis of properties involved. Future income tax expenses give effect to permanent differences, tax credits and loss carryforwards relating to the proved oil and natural gas reserves. Future net cash flows are discounted at a rate of 10% annually to derive the standardized measure of discounted future net cash flows. This calculation does not necessarily result in an estimate of the fair value of the Company’s oil and gas properties.
106
The standardized measure of discounted future net cash flows relating to proved oil and natural gas reserves is as follows (in thousands):
|
December 31, |
|||||||||
|
2015 |
2014 |
2013 |
|||||||
|
Future cash flows |
$ |
29,339,528 |
$ |
59,949,707 |
$ |
35,178,399 | |||
|
Future production costs |
(12,344,463) | (20,772,234) | (12,973,292) | ||||||
|
Future development costs |
(6,166,397) | (7,924,573) | (5,355,383) | ||||||
|
Future income tax expense |
(388,072) | (8,579,237) | (3,954,401) | ||||||
|
Future net cash flows |
10,440,596 | 22,673,663 | 12,895,323 | ||||||
|
10% annual discount for estimated timing of cash flows |
(5,866,225) | (11,830,243) | (6,301,462) | ||||||
|
Standardized measure of discounted future net cash flows |
$ |
4,574,371 |
$ |
10,843,420 |
$ |
6,593,861 | |||
Future cash flows as shown above are reported without consideration for the effects of open hedge contracts at each period end. If the effects of hedging transactions were included in the computation, then undiscounted future cash inflows would have increased by $71 million in 2015, would have decreased by $7 million in 2014 and would not have changed in 2013.
The changes in the standardized measure of discounted future net cash flows relating to proved oil and natural gas reserves are as follows (in thousands):
|
December 31, |
|||||||||
|
2015 |
2014 |
2013 |
|||||||
|
Beginning of year |
$ |
10,843,420 |
$ |
6,593,861 |
$ |
5,407,033 | |||
|
Sale of oil and gas produced, net of production costs |
(1,354,054) | (2,274,682) | (2,010,925) | ||||||
|
Sales of minerals in place |
(1,414,511) | (48,532) | (1,064,195) | ||||||
|
Net changes in prices and production costs |
(11,001,949) | 81,522 | 902,916 | ||||||
|
Extensions, discoveries and improved recoveries |
2,078,071 | 3,950,413 | 2,827,321 | ||||||
|
Previously estimated development costs incurred during the period |
1,625,160 | 1,149,926 | 832,096 | ||||||
|
Changes in estimated future development costs |
102,499 | (3,382,849) | (1,264,189) | ||||||
|
Purchases of minerals in place |
- |
4,420,417 | 445,669 | ||||||
|
Revisions of previous quantity estimates |
(966,713) | 345,775 | 313,069 | ||||||
|
Net change in income taxes |
3,578,106 | (651,817) | (335,637) | ||||||
|
Accretion of discount |
1,084,342 | 659,386 | 540,703 | ||||||
|
End of year |
$ |
4,574,371 |
$ |
10,843,420 |
$ |
6,593,861 | |||
Future net revenues included in the standardized measure of discounted future net cash flows relating to proved oil and natural gas reserves incorporate calculated weighted average sales prices (inclusive of adjustments for quality and location) in effect at December 31, 2015, 2014 and 2013 as follows:
|
2015 |
2014 |
2013 |
|||||||
|
Oil (per Bbl) |
$ |
43.07 |
$ |
84.69 |
$ |
90.80 |
|||
|
NGLs (per Bbl) |
$ |
15.53 |
$ |
46.59 |
$ |
54.38 |
|||
|
Natural Gas (per Mcf) |
$ |
2.83 |
$ |
5.88 |
$ |
4.30 |
|||
107
16. QUARTERLY FINANCIAL DATA (UNAUDITED)
The following is a summary of the unaudited quarterly financial data for the years ended December 31, 2015 and 2014 (in thousands, except per share data):
|
Three Months Ended |
||||||||||||
|
March 31, |
June 30, |
September 30, |
December 31, |
|||||||||
|
2015 |
2015 |
2015 |
2015 |
|||||||||
|
Oil, NGL and natural gas sales |
$ |
519,848 |
$ |
650,527 |
$ |
504,155 |
$ |
417,952 | ||||
|
Operating profit (loss) (1) |
$ |
25,586 |
$ |
128,012 |
$ |
18,130 |
$ |
(60,966) | ||||
|
Net loss |
$ |
(106,128) |
$ |
(149,295) |
$ |
(1,865,118) |
$ |
(98,727) | ||||
|
Basic loss per share |
$ |
(0.63) |
$ |
(0.73) |
$ |
(9.14) |
$ |
(0.48) | ||||
|
Diluted loss per share |
$ |
(0.63) |
$ |
(0.73) |
$ |
(9.14) |
$ |
(0.48) | ||||
|
Three Months Ended |
||||||||||||
|
March 31, |
June 30, |
September 30, |
December 31, |
|||||||||
|
2014 |
2014 |
2014 |
2014 |
|||||||||
|
Oil, NGL and natural gas sales |
$ |
721,250 |
$ |
825,760 |
$ |
805,054 |
$ |
672,553 | ||||
|
Operating profit (1) |
$ |
311,169 |
$ |
370,033 |
$ |
326,215 |
$ |
177,722 | ||||
|
Net income (loss) |
$ |
109,051 |
$ |
151,426 |
$ |
157,961 |
$ |
(353,693) | ||||
|
Basic earnings (loss) per share |
$ |
0.92 |
$ |
1.27 |
$ |
1.33 |
$ |
(2.69) | ||||
|
Diluted earnings (loss) per share |
$ |
0.91 |
$ |
1.26 |
$ |
1.32 |
$ |
(2.68) | ||||
_____________________
|
(1) |
Oil, NGL and natural gas sales less lease operating expense, production taxes and depreciation, depletion and amortization. |
******
108
Item 9. Changes in and Disagreements with Accountants on Accounting and Financial Disclosure
None.
Item 9A. Controls and Procedures
Evaluation of disclosure controls and procedures. In accordance with Rule 13a-15(b) of the Securities Exchange Act of 1934 (the “Exchange Act”), our management evaluated, with the participation of our Chairman, President and Chief Executive Officer and our Senior Vice President and Chief Financial Officer, the effectiveness of the design and operation of our disclosure controls and procedures (as defined in Rule 13a-15(e) under the Exchange Act) as of the end of the year ended December 31, 2015. Based upon their evaluation of these disclosures controls and procedures, the Chairman, President and Chief Executive Officer and the Senior Vice President and Chief Financial Officer concluded that the disclosure controls and procedures were effective as of the end of the year ended December 31, 2015 to ensure that information required to be disclosed by us in the reports that we file or submit under the Exchange Act is recorded, processed, summarized and reported within the time periods specified in the rules and forms of the Securities and Exchange Commission, and to ensure that information required to be disclosed by us in the reports we file or submit under the Exchange Act is accumulated and communicated to our management, including our principal executive and principal financial officers, as appropriate, to allow timely decisions regarding required disclosure.
Management’s Annual Report on Internal Control over Financial Reporting. The management of Whiting Petroleum Corporation and subsidiaries is responsible for establishing and maintaining adequate internal control over financial reporting, as such term is defined in Rules 13a-15(f) and 15d-15(f) under the Securities Exchange Act of 1934. Our internal control over financial reporting is designed to provide reasonable assurance regarding the reliability of financial reporting and the preparation of financial statements for external purposes in accordance with generally accepted accounting principles.
Because of the inherent limitations of internal control over financial reporting, misstatements may not be prevented or detected on a timely basis. Also, projections of any evaluation of the effectiveness of the internal control over financial reporting to future periods are subject to the risk that the controls may become inadequate because of changes in conditions, or that the degree of compliance with the policies or procedures may deteriorate.
Our management assessed the effectiveness of our internal control over financial reporting as of December 31, 2015 using the criteria set forth in Internal Control - Integrated Framework (2013) issued by the Committee of Sponsoring Organizations of the Treadway Commission. Based on this assessment, our management believes that, as of December 31, 2015, our internal control over financial reporting was effective based on those criteria.
The effectiveness of our internal control over financial reporting as of December 31, 2015 has been audited by Deloitte & Touche LLP, an independent registered public accounting firm, as stated in their report which is included herein on the following page.
Changes in internal control over financial reporting. There was no change in our internal control over financial reporting that occurred during the quarter ended December 31, 2015 that has materially affected, or is reasonably likely to materially affect, our internal control over financial reporting.
109
REPORT OF INDEPENDENT REGISTERED PUBLIC ACCOUNTING FIRM
To the Board of Directors and Stockholders of
Whiting Petroleum Corporation
Denver, Colorado
We have audited the internal control over financial reporting of Whiting Petroleum Corporation and subsidiaries (the "Company") as of December 31, 2015, based on criteria established in Internal Control — Integrated Framework (2013) issued by the Committee of Sponsoring Organizations of the Treadway Commission. The Company's management is responsible for maintaining effective internal control over financial reporting and for its assessment of the effectiveness of internal control over financial reporting, included in the accompanying Management’s Annual Report on Internal Control over Financial Reporting. Our responsibility is to express an opinion on the Company's internal control over financial reporting based on our audit.
We conducted our audit in accordance with the standards of the Public Company Accounting Oversight Board (United States). Those standards require that we plan and perform the audit to obtain reasonable assurance about whether effective internal control over financial reporting was maintained in all material respects. Our audit included obtaining an understanding of internal control over financial reporting, assessing the risk that a material weakness exists, testing and evaluating the design and operating effectiveness of internal control based on the assessed risk, and performing such other procedures as we considered necessary in the circumstances. We believe that our audit provides a reasonable basis for our opinion.
A company's internal control over financial reporting is a process designed by, or under the supervision of, the company's principal executive and principal financial officers, or persons performing similar functions, and effected by the company's board of directors, management, and other personnel to provide reasonable assurance regarding the reliability of financial reporting and the preparation of financial statements for external purposes in accordance with generally accepted accounting principles. A company's internal control over financial reporting includes those policies and procedures that (1) pertain to the maintenance of records that, in reasonable detail, accurately and fairly reflect the transactions and dispositions of the assets of the company; (2) provide reasonable assurance that transactions are recorded as necessary to permit preparation of financial statements in accordance with generally accepted accounting principles, and that receipts and expenditures of the company are being made only in accordance with authorizations of management and directors of the company; and (3) provide reasonable assurance regarding prevention or timely detection of unauthorized acquisition, use, or disposition of the company's assets that could have a material effect on the financial statements.
Because of the inherent limitations of internal control over financial reporting, including the possibility of collusion or improper management override of controls, material misstatements due to error or fraud may not be prevented or detected on a timely basis. Also, projections of any evaluation of the effectiveness of the internal control over financial reporting to future periods are subject to the risk that the controls may become inadequate because of changes in conditions, or that the degree of compliance with the policies or procedures may deteriorate.
In our opinion, the Company maintained, in all material respects, effective internal control over financial reporting as of December 31, 2015, based on the criteria established in Internal Control — Integrated Framework (2013) issued by the Committee of Sponsoring Organizations of the Treadway Commission.
We have also audited, in accordance with the standards of the Public Company Accounting Oversight Board (United States), the consolidated financial statements as of and for the year ended December 31, 2015 of the Company and our report dated February 25, 2016 expressed an unqualified opinion on those financial statements.
/s/ DELOITTE & TOUCHE LLP
Denver, Colorado
February 25, 2016
None.
110
Item 10. Directors, Executive Officers and Corporate Governance
The information included under the captions “Corporate Governance – Proposal 1 – Election of Directors”, “Corporate Governance – Board Committee Information – Audit Committee” and “Share Ownership – Section 16(a) Beneficial Ownership Reporting Compliance” in our definitive Proxy Statement for Whiting Petroleum Corporation’s 2016 Annual Meeting of Stockholders (the “Proxy Statement”) is incorporated herein by reference. Information with respect to our executive officers appears in Part I of this Annual Report on Form 10‑K.
We have adopted the Whiting Petroleum Corporation Code of Business Conduct and Ethics that applies to our directors, our Chairman, President and Chief Executive Officer, our Senior Vice President and Chief Financial Officer, our Vice President, Finance and Treasurer and other persons performing similar functions. We have posted a copy of the Whiting Petroleum Corporation Code of Business Conduct and Ethics on our website at www.whiting.com. The Whiting Petroleum Corporation Code of Business Conduct and Ethics is also available in print to any stockholder who requests it in writing from the Corporate Secretary of Whiting Petroleum Corporation. We intend to satisfy the disclosure requirements under Item 5.05 of Form 8‑K regarding amendments to, or waivers from, the Whiting Petroleum Corporation Code of Business Conduct and Ethics by posting such information on our website at www.whiting.com.
We are not including the information contained on our website as part of, or incorporating it by reference into, this report.
Item 11. Executive Compensation
The information required by this Item is included under the captions “Corporate Governance – Director Compensation”, “Executive Compensation” (other than “Executive Compensation – Proposal 2 – Advisory Vote on the Compensation of Our Named Executive Officers”) in the Proxy Statement and is incorporated herein by reference.
Item 12. Security Ownership of Certain Beneficial Owners and Management and Related Stockholder Matters
The information required by this Item with respect to security ownership of certain beneficial owners and management is included under the captions “Share Ownership – Directors and Executive Officers” and “Share Ownership – Certain Beneficial Owners” in the Proxy Statement and is incorporated herein by reference. The following table sets forth information with respect to compensation plans under which equity securities of Whiting Petroleum Corporation are authorized for issuance as of December 31, 2015.
Equity Compensation Plan Information
|
Number of securities remaining |
|||||||
|
Number of securities to |
Weighted-average |
available for future issuance under |
|||||
|
be issued upon exercise |
exercise price of |
equity compensation plans |
|||||
|
of outstanding options, |
outstanding options, |
(excluding securities reflected in |
|||||
|
Plan Category |
warrants and rights |
warrants and rights |
the first column) |
||||
|
Equity compensation plans approved by security holders (1) |
|
588,175 |
|
$ |
41.35 |
|
4,108,863 (2) |
|
Equity compensation plans not approved by security holders |
|
- |
|
|
N/A |
|
- |
|
Total |
588,175 |
$ |
41.35 |
4,108,863 (2) |
_____________________
|
(1) |
Includes the Whiting Petroleum Corporation 2003 Equity Incentive Plan (the “2003 Equity Plan”) and Whiting Petroleum Corporation 2013 Equity Incentive Plan (the “2013 Equity Plan”). Upon shareholder approval of the 2013 Equity Plan in May 2013, the 2003 Equity Plan was terminated, but continues to govern awards that were outstanding at the date of its termination. Any shares netted or forfeited under the 2003 Equity Plan and any shares forfeited under the 2013 Equity Plan will be available for future issuance under the 2013 Equity Plan. However, shares netted for tax withholding under the 2013 Equity Plan will be cancelled and will not be available for future issuance. |
|
(2) |
Number of securities reduced by 588,175 stock options outstanding and 2,293,656 shares of restricted common stock previously issued for which the restrictions have not lapsed. |
111
Item 13. Certain Relationships, Related Transactions and Director Independence
The information required by this Item is included under the caption “Corporate Governance – Governance Information – Independence of Directors” and “Corporate Governance – Governance Information – Transactions with Related Persons” in the Proxy Statement and is incorporated herein by reference.
Item 14. Principal Accounting Fees and Services
The information required by this Item is included under the caption “Audit Matters – Audit and Non-Audit Fees and Services” in the Proxy Statement and is incorporated herein by reference.
Item 15. Exhibits and Financial Statement Schedules
|
(a) |
1.Financial statements – Refer to the Index to Consolidated Financial Statements included in Item 8 of this Form 10-K for a list of all financial statements filed as part of this report. |
|
|
|
2.Financial statement schedules – All schedules are omitted since the required information is not present, or is not present in amounts sufficient to require submission of the schedule, or because the information required is included in the consolidated financial statements or the notes thereto. |
|
|
|
3.Exhibits – The exhibits listed in the accompanying index to exhibits are filed as part of this Annual Report on Form 10‑K. |
|
|
(b) |
Exhibits |
|
|
|
The exhibits listed in the accompanying exhibit index are filed (except where otherwise indicated) as part of this report. |
|
******
112
SIGNATURES
Pursuant to the requirements of Section 13 or 15(d) of the Securities Exchange Act of 1934, the Registrant has duly caused this report to be signed on its behalf by the undersigned, thereunto duly authorized, on this 25th day of February, 2016.
|
|
|
WHITING PETROLEUM CORPORATION |
|
|
|
|
|
|
|
|
|
|
By |
/s/ James J. Volker |
|
|
|
James J. Volker |
|
|
|
Chairman, President and Chief Executive Officer |
Pursuant to the requirements of the Securities Exchange Act of 1934, this report has been signed below by the following persons on behalf of the Registrant and in the capacities and on the dates indicated.
|
Signature |
Title |
Date |
|
/s/ James J. Volker James J. Volker |
Chairman, President and Chief |
February 25, 2016 |
|
/s/ Michael J. Stevens Michael J. Stevens |
Senior Vice President and |
February 25, 2016 |
|
/s/ Brent P. Jensen Brent P. Jensen |
Vice President, Finance and Treasurer (Principal Accounting Officer) |
February 25, 2016 |
|
/s/ Thomas L. Aller Thomas L. Aller |
Director |
February 25, 2016 |
|
/s/ D. Sherwin Artus D. Sherwin Artus |
Director |
February 25, 2016 |
|
/s/ James E. Catlin James E. Catlin |
Director |
February 25, 2016 |
|
/s/ Philip E. Doty Philip E. Doty |
Director |
February 25, 2016 |
|
/s/ William N. Hahne William N. Hahne |
Director |
February 25, 2016 |
|
/s/ Carin S. Knickel Carin S. Knickel |
Director |
February 25, 2016 |
|
/s/ Michael B. Walen Michael B. Walen |
Director |
February 25, 2016 |
113
EXHIBIT INDEX
|
|
|
|
Exhibit |
|
|
Number |
Exhibit Description |
|
(3.1) |
Restated Certificate of Incorporation of Whiting Petroleum Corporation [Incorporated by reference to Exhibit 3.2 to Whiting Petroleum Corporation’s Current Report on Form 8-K filed on July 1, 2013 (File No. 001-31899)]. |
|
(3.2) |
Amended and Restated By-laws of Whiting Petroleum Corporation, effective February 18, 2016 [Incorporated by reference to Exhibit 3.1 to Whiting Petroleum Corporation’s Current Report on Form 8-K filed on February 22, 2016 (File No. 001-31899)]. |
|
(4.1) |
Sixth Amended and Restated Credit Agreement, dated as of August 27, 2014, among Whiting Petroleum Corporation, Whiting Oil and Gas Corporation, the lenders party thereto, JPMorgan Chase Bank, N.A., as Administrative Agent, and the various other agents party thereto [Incorporated by reference to Exhibit 4.1 to Whiting Petroleum Corporation’s Current Report on Form 8-K filed on August 28, 2014 (File No. 001-31899)]. |
|
(4.2) |
First Amendment to Sixth Amended and Restated Credit Agreement, dated as of April 27, 2015, among Whiting Petroleum Corporation, Whiting Oil and Gas Corporation, the lenders party thereto, JPMorgan Chase Bank, N.A., as Administrative Agent, and the various other agents party thereto [Incorporated by reference to Exhibit 4.1 to Whiting Petroleum Corporation’s Quarterly Report on Form 10-Q for the Quarter Ended March 31, 2015 (File No. 001-31899)]. |
|
(4.3) |
Second Amendment to Sixth Amended and Restated Credit Agreement, dated as of October 13, 2015, among Whiting Petroleum Corporation, its subsidiary Whiting Oil and Gas Corporation, JPMorgan Chase Bank, N.A., as Administrative Agent, and the lenders party thereto [Incorporated by reference to Exhibit 4.1 to Whiting Petroleum Corporation’s Current Report on Form 8-K filed on October 14, 2015 (File No. 001-31899)]. |
|
(4.4)^ |
Amended and Restated Guaranty and Collateral Agreement, dated as of December 8, 2014, among Whiting Petroleum Corporation, Whiting Oil and Gas Corporation, Kodiak Oil & Gas Corp., Kodiak Oil & Gas (USA) Inc., Kodiak Williston, LLC and JPMorgan Chase Bank, N.A., as Administrative Agent [Incorporated by reference to Exhibit 4.16 to Whiting Petroleum Corporation’s Current Report on Form 8-K filed on December 8, 2014 (File No. 001-31899)]. |
|
(4.5) |
Maximum Credit Amount Increase Agreement, dated as of December 19, 2014, among Whiting Petroleum Corporation, Whiting Oil and Gas Corporation, the lenders party thereto, and JPMorgan Chase Bank, N.A., as Administrative Agent [Incorporated by reference to Exhibit 4.1 to Whiting Petroleum Corporation’s Current Report on Form 8-K filed on December 22, 2014 (File No. 001-31899)]. |
|
(4.6) |
Subordinated Indenture, dated as of April 19, 2005, by and among Whiting Petroleum Corporation, Whiting Oil and Gas Corporation, Whiting Programs, Inc., Equity Oil Company (succeeded to Whiting Oil and Gas Corporation) and The Bank of New York Mellon Trust Company, N.A., as successor trustee [Incorporated by reference to Exhibit 4.1 to Whiting Petroleum Corporation’s Current Report on Form 8-K filed on September 24, 2010 (File No. 001-31899)]. |
|
(4.7) |
Second Supplemental Indenture, dated September 24, 2010, among Whiting Petroleum Corporation, Whiting Oil and Gas Corporation and The Bank of New York Mellon Trust Company, N.A., as Trustee, creating the 6.5% Senior Subordinated Notes due 2018 [Incorporated by reference to Exhibit 4.2 to Whiting Petroleum Corporation’s Current Report on Form 8-K filed on September 24, 2010 (File No. 001-31899)]. |
|
(4.8) |
Supplemental Indenture and Amendment – Subsidiary Guarantee, dated as of December 11, 2014, among Whiting Petroleum Corporation, Whiting Canadian Holding Company ULC, Whiting Resources Corporation, Whiting US Holding Company and The Bank of New York Mellon Trust Company, N.A., as trustee, relating to the 6.5% Senior Subordinated Notes Due 2018 [Incorporated by reference to Exhibit 4.1 to Whiting Petroleum Corporation’s Current Report on Form 8-K filed on December 12, 2014 (File No. 001-31899)]. |
|
(4.9) |
Indenture, dated September 12, 2013, among Whiting Petroleum Corporation, Whiting Oil and Gas Corporation and The Bank of New York Mellon Trust Company, N.A., as Trustee [Incorporated by reference to Exhibit 4.1 to Whiting Petroleum Corporation’s Current Report on Form 8-K filed on September 12, 2013 (File No. 001-31899)]. |
|
(4.10) |
First Supplemental Indenture, dated September 12, 2013, among Whiting Petroleum Corporation, Whiting Oil and Gas Corporation and The Bank of New York Mellon Trust Company, N.A., as Trustee, creating the 5.0% Senior Notes due 2019 [Incorporated by reference to Exhibit 4.2 to Whiting Petroleum Corporation’s Current Report on Form 8-K filed on September 12, 2013 (File No. 001-31899)]. |
|
(4.11) |
Supplemental Indenture and Amendment – Subsidiary Guarantee, dated as of December 11, 2014, among Whiting Petroleum Corporation, Whiting Canadian Holding Company ULC, Whiting Resources Corporation, Whiting US Holding Company and The Bank of New York Mellon Trust Company, N.A., as trustee, relating to the 5.0% Senior Notes Due 2019 [Incorporated by reference to Exhibit 4.2 to Whiting Petroleum Corporation’s Current Report on Form 8-K filed on December 12, 2014 (File No. 001-31899)]. |
|
(4.12) |
Second Supplemental Indenture, dated September 12, 2013, among Whiting Petroleum Corporation, Whiting Oil and Gas Corporation and The Bank of New York Mellon Trust Company, N.A., as Trustee, creating the 5.75% Senior Notes due 2021 [Incorporated by reference to Exhibit 4.3 to Whiting Petroleum Corporation’s Current Report on Form 8-K filed on September 12, 2013 (File No. 001-31899)]. |
114
|
Exhibit |
|
|
Number |
Exhibit Description |
|
(4.13) |
Supplemental Indenture and Amendment – Subsidiary Guarantee, dated as of December 11, 2014, among Whiting Petroleum Corporation, Whiting Canadian Holding Company ULC, Whiting Resources Corporation, Whiting US Holding Company and The Bank of New York Mellon Trust Company, N.A., as trustee, relating to the 5.75% Senior Notes Due 2021 [Incorporated by reference to Exhibit 4.3 to Whiting Petroleum Corporation’s Current Report on Form 8-K filed on December 12, 2014 (File No. 001-31899)]. |
|
(4.14) |
Fourth Supplemental Indenture, dated March 27, 2015, among Whiting Petroleum Corporation, Whiting Oil and Gas Corporation, Whiting US Holding Company, Whiting Canadian Holding Company ULC, Whiting Resources Corporation and The Bank of New York Mellon Trust Company, N.A., as Trustee, creating the 6.25% Senior Notes due 2023 [Incorporated by reference to Exhibit 4.3 to Whiting Petroleum Corporation’s Current Report on Form 8-K filed on March 30, 2015 (File No. 001-31899)]. |
|
(4.15) |
Indenture, dated March 27, 2015, among Whiting Petroleum Corporation, the Guarantors and The Bank of New York Mellon Trust Company, N.A., as Trustee, creating the 1.25% Convertible Senior Notes due 2020 [Incorporated by reference to Exhibit 4.2 to Whiting Petroleum Corporation’s Current Report on Form 8-K filed on March 30, 2015 (File No. 001-31899)]. |
|
(10.1)* |
Whiting Petroleum Corporation 2003 Equity Incentive Plan, as amended through October 23, 2007 [Incorporated by reference to Exhibit 10.2 to Whiting Petroleum Corporation’s Current Report on Form 8-K filed on October 29, 2007 (File No. 001‑31899)]. |
|
(10.2)* |
Whiting Petroleum Corporation 2013 Equity Incentive Plan [Incorporated by reference to Annex A to Whiting Petroleum Corporation’s definitive proxy statement filed with the Securities and Exchange Commission on Schedule 14A on March 25, 2013 (File No. 001-31899)]. |
|
(10.3)* |
Form of Restricted Stock Agreement pursuant to the Whiting Petroleum Corporation 2003 Equity Incentive Plan for time-based vesting awards [Incorporated by reference to Exhibit 10.4 to Whiting Petroleum Corporation’s Current Report on Form 8-K filed on October 29, 2007 (File No. 001-31899)]. |
|
(10.4)* |
Form of Restricted Stock Agreement pursuant to the Whiting Petroleum Corporation 2003 Equity Incentive Plan for awards to executive officers [Incorporated by reference to Exhibit 10.1 to Whiting Petroleum Corporation’s Quarterly Report on Form 10-Q for the quarter ended March 31, 2008 (File No. 001‑31899)]. |
|
(10.5)* |
Summary of Non-Employee Director Compensation for Whiting Petroleum Corporation. |
|
(10.6)* |
Form of Indemnification Agreement for directors and officers of Whiting Petroleum Corporation [Incorporated by reference to Exhibit 10.10 to Whiting Petroleum Corporation’s Quarterly Report on Form 10-Q for the quarter ended September 30, 2008 (File No. 001-31899)]. |
|
(10.7)* |
Form of Executive Employment and Severance Agreement for executive officers of Whiting Petroleum Corporation [Incorporated by reference to Exhibit 10.1 to Whiting Petroleum Corporation’s Current Report on Form 8-K filed on January 5, 2015 (File No. 001‑31899)]. |
|
(10.8)* |
Form of Stock Option Agreement pursuant to the Whiting Petroleum Corporation 2003 Equity Incentive Plan [Incorporated by reference to Exhibit 10.14 to Whiting Petroleum Corporation’s Annual Report on Form 10-K for the year ended December 31, 2008 (File No. 001-31899)]. |
|
(10.9)* |
Form of Restricted Stock Agreement pursuant to the Whiting Petroleum Corporation 2013 Equity Incentive Plan for performance vesting awards [Incorporated by reference to Exhibit 10.14 to Whiting Petroleum Corporation’s Annual Report on Form 10-K for the year ended December 31, 2013 (File No. 001-31899)]. |
|
(10.10)* |
Form of Restricted Stock Agreement pursuant to the Whiting Petroleum Corporation 2013 Equity Incentive Plan for time-based vesting awards [Incorporated by reference to Exhibit 10.15 to Whiting Petroleum Corporation’s Annual Report on Form 10-K for the year ended December 31, 2013 (File No. 001-31899)]. |
|
(10.11)* |
Form of Stock Option Agreement pursuant to the Whiting Petroleum Corporation 2013 Equity Incentive Plan [Incorporated by reference to Exhibit 10.16 to Whiting Petroleum Corporation’s Annual Report on Form 10-K for the year ended December 31, 2013 (File No. 001-31899)]. |
|
(10.12)* |
Form of Performance Share Award Agreement pursuant to the Whiting Petroleum Corporation 2013 Equity Incentive Plan [Incorporated by reference to Exhibit 10.2 to Whiting Petroleum Corporation’s Current Report on Form 8-K filed on January 5, 2015 (File No. 001‑31899)]. |
|
(21) |
Significant Subsidiaries of Whiting Petroleum Corporation. |
|
(23.1) |
Consent of Deloitte & Touche LLP. |
|
(23.2) |
Consent of Cawley, Gillespie & Associates, Inc., Independent Petroleum Engineers. |
|
(31.1) |
Certification by the Chairman, President and Chief Executive Officer pursuant to Section 302 of the Sarbanes-Oxley Act. |
|
(31.2) |
Certification by the Senior Vice President and Chief Financial Officer pursuant to Section 302 of the Sarbanes-Oxley Act. |
|
(32.1) |
Written Statement of the Chairman, President and Chief Executive Officer pursuant to 18 U.S.C. Section 1350. |
|
(32.2) |
Written Statement of the Senior Vice President and Chief Financial Officer pursuant to 18 U.S.C. Section 1350. |
115
|
Exhibit |
|
|
Number |
Exhibit Description |
|
(99.1) |
Proxy Statement for the 2016 Annual Meeting of Stockholders, to be filed within 120 days of December 31, 2015 [To be filed with the Securities and Exchange Commission under Regulation 14A within 120 days after December 31, 2015; except to the extent specifically incorporated by reference, the Proxy Statement for the 2016 Annual Meeting of Stockholders shall not be deemed to be filed with the Securities and Exchange Commission as part of this Annual Report on Form 10-K]. |
|
(99.2) |
Report of Cawley, Gillespie & Associates, Inc., Independent Petroleum Engineers relating to Total Proved Reserves, dated January 23, 2016. |
|
(101) |
The following materials from Whiting Petroleum Corporation’s Annual Report on Form 10‑K for the year ended December 31, 2015 are filed herewith, formatted in XBRL (Extensible Business Reporting Language): (i) the Consolidated Balance Sheets as of December 31, 2015 and 2014, (ii) the Consolidated Statements of Operations for the Years Ended December 31, 2015, 2014 and 2013, (iii) the Consolidated Statements of Comprehensive Income (Loss) for the Years Ended December 31, 2015, 2014 and 2013, (iv) the Consolidated Statements of Cash Flows for the Years Ended December 31, 2015, 2014 and 2013, (v) the Consolidated Statements of Equity for the Years Ended December 31, 2015, 2014 and 2013 and (vi) Notes to Consolidated Financial Statements. |
_____________________
*A management contract or compensatory plan or arrangement.
^Kodiak Oil & Gas Corp. is now known as Whiting Canadian Holding Company ULC; Kodiak Oil & Gas (USA) Inc. is now known as Whiting Resources Corporation; Kodiak Williston, LLC has merged with Whiting Resources Corporation; KOG Finance, LLC has been dissolved; and KOG Oil & Gas ULC has been liquidated.
116