Attached files
| file | filename |
|---|---|
| 8-K - FORM 8-K - Gogo Inc. | d72519d8k.htm |
| EX-99.1 - EX-99.1 - Gogo Inc. | d72519dex991.htm |
4th Quarter and Full Year 2015 Earnings Results Michael Small – Chief Executive Officer Norman Smagley – Chief Financial Officer February 25, 2016 Exhibit 99.2
SAFE HARBOR STATEMENT Safe Harbor Statement This presentation contains “forward-looking statements” within the meaning of Section 27A of the Securities Act of 1933 and Section 21E of the Securities Exchange Act of 1934 that are based on management’s beliefs and assumptions and on information currently available to management. Most forward-looking statements contain words that identify them as forward-looking, such as “anticipates,” “believes,” “continues,” “could,” “seeks,” “estimates,” “expects,” “intends,” “may,” “plans,” “potential,” “predicts,” “projects,” “should,” “will,” “would” or similar expressions and the negatives of those terms that relate to future events. Forward-looking statements involve known and unknown risks, uncertainties and other factors that may cause Gogo’s actual results, performance or achievements to be materially different from any projected results, performance or achievements expressed or implied by the forward-looking statements. Forward-looking statements represent the beliefs and assumptions of Gogo only as of the date of this presentation and Gogo undertakes no obligation to update or revise publicly any such forward-looking statements, whether as a result of new information, future events or otherwise. As such, Gogo’s future results may vary from any expectations or goals expressed in, or implied by, the forward-looking statements included in this presentation, possibly to a material degree. Gogo cannot assure you that the assumptions made in preparing any of the forward-looking statements will prove accurate or that any long-term financial or operational goals and targets will be realized. In particular, the availability and performance of certain technology solutions yet to be implemented by the Company set forth in this presentation represent aspirational long-term goals based on current expectations. For a discussion of some of the important factors that could cause Gogo’s results to differ materially from those expressed in, or implied by, the forward-looking statements included in this presentation, investors should refer to the disclosure contained under the headings “Risk Factors” and “Cautionary Note Regarding Forward-Looking Statements” in the Company’s Annual Report on Form 10-K. Note to Certain Operating and Financial Data In addition to disclosing financial results that are determined in accordance with U.S. generally accepted accounting principles (“GAAP”), Gogo also discloses in this presentation certain non-GAAP financial information, including Adjusted EBITDA and Cash CapEx. These financial measures are not recognized measures under GAAP, and when analyzing our performance or liquidity, as applicable, investors should (i) use Adjusted EBITDA in addition to, and not as an alternative to, net loss attributable to common stock as a measure of operating results, and (ii) use Cash CAPEX in addition to, and not as an alternative to, consolidated capital expenditures when evaluating our liquidity. In addition, this presentation contains various customer metrics and operating data, including numbers of aircraft or units online, that are based on internal company data, as well as information relating to the commercial and business aviation market, and our position within those markets. While management believes such information and data are reliable, they have not been verified by an independent source and there are inherent challenges and limitations involved in compiling data across various geographies and from various sources.
TRANSFORMATIVE 2015 ü ü Half billion dollar revenue company 2Ku launched ü Introduced Gogo Biz 4G for Business Aviation ü Most advanced platform in the business
GOGO’S OPEN STRATEGY ü ü Gogo operating with an open architecture Greater assurance that our partners won’t be technologically trapped as the industry evolves ü Airline partners will have greater control over systems they choose and services they offer Flexibility to meet any connectivity need today and tomorrow ü
GOGO AND AMERICAN AIRLINES ü ü We value our partnership with American 800+ aircraft in 2Ku backlog ü 2Ku proposal will offer faster, cheaper, open-ended technology
GOGO TECHNOLOGICAL DEVELOPMENTS ü ü Backlog affirms the work and investment we have made to produce technological advantage Speed Powerful next gen modem capable of handling 400 Mbps to the plane ü Capacity Ku HTS capacity agreement with SES means cheaper bandwidth and lower costs for airlines and its customers
OPERATING AN “OPEN” SYSTEM ü ü 2Ku built on the redundancy of the Ku-band network of satellites Building technologies that enable our airline partners to easily upgrade when the time comes ü Built to leverage new Ku-band LEO (Low Earth Orbit) satellite constellations offering coverage and latency advantage
FUTURE READY & AHEAD OF THE CURVE ü Open architecture strategy benefits include better flexibility and risk management ü Open system approach for products and services: Portal development Entertainment products Connected aircraft services Digital platform for future products ü Airline partner can manage their technology risks by staying future ready and ahead of the curve
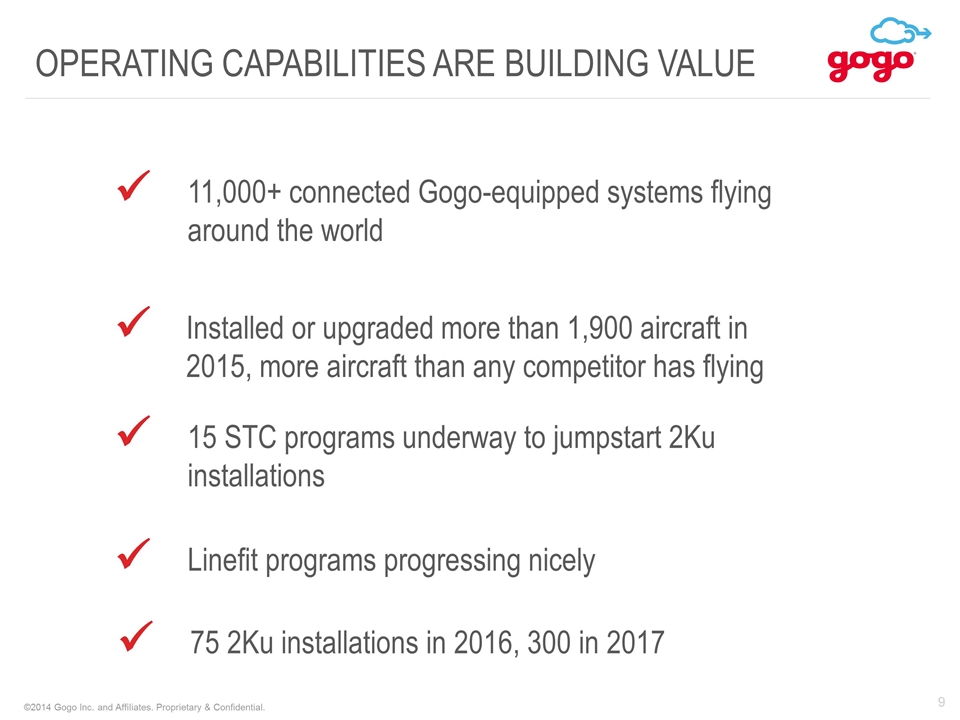
OPERATING CAPABILITIES ARE BUILDING VALUE ü ü 11,000+ connected Gogo-equipped systems flying around the world 15 STC programs underway to jumpstart 2Ku installations ü Installed or upgraded more than 1,900 aircraft in 2015, more aircraft than any competitor has flying ü Linefit programs progressing nicely ü 75 2Ku installations in 2016, 300 in 2017
THE CONNECTIVITY DECISION 10 ü Making the right decision matters to airlines a lot ü ATG keeps improving and will get even better with Gogo Biz 4G for BA and the prospects for next gen ATG ü Speed, adaptability and access to new technologies are the key differentiators ü Open architecture needed to take advantage of innovations ü Gogo is well-positioned and we expect more decisions and wins in 2016 ü Ku satellite service and 2Ku added to portfolio to serve aircraft needing next generation technology
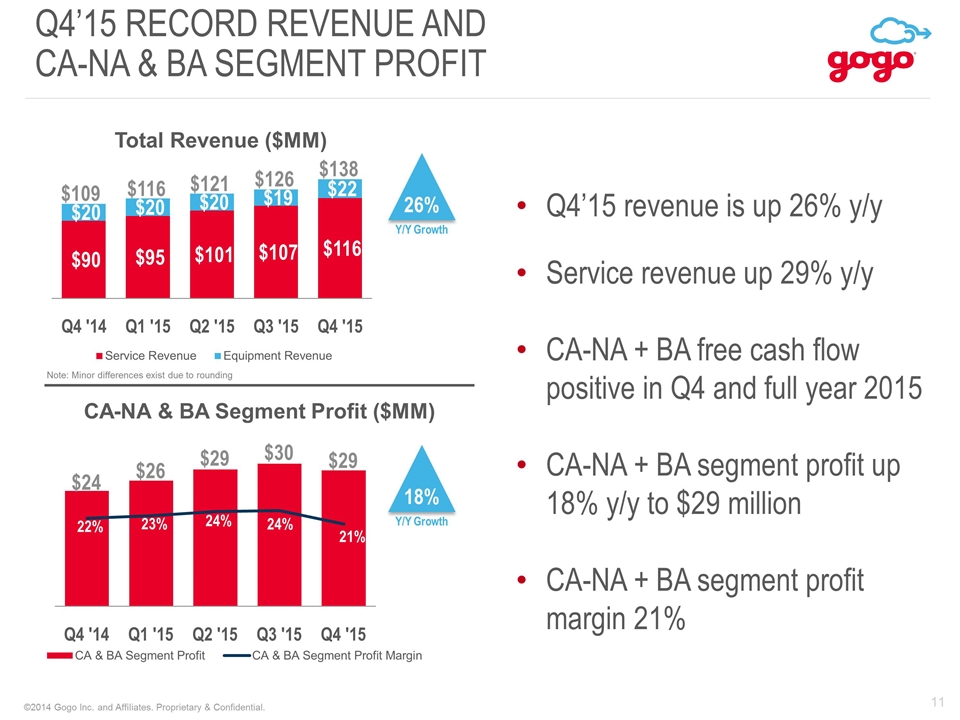
Q4’15 Record Revenue AND CA-NA & BA Segment profit 26% Y/Y Growth Q4’15 revenue is up 26% y/y Service revenue up 29% y/y CA-NA + BA free cash flow positive in Q4 and full year 2015 CA-NA + BA segment profit up 18% y/y to $29 million CA-NA + BA segment profit margin 21% 18% Y/Y Growth $121 $109 $116 Note: Minor differences exist due to rounding $126 $138
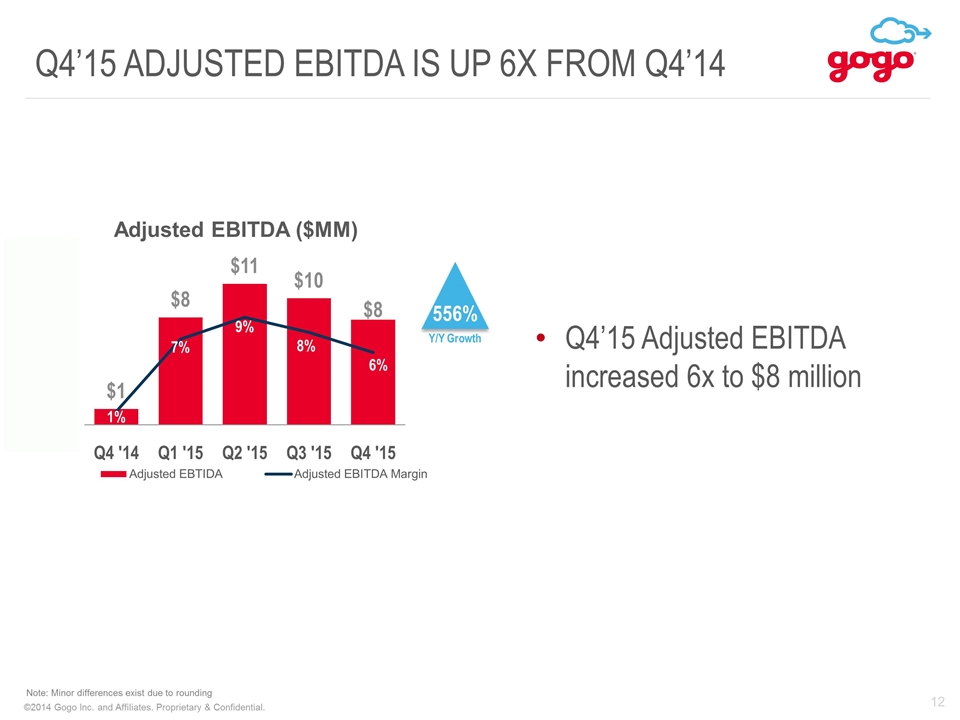
Q4’15 Adjusted ebitda is up 6x from Q4’14 12 556% Y/Y Growth Q4’15 Adjusted EBITDA increased 6x to $8 million Note: Minor differences exist due to rounding
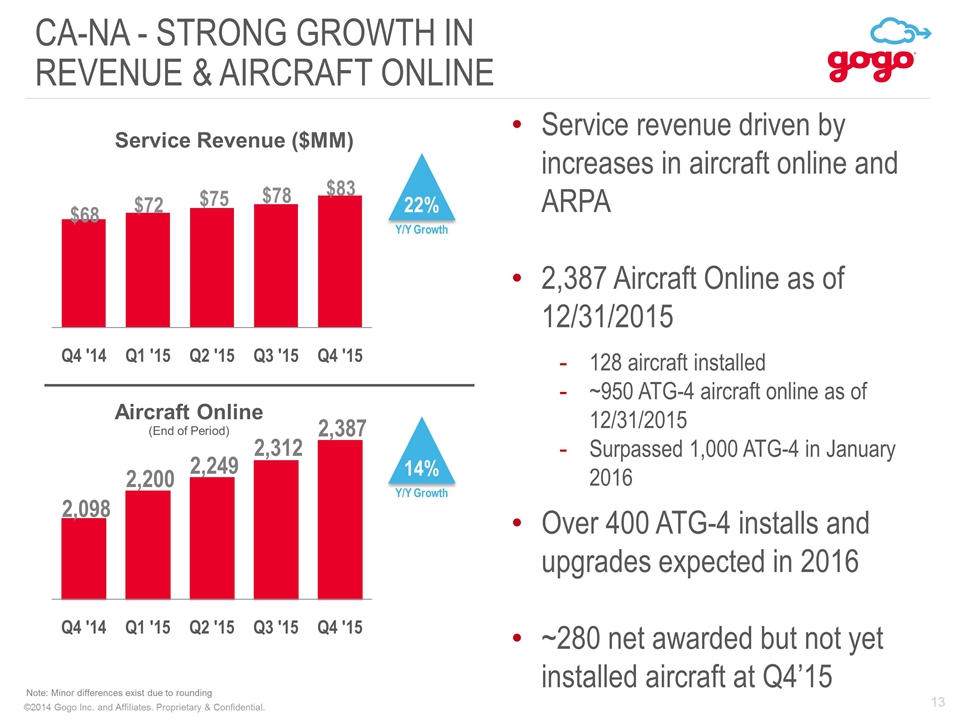
CA-NA - Strong GROWTH IN Revenue & AIRCRAFT ONLINE 22% Y/Y Growth Service revenue driven by increases in aircraft online and ARPA 2,387 Aircraft Online as of 12/31/2015 128 aircraft installed ~950 ATG-4 aircraft online as of 12/31/2015 Surpassed 1,000 ATG-4 in January 2016 Over 400 ATG-4 installs and upgrades expected in 2016 ~280 net awarded but not yet installed aircraft at Q4’15 14% Y/Y Growth Note: Minor differences exist due to rounding
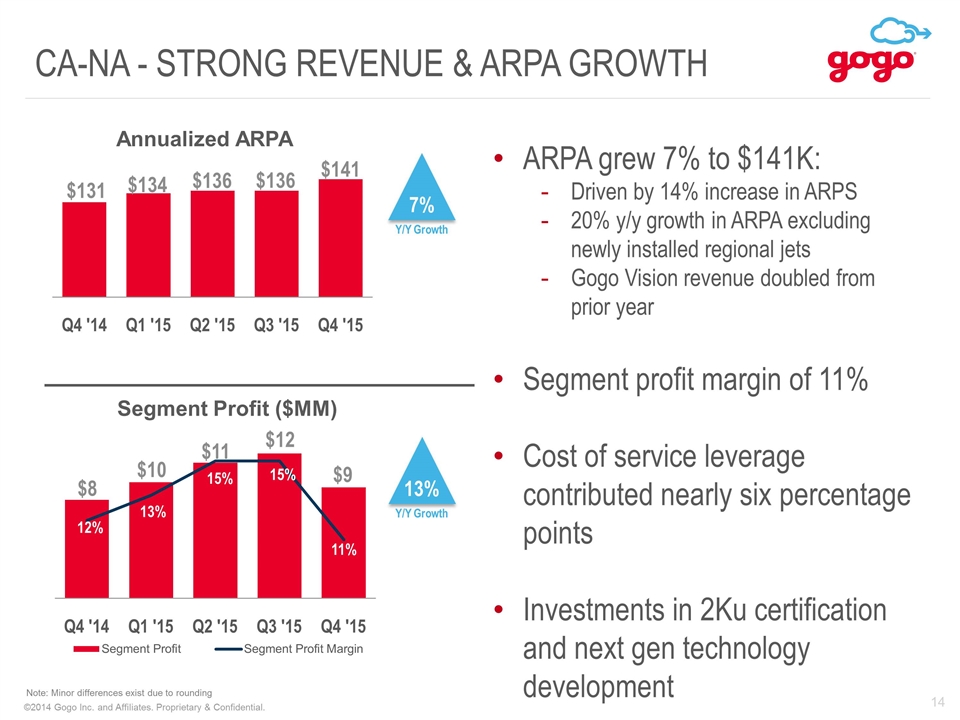
14 CA-NA - Strong Revenue & ARPA Growth 7% Y/Y Growth ARPA grew 7% to $141K: Driven by 14% increase in ARPS 20% y/y growth in ARPA excluding newly installed regional jets Gogo Vision revenue doubled from prior year Segment profit margin of 11% Cost of service leverage contributed nearly six percentage points Investments in 2Ku certification and next gen technology development Note: Minor differences exist due to rounding $131 $134 $136 $136 13% Y/Y Growth $141
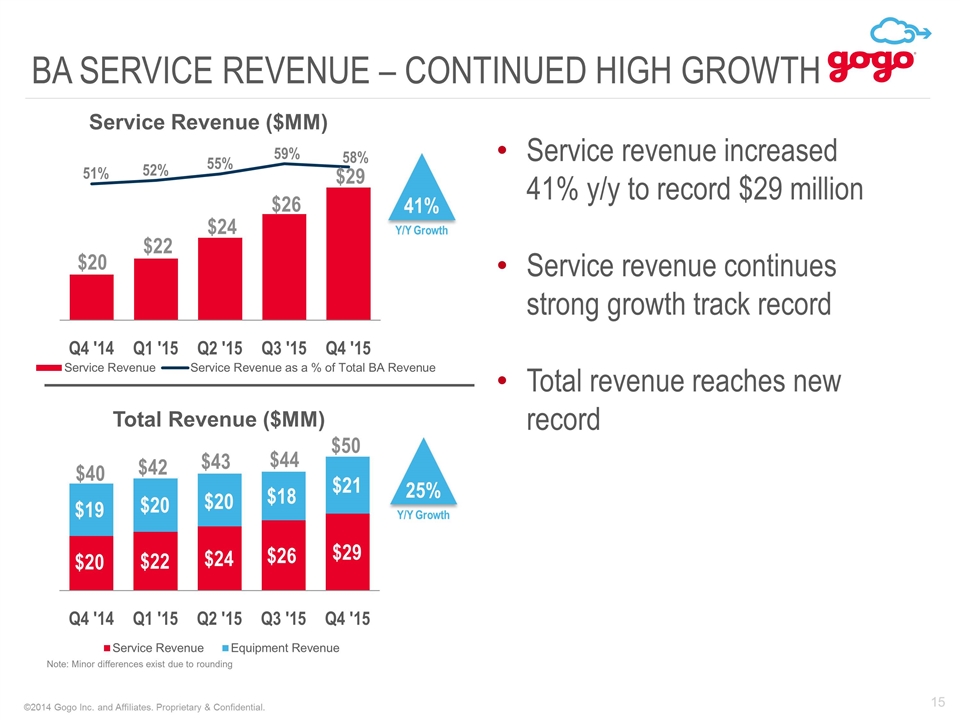
BA SERVICE Revenue – Continued High Growth Service revenue increased 41% y/y to record $29 million Service revenue continues strong growth track record Total revenue reaches new record 41% Y/Y Growth 51% 52% 55% 25% Y/Y Growth $43 $40 $42 Note: Minor differences exist due to rounding $44 59% 58% $50
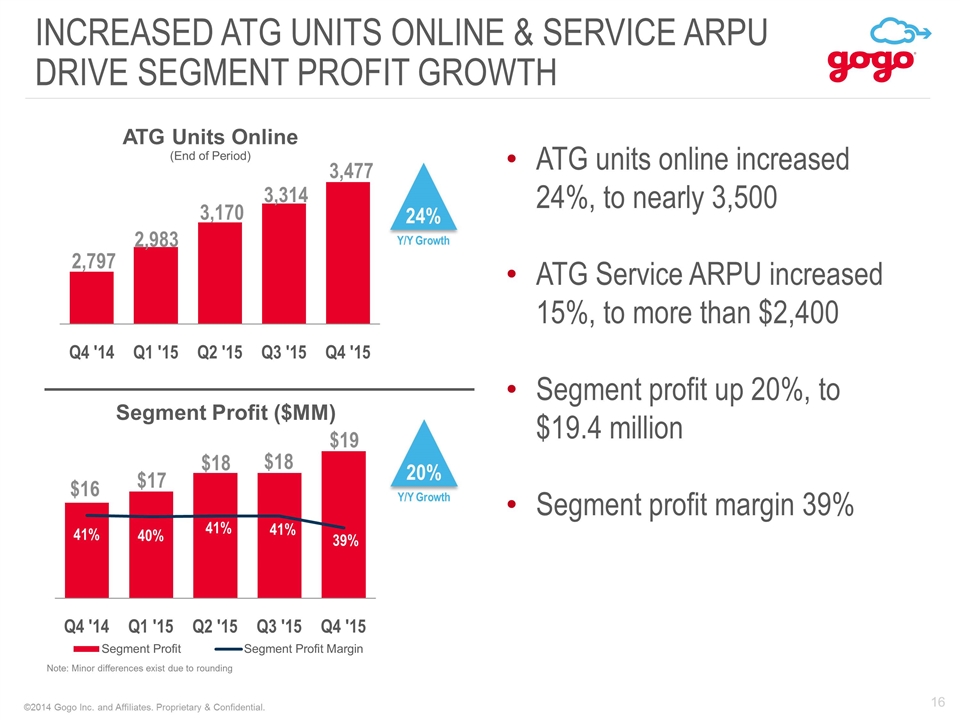
Increased ATG units online & SERVICE ARPU drive segment profit GROWTH ATG units online increased 24%, to nearly 3,500 ATG Service ARPU increased 15%, to more than $2,400 Segment profit up 20%, to $19.4 million Segment profit margin 39% 24% Y/Y Growth Note: Minor differences exist due to rounding 20% Y/Y Growth
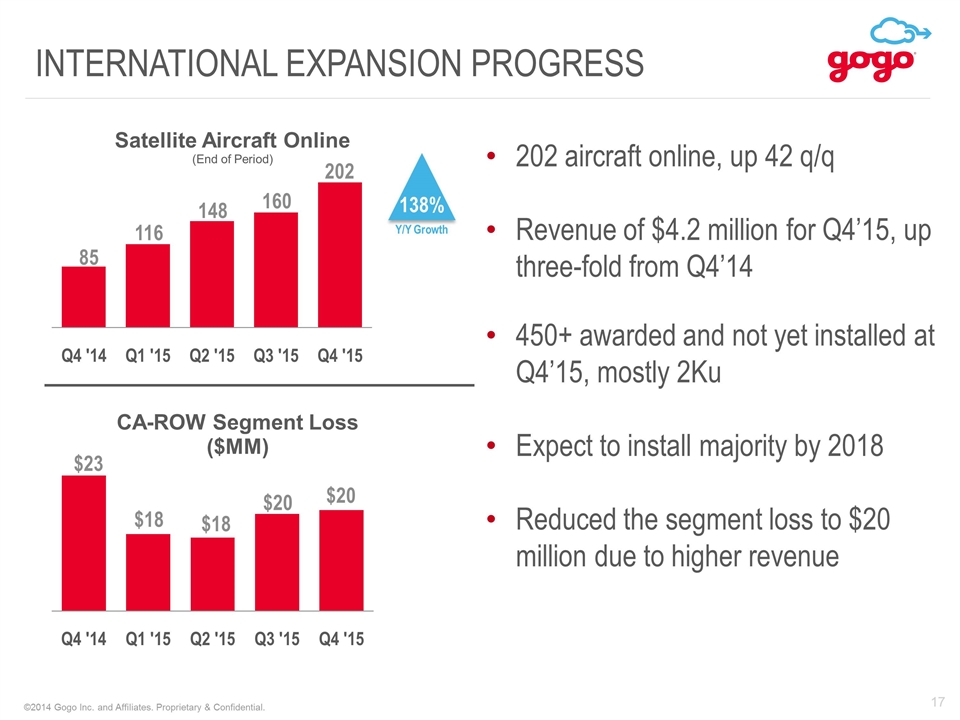
International Expansion PROGRESS 138% Y/Y Growth 202 aircraft online, up 42 q/q Revenue of $4.2 million for Q4’15, up three-fold from Q4’14 450+ awarded and not yet installed at Q4’15, mostly 2Ku Expect to install majority by 2018 Reduced the segment loss to $20 million due to higher revenue
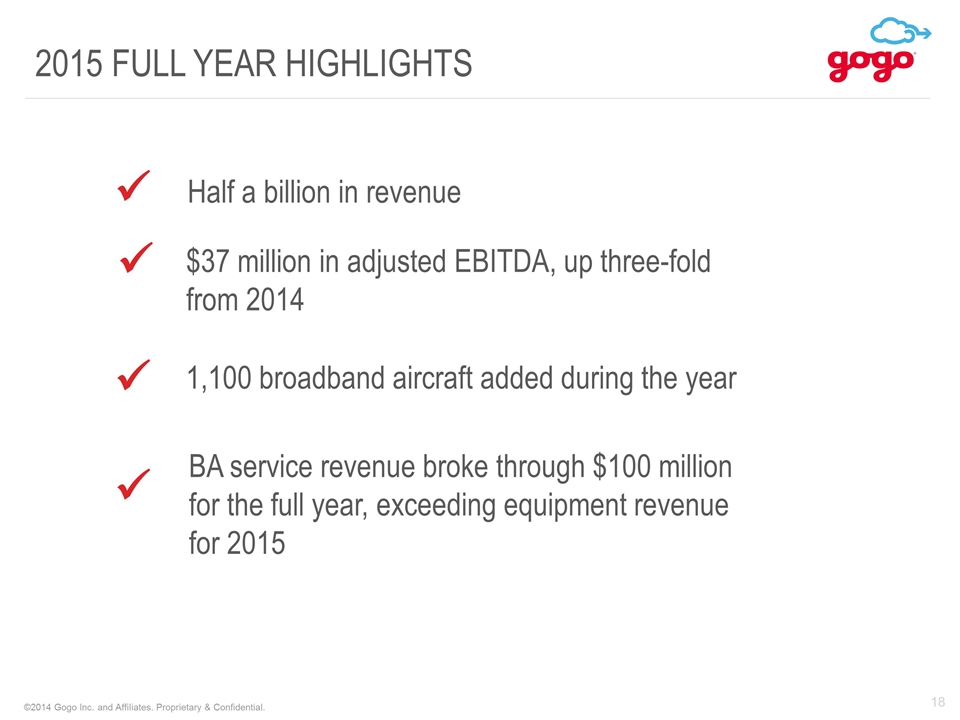
ü ü Half a billion in revenue 1,100 broadband aircraft added during the year ü $37 million in adjusted EBITDA, up three-fold from 2014 2015 FULL YEAR HIGHLIGHTS ü BA service revenue broke through $100 million for the full year, exceeding equipment revenue for 2015
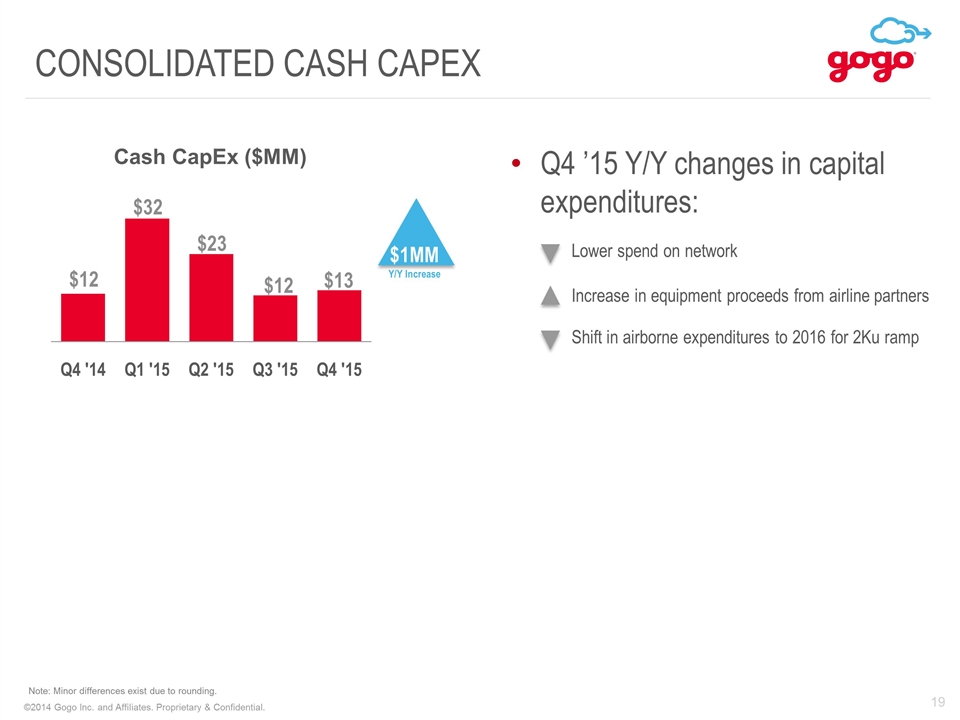
Consolidated Cash CAPEX Q4 ’15 Y/Y changes in capital expenditures: Lower spend on network Increase in equipment proceeds from airline partners Shift in airborne expenditures to 2016 for 2Ku ramp $1MM Y/Y Increase Note: Minor differences exist due to rounding.
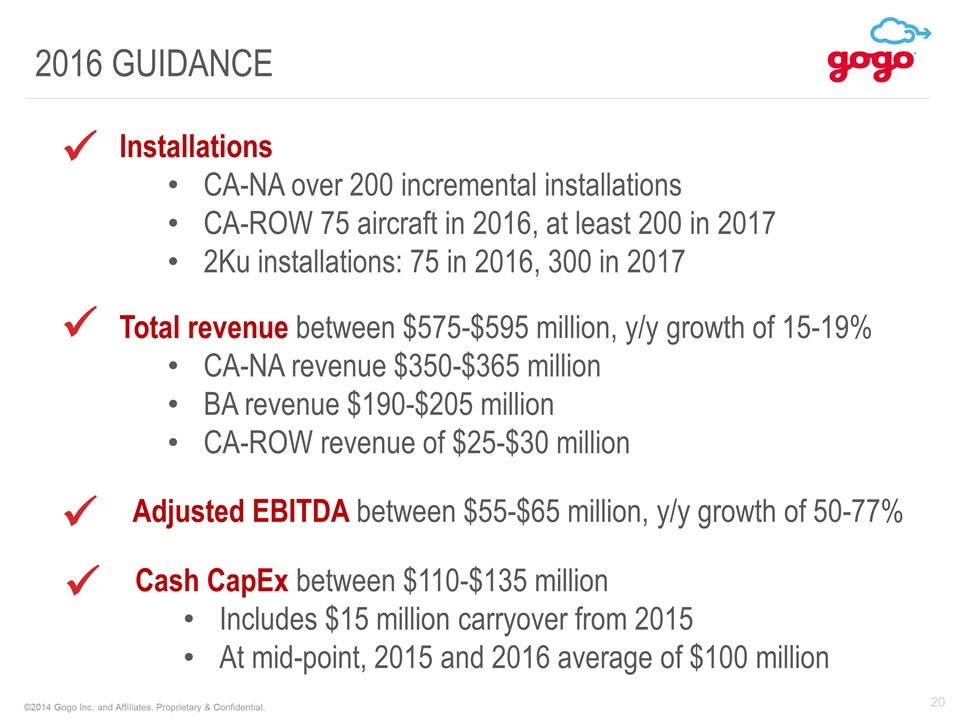
ü ü Adjusted EBITDA between $55-$65 million, y/y growth of 50-77% ü Installations CA-NA over 200 incremental installations CA-ROW 75 aircraft in 2016, at least 200 in 2017 2Ku installations: 75 in 2016, 300 in 2017 2016 GUIDANCE ü Cash CapEx between $110-$135 million Includes $15 million carryover from 2015 At mid-point, 2015 and 2016 average of $100 million Total revenue between $575-$595 million, y/y growth of 15-19% CA-NA revenue $350-$365 million BA revenue $190-$205 million CA-ROW revenue of $25-$30 million
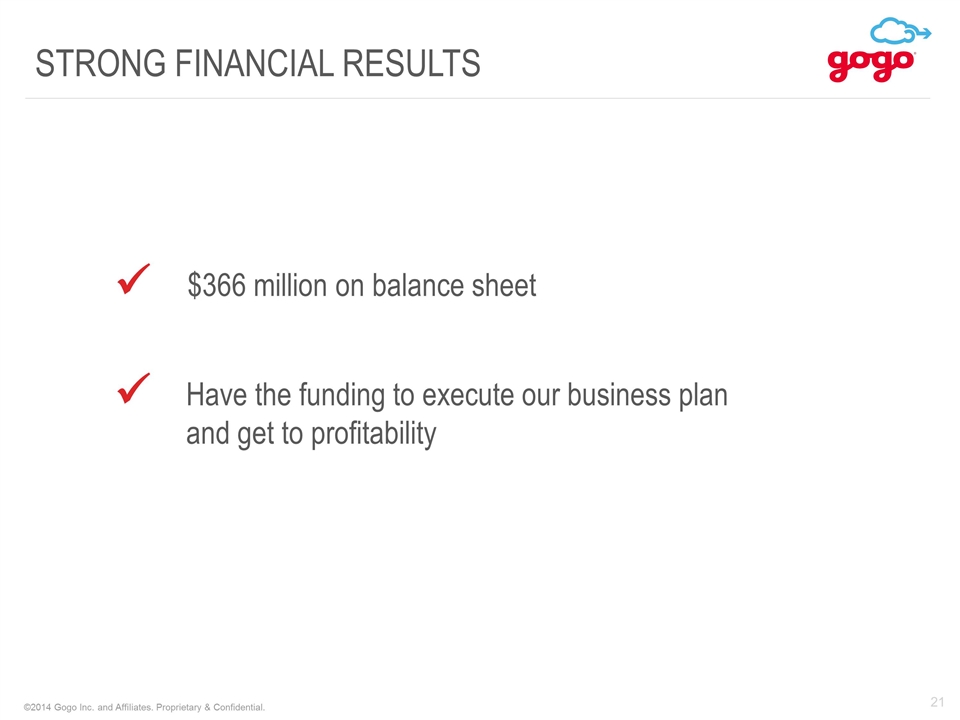
21 ü $366 million on balance sheet ü Have the funding to execute our business plan and get to profitability STRONG FINANCIAL RESULTS

Q&A
Appendix
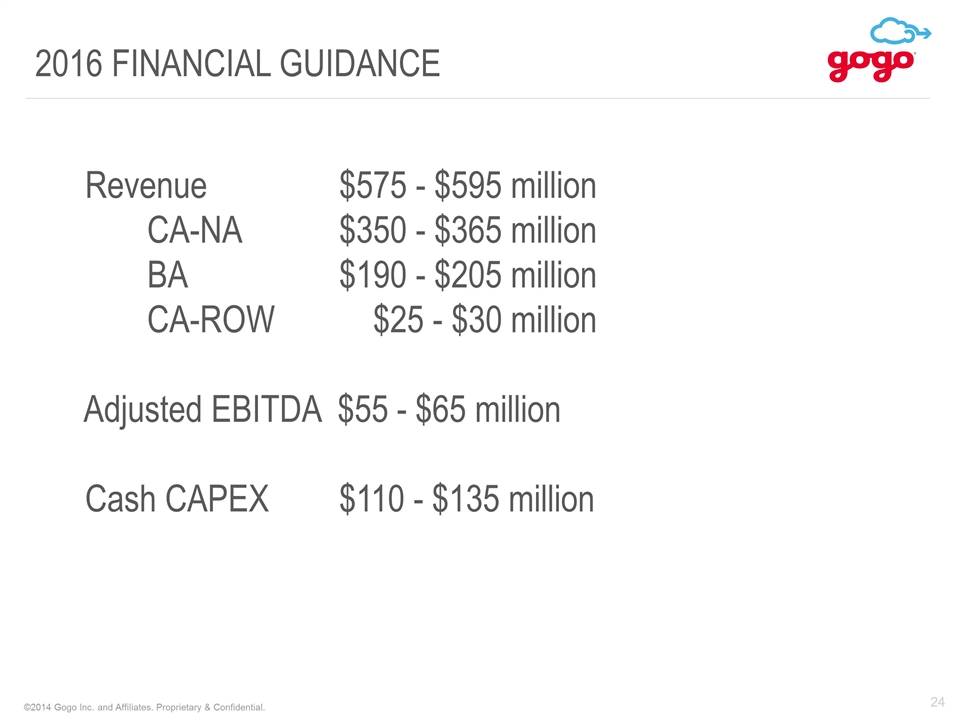
2016 FINANCIAL Guidance Revenue$575 - $595 million CA-NA$350 - $365 million BA$190 - $205 million CA-ROW $25 - $30 million Adjusted EBITDA $55 - $65 million Cash CAPEX$110 - $135 million
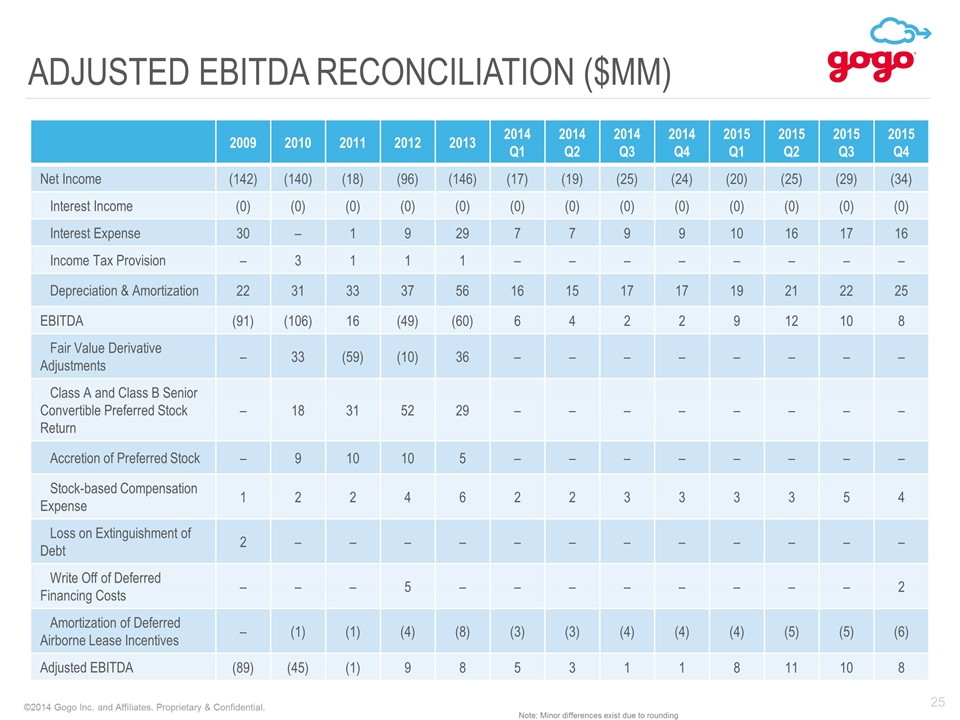
ADJUSTED EBITDA RECONCILIATION ($MM) 2009 2010 2011 2012 2013 2014 Q1 2014 Q2 2014 Q3 2014 Q4 2015 Q1 2015 Q2 2015 Q3 2015 Q4 Net Income (142) (140) (18) (96) (146) (17) (19) (25) (24) (20) (25) (29) (34) Interest Income (0) (0) (0) (0) (0) (0) (0) (0) (0) (0) (0) (0) (0) Interest Expense 30 – 1 9 29 7 7 9 9 10 16 17 16 Income Tax Provision – 3 1 1 1 – – – – – – – – Depreciation & Amortization 22 31 33 37 56 16 15 17 17 19 21 22 25 EBITDA (91) (106) 16 (49) (60) 6 4 2 2 9 12 10 8 Fair Value Derivative Adjustments – 33 (59) (10) 36 – – – – – – – – Class A and Class B Senior Convertible Preferred Stock Return – 18 31 52 29 – – – – – – – – Accretion of Preferred Stock – 9 10 10 5 – – – – – – – – Stock-based Compensation Expense 1 2 2 4 6 2 2 3 3 3 3 5 4 Loss on Extinguishment of Debt 2 – – – – – – – – – – – – Write Off of Deferred Financing Costs – – – 5 – – – – – – – – 2 Amortization of Deferred Airborne Lease Incentives – (1) (1) (4) (8) (3) (3) (4) (4) (4) (5) (5) (6) Adjusted EBITDA (89) (45) (1) 9 8 5 3 1 1 8 11 10 8 Note: Minor differences exist due to rounding
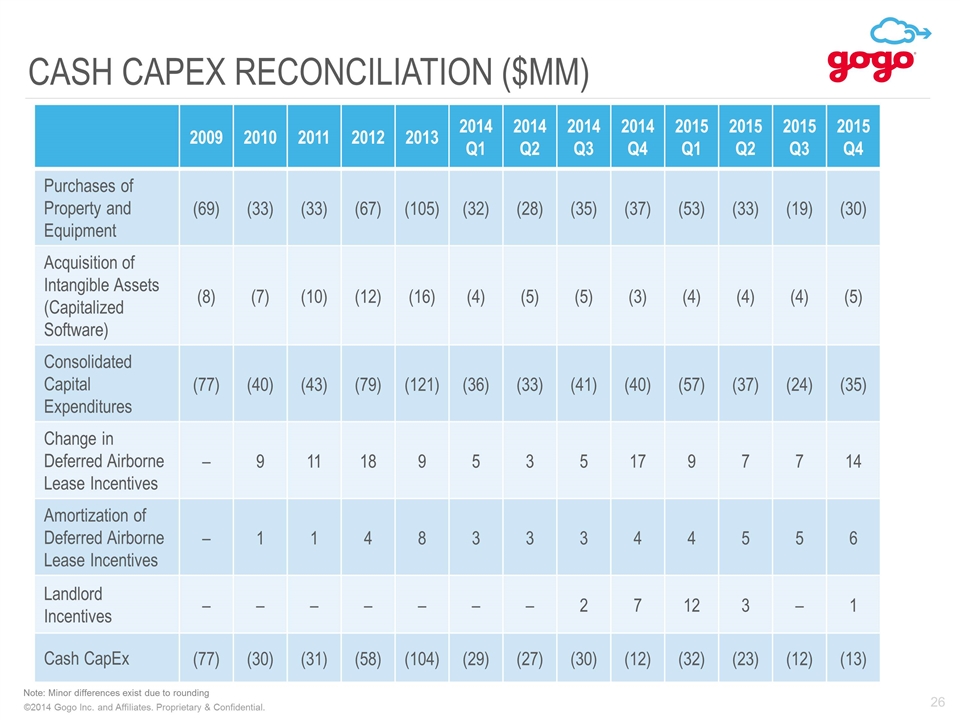
CASH CAPEX RECONCILIATION ($MM) 2009 2010 2011 2012 2013 2014 Q1 2014 Q2 2014 Q3 2014 Q4 2015 Q1 2015 Q2 2015 Q3 2015 Q4 Purchases of Property and Equipment (69) (33) (33) (67) (105) (32) (28) (35) (37) (53) (33) (19) (30) Acquisition of Intangible Assets (Capitalized Software) (8) (7) (10) (12) (16) (4) (5) (5) (3) (4) (4) (4) (5) Consolidated Capital Expenditures (77) (40) (43) (79) (121) (36) (33) (41) (40) (57) (37) (24) (35) Change in Deferred Airborne Lease Incentives – 9 11 18 9 5 3 5 17 9 7 7 14 Amortization of Deferred Airborne Lease Incentives – 1 1 4 8 3 3 3 4 4 5 5 6 Landlord Incentives – – – – – – – 2 7 12 3 – 1 Cash CapEx (77) (30) (31) (58) (104) (29) (27) (30) (12) (32) (23) (12) (13) Note: Minor differences exist due to rounding
