Attached files
| file | filename |
|---|---|
| 8-K - 8-K - CALIFORNIA WATER SERVICE GROUP | a16-5088_28k.htm |
| EX-99.1 - EX-99.1 - CALIFORNIA WATER SERVICE GROUP | a16-5088_2ex99d1.htm |
Exhibit 99.2
Year End 2015 Earnings Call Presentation CALIFORNIA WATER SERVICE GROUP February 25, 2016
Forward-Looking Statements This presentation contains forward-looking statements within the meaning established by the Private Securities Litigation Reform Act of 1995 ("Act"). The forward-looking statements are intended to qualify under provisions of the federal securities laws for "safe harbor" treatment established by the Act. Forward-looking statements are based on currently available information, expectations, estimates, assumptions and projections, and management's judgment about the California drought and its effect on the Company. Words such as would, expects, intends, plans, believes, estimates, assumes, anticipates, projects, predicts, forecasts or variations of such words or similar expressions are intended to identify forward-looking statements. The forward-looking statements are not guarantees of future performance. They are subject to uncertainty and changes in circumstances. Actual results may vary materially from what is contained in a forward-looking statement. Factors that may cause a result different than expected or anticipated include, but are not limited to: governmental and regulatory commissions' decisions; amount of capital allowed in the General Rate Case; changes in regulatory commissions' policies and procedures; the timeliness of regulatory commissions' actions concerning rate relief; eminent domain actions affecting our water systems; electric power interruptions; the ability to successfully implement conservation measures; changes in customer water use patterns; the impact of weather and climate on water sales and operating results; and, other risks and unforeseen events. When considering forward-looking statements, you should keep in mind the cautionary statements included in this paragraph, as well as the annual 10-K, Quarterly 10-Q, and other reports filed from time-to-time with the Securities and Exchange Commission (SEC). The Company assumes no obligation to provide public updates of forward-looking statements. 2
Today’s Participants Marty Kropelnicki President & CEO Tom Smegal Vice President, CFO & Treasurer 3
Presentation Overview Financial Results Financial Highlights 2014-2015 EPS Bridge Drought Update Regulatory Update Rate Base and ROE 2016 Potential Items of Interest 4
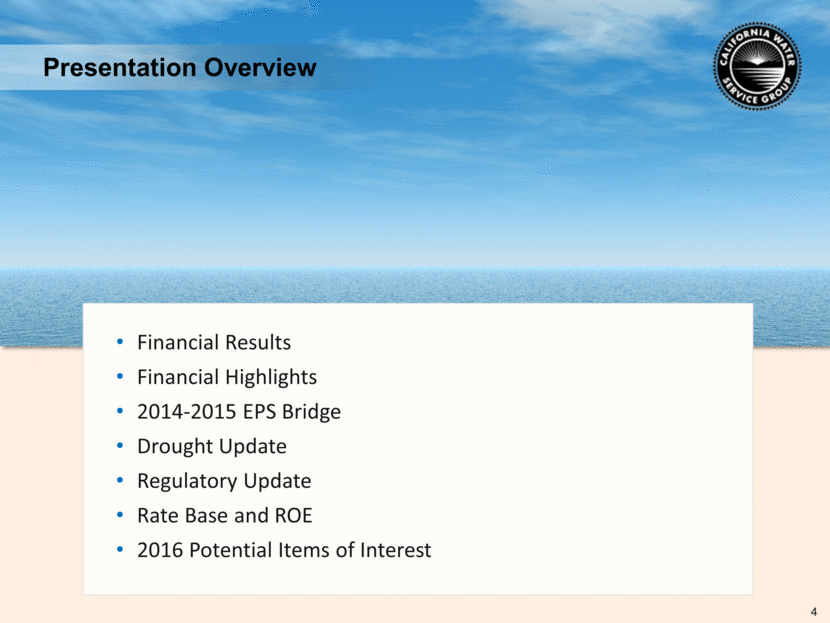
Financial Results 5 (amounts are in millions, except for EPS) 2015 2014 Variance Operating Revenue $588.4 $597.5 -1.5% Operations Expense 517.2 515.7 0.3% Income from Operations 71.2 81.8 -13.1% Other Income 1.1 1.8 -38.3% Net Interest 27.3 26.9 1.2% Net Income $45.0 $56.7 -20.7% EPS $0.94 $1.19 -20.7%
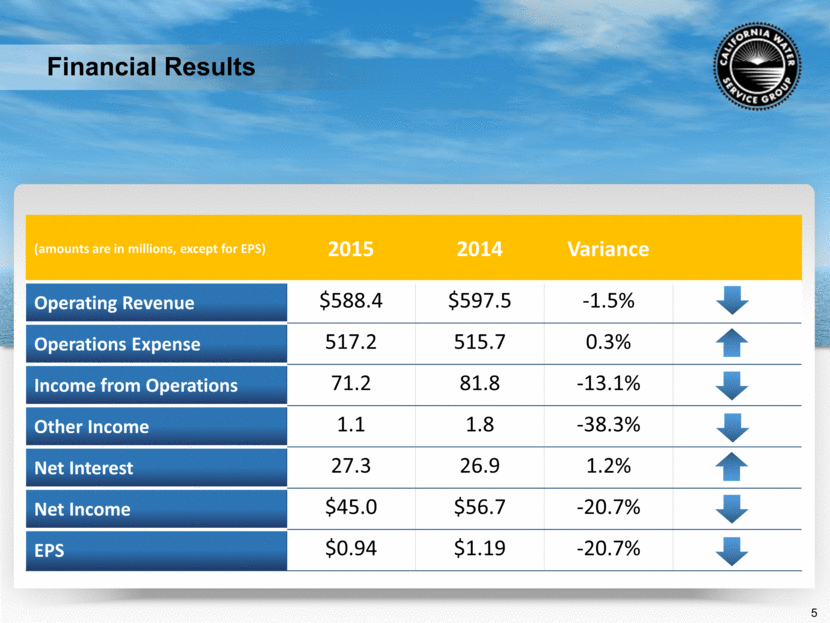
Financial Highlights Accrued unbilled revenue is excluded from revenue decoupling mechanisms- WRAM and MCBA Accrued unbilled revenue represents water used by customers but not yet billed to them. Accrued unbilled revenue is calculated by multiplying the number of days since the last bill times the average daily bill rendered in the preceding period. Customer bills vary based on usage, rate level, and rate design. As a result timing of water use at year end can affect comparison of year to year results. Changes in accrued unbilled revenue reduced net income $4.9 million in 2015 compared to 2014. Revenue increased $6.8 million in 2014 due to a warm dry December 2014 as compared to December 2013 as well as the effect of higher service charges adopted in the 2014 California rate case decision. Revenue decreased $0.5 million in 2015 due to a cool wet December 2015 as compared to December 2014. Tax benefits of $4.8 million received in 2014 did not recur in 2015 which reduced net income by the same amount. Incremental drought expenses of $4.4 million reduced net income by $2.8 million. The expense is tracked in an authorized memorandum account and expected to be recovered in a future period. Maintenance costs increased $1.6 million due to mains and service repairs which reduced net income by $1 million. Maintenance activities increased due to drought-related efforts to fix leaks the day they are discovered. 6
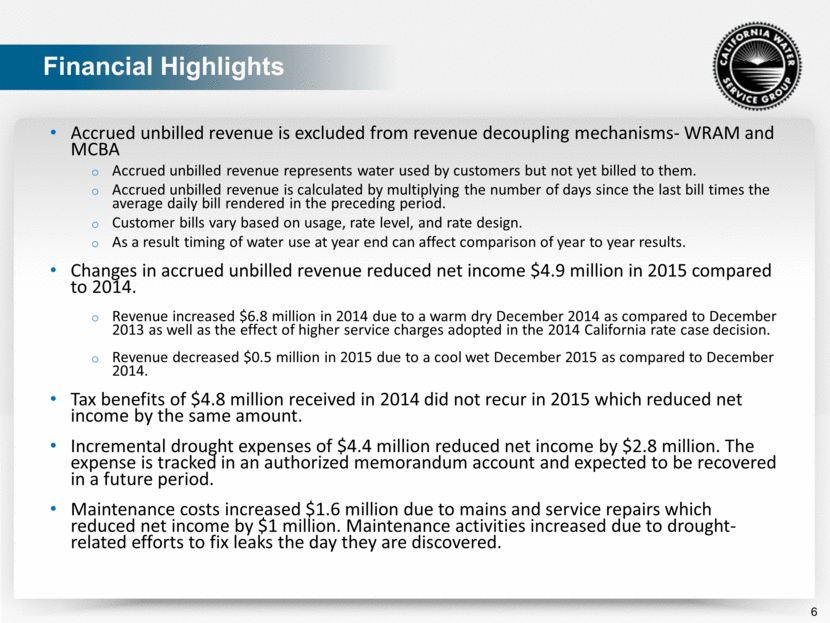
EPS Bridge 2014 to 2015 -$0.06 -$0.10 -$0.10 -$0.02 $0.03 7
Financial Highlights Over $177 million capital improvements, exceeding 2014 by 34%. Resulting rate base growth will drive an increase in net income over the long term Despite significant reductions in sales, WRAM receivable declined 10.2% to $40.6 million thanks to drought rate design The Company completed a successful debt offering in the fourth quarter and a replacement of its syndicated credit facilities in the first quarter New long term debt of $100 million in 4th quarter 2015 and commitment for $50 million additional in Q1 2016 Company now has $450 million revolving credit facilities These financing events provide liquidity necessary to continue planned investment programs over the next several years The Company continues to maintain a strong credit rating (A+ stable and AA- for first mortgage bonds) (reviewed and affirmed by Standard and Poor’s in February 2016) and strong balance sheet See the Forward-Looking Statements for factors which could cause actual results to differ materially from the expectations presented here. 8
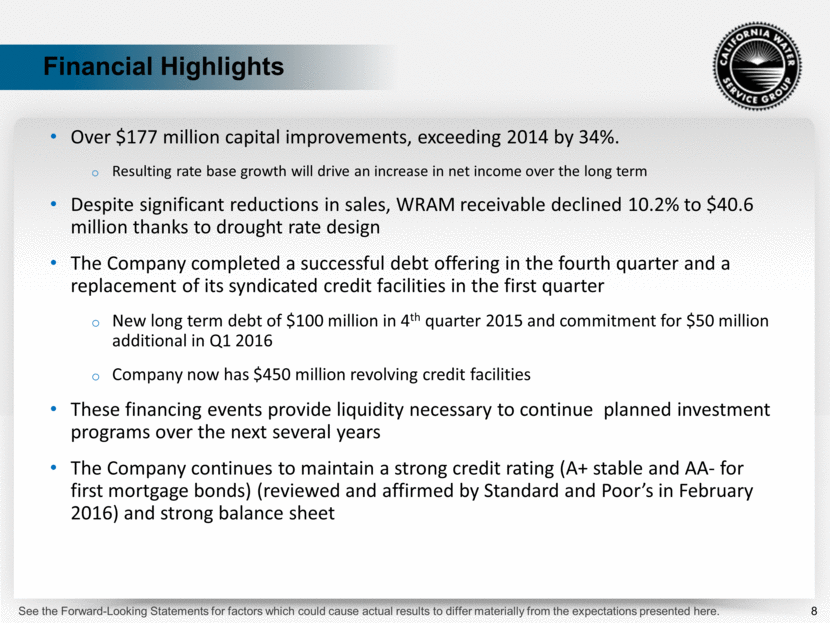
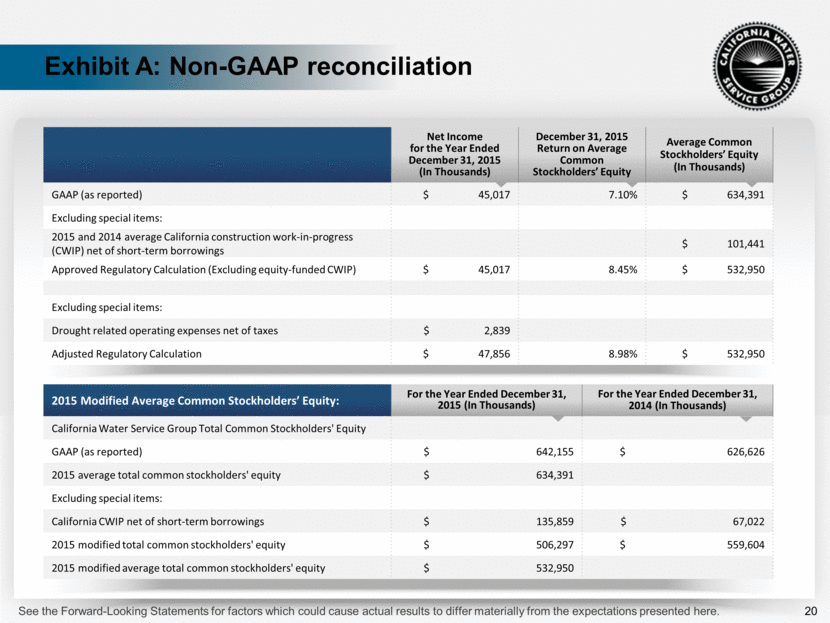
Return on Equity Reconciliation 2015 California Adopted* Return on Equity 9.43% GAAP ROE Achieved 7.10% Regulatory ROE Achieved (Excludes equity-funded CWIP**) 8.45% Adjusted Regulatory ROE (Excludes drought expenses) 8.98% *Other states adopted ROEs vary but do not affect overall CWT adopted ROE **Construction Work in Progress is excluded from Rate Base. Instead, the Company incorporates interest during construction into project costs once they are completed and in service. 9 Regulatory ROE and Adjusted Regulatory ROE are not calculated in accordance with GAAP and exclude the special items noted above. See Exhibit A for a reconciliation of regulatory ROE and Adjusted Regulatory ROE to reported GAAP ROE.
Drought Update California potentially entering 5th year of drought Strong precipitation in December 2015 and January 2016 followed by dry February Rainy season lasts through April - El Nino conditions may yet help Mandatory conservation expected to continue at least through October 2016 Cal Water has strong supply with redundancy, backup supplies, and deep wells Cal Water philosophy and relationships enable us to continue “bold” drought response in line with CPUC direction Cal Water continued to meet customer service standards despite increased call volume and talk time due to drought questions 10 See the Forward-Looking Statements for factors which could cause actual results to differ materially from the expectations presented here.
Drought – Financial Effects Muted by Regulatory Mechanisms Cal Water’s customers achieved a net water use reduction of 28.6% in 2015, exceeding the state’s 25% target Cal Water has been “decoupled” (sales and production cost changes effects on covered earnings are minimized) since 2008 with WRAM Change in unbilled revenue accrual is outside the WRAM and affects earnings Drought costs recorded for future recovery – $0.06 EPS impact in 2015 due to drought costs of $4.4 million Recovery requires a regulatory review which we expect to request later in 2016 Customer surcharges reduce WRAM receivable balance With the cash flow benefit of $36.9 million of drought surcharges, WRAM balance was $40.6 million at year end, a reduction of $4.6 million or 10.2% Recently adopted Sales Reconciliation Mechanism (SRM) will also help reduce receivable balances Due to conservation, SRM raised base rates in nearly all California districts in 2016, potentially improving cash flows 11 See the Forward-Looking Statements for factors which could cause actual results to differ materially from the expectations presented here.
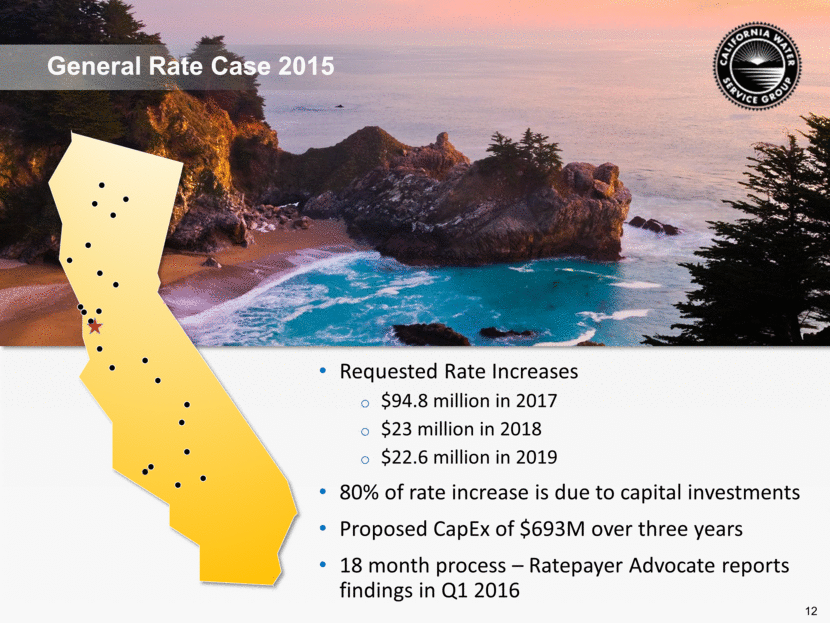
General Rate Case 2015 Requested Rate Increases $94.8 million in 2017 $23 million in 2018 $22.6 million in 2019 80% of rate increase is due to capital investments Proposed CapEx of $693M over three years 18 month process – Ratepayer Advocate reports findings in Q1 2016 12
General Rate Case 2015 Capital Expenditure Detail Cal Water owns more than 6,000 miles of main Proposing to strengthen main replacement program 300 year cycle 200 year cycle Most CA peers at 100-150 year cycle Water supply reliability (tanks, wells, brackish desalination study) Policy Change Requested Include Construction Work in Progress in rate base, excluding future Interest During Construction from plant in service balances One-time effect would add $80 million to rate base in 2017 if approved Potential increased net income of $4 million or $0.08 if approved 13 See the Forward-Looking Statements for factors which could cause actual results to differ materially from the expectations presented here.
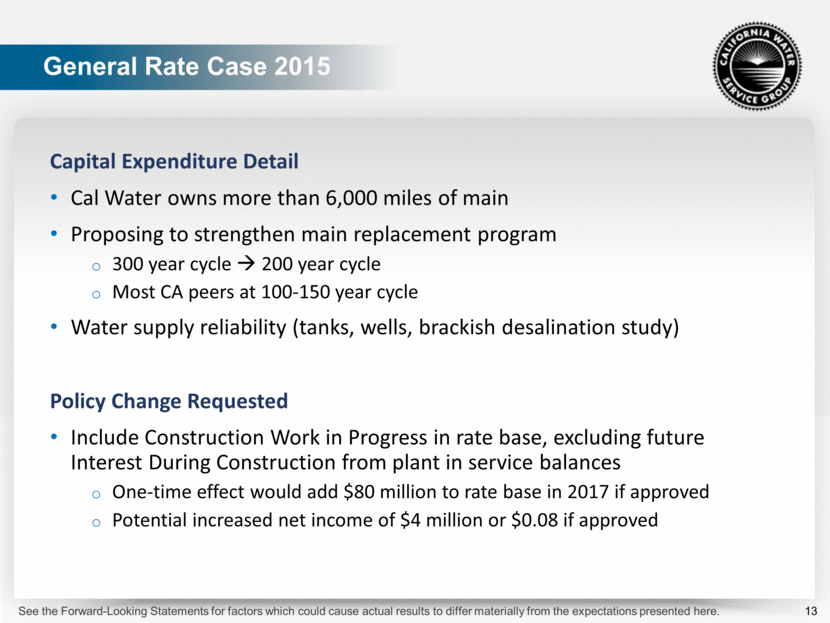
Capital Investment History and Projection in millions *2016-2018 amounts are based upon Company projections including 2015 California Rate Case filing estimates. Actual capital investment will vary depending on the outcome and timing of the GRC. CAGR = 12% (2007-2018) 14 See the Forward-Looking Statements for factors which could cause actual results to differ materially from the expectations presented here.
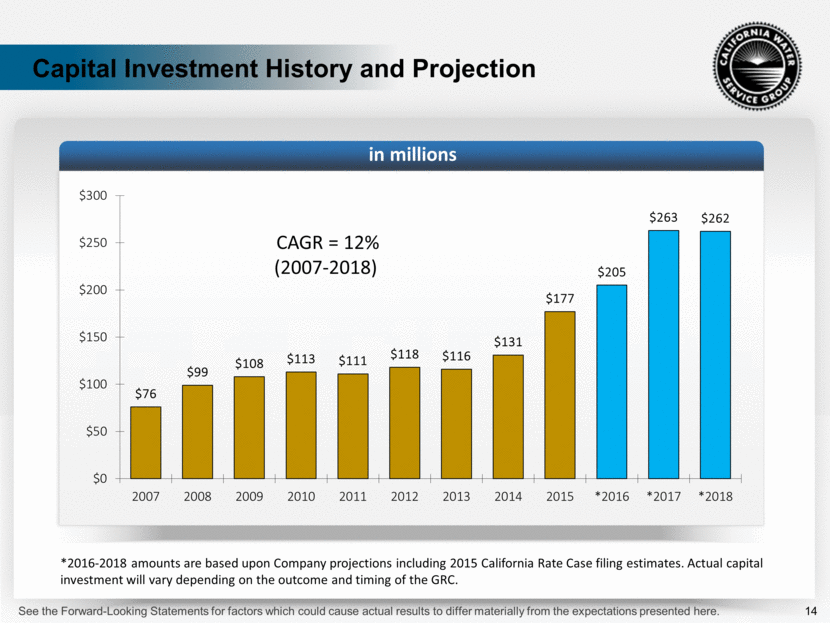
Regulated Rate Base of CWT Amounts in Millions *2016 figure reflects adopted rate base at the beginning of the year, which may change due to regulatory filings. 2017 and 2018 estimates reflect values from the 2015 California GRC filing and will change based on regulatory outcomes. 15 See the Forward-Looking Statements for factors which could cause actual results to differ materially from the expectations presented here.
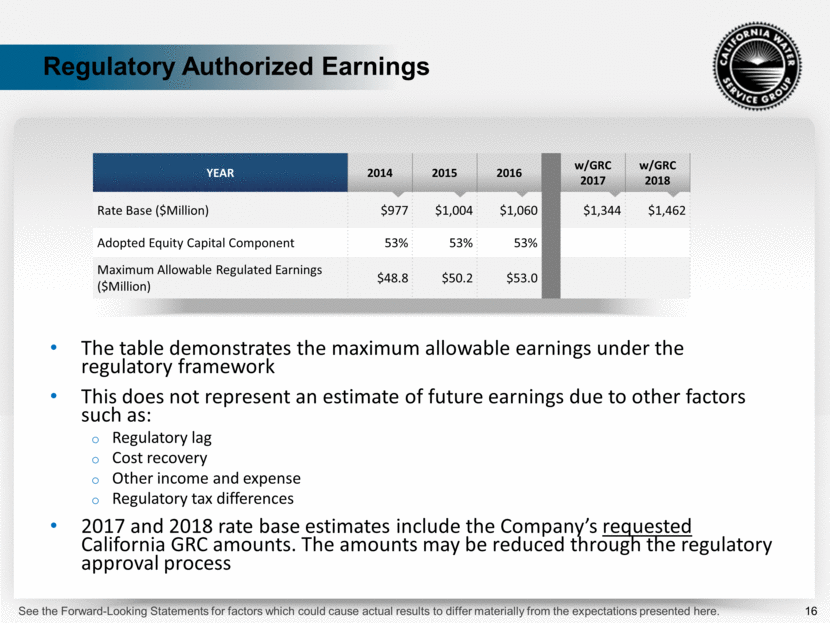
Regulatory Authorized Earnings The table demonstrates the maximum allowable earnings under the regulatory framework This does not represent an estimate of future earnings due to other factors such as: Regulatory lag Cost recovery Other income and expense Regulatory tax differences 2017 and 2018 rate base estimates include the Company’s requested California GRC amounts. The amounts may be reduced through the regulatory approval process YEAR 2014 2015 2016 w/GRC 2017 w/GRC 2018 Rate Base ($Million) $977 $1,004 $1,060 $1,344 $1,462 Adopted Equity Capital Component 53% 53% 53% Maximum Allowable Regulated Earnings ($Million) $48.8 $50.2 $53.0 16 See the Forward-Looking Statements for factors which could cause actual results to differ materially from the expectations presented here.
What to Look for in 2016 Continued drought conditions and mandatory restrictions Delays in recovering incremental drought costs may impact net income Pattern of water use may continue to affect accrued unbilled revenue Based on current conditions we expect drought expenses to reduce EPS by $0.05-$0.10 in 2016, to be recovered via drought memorandum account at a later date 3rd year of California GRC cycle Limited rate relief ($5 million escalation increases plus miscellaneous advice letter filings) Period of greatest lag in cost recovery 2015 Tax Rate 36%; estimated 2016 Tax Rate 38% Target CapEx for 2016 $180-210 million, subject to adjustment pending regulatory approvals 17 See the Forward-Looking Statements for factors which could cause actual results to differ materially from the expectations presented here.
DISCUSSION

Exhibit A: Explanation of Use of Certain Unaudited non-GAAP Measures The Company’s management uses certain non-GAAP measures to evaluate the Company’s performance. Management believes these measures provide useful information and are a better indicator of the Company’s core operating activities. Regulated Return on Equity (Regulated ROE) may not be comparable to similarly titled measures used by other companies. The accompanying tables provide a reconciliation of reported GAAP ROE to Regulated ROE and Adjusted Regulated ROE adjusting for certain factors that the company excludes in determining its performance. The reconciling adjustment from GAAP ROE to Regulatory ROE is the removal of equity that supports construction work in progress (CWIP). None of the regulated subsidiaries of the company is allowed to earn a regulated return on CWIP. Management excludes CWIP from its Regulated ROE so that it can evaluate performance against the ROE included in its regulated ratemaking. The Company excludes certain large temporary revenues or expenses from its analysis of Adjusted Regulated ROE. In 2015, the Company presents an Adjusted Regulated ROE excluding the direct incremental costs of responding to the California drought emergency. Management expects that regulatory mechanisms will provide recovery of these expenses in the future. These expenses are excluded from Adjusted Regulated ROE so that management can determine performance excluding differences related to timing of expense recovery. 19
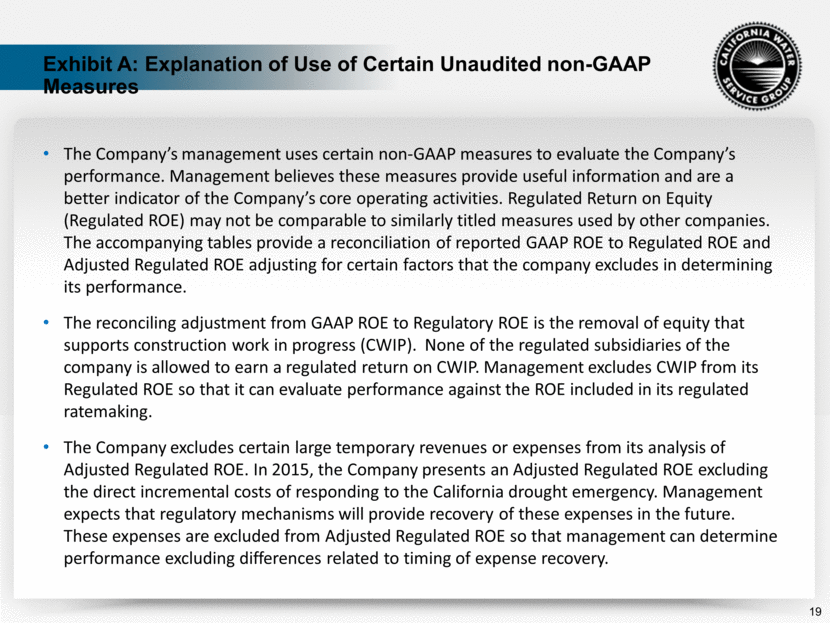
Exhibit A: Non-GAAP reconciliation 20 See the Forward-Looking Statements for factors which could cause actual results to differ materially from the expectations presented here. Net Income for the Year Ended December 31, 2015 (In Thousands) December 31, 2015 Return on Average Common Stockholders’ Equity Average Common Stockholders’ Equity (In Thousands) GAAP (as reported) $ 45,017 7.10% $ 634,391 Excluding special items: 2015 and 2014 average California construction work-in-progress (CWIP) net of short-term borrowings $ 101,441 Approved Regulatory Calculation (Excluding equity-funded CWIP) $ 45,017 8.45% $ 532,950 Excluding special items: Drought related operating expenses net of taxes $ 2,839 Adjusted Regulatory Calculation $ 47,856 8.98% $ 532,950 2015 Modified Average Common Stockholders’ Equity: For the Year Ended December 31, 2015 (In Thousands) For the Year Ended December 31, 2014 (In Thousands) California Water Service Group Total Common Stockholders' Equity GAAP (as reported) $ 642,155 $ 626,626 2015 average total common stockholders' equity $ 634,391 Excluding special items: California CWIP net of short-term borrowings $ 135,859 $ 67,022 2015 modified total common stockholders' equity $ 506,297 $ 559,604 2015 modified average total common stockholders' equity $ 532,950
