Attached files
SECURITIES AND EXCHANGE COMMISSION
Washington, D.C. 20549
FORM 10-K
[ X ]ANNUAL REPORT PURSUANT TO SECTION 13 OR 15(d) OF THE
SECURITIES EXCHANGE ACT OF 1934
For the fiscal year ended December 31, 2015
[ ]TRANSITION REPORT PURSUANT TO SECTION 13 OR 15(d) OF
THE SECURITIES EXCHANGE ACT OF 1934
Commission File No. 0-18348
B/E AEROSPACE, INC.
(Exact name of registrant as specified in its charter)
|
Delaware (State or Other Jurisdiction of Incorporation or Organization) |
06-1209796 (I.R.S. Employer Identification No.) |
1400 Corporate Center Way
Wellington, Florida 33414
(Address of principal executive offices)
(561) 791-5000
(Registrant's telephone number, including area code)
Securities registered pursuant to Section 12(b) of the Act:
|
Title of each class Common Stock, $.01 Par Value |
Name of each exchange on which registered NASDAQ Stock Market LLC (NASDAQ Global Select Market) |
Securities registered pursuant to Section 12(g) of the Act: None
Indicate by check mark if the registrant is a well-known seasoned issuer, as defined in Rule 405 of the Securities Act.
Yes [X] No [ ]
Indicate by check mark if the registrant is not required to file reports pursuant to Section 13 or Section 15(d) of the Act.
Yes [ ] No [X]
Indicate by check mark whether the registrant (1) has filed all reports required to be filed by Section 13 or 15(d) of the Securities Exchange Act of 1934 during the preceding 12 months (or for such shorter period that the registrant was required to file such reports), and (2) has been subject to such filing requirements for the past 90 days.
Yes [X] No [ ]
Indicate by check mark whether the registrant has submitted electronically and posted on its corporate Web site, if any, every Interactive Data File required to be submitted and posted pursuant to Rule 405 of Regulation S-T (§ 232.405 of this chapter) during the preceding 12 months (or for such shorter period that the registrant was required to submit and post such files). Yes [X] No [ ]
Indicate by check mark if disclosure of delinquent filers pursuant to Item 405 of Regulation S-K (§ 229.405 of this chapter) is not contained herein, and will not be contained, to the best of the registrant's knowledge, in definitive proxy or information statements incorporated by reference in Part III of this Form 10-K or any amendment to this Form 10-K. [X ]
Indicate by check mark whether the registrant is a large accelerated filer, an accelerated filer, a non-accelerated filer, or a smaller reporting company. See the definitions of “large accelerated filer,” “accelerated filer” and “smaller reporting company” in Rule 12b-2 of the Exchange Act.
Large accelerated filer [X] Accelerated filer [ ] Non-accelerated filer (do not check if a smaller reporting company) [ ]
Smaller reporting company [ ]
Indicate by check mark whether the registrant is a shell company (as defined in Rule 12b-2 of the Exchange Act).
Yes [ ] No [X]
The aggregate market value of the registrant's voting stock held by non-affiliates was approximately $5,873 million on June 30, 2015 based on the closing sales price of the registrant's common stock as reported on the NASDAQ Global Select Market as of such date, which is the last business day of the registrant's most recently completed second fiscal quarter. Shares of common stock held by executive officers and directors have been excluded since such persons may be deemed affiliates. This determination of affiliate status is not a determination for any other purpose. The number of shares of the registrant's common stock, $.01 par value, outstanding as of February 23, 2016 was 102,110,278 shares.
DOCUMENTS INCORPORATED BY REFERENCE
Certain sections of the registrant's Proxy Statement to be filed with the Commission in connection with the 2016 Annual Meeting of Stockholders are incorporated by reference in Part III of this Form 10-K. With the exception of those sections that are specifically incorporated by reference in this Annual Report on Form 10-K, such Proxy Statement shall not be deemed filed as part of this Report or incorporated by reference herein.
1
CAUTIONARY STATEMENT REGARDING FORWARD-LOOKING STATEMENTS
The Private Securities Litigation Reform Act of 1995 provides a “safe harbor” for forward-looking statements to encourage companies to provide prospective information to investors. This Annual Report on Form 10-K (Form “10-K”) includes forward-looking statements that reflect our current expectations and projections about our future results, performance, prospects, liquidity, expenditures, payment of dividends and repurchase of shares. Forward-looking statements include all statements that are not historical in nature or are not current facts. We have tried to identify these forward-looking statements by using words including “anticipate,” “believe,” “continue,” “could,” “estimate,” “expect,” “intend,” “may,” “plan,” “should,” “will” and similar expressions. These forward-looking statements are subject to a number of risks, uncertainties, assumptions and other factors that could cause our actual results, performance, prospects and ability to pay dividends or repurchase stock to differ materially from those expressed in, or implied by, these forward-looking statements. These factors include the risks, uncertainties, assumptions and other factors discussed under the headings “Item 1A. Risk Factors,” as well as “Item 1. Business,” “Item 7. Management’s Discussion and Analysis of Financial Condition and Results of Operations” and elsewhere in this Form 10-K, including: future events that may have the effect of reducing our available operating income and cash balances, such as unexpected operating losses, the impact of rising fuel prices on our airline customers, outbreaks in national or international hostilities, terrorist attacks, prolonged health and environmental issues that reduce air travel demand, delays in, or unexpected costs associated with, the integration of our acquired businesses, conditions in the airline industry, conditions in the business jet industry, problems meeting customer delivery requirements, our success in winning new or expected refurbishment contracts from customers, capital expenditures, increased leverage, possible future acquisitions, facility closures, product transition costs, labor disputes involving us, our significant customers’ suppliers or airframe manufacturers, the impact of a prolonged global recession, the possibility of a write-down of intangible assets, delays or inefficiencies in the introduction of new products, fluctuations in currency exchange rates or our inability to properly manage our rapid growth.
In light of these risks and uncertainties, you are cautioned not to unduly rely on such forward-looking statements when evaluating the information presented herein. These statements should be considered only after carefully reading this entire Form 10-K. Except as required under the federal securities laws and rules and regulations of the Securities and Exchange Commission (“SEC”), we undertake no obligation to publicly update or revise any forward-looking statements, whether as a result of new information, future events or otherwise. Additional risks that we may currently deem immaterial or that are not presently known to us could also cause the forward-looking events discussed in this Form 10-K not to occur.
Unless otherwise indicated, the industry data contained in this Form 10-K is from the January/February 2016 issue of the Airline Monitor, December 2015 reports of the International Air Transport Association (“IATA”), FlightGlobal Fleets Analyzer or the Airbus and The Boeing Company (“Boeing”) corporate websites.
2
Our Company
General
Based on our experience in the industry, we believe we are the world’s largest manufacturer of cabin interior products for commercial aircraft and for business jets. We sell our products and provide our services directly to virtually all of the world’s major airlines and aerospace manufacturers. Also, based on our experience, we believe that we have achieved leading global market positions in each of our major product categories, which include:
|
· |
commercial aircraft seats, including an extensive line of super first class, first class, business class, tourist class and regional aircraft seats; |
|
· |
a full line of aircraft food and beverage preparation and storage equipment, including coffee and espresso makers, water boilers, beverage containers, refrigerators, freezers, chillers and a line of ovens that includes microwave, high efficiency convection and steam ovens; |
|
· |
modular lavatory systems, wastewater management systems and galley systems; |
|
· |
both chemical and gaseous aircraft oxygen storage, distribution and delivery systems, protective breathing equipment and a broad range of lighting products; and |
|
· |
business jet and general aviation interior products, including an extensive line of executive aircraft and helicopter seats, direct and indirect overhead lighting systems, exterior lighting systems, passenger and crew oxygen systems, air valve systems and high-end furniture and cabinetry. |
We provide comprehensive aircraft cabin interior reconfiguration, program management and certification services. In addition, we also design, engineer and manufacture customized fully integrated thermal and power management solutions for participants in the defense industry, aerospace original equipment manufacturers (“OEMs”) and the airlines.
Since our organization as a corporation in Delaware in 1987, we have substantially expanded the size, scope and nature of our business as a result of a number of acquisitions. Between 1989 and 2011, we completed 28 acquisitions associated with our continuing operations, for an aggregate purchase price of approximately $1.2 billion. We believe these acquisitions enabled us to position ourselves as a preferred global supplier to our customers. During this period we consolidated facilities and product lines, implemented lean manufacturing and continuous improvement programs and invested in our information technology. All of these efforts allowed us to continually improve our productivity and expand our operating margins.
In June 2014, the Company acquired the outstanding shares of the Emteq, Inc. group of companies, a domestic provider of aircraft interior and exterior lighting systems, as well as aircraft cabin management and power systems for a purchase price of $253.2 million, net of cash acquired. The Company also acquired the outstanding shares of the F+E Fischer + Entwicklungen GmbH & Co. KG group of companies, a leading Europe-based manufacturer of seating products for civilian helicopters for a purchase price of $211.7 million, net of cash acquired. The Company also acquired the outstanding shares of Wessex Advanced Switching Products Ltd., a company engaged in the production of lighting, control units and switches, based in Europe for a purchase price of $63.0 million, net of cash acquired. These acquisitions are included in the business jet segment.
3
On December 16, 2014 (the “Distribution Date”), we completed the spin-off of KLX Inc. (“KLX”) by means of the transfer of our Consumables Management Segment to KLX and the subsequent distribution to our stockholders of all the outstanding shares of KLX common stock (the “Spin-Off”). We retained our commercial aircraft and business jet segments. On the Distribution Date, each of our stockholders of record as of the close of business on December 5, 2014 (the “Record Date”) received one share of KLX common stock for every two shares of our common stock held as of the Record Date.
Our principal executive offices and corporate headquarters are located at 1400 Corporate Center Way, Wellington, Florida 33414-2105 and our telephone number is 561-791-5000.
Industry Overview
The commercial and business jet aircraft cabin interior products industries encompass a broad range of products and services, including aircraft seating, food and beverage preparation and storage systems, galley and interior monument systems, passenger and crew oxygen storage, oxygen distribution and delivery systems, lavatory systems, wastewater management systems, lighting systems, overhead bins, as well as interior reconfigurations and a variety of other engineering, design, integration, installation, retrofit and certification services.
Historically, the aircraft cabin interior products industry has derived revenues from five sources:
|
· |
New installation programs in which airlines purchase new equipment directly from interior equipment manufacturers. The airframe manufacturer receives the equipment and installs it on these newly produced aircraft prior to aircraft delivery; |
|
· |
Retrofit programs in which airlines purchase new interior furnishings and engineering services to upgrade the interiors of aircraft already in service; |
|
· |
Refurbishment programs in which airlines purchase components and services to improve the appearance and functionality of their cabin interior equipment; |
|
· |
Equipment to upgrade the functionality or appearance of the aircraft interior; and |
|
· |
Replacement spare parts. |
The retrofit and refurbishment cycles for commercial aircraft cabin interior products differ by product category. Aircraft seating typically has a refurbishment cycle of one to two years and a retrofit cycle of four to eight years. Food and beverage preparation and storage equipment is periodically upgraded or repaired, and requires a continual flow of spare parts, but may be retrofitted only once or twice during the useful life of an aircraft.
Based on industry sources and studies, we estimate that during 2015, the global commercial and business jet cabin interior products industry, for the principal products of the type which we manufacture, exclusive of service revenues, had annual sales of approximately $4.4 billion. We estimate that the total worldwide installed base of commercial and general aviation aircraft cabin interior products for the principal products of the type which we manufacture, valued at replacement prices, was approximately $29.2 billion as of December 31, 2015.
During 2015, global air traffic increased by 6.5% as compared with global traffic increases of 6.0% in 2014 and 5.7% in 2013. The increases in global traffic demand from 2013 through 2015 reflect the global macroeconomic environment. The Airline Monitor 2016 forecast projects global passenger traffic to increase approximately 6.0% and capacity growth of approximately 6.0%.
4
IATA expects the global airline industry to generate a profit of approximately $33.0 billion in 2015, an increase of over 90% compared to 2014. Overall performance in 2015 has been positively impacted by strong passenger traffic growth of approximately 6.5%, near record load factors of approximately 80.3% reflecting disciplined capacity management and declining costs of aviation fuel. The record industry profits were delivered despite modest reduction in yields as compared with 2014. For 2016, IATA expects global profits to improve to $36.3 billion, or 10.0% higher than 2015.
The airlines have substantially strengthened their balance sheets over the past several years through operating profits and by accessing capital markets. As a result, we believe airline balance sheets are much stronger than in any time in the past ten years.
Approximately 647 business jets were delivered in 2015 versus 710 business jets in 2014 and 678 business jets in 2013.
Other factors relevant to the industries we serve include the following:
Long-Term Growth in Worldwide Fleet. According to the Airline Monitor, new deliveries of large commercial aircraft increased to 1,397 aircraft in 2015 driven by increased production of Boeing’s 737 and 787 aircraft, Airbus’ A320 and the first deliveries of Airbus’ A350 aircraft. This compares to 1,352 aircraft in 2014 and 1,274 in 2013. According to the Airline Monitor, new aircraft deliveries are expected to total 1,440 in 2016 and 1,380 in 2017. Worldwide air traffic is expected to grow by approximately 6.0% in 2016 and the Airline Monitor has forecasted revenue passenger miles to increase at a compounded annual growth rate of approximately 5.3% during the 2015-2030 period, increasing from 4.1 trillion miles in 2015 to approximately 8.9 trillion miles by 2030. As a result, the Airline Monitor expects the worldwide fleet of commercial jet aircraft to increase by approximately 75% from approximately 24,960 regional, single-aisle and twin-aisle aircraft at December 31, 2015 to approximately 43,720 aircraft at December 31, 2030.
Wide-Body Aircraft Deliveries. Deliveries of wide-body, long-haul aircraft constitute an increasing share of total new aircraft deliveries and are an increasing percentage of the worldwide fleet. Wide-body aircraft represented approximately 28% of all new commercial aircraft (excluding regional jets) delivered over the four-year period ended December 31, 2015. According to the Airline Monitor, 411 new wide-body aircraft were delivered in 2015 and approximately 420 are expected to be delivered in 2016. The Airline Monitor also predicts that nearly 5,225 twin-aisle aircraft will be delivered over the 2016-2026 timeframe or approximately 475 wide-body and super wide-body aircraft per year, which is 16% higher, on average, as compared to 2015 deliveries. The foundations of this growth are the Boeing 787 and Airbus A350 two engine aircraft which replace older and less fuel efficient wide-body aircraft. These aircraft also support new demand by opening smaller markets to long range nonstop flights.
Existing Installed Base. According to industry sources, the world's active commercial passenger aircraft fleet consisted of approximately 24,960 aircraft as of December 31, 2015. Additionally, based on industry sources, there are approximately 18,399 business jets currently in service. Based on such fleet numbers, we estimate that the total worldwide installed base of commercial and general aviation aircraft cabin interior products for the principal products of the type which we manufacture, valued at replacement prices, was approximately $29.2 billion as of December 31, 2015. The size of the installed base is expected to increase as a result of the growth in the world wide fleet and is expected to generate additional and continued demand for retrofit, refurbishment and spare parts.
Engineering Services Markets. Historically, the airlines have relied primarily on their own in-house engineering resources to provide engineering, design, integration and installation services, as well as services related to repairing or replacing cabin interior products that have become damaged or otherwise non-functional. Cabin interior product configurations have become increasingly more sophisticated and the airline industry more globally competitive. The airlines have increasingly outsourced certain of these services in order to introduce highly branded, optimized density and contemporary interiors in sync with market cycles. As noted above, the interiors retrofit cycle runs in four to eight year cycles. The ability of an airline to source
5
expert engineering services is an increasingly essential factor in their ability to offer a competitive interior product in their markets.
Outsourced services include:
|
· |
Interior concept development, engineering, design, integration, integrated project management, installation and certification services; |
|
· |
Modifications and reconfigurations for commercial aircraft including passenger-to-freighter conversions and related kits; and |
|
· |
Services related to the support of product upgrades. |
Competitive Strengths
We believe that we have a strong competitive position attributable to a number of factors, including the following:
Focus on Innovation and New Product Development. Our aircraft cabin interior products businesses are engaged in extensive product development and marketing efforts for both new and existing products. We believe, based on our experience in the industry, that we are a technological and systems integration leader in the cabin interior products industry. The success of these and other new product development efforts are expected to increase demand for our products in both newly purchased aircraft and in aftermarket retrofits. Our focus on continuous development has allowed us to grow our backlog and improve the product mix of our current backlog. Newly introduced products include a broad range of amenities such as luxurious first class cabins (offering high privacy and high density seats) with appointments such as mini-bars, closets, flat screen TVs, digital light-emitting diode (“LED”) mood lighting, electric lie-flat seating, Pulse Oxygen™ gaseous passenger oxygen systems for the Boeing 787, 777X and Airbus A350, next-generation galley systems for the Airbus A350, the new award winning and market leading Essence™ suite of food and beverage equipment, electric fully berthing business jet seating, lightweight, lower maintenance wastewater systems for business and commercial jets and a full range of business and executive jet seating. We recently introduced our new Meridian® main cabin seating platform, which we believe is the industry’s lightest full-featured seat that significantly reduces cost of ownership, simplifies maintenance and increases overall passenger living space. We also recently introduced an update to our digital LED lighting system for the Boeing 737 Sky Interior aircraft. This innovative, lightweight LED system features adjustable lighting with full spectrum color capabilities, providing superior cabin ambiance and unprecedented lighting control. Market acceptance of our LED lighting systems has continued to gain strength, and since 2012 we have been receiving orders from various airlines to retrofit their Boeing 737, 757, 767 and 777 aircraft with our LED lighting systems.
As of December 31, 2015, we had 2,236 employees in engineering, research and development and program management. We believe our engineering, research and development efforts and our on-site technicians at both the airlines and airframe manufacturers enable us to play a leading role in developing and introducing innovative products to meet emerging industry trends, and thereby gain early entrant advantages.
Diverse Product Offering and Broad Domestic and International Customer Base. We provide a comprehensive line of products and services to a broad customer base. During the year ended December 31, 2015, Boeing accounted for 10% of our consolidated revenues (no other customer represented more than 10% of consolidated revenues). Our commercial aircraft and business jet segments have a broad range of over 300 principal customers, including all of the world’s major airlines, commercial aircraft and business jet manufacturers and completion centers. We believe that our broad product offering and large customer base make us less vulnerable to the loss of any one customer or program. We have continued to expand our available products and services based on our belief that the airline industry increasingly will seek an integrated approach to the design, development, integration, installation, testing and sourcing of aircraft cabin interior equipment.
6
Large Installed Base. We have a large installed base of commercial and general aviation aircraft cabin interior products for the principal products of the type which we manufacture, valued at replacement prices, of approximately $12.3 billion as of December 31, 2015. Based on our experience in the industry, we believe our installed base is substantially larger than that of each of our competitors. We believe that our large installed base is a strategic advantage, as airlines tend to purchase aftermarket products and services, including spare parts, retrofit and refurbishment programs, from the original supplier. As a result, we expect our large installed base to generate continued aftermarket revenue as airlines continue to maintain, evolve and reconfigure their aircraft cabin interiors.
Increased Airframe Content and Diversified Backlog. Approximately ten years ago we began to leverage our deep understanding of aircraft interior systems to develop a range of new aircraft interior products that deliver differentiated value for Airbus and Boeing at point of sale, and the airlines in service. During 2011, Boeing selected our modular lavatory systems as standard eqipment for Boeing’s 737 NG family of airplanes, as well as the Boeing 737 MAX. The award was initially valued in excess of $800 million, exclusive of retrofit orders. This innovative system has become standard equipment on these aircraft and will be the sole source equipment on the 737 MAX when it enters service in 2017. Our proprietary lavatory systems create the opportunity to add up to six incremental passenger seats on each new 737 NG / MAX airplane.
We have also been selected by Boeing to manufacture our LED cabin lighting systems for the Boeing 737 Sky Interior aircraft. This has facilitated our growth on lighting retrofits for both narrow-body and wide-body aircraft where we have won several awards as we continue to offer all-LED lighting throughout the cabin into the existing worldwide fleet of aircraft. To date, we have been selected by Boeing to manufacture our patented Pulse OxygenTM system and passenger service units for the 787, 777X and 747-8, and we have been selected by Airbus to manufacture our next generation galley systems and our patented passenger oxygen delivery system for the A350. Additionally, we have been selected by major business jet manufacturers to provide vacuum wastewater systems. As of December 31, 2015, the programs we have won are currently expected to generate approximately $5.6 billion in revenues over time, and are expected to significantly increase our content per aircraft type; however, only a small portion of these programs are included in our reported booked backlog as of December 31, 2015. This effort to develop and market new interior systems directly to the OEMs is important to us as it represents a significant potential increase in the dollar value of our products on each such aircraft type.
Proven Certification Capabilities and Experience with a Complex Regulatory Environment. The airline industry is heavily regulated and we have a long history and extensive experience with the complex regulatory environments in which we operate and believe this enables us to efficiently obtain the required approvals for new products and services. The Federal Aviation Administration (the “FAA”) prescribes standards and licensing requirements for manufacturers and sellers of many aircraft components, including virtually all commercial airline and general aviation cabin interior products, and licenses component repair stations within the United States. Comparable agencies, such as the European Aviation Safety Agency (the “EASA”), the Japanese Civil Aviation Board (the “JCAB”), and the Civil Aviation Administration of China (the “CAAC”), prescribe standards, establish licensing requirements and regulate these matters in other countries. In
7
addition, designing new products to meet existing regulatory requirements and retrofitting products to comply with new regulatory and airframe requirements can be both expensive and time consuming. Our proven ability to consistently conceptualize, design, manufacture and certify highly complex interiors for new and retrofit aircraft applications in compressed lead times to regulatory and airframe requirements is a key competitive strength in our market.
Growth Opportunities
We believe that we will benefit from the following industry trends:
Growth of Wide-Body Aircraft Fleet. New aircraft deliveries of wide-body aircraft are expected to continue to grow over the long term, reflecting the expected growth in revenue passenger miles over the 2016-2030 period and retirements of older, less fuel efficient aircraft. The growth in the wide-body aircraft global fleet is significant to us because wide-body aircraft require up to six-to-ten times the dollar value content of the principal products of the type which we manufacture as compared to narrow-body aircraft. For example, wide-body aircraft carry up to three or four times the number of seats as narrow-body aircraft and have multiple classes of service, including super first class compartments and first class and business class configurations. In addition, aircraft cabin crews on wide-body aircraft flights may make and serve between 300 and 900 meals, brew and serve more than 2,000 cups of coffee and serve more than 200 glasses of wine on a single flight, thereby generating substantial demand for seating products and food and beverage preparation and storage equipment, as well as extensive oxygen storage, distribution and delivery systems and lighting systems.
Growth of Boeing and Airbus Narrow-Body Aircraft Fleet. New aircraft deliveries of Boeing’s 737 NG and Airbus’s A320neo are expected to continue to grow over the long term, reflecting the expected growth in revenue passenger miles over the 2016-2030 period and retirements of older, less fuel efficient aircraft. For example, both Boeing and Airbus have increased their narrow body production outputs from over 34 aircraft per month in 2011 to over 40 aircraft per month in 2015 and have production schedules and backlog to deliver in excess of 56 aircraft per month in 2019. This growth is significant to us as we have market leading installed base shares on both the Boeing 737 and Airbus A320 platforms.
Worldwide Aircraft Fleet Creates Demand for Aftermarket Products. The size of the worldwide aircraft fleet is important to us as the proper maintenance of the fleet generates ongoing demand for spare parts and refurbishment retrofits. Our substantial existing installed base of products typically generates continued retrofit, replacement, upgrade, refurbishment, repair and spare parts revenue as airlines maintain their aircraft interiors. For the years ended December 31, 2015 and 2014, approximately 40% of our revenues were derived from the aftermarket. In addition, aftermarket revenues are generally driven by aircraft usage, and as such, have historically tended to recover more quickly than revenues from OEMs. As used in this Form 10-K, aftermarket sales include sales to support existing commercial and business jet fleets. We believe that there are substantial growth opportunities for retrofit programs for the wide-body aircraft that service international routes and that the major global airlines will need to invest in cabin interiors for their international fleets or face the prospect of losing market share on their international routes. Additionally, the expected growth in the worldwide fleet will serve to increase the size of our installed base.
Backlog Aided by Aftermarket Demand from International Airlines Retrofitting Existing Fleets. We believe that many major international airlines are in the process of planning cabin interior upgrade programs. This activity is expected to continue to be driven by the age of the existing cabin interiors, commonality with new aircraft type interiors, as well as the desire by many of the leading international carriers to achieve a competitive advantage by investing in cabin interior products that incorporate leading comfort amenities, thereby improving passenger loads and yields, or that reduce airline operating costs by reducing maintenance costs and/or providing lower weight and fuel burn. We believe that as international traffic continues to grow, the life cycle of premium products, such as lie-flat international business class seats and the products comprising our super first class suites, will continue to compress as airlines seek greater competitive advantage through state-of-the-art cabin interior products. We believe our ability to develop unique interior
8
concepts, design, manufacture and certify these concepts in a compressed lead time to comply with international regulatory requirements supports expansion of these activities.
Growth in New Aircraft Introductions Leads to New Cabin Interior Product Introductions and Major Retrofit Opportunities. According to Airbus, 41 customers have placed 777 orders for new A350 aircraft. According to Boeing, 62 customers have placed orders for 1,142 of its new B787 wide-body aircraft and seven customers have placed 306 orders for new B777X aircraft. We believe the airlines often use the introduction into service of a new aircraft fleet type to introduce next generation cabin interior products. In such cases, we believe airlines will also invest in programs to retrofit their existing fleets to incorporate these new interior products and configurations in order to enhance their revenue and/or cost advantages realized on the new fleets and to maintain product and service commonality.
Long-Term Growth in Business Jet and VIP Aircraft Markets. Business jet deliveries totaled 647 aircraft in 2015 and were down 8.9% in 2015 as compared to 2014; business jet deliveries in 2014 totaled 710 aircraft and increased 4.7% as compared to 2013. According to industry sources, new business jet deliveries in 2016 through 2018 are expected to decline slightly before a new up cycle begins in 2019 driven by the introduction of new large aircraft from Dassault and Bombardier and new mid-size platforms from Cessna. The growth of the very large aircraft segment is important to us as the ship set content for seating, divans and accent lighting is three times that of a smaller business jet.
Business Strategy
Our business strategy is to maintain a leadership position and to best serve our customers by:
|
· |
Offering the broadest and most innovative products, integrated systems and services in the industry; |
|
· |
Offering a broad range of engineering services including design, integration, installation and certification services and aircraft reconfiguration; |
|
· |
Pursuing the highest level of quality and safety in every facet of our operations, from the factory floor to customer support; |
|
· |
Aggressively pursuing continuous improvement initiatives in all facets of our business, and in particular our manufacturing operations, to reduce cycle time, lower costs, improve quality and expand our margins; and |
|
· |
Pursuing a worldwide marketing and product support approach focused by airline and general aviation airframe manufacturers, encompassing our entire product line. |
Products and Services
We conduct our operations through strategic business units that have been aggregated under two reportable segments: commercial aircraft (“CAS”) and business jet (“BJS”).
The following is a summary of revenues for our reportable segments:
|
|
|
Year Ended December 31, |
|
|||||||||||||
|
|
|
2015 |
|
2014 |
|
2013 |
|
|||||||||
|
|
|
|
|
|
% of |
|
|
|
|
% of |
|
|
|
|
% of |
|
|
|
|
Revenues |
|
Revenues |
|
Revenues |
|
Revenues |
|
Revenues |
|
Revenues |
|
|||
|
Commercial aircraft |
|
$ |
2,098.3 |
|
76.9 |
% |
$ |
2,058.9 |
|
79.2 |
% |
$ |
1,784.7 |
|
81.0 |
% |
|
Business jet |
|
|
631.3 |
|
23.1 |
% |
|
540.1 |
|
20.8 |
% |
|
418.6 |
|
19.0 |
% |
|
Total revenues |
|
$ |
2,729.6 |
|
100.0 |
% |
$ |
2,599.0 |
|
100.0 |
% |
$ |
2,203.3 |
|
100.0 |
% |
9
Commercial Aircraft Segment
Seating Products. We believe, based on our experience in the industry, that we are the world's leading manufacturer of aircraft seats, offering a wide selection of first class, business class, tourist class and regional aircraft seats. A typical seat manufactured and sold by us includes the seat frame, cushions, armrests, tray table and a variety of optional features such as adjustable lumbar supports, electrical actuation systems, footrests, reading lights, head/neck supports, and other comfort amenities. We also integrate a wide variety of in-flight entertainment equipment into our seats, which is supplied to us by our customers or third-party suppliers.
First and Business Class Seats. Based upon major airlines' program selection and our backlog, we believe we are the leading worldwide manufacturer of first and business class seats. Our line of first class lie-flat seats incorporates full electric actuation, an electric ottoman, privacy panels and sidewall-mounted tables. We leverage our differentiated expertise in executive seating, divans, cabinetry, lighting, environmental controls and reliable use of exotic materials to develop these exclusive environments. Our business class seats incorporate features developed over 25 years of seating design. We have led this sector of the industry since the development and delivery of the industry’s first mass produced lie flat seat in 2001. We offer the widest array of business class platforms in the industry to support airlines’ differing requirements for business class zone density. The business class seats include electrical or mechanical actuation, PC power ports, personal entertainment device connectivity, gaming headsets, individual video monitors, leg rests, adjustable lumbar cushions, four and six-way adjustable headrests and fiber optic reading and accent lights. The first and business class products are substantially more expensive than tourist class seats due to these luxury accoutrements. Our deep understanding of airframe and system interfaces and ability to certify these suites and cabins within required lead-times, supports our market design and manufacturing capabilities.
Tourist Class and Regional Jet Seats. We believe, based on our installed base, that we are a leading worldwide manufacturer of tourist class seats and regional aircraft seats. We believe our Pinnacle® coach class seat has become the industry's most popular seat platform for single-aisle aircraft since its launch in late 2009. We believe the seat improves comfort and offers significantly improved passenger living space as well as benefiting the airlines with simplified maintenance and spare parts purchasing. Pinnacle® was engineered for use across the entire single-aisle aircraft fleet. In 2015, we introduced our new patented Meridian® main cabin seating platform, which we believe is the industry’s lightest full-featured seat. The Meridian® seat platform utilizes advanced proprietary technologies that we believe significantly reduce cost of ownership, simplify maintenance and increase overall passenger living space and comfort. Since its launch, the Meridian® has received launch orders in excess of 550 aircraft.
Spares. Aircraft seats require regularly scheduled maintenance in the course of normal passenger use. Airlines depend on seat manufacturers and secondary suppliers to provide spare parts and kit upgrade programs. As a result, a significant market exists for spare parts and kit upgrades. We believe we offer unique engineering, planning and logistics services to our industry via our Integrated Materials Management aftermarket support platform. This service is enabled by the industry’s only manufacturing sites and supply chains dedicated to seat aftermarket support. The ability to deliver best in class logistics and material services lowers cost for the airlines and raises customer satisfaction.
Food and Beverage and Preparation and Storage Equipment. We believe, based on our experience in the industry, that we are the leading manufacturer of aircraft coffee and beverage makers. We manufacture a broad line of coffee makers, including the Essence® line of beverage makers, coffee warmers and water boilers. We also manufacture a cappuccino/espresso maker. We believe, based on our experience in the industry, that we are the leading manufacturer of a broad line of specialized ovens, including high efficiency convection ovens, steam ovens and warming ovens.
10
Our DS Steam OvenTM uses a method of preparing in-flight food by maintaining constant temperature and moisture in the food. Our DS Steam OvenTM addresses the airlines' need to provide a wider range of food offerings than can be prepared by convection ovens. We believe, based on our experience in the industry, that we are the worldwide industry leader in the design, manufacture and supply of commercial aircraft refrigeration equipment. We manufacture self-contained wine and beverage chillers, refrigerators/freezers and galley air chilling systems.
Oxygen Delivery Systems. We believe, based on our experience in the industry, that we are the leading manufacturer of oxygen storage, distribution and delivery systems for both commercial and business jet aircraft. We have the capability to both produce all required components and to fully integrate overhead passenger service units with either chemical or gaseous oxygen equipment. Our oxygen equipment has been approved for use on all Boeing and Airbus aircraft and is also found on essentially all general aviation and VIP aircraft. The Boeing 787 was the first aircraft equipped with a passenger oxygen system using our advanced Pulse OxygenTM and passenger service unit technology. Boeing has awarded us a sole source contract for the installation of the Pulse Oxygen™ system on its new 777X platform. We also provide similar technology for passenger and crew oxygen systems for the A350. We have also been selected by both Boeing and Airbus to provide installed lavatory oxygen as their preferred line-fit solution for all platforms.
Interior Structures. Our modular lavatory system utilizes our patented Spacewall® technology, which frees up floor space in the cabin, creating the opportunity to add up to six incremental passenger seats on each airplane. The modular lavatory systems integrate our technologically advanced Aircraft Ecosystems® vacuum toilet, long-life LED lighting and tamper proof state-of-the-art lavatory oxygen system. We believe our Aircraft Ecosystems® vacuum toilets have 25% greater reliability than existing systems and allow components to be replaced in a few minutes, as compared to up to an hour for existing systems. Our innovative modular lavatory system has become standard equipment on all Boeing 737s, as well as the 737 MAX which enters service in 2017. We believe that retrofit demand for our lavatory systems could be substantial. We have also entered the vacuum wastewater system market. Our vacuum wastewater system incorporates a proprietary design which we believe eliminates the primary cause of failure which plagues other vacuum systems. In addition, our systems include advanced proprietary components and systems that we believe will significantly lower the overall cost of ownership, simplify maintenance and improve lavatory hygiene. Our innovative, modular approach to the design of galley systems allows the airlines to select galley positions and configurations for their specific operational needs, while minimizing total aircraft system weight. We also provide next generation galley systems for the Airbus A350 aircraft, which is designed to accommodate the aircraft’s “flex zones” allowing airlines to select from a wide range of galley configurations.
Engineering, Design, Integration, Installation and Certification Services. We believe, based on our experience in the industry, that we are a leading supplier of engineering, design, integration, installation and certification services for commercial aircraft passenger cabin interiors. We also offer our customers’ in-house capabilities to design, manage, integrate, test and certify reconfigurations and modifications for commercial aircraft and to manufacture related products, including engineering kits and interface components. We provide a broad range of interior reconfiguration services which enable airlines to modify the cabin layout, install telecommunications and entertainment equipment, and relocate galleys, lavatories, overhead bins, and crew rest compartments. The expertise and resources of our engineering and certifications unit is embedded in our major interiors densification campaigns, new cabin systems and product developments. The ability to leverage our unique knowledge of the aircraft electrical, environmental and stress environments allow us to optimize platform development to comply with challenging manufacturing and certification requirements.
We estimate that, as of December 31, 2015, we had an aggregate installed base of products produced by our commercial aircraft segment, valued at replacement prices, of approximately $10.4 billion.
11
Business Jet Segment
We believe, based on our experience in the industry, that we are a leading manufacturer of a broad product line of furnishings for business jets. We believe we originated what is today’s market for “Super First Class” suites and cabins twelve years ago. Our products include a complete line of business jet seating and sofa products, including electric fully berthing lie-flat seats, both fluorescent and LED direct and indirect lighting, air valves and oxygen delivery systems as well as sidewalls, bulkheads, credenzas, closets, galley structures, lavatories, wastewater systems, de-icing systems, cabin management systems and tables. We have the capability to provide complete interior packages for business jets and executive VIP or head-of-state aircraft interiors, including design services, interior components and program management services. Our product portfolio also includes premium lightweight helicopter seats for double engine helicopter airframes for civil and military applications.
Our business jet segment, which has had decades of experience in equipping executive, VIP and head-of-state aircraft, is the leading manufacturer of super first class cabin interior products for commercial wide-body aircraft. Super first class products incorporate a broad range of amenities such as luxurious first class cabins with appointments such as lie-flat seating, mini-bars, closets, flat screen televisions and mood lighting, which, until recently, were found only in VIP and head-of-state aircraft.
We estimate that, as of December 31, 2015, we had an aggregate installed base of business jet and super first class equipment, valued at replacement prices, of approximately $1.9 billion.
Research, Development and Engineering
We work closely with commercial airlines, business jet and aerospace manufacturers and global leasing companies to improve existing products and identify customers' emerging needs. Our expenditures in research, development and engineering totaled $274.4 million, $284.3 million and $220.9 million for the years ended December 31, 2015, 2014 and 2013, respectively, representing 10.1%, 10.9% and 10.0% of revenues, respectively, for each of those years. We employed 2,236 professionals in engineering, research and development and program management as of December 31, 2015. We believe, based on our experience in the industry, that we have the largest engineering organization in the cabin interior products industry, with mechanical, electrical, human machine interface and software design skills, as well as substantial expertise in program management, materials composition and custom cabin interior layout design and certification.
Customers, Marketing and Competition
The commercial aircraft cabin interior products market is relatively fragmented, with a number of competitors in each of the individual product categories. Due to the global nature of the commercial aerospace industry, competition comes from both U.S. and foreign manufacturers. However, as aircraft cabin interiors have become increasingly sophisticated and technically complex, airlines have demanded higher levels of engineering support and customer service than many smaller cabin interior products suppliers can provide. At the same time, airlines have recognized that cabin interior product suppliers must be able to integrate a wide range of products, including sophisticated electronic components, such as video and live broadcast TV, particularly in wide-body aircraft.
We market and sell our commercial aircraft products directly to virtually all of the world's major airlines, aircraft leasing companies and airframe manufacturers. Airlines select manufacturers of cabin interior products primarily on the basis of custom design capabilities, product quality and performance, on-time delivery, after-sales customer service, product support and price. We market our thermal and power management products and services directly to first tier defense manufacturers, aerospace OEMs, their suppliers and the airlines.
We believe that airlines prefer our integrated worldwide marketing approach, which is focused by airline and encompasses our entire product line. Led by senior executives, teams representing each product line
12
serve designated airlines that together account for the vast majority of the purchases of products manufactured by our commercial aircraft segment, including our super first class products. Our teams have developed customer-specific strategies to meet each airline's product and service needs. We also staff "on-site" customer engineers at major airlines and airframe manufacturers to represent our entire product line and to work closely with customers to develop specifications for each successive generation of products required by the airlines. These engineers help customers integrate our wide range of cabin interior products and assist in obtaining the applicable regulatory certification for each particular product or cabin configuration. Through our on-site customer engineers, we expect to be able to more efficiently design and integrate products that address the requirements of our customers. We provide integrated program management services, integrating all on-board cabin interior equipment and systems, including installation and FAA certification, allowing airlines to substantially reduce costs. We believe that we are the only supplier in the commercial aircraft cabin interior products industry with the size, resources, expertise, breadth of product line and global product support capability to operate in this manner.
Our integrated program management approach assigns a program management team to each significant contract. The program management team leader is responsible for all aspects of the specific contract and profitability, including managing change orders, negotiating related upfront engineering charges and monitoring the progress of the contract through its delivery dates. We believe that our customers benefit substantially from our program management approach, including better on-time delivery and higher service levels. We also believe our program management approach results in higher customer satisfaction.
We market our business jet products directly to all of the world's general aviation airframe manufacturers, completion centers and operators. Business jet owners typically rely upon the airframe manufacturers and completion centers to coordinate the procurement and installation of their interiors. Business jet owners select manufacturers of business jet products on a basis similar to commercial aircraft interior products: custom design capabilities, product quality and performance, on-time delivery, after-sales customer service, product support and price. Barriers to entry include regulatory requirements, our large installed product base, our custom design capability, manufacturing capability, delivery, after-sales customer service, product support and our broad product line.
As of December 31, 2015, our direct sales, marketing and product support organizations consisted of 450 employees. In addition, we currently retain 54 independent sales representatives. Our sales to non-U.S. customers were approximately $1.8 billion and $1.7 billion during the years ended December 31, 2015 and 2014, respectively, which represents approximately 65% and 67% of revenues, respectively. Approximately 64% of our total revenues were derived from airlines, aircraft leasing companies, maintenance, repair and overhaul providers, and other commercial aircraft operators during each of the two years ended December 31, 2015. Approximately 40% of our revenues during each of the years ended December 31, 2015 and 2014 were from the aftermarket.
We believe that our large installed base, our timely responsiveness in connection with custom design, manufacture, delivery and after-sales customer service and product support, our broad product line and stringent customer and regulatory requirements, all present barriers to entry for potential new competitors in the aircraft cabin interior products market. Our principal competitors for our commercial aircraft segment are Groupe Zodiac Aerospace S.A., Thompson Aero Seating Ltd., Recaro Aircraft Seating GmbH & Co. KG, Diehl Aerosystems Holding GmBH and Jamco America, Inc. The market for business jet products is highly fragmented, consisting of numerous competitors including a wholly-owned subsidiary of United Technologies Corporation.
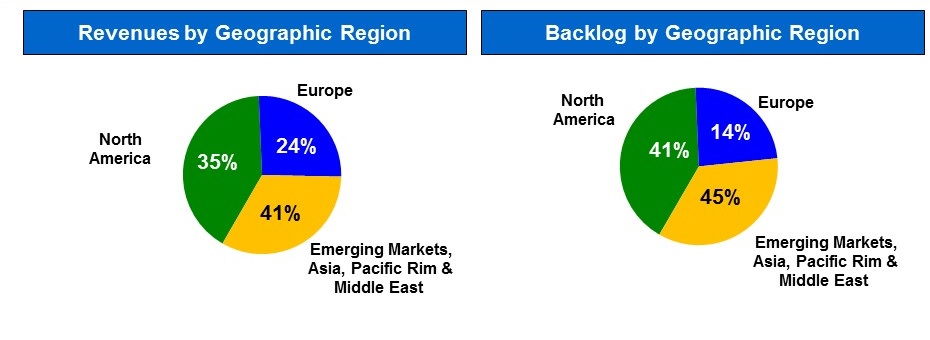
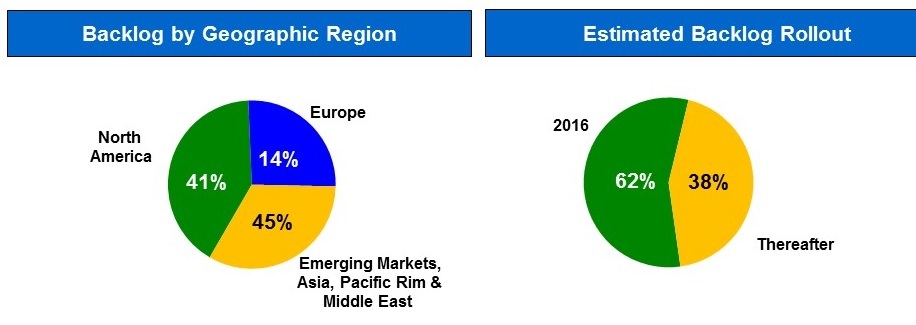
Backlog
Our booked backlog at December 31, 2015 was $3.2 billion, as compared with booked backlog of $3.0 billion as of December 31, 2014 and $2.8 billion as of December 31, 2013. The charts below reflect information related to booked backlog by geographic region and the expected roll-out of booked backlog.
13
We record backlog when we enter into a definitive order for the delivery of products to our customers in the future. Within backlog, we differentiate between booked backlog and awarded but unbooked backlog. For manufacturing programs, generally if there are definitive delivery dates then the backlog is considered booked. When we receive the delivery date specificity in writing from our customers on these long-term contracts, we include such amount in booked backlog. If a contract does not provide that level of specificity, the production requirements are generally provided to us through purchase orders issued against the underlying contracts at which point the amount of the purchase orders is classified as booked. The remaining portion of the underlying contract is considered awarded but unbooked.
As of December 31, 2015, we had a record booked backlog of $3.2 billion. While the expected delivery dates of our backlog varies from year to year, generally about 60% of the backlog is deliverable in the following 12 months, with the balance generally deliverable over approximately the next two years. As an example, we believe approximately 62% of our December 31, 2015 booked backlog will be delivered during 2016. As of December 31, 2015, approximately 77% of booked backlog is related to CAS and 23% is related to BJS. The quality of our backlog has continued to improve as a result of partnering with key long-term customers, outstanding engineering, global sourcing and program management capabilities resulting in superior products which we believe are the most innovative cabin interior products solutions for our customers. While we do operate in a cyclical industry, program cancellations are the exception, not the norm; historically, backlog cancellations have not been significant due to the fact that airlines seek fleet commonality once they begin to outfit their fleets with a particular cabin interior product or configuration. This is important to an airline due to customer expectations for a consistent level of service, particularly on international routes as well as complexities that arise from maintaining multiple layouts and products with spare parts on a global basis, and other similar considerations. As a result, these programs tend to be deferred to later periods, rather than being cancelled. As an example in 2008 following the global credit crisis, our airline customers experienced a significant contraction in demand, which resulted in the deferral of a number of programs from delivery in the 2008-2009 period to 2009-2011. Despite the negative impacts on our customers from this severe global recession, no significant retrofit programs were cancelled. For a more detailed discussion on risks associated with our backlog, see Item 1A. Risk Factors – We have a significant backlog that may be deferred or may not be entirely realized.
Program awards will be added to booked backlog when we receive purchase orders or otherwise are provided with specificity regarding delivery dates. At December 31, 2015, we estimate the value of these unbooked program awards at $5.6 billion.
Total backlog, both booked and awarded but unbooked, expanded to a record $8.8 billion, an increase of 10.0% from December 31, 2014.
Customer Service
We believe that our customers place a high value on customer service and product support and that this
14
service level is a critical differentiating factor in our industry. The key elements of such service include:
|
· |
Rapid response to requests for engineering, design, proposals and technical specifications; |
|
· |
Flexibility with respect to customized features; |
|
· |
On-time delivery; |
|
· |
Immediate availability of spare parts for a broad range of products; and |
|
· |
Prompt attention to customer problems, including on-site customer training. |
Customer service is particularly important to the airlines due to the high costs associated with late delivery, malfunctions and other problems.
Warranty and Product Liability
We warrant our products, or specific components thereof, for periods ranging from one to ten years, depending on product and component type. We establish reserves for product warranty expense after considering relevant factors such as our stated warranty policies and practices, historical frequencies of claims to replace or repair products under warranty and recent sales and claims trends. Actual warranty costs reduce the warranty reserve as they are incurred. We periodically review the adequacy of accrued product warranty reserves and revisions of such reserves are recognized in the period in which such revisions are determined.
We also carry product liability insurance. We believe that our insurance is sufficient to cover product liability claims.
Manufacturing and Raw Materials
Our manufacturing operations consist of both the in-house manufacturing of component parts and sub-assemblies and the assembly of our designed component parts that are purchased from outside vendors. We maintain up-to-date facilities, and we have an ongoing strategic manufacturing improvement plan utilizing lean manufacturing processes. We constantly strive for continuous improvement from implementation of these plans for each of our product lines. We have implemented common information technology platforms company-wide, as appropriate. These activities should lower our production costs, shorten cycle times and reduce inventory requirements and at the same time improve product quality, customer response and profitability. We do not believe we are materially dependent on any single supplier or assembler for any of our raw materials or specified and designed component parts and, based upon the existing arrangements with vendors, our current and anticipated requirements and market conditions, we believe that we have made adequate provisions for acquiring raw materials.
Government Regulation
The FAA prescribes standards and licensing requirements for aircraft components, and licenses component repair stations within the United States. Comparable agencies regulate such matters in other countries. We hold several FAA component certificates and perform component repairs at a number of our U.S. facilities under FAA repair station licenses. We also hold an approval issued by the EASA to design, manufacture, inspect and test aircraft seating products in Leighton Buzzard, United Kingdom and to manufacture and ship from our Kilkeel, Northern Ireland facility. We also have the necessary approvals to design, manufacture, inspect, test and repair our interior systems products in Nieuwegein, the Netherlands. Additionally we hold EASA/LBA (Luftfahrtbundesamt, the National German Aviation Authority) approval to manufacture, inspect, test and repair our commercial life support systems equipment and the approval of
15
the German Federal Office of Defense and Procurement (BWB) to design, manufacture and repair military aviation equipment in Lübeck, Germany.
In May 2009, our Structures and Integration Group in Marysville, Washington was granted FAA Organization Designation Authorization (“ODA”) that includes delegated authority to issue Supplemental Type Certificates (“STC”) and produce parts under a FAA Production Certificate (“PC”). Our ODA STC allows us to reconfigure the interior of airplanes, install crew rests, install satellite communications and perform passenger-to-freighter conversions on all major transport category aircraft types. Under our ODA STC we can approve the design of an aircraft modification and the parts that go into it, and issue the STC in support of the return to service of the modified airplane. This authorization allows us to install new and prototype parts on the aircraft and upon STC issuance add these parts to our PC and designate them as airworthy approved production parts.
Environmental Matters
Our operations are subject to extensive and changing federal, state and foreign laws and regulations establishing health and environmental quality standards, including those governing discharges of pollutants into the air and water and the management and disposal of hazardous substances and waste. We may be subject to liabilities or penalties for violations of those standards. We are also subject to laws and regulations, such as the Federal Superfund Law and similar state statutes, governing remediation of contamination at facilities that we currently or formerly owned or operated or to which we send hazardous substances or waste for treatment, recycling or disposal. We believe that we are currently compliant, in all material respects, with applicable environmental laws and regulations. However, we could become subject to future liabilities or obligations as a result of new or more stringent interpretations of existing laws and regulations. In addition, we may have liabilities or obligations in the future if we discover any environmental contamination or liability relating to our facilities or operations.
Patents and Other Intellectual Property
We rely upon patent, copyright, trademark, trade secret and other intellectual property laws in the United States, similar laws in other countries, and agreements with our employees, customers, suppliers and other parties to establish and maintain intellectual property rights in the products we sell and otherwise use in our operations. We currently hold 409 U.S. patents and 640 foreign patents, as well as 184 U.S. patent applications and 623 foreign patent applications covering a variety of products. We do not believe that we are dependent on one or a group of patents, and as such we believe the termination, expiration or infringement of one or more of such patents would not have a material adverse effect on us.
Employees
As of December 31, 2015, we had approximately 10,057 employees. Approximately 66% of our employees are engaged in manufacturing/distribution operations, quality and purchasing, 22% in engineering, research and development and program management, 5% in sales, marketing and product support and 7% in finance, human resources, information technology, legal and general administration. Unions represent approximately 15% of our worldwide employees. One domestic labor contract, representing approximately 5% of our employees, expires in May 2018. The labor contract with the only other domestic union, which represents 1% of our employees, expires in October 2017. The remaining portion of our unionized employees are located in the United Kingdom and the Netherlands, which tend to have government mandated union organizations. We consider our employee relations to be good and we have not experienced a business disruption due to labor relations.
Financial Information About Segments and Foreign and Domestic Operations
Financial and other information by segment and relating to foreign and domestic operations for the years ended December 31, 2015, 2014 and 2013, is set forth in note 13 to our consolidated financial statements.
16
Available Information
Our filings with the SEC, including this Form 10-K, our Quarterly Reports on Form 10-Q, our Proxy Statement, Current Reports on Form 8-K and amendments to any of those reports are available free of charge on our website, http://www.beaerospace.com, as soon as reasonably practicable after they are filed with, or furnished to, the SEC. These reports may also be obtained at the SEC’s public reference room at 100F Street, N.E., Washington, DC 20549. The SEC also maintains a website at www.sec.gov that contains reports, proxy statements, information statements, and other information regarding SEC registrants, including B/E Aerospace, Inc. Information included in or connected to our website is not incorporated by reference in this annual report.
17
You should carefully consider the following risks and uncertainties, along with the other information contained in or incorporated by reference in this Form 10-K. If any of the following events actually occur, our business, results of operation, financial condition and cash flows could be materially adversely affected. Any of these risks could also cause the market value of our common stock to decline. Additional risks and uncertainties that we do not presently know about or currently believe are not material may also adversely affect our business, results of operations, financial condition and cash flows.
See "Cautionary Statement Regarding Forward-Looking Statements."
Risks Relating to Our Industry
We are directly dependent upon the conditions in the airline and business jet industries, which are, among other things, correlated to global economic conditions and an economic downturn could negatively impact our results of operations and financial condition.
We are directly dependent upon the airline and business jet industries, which are sensitive to changes in global economic conditions. The airline industry is highly cyclical and the level of demand for air travel is correlated to the strength of the U.S. and global economies. Stagnant or weakening global economic conditions either in the United States or in other geographic regions, as we are currently experiencing, may have a material adverse effect on our business. Past periods of unfavorable economic conditions caused a reduction in spending for both leisure and business travel, resulting in the airline industry parking aircraft, delaying new aircraft purchases and deliveries, deferring retrofit programs and depleting existing inventories. The business jet industry is also severely impacted by both a weaker economy and by declining corporate profits. According to IATA, the economic downturn in 2008 and 2009, combined with the high fuel prices experienced during most of 2009, contributed to the worldwide airline industry’s loss of approximately $4.6 billion in 2009. Global financial markets are experiencing volatility and disruption, in part due to the collapse in oil prices and the subsequent impact on emerging markets. Concerns over the tightening of the corporate credit markets, inflation, energy costs and other factors may continue to contribute to volatility in the global financial markets and may create further uncertainties for global economic conditions in the future. Furthermore, the environment in which the airline and business jet industries operate could continue to be affected by adverse foreign exchange impacts, fluctuating fuel prices, consolidation in the industry, changes in regulation, terrorism, safety, environmental, health concerns such as the Zika virus and labor issues. Many of these factors have, and could continue to have, a negative impact on air travel, which could materially adversely affect our business, results of operations, financial condition and cash flows.
Our business is also affected by risks that uniquely impact the airline and business jet industries. For instance, potential terrorist attacks, geopolitical conflict or security breaches, or fear of such events, even if not made directly on or involving the airline industry have, and could continue to have, a negative effect on the airline industry and as a result, our business as well. The global airline industry lost a total of approximately $52.8 billion during the period from 2001 to 2009 as a result of the decline in traffic and airfares caused by, among other things, the September 11, 2001 terrorist attacks, the SARS and H1N1 outbreaks, the conflicts in Iraq and Afghanistan, increases in fuel costs and heightened competition from low-cost carriers. During this period, a significant number of airlines worldwide declared bankruptcy or ceased operations. Any of these factors could potentially impact the airline and business jet industries in the future, and subsequently, materially adversely affect our business, results of operations, financial condition and cash flows.
We operate in cyclical industries and a continued economic downturn could negatively impact our results of operations and financial condition.
We operate in cyclical industries. During periods of economic expansion, when capital spending normally increases, we generally benefit from greater demand for our products. During periods of economic contraction, when capital spending normally decreases, we generally are adversely affected by declining
18
demand for our products and services. The impact of declining demand can be exacerbated by oversupply built during periods of expansion as there is a lag in suppliers’ reactions to contraction. Industry conditions are impacted by numerous factors over which we have no control, including political, regulatory, economic and military conditions, environmental concerns, weather conditions and fuel pricing. Any prolonged cyclical downturn could have a material adverse effect on our business, results of operations, financial condition and cash flows.
The airline industry is heavily regulated and failure to comply with applicable laws could reduce our sales, or require us to incur additional costs to achieve compliance, which could negatively impact our results of operations, financial condition and cash flows.
The FAA prescribes standards and licensing requirements for aircraft components, including virtually all commercial airline and general aviation cabin interior products and licenses component repair stations within the United States. Comparable agencies, such as the EASA, the CAAC and the JCAB, regulate these matters in other countries. If we fail to obtain a required license for one of our products or services or lose a license previously granted, the sale of the subject product or service would be prohibited by law until such license is obtained, reinstated or renewed. In addition, designing new products to meet existing regulatory requirements and retrofitting installed products to comply with new regulatory requirements can be both expensive and time consuming.
From time to time, these regulatory agencies propose new regulations. These new regulations generally cause an increase in costs to comply with these regulations. For example, the FAA dynamic testing requirements originally established in 1988 under 14 CFR 25.562 are currently required for certain new generation aircraft types. The enactment of 14 CFR 121.311(j) will require dynamic testing of all seats installed in all new aircraft produced after October 27, 2009. The EASA is expected to establish a similar rule. Compliance with this rule may require industry participants to expand engineering, plant and equipment to ensure that all products meet this rule. To the extent the FAA implements rule changes in the future, we may incur additional costs to achieve compliance.
The airline industry is subject to extensive health, safety and environmental regulations, any violation of which could subject us to significant liabilities and penalties.
We are subject to extensive and changing federal, state and foreign laws and regulations establishing health, safety and environmental quality standards, and may be subject to liabilities or penalties for violations of those standards. We are also subject to laws and regulations governing remediation of contamination at facilities currently or formerly owned or operated by us or to which we have sent hazardous substances or waste for treatment, recycling or disposal. We may be subject to future liabilities or obligations as a result of new or more stringent interpretations of existing laws and regulations. In addition, we may have liabilities or obligations in the future if we discover any environmental contamination or liability at any of our facilities, or at facilities we may acquire.
Risks Relating to Our Business
There are risks inherent in international operations that could have a material adverse effect on our business operations.
While the majority of our operations are based domestically, we have significant manufacturing operations based internationally with facilities in the United Kingdom, the Netherlands, Germany and the Philippines. In addition, we sell our products to airlines all over the world. Our customers are located primarily in North America, Europe, Asia, the Pacific Rim, South America and the Middle East. As a result, 65% and 67% of our revenues for the years ended December 31, 2015 and 2014, respectively, were to customers located outside the United States. Volatile international economic, political and market conditions may have a material adverse effect on our business, results of operations, financial condition and cash flows.
19
In addition, we have a number of subsidiaries in foreign countries (primarily in Europe), which have sales outside the United States. As a result, we are exposed to currency exchange rate fluctuations as a portion of our net sales and expenses are denominated in currencies other than the U.S. dollar. Approximately 41% and 40% of our sales during the years ended December 31, 2015 and 2014, respectively, came from our foreign operations. Fluctuations in the value of foreign currencies affect the dollar value of our net investment in foreign subsidiaries, with these fluctuations being included in a separate component of stockholders’ equity. At December 31, 2015, we reported a cumulative foreign currency translation adjustment of approximately $146.8 million in stockholders’ equity as a result of foreign currency adjustments, and we may incur additional adjustments in future periods. In addition, operating results of foreign subsidiaries are translated into U.S. dollars for purposes of our statement of operations at average monthly exchange rates. Moreover, to the extent that our revenues are not denominated in the same currency as our expenses, our net earnings could be materially adversely affected. For example, a portion of labor, material and overhead costs for goods produced in our production facilities in the United Kingdom, Germany, the Netherlands and the Philippines are incurred in British pounds, Euros or Philippine pesos, but the related sales revenues are generally denominated in U.S. dollars. Changes in the value of the U.S. dollar or other currencies could result in material fluctuations in foreign currency translation amounts or the U.S. dollar value of transactions and, as a result, our net earnings could be materially adversely affected.
Historically we have not engaged in hedging transactions. However, we may engage in hedging transactions in the future to manage or reduce our foreign exchange risk. Our attempts to manage our foreign currency exchange risk may not be successful and, as a result, our results of operations and financial condition could be materially adversely affected.
Our foreign operations could also be subject to unexpected changes in regulatory requirements, tariffs and other market barriers and political, economic and social instability in the countries where we operate or sell our products and offer our services. The impact of any such events that may occur in the future could subject us to additional costs or loss of sales, which could materially adversely affect our business, results of operations, financial condition and cash flows.
We may be materially adversely affected by fluctuating fuel prices.
Fluctuations in the global supply of crude oil and the possibility of changes in government policy on jet fuel production, transportation and marketing make it impossible to predict the future availability and price volatility and cost of jet fuel. In the event of a natural disaster, changes in fuel-related governmental policy, changes in access to petroleum product pipelines and terminals, speculation in energy futures markets, changes in aircraft fuel production capacity, environmental concerns, political disruptions, outbreaks or escalation of hostilities or other conflicts or significant disruptions in oil production or delivery in oil-producing areas or elsewhere, there could be reductions in the production or importation of crude oil and significant increases in the cost of jet fuel. If there were major reductions in the availability of jet fuel or significant increases in its cost, commercial airlines will face increased operating costs. Due to the competitive nature of the airline industry, airlines are often unable to pass on future increases in fuel prices to customers by increasing fares. As a result, an increase in jet fuel could result in a decrease in net income from either lower margins or, if airlines increase ticket fares, less revenue from reduced airline travel. Decreases in airline profitability could decrease the demand for new commercial aircraft, resulting in delays of or reductions in deliveries of commercial aircraft equipped with our cabin interior products and, as a result, our business, results of operations, financial condition and cash flows could be materially adversely affected. On the other hand, significant decreases in oil and fuel prices could have an adverse impact on certain of our customers that generate, benefit from or are dependent on the production of oil or other fuels.
We incur risks associated with new programs.
New programs with new technologies and requirements typically carry risks associated with design changes, development of new production tools, increased capital and funding commitments, ability to meet
20
customer specifications, delivery schedules and unique contractual requirements, supplier performance, ability of the customer to meet its contractual obligations to us, and our ability to accurately estimate costs associated with such programs. In addition, any new program may not generate sufficient demand or may experience technological problems or significant delays in regulatory or other certification or manufacturing and delivery schedules. If we were unable to perform our obligations under new programs to the customer’s satisfaction, if we were unable to manufacture products at our estimated costs, or if a new program in which we had made a significant investment was terminated or experienced weak demand, certification or other delays or technological problems, our business, results of operations, financial condition and cash flows could be materially adversely affected.
We may be unable to effectively and efficiently manage our inventories as we expand our business, which could have an adverse effect on our financial condition.
We have substantially expanded the size, scope and nature of our business through acquisitions and organic means, resulting in an increase in the breadth of our product offerings and an expansion of our business geographically. Business expansion places increasing demands on us to increase the inventories that we carry. We must anticipate demand well out into the future in order to service our extensive customer base. The inability to effectively and efficiently manage our inventories to meet current and future needs of our customers, which may vary widely from what is originally forecast due to a number of factors beyond our control, could have a material adverse effect on our business, results of operations, financial condition and cash flows.
We have a significant backlog that may be deferred or may not be entirely realized.
As of December 31, 2015, we had approximately $3.2 billion of booked backlog. Given the nature of our industry and customers, there is a risk that orders forming part of our backlog may be cancelled or deferred due to economic conditions or fluctuations in our customers’ business needs, purchasing budgets or inventory management practices. We also could be impacted if entry into service for any new aircraft platform is delayed or if the rate of delivery is lower than expected or deferred as a result of production or other manufacturing difficulties.
A significant portion of our backlog includes programs with Boeing and Airbus, which makes us particularly vulnerable to their businesses and continued production of various airplane models. For example, at December 31, 2008, while no major retrofit programs were cancelled, several large retrofit programs that were scheduled for delivery in 2009 were deferred until 2010 and 2011, which negatively impacted our revenues and profits for 2009. Failure to realize sales from our existing or future backlog could have a material adverse effect on our business, results of operations, financial condition and cash flows.
The failure of our suppliers to perform to our requirements could negatively impact our results of operations, including our profit margins.
We depend on manufacturing firms to support our operations through the timely supply of products. Our suppliers may experience capacity constraints that may result in their inability to supply us with products in a timely fashion, with adequate quantities or at a desired price. Factors affecting the manufacturing sector can include labor disputes, general economic issues, and changes in raw material and energy costs. Natural disasters such as earthquakes or hurricanes, as well as political instability and terrorist activities, may negatively impact the production or delivery capabilities of our suppliers as well. These factors could lead to increased prices for our inventory, curtailment of supplies and the unfavorable allocation of product by our suppliers, which could reduce our revenues and profit margins and harm our customer relations. Significant disruptions in our supply chain could have a material adverse effect on our business, results of operations, financial condition and cash flows.
21
We have grown, and may continue to grow, at a rapid pace. Our inability to properly manage or support the growth may have a material adverse effect on our business, results of operations, financial condition and cash flows.
We have experienced rapid growth in recent periods and intend to continue to grow our business both through acquisitions and internal expansion of products and services. Our growth to date has placed, and could continue to place, significant demands on our management team and our operational, administrative and financial resources. We may not be able to grow effectively or manage our growth successfully, and the failure to do so could have a material adverse effect on our business, results of operations, financial condition and cash flows.
We are subject to a variety of risks associated with the sale of our products and services to the U.S. Government, which could negatively affect our financial condition and results of operations.
As a supplier directly to the defense industry and as a subcontractor to suppliers of the U.S. Government, we face risks that are specific to doing business with the U.S. Government. The U.S. Government has the ability to unilaterally suspend the award of new contracts to us in the event of any violations of procurement laws, or reviews of the same. It could also reduce the value of our existing contracts as well as audit our costs and fees. Many of our U.S. Government contracts may be terminated for convenience by the government. Termination-for-convenience provisions typically provide that we would recover only our incurred or committed costs, settlement expenses and profit on the work that we completed prior to termination. In such an event, we would not earn the revenue that we would have originally anticipated from such a terminated contract.
Government reviews can be costly and time consuming, and could divert our management resources away from running our business. As a result of such reviews, we could be required to provide a refund to the U.S. Government or we could be asked to enter into an arrangement whereby our prices would be based on cost, or the U.S. Government could seek to pursue alternative sources of supply for our products. These actions could have a negative effect on our management efficiency and could reduce our revenues and results of operations. Additionally, as a U.S. Government contractor or subcontractor, we are subject to federal laws governing suppliers to the U.S. Government, including potential application of the False Claims Act.
Our total assets include substantial intangible assets. The write-off of a significant portion of intangible assets would negatively affect our reported financial results.
Our total assets reflect substantial intangible assets. At December 31, 2015, goodwill and identifiable intangibles together represented approximately 33% of our total assets. Intangible assets consist principally of goodwill and other identified intangible assets associated with our acquisitions. On at least an annual basis, we assess whether there has been an impairment in the value of goodwill and other intangible assets with indefinite lives. If the carrying value of the tested asset exceeds its estimated fair value, impairment is deemed to have occurred. In this event, the amount is written down to fair value. Under generally accepted accounting principles in the United States, this would result in a charge to operating earnings. Any determination requiring the write-off of a significant portion of goodwill or unamortized identified intangible assets would negatively affect our results of operations and total capitalization, which could be material. We performed our annual testing of impairment of goodwill for the years ended December 31, 2013, 2014 and 2015. There were no impairment charges recorded in 2013, 2014 or 2015. As of December 31, 2015, the balances of goodwill and identifiable intangible assets were $813.2 million and $231.3 million, respectively.
If we make acquisitions, they may be less successful than we expect, which could have a material adverse effect on our business, results of operations, financial condition and cash flows.
We have made many acquisitions in the past. We may also consider future acquisitions, some of which could be material to us. We explore and conduct discussions with many third parties regarding possible
22
acquisitions. Our ability to continue to achieve our goals may depend upon our ability to effectively identify attractive businesses, access financing sources on acceptable terms, negotiate favorable transaction terms and successfully consummate and integrate any businesses we acquire, achieve cost efficiencies and manage these businesses as part of our Company.
Our acquisition activities may involve unanticipated delays, costs and other problems. If we encounter unanticipated problems with one of our acquisitions, our senior management may be required to divert attention away from other aspects of our business. Additionally, we may fail to consummate proposed acquisitions or divestitures, after incurring expenses and devoting substantial resources, including management time, to such transactions. Acquisitions also pose the risk that we may be exposed to successor liability relating to actions by an acquired company and its management before the acquisition. The due diligence we conduct in connection with an acquisition, and any contractual guarantees or indemnities that we receive from the sellers of acquired companies, may not be sufficient to protect us from, or compensate us for, actual liabilities. Additionally, depending upon the acquisition opportunities available, we also may need to raise additional funds through the capital markets or arrange for additional bank financing in order to consummate such acquisitions or to fund capital expenditures necessary to integrate the acquired business. We also may not be able to raise the substantial capital required for acquisitions and integrations on satisfactory terms, if at all. If any of the above situations were to occur, they could have a material adverse effect on our business, results of operations, financial condition and cash flows.
Our operations rely on an extensive network of information technology resources and a failure to maintain, upgrade and protect such systems from cyber or other security threats could materially adversely impact our business, financial condition and results of operations.
Information technology plays a crucial role in all of our operations. To remain competitive, our hardware, software and related services must interact with our suppliers and customers efficiently, record and process our financial transactions accurately, and obtain the data and information to enable the analysis of trends and plans and the execution of our strategies.
The failure or unavailability of our information technology systems could directly impact our ability to interact with our customers and provide them with products and services when needed. Cybersecurity threats, in particular, are evolving and include, but are not limited to, both attacks to our information technology infrastructure and attacks to the information technology infrastructure of third parties in attempts to gain unauthorized access to confidential, classified or otherwise proprietary information of us and/or our employees, customers and other third parties. Despite our efforts to mitigate potential risks to our technology and our operations from these information technology-related and other potential disruptions, cybersecurity incidents, depending on their nature and scope, could potentially result in the misappropriation, destruction, corruption or unavailability of critical data and confidential or proprietary information (our own or that of third parties) and the disruption of business operations. Such failure to properly supply or service our customers could have a material adverse effect on our business, results of operations, financial condition and cash flows. Moreover, our customer relationships could be damaged well beyond the period of the downtime of our information technology systems.
We may be unable to retain personnel who are key to our operations.
Our success, among other things, is dependent on our ability to attract, develop and retain highly qualified senior management and other key personnel. Competition for key personnel is intense, and our ability to attract and retain key personnel is dependent on a number of factors, including prevailing market conditions and compensation packages offered by companies competing for the same talent. The inability to hire, develop and retain these key employees may adversely affect our business.
23
We compete with a number of established companies, some of which have significantly greater financial, technological and marketing resources than we do, and we may not be able to compete effectively with these companies.
We compete with numerous established companies. Some of these companies have significantly greater financial, technological and marketing resources than we do. Our ability to be a successful competitor depends on our success in causing our products and the new products we may develop to be selected for installation in new aircraft, including next-generation aircraft, and in avoiding product obsolescence. It will also depend on our ability to remain the supplier of retrofit and refurbishment products and spare parts on the commercial fleets on which our products are currently in service. Developing and maintaining a competitive advantage may require continued investment in product development, engineering, supply-chain management and sales and marketing, and we may not have enough resources to make such investments, which could negatively impact our results of operations and financial condition.
Increased leverage could adversely impact our business and results of operations.
We may incur additional debt under our current revolving credit facility or through new borrowings to finance our operations, capital deployment plans, or for future growth, including funding acquisitions. A high degree of leverage could have important consequences to us. For example, it could:
|
· |
increase our vulnerability to adverse economic and industry conditions; |
|
· |
require us to dedicate a substantial portion of cash from operations to the payment of debt service, thereby reducing the availability of cash to fund working capital, capital expenditures and other general corporate purposes; |
|
· |
limit our ability to obtain additional financing for working capital, capital expenditures, general corporate purposes or acquisitions; |
|
· |
place us at a disadvantage compared to our competitors that are less leveraged; and |
|
· |
limit our flexibility in planning for, or reacting to, changes in our business and in our industry. |
We have significant financial and operating restrictions in our debt instruments that may have an adverse effect on our operations.
The credit agreement governing our senior secured bank credit facilities (the “Credit Agreement”) contains numerous financial, operating and/or negative covenants that may limit our ability to incur additional or repay existing indebtedness, to create liens or other encumbrances, to make certain payments and investments, including dividend payments, to repurchase shares, to engage in transactions with affiliates, to engage in sale/leaseback transactions, to guarantee indebtedness and to sell or otherwise dispose of assets and merge or consolidate with other entities. Agreements governing future indebtedness could also contain significant financial and operating restrictions. A failure to comply with the obligations contained in any current or future agreement governing our indebtedness could result in an event of default under our current or any future credit facility, or any future indenture or agreements governing our debt securities that we may issue, which could permit acceleration of the related debt and acceleration of debt under other instruments that may contain cross acceleration or cross default provisions. We may not have, or may not be able to obtain, sufficient funds to make any required accelerated payments.
Additional tax expense or additional tax exposures could affect our future profitability.
We are subject to income taxes in the United States and various international jurisdictions. Significant judgment is required in determining our worldwide provision for income taxes. In the ordinary course of business, there are many transactions and calculations where the ultimate tax determination is uncertain.
24
Furthermore, changes in tax laws and regulations, as well as changes and conflicts in related interpretations and other tax guidance could materially impact our accounting for tax assets and liabilities and related items. Additionally, in the ordinary course of business we are subject to examinations by various tax authorities. In addition to ongoing examinations, there could be additional examinations launched in the future by governmental tax authorities in various jurisdictions, and existing examinations could be expanded. The final determinations of these tax examinations could have a material adverse effect on our financial condition and could be materially different from our historical income tax provisions and accruals. The global and diverse nature of our operations means that these risks will continue to exist and additional examinations, proceedings and contingencies may arise from time to time.
We cannot predict with certainty the outcome of litigation matters, government proceedings and other contingencies and uncertainties.
We are subject to a variety of litigation and legal compliance risks. These risks include, among other things, possible liability relating to commercial transactions, government contracts, prior acquisitions and divestitures, taxes, anti-bribery and corruption laws, employment, employee benefits plans, intellectual property, antitrust, import and export matters and environmental, health and safety matters. Additionally, our operations expose us to potential liabilities for damages, personal injury or death as a result of the failure of an aircraft component that we designed, manufactured or serviced. Accordingly, we may become subject to or be required to pay damage awards or settlements that could have a material adverse effect on our results of operations, cash flows and financial condition. Furthermore, negative publicity about an accident, catastrophe or incident involving aircraft containing our critical components could damage our reputation for quality products regardless of fault and cause a material adverse effect on our ability to retain and attract customers, which could materially adversely affect our business, results of operations, financial condition and cash flows. Due to the global nature of our business, we are subject to complex laws and regulations in the United States and other countries in which we operate. Those laws and regulations may be interpreted in different ways, and such laws and their related interpretations may change from time to time. Changes in laws or regulations could result in higher expenses and payments, and uncertainty relating to such laws or regulations may also affect how we conduct our operations and structure our investments and could limit our ability to enforce our rights.
While we maintain insurance for certain risks, including product liability claims, our insurers may attempt to deny coverage or the amount of our insurance coverage may not be adequate to cover the total amount of all insured claims and liabilities. We also may not be able to maintain insurance coverage in the future at a cost acceptable to us. The incurrence of significant liabilities for which there is no or insufficient insurance coverage could materially adversely affect our business, results of operations, financial condition and cash flows.
Our financial performance may suffer if we cannot continue to develop, license or enforce the intellectual property rights on which our businesses depend.
We rely upon patent, copyright, trademark, trade secret and other intellectual property laws in the United States, similar laws in other countries, and agreements with our employees, customers, suppliers and other parties to establish and maintain intellectual property rights in the products we sell and otherwise use in our operations. Any of our intellectual property rights could be challenged, invalidated, infringed or circumvented. The theft or unauthorized use or publication of our trade secrets and other confidential information as a result of such an incident could adversely affect our competitive position and the value of our research and development. Litigation to defend and enforce our intellectual property rights may be expensive, time-consuming, disruptive to our operations and distracting to management. Additionally, the laws of certain countries do not protect proprietary rights to the same extent as the laws of the United States. Therefore, in certain jurisdictions, we may be unable to protect our intellectual property adequately against unauthorized third-party copying or use, which could materially adversely affect our business, results of operations, financial condition and competitive position.
Third parties may also claim that we or customers indemnified by us are infringing upon their intellectual property rights. Even if we believe that such intellectual property claims are without merit, they can be time-consuming and costly to defend against, and may divert management’s attention and resources away from our
25
business. Claims of intellectual property infringement also might require us to redesign affected products, enter into costly settlement or license agreements, pay costly damage awards or face a temporary or permanent injunction preventing us from importing, marketing or selling certain of our products. Such outcomes could materially adversely affect our business, results of operations, financial condition and cash flows.
Provisions in our charter documents may discourage potential acquisitions of our Company, even those which the holders of a majority of our common stock may favor.
Our restated certificate of incorporation, as amended, and amended and restated by-laws contain provisions that may have the effect of discouraging a third party from making an unsolicited acquisition of us by means of a tender offer, proxy contest or otherwise. Our restated certificate of incorporation, as amended, and amended and restated by-laws:
|
· |
classify the Board of Directors into three classes, with directors of each class serving for a staggered three-year period; |
|
· |
provide that directors may be removed only for cause and only upon the approval of the holders of at least two-thirds of the voting power of our shares entitled to vote generally in the election of such directors; |
|
· |
require at least two-thirds of the voting power of our shares entitled to vote generally in the election of directors to alter, amend or repeal the provisions relating to the classified board and removal of directors described above; |
|
· |
permit only existing members of the Board of Directors to fill vacancies and newly created directorships on the board; |
|
· |
provide that only the existing members of the Board of Directors may change the number of directors on the Board of Directors; |
|
· |
restrict the ability of stockholders to call special meetings; and |
|
· |
contain advance notice requirements for stockholder proposals. |
There can be no assurance that we will pay cash dividends or that we will repurchase shares.
Our Board of Directors has adopted a dividend policy that contemplates the payment of cash dividends and a share repurchase program. Whether, when and in what amounts we in fact pay such dividends or repurchase our shares remains entirely at the discretion of our Board of Directors and will depend on our future earnings, capital requirements, financial conditions, operating conditions, contractual restrictions, including those restrictions in our Credit Agreement and such other factors as our Board of Directors may deem relevant. All of these factors and their evaluation by our Board of Directors, as well as the dividend policy itself and the share repurchase program, are subject to change. Our ability to repurchase our shares may also be affected by our share price and by blackout periods during which we must refrain from repurchasing our shares. Our dividend payments and/or share repurchases may change from time to time, and we cannot provide assurance that we will pay dividends or repurchase shares in any particular amounts or at all. If we do not pay cash dividends in accordance with the policy or repurchase shares under the program, this could have a negative effect on our share price.
If the price of our common stock fluctuates significantly, stockholders could incur substantial losses of any investment in our common stock.
The price of our common stock is subject to sudden and material increases and decreases, and decreases could adversely affect investments in our common stock. For example from January 1, 2015 through December
26
31, 2015, the sale price of our common stock fluctuated between $64.58 and $40.39. The price of our common stock could fluctuate widely in response to:
|
· |
our quarterly operating results; |
|
· |
changes in earnings estimates by securities analysts; |
|
· |
changes in our business; |
|
· |
changes in the market’s perception of our business; |
|
· |
changes in the businesses, earnings estimates or market perceptions of our competitors or customers; |
|
· |
changes in airline industry or business jet industry conditions; |
|
· |
delays in new aircraft certification, production or order rates; |
|
· |
changes in our key personnel; |
|
· |
changes in general market or economic conditions; and/or |
|
· |
changes in the legislative or regulatory environment. |
In addition, the stock market has experienced extreme price and volume fluctuations in recent years that have significantly affected the quoted prices of the securities of many companies, including companies in our industry. The changes often appear to occur without regard to specific operating performance. The price of our common stock could fluctuate based upon factors that have little or nothing to do with our Company, and these fluctuations could materially reduce our stock price.
Risks Relating to our Spin-Off of KLX
There could be significant liability if the distribution of KLX common stock to our stockholders is determined to be a taxable transaction.
We received an opinion from tax counsel to the effect that, among other things, the separation and distribution of KLX qualified as a transaction that is tax-free for U.S. federal income tax purposes under Sections 355 and 368(a)(1)(D) of the Internal Revenue Code of 1986, as amended. The opinion relied on certain facts, assumptions, representations, undertakings and covenants from us and KLX regarding the past and future conduct of ours and KLX’s respective businesses and other matters. If any of these facts, assumptions, representations, undertakings or covenants is incorrect or not satisfied, the opinion of tax counsel may no longer be valid.
In addition, notwithstanding the receipt by us of the opinion of tax counsel, the Internal Revenue Service (the “IRS”) could determine on audit that the separation and distribution of KLX is taxable if it determines that any of these facts, assumptions, representations, undertakings or covenants is not correct or have been violated or if it disagrees with the conclusions in the opinion, or for other reasons, including as a result of certain significant changes in the stock ownership of us or KLX. If the distribution of KLX common stock is determined to be taxable for U.S. federal income tax purposes, we would be subject to tax as if we had sold the KLX common stock in a taxable sale for its fair market value, and our stockholders that received KLX common stock in the distribution generally would be treated as having received a taxable dividend in an amount equal to the fair market value of the KLX common stock. The resulting U.S. federal income tax liabilities of us and such stockholders could be significant.
27
Under the Tax Sharing and Indemnification Agreement between KLX and us, KLX generally is required to indemnify us against (i) any taxes imposed on us with respect to the distribution of KLX common stock to the extent that such taxes result from certain events with respect to KLX, and (ii) a portion, based on the relative trading prices of our common stock and KLX common stock during the period shortly after the distribution, of any taxes imposed on us with respect to the distribution of KLX common stock if the distribution fails to qualify as a tax-free transaction for reasons other than those for which KLX or us would be responsible for pursuant to the Tax Sharing and Indemnification Agreement.
The U.S. federal income tax rules applicable to the distribution of the KLX common stock may restrict us from engaging in certain corporate transactions or from raising equity capital beyond certain thresholds for a period of time after the distribution.
To preserve the tax-free treatment of the distribution of KLX common stock to us and our stockholders, under the Tax Sharing and Indemnification Agreement, for the two-year period following the separation and distribution of KLX, we are subject to certain restrictions with respect to our activities, including restrictions relating to certain issuances or repurchases of our common stock (except for repurchases in compliance with published IRS guidelines for tax-free spin-offs), acquisitions and mergers, and asset sales.
These restrictions may limit our ability during such two-year period to pursue strategic transactions of a certain magnitude that involve the issuance or acquisition of our common stock or engage in other transactions that might increase the value of our business.
A court could require that we assume responsibility for obligations allocated to KLX under the Separation and Distribution Agreement.
Under the Separation and Distribution Agreement, from and after the Spin-Off, the Company and KLX are responsible for the debts, liabilities and other obligations related to the business or businesses which it owns and operates following the consummation of the Spin-Off. Although we do not expect to be liable for any obligations that are not allocated to us under the Separation and Distribution Agreement, a court could disregard the allocation agreed to between the parties, and require that we assume responsibility for obligations allocated to KLX (including, for example, environmental liabilities), particularly if KLX were to refuse or were unable to pay or perform the allocated obligations.
Certain of our directors may have actual or potential conflicts of interest because of their current positions with KLX or their ownership of KLX equity.
Certain of our directors are directors or officers of KLX and thus have professional relationships with KLX’s executive officers and directors. Three of our directors, including our Executive Chairman of the Board of Directors, serve on the Board of Directors of KLX. Our Executive Chairman of the Board of Directors also serves as the Chairman of the Board of Directors of KLX and as its Chief Executive Officer. In addition, several of our directors have a financial interest in KLX as a result of their ownership of KLX stock and restricted stock. These relationships and financial interests may create, or may create the appearance of, conflicts of interest when these directors face decisions that could have different implications for KLX than for us.
ITEM 1B. UNRESOLVED STAFF COMMENTS
None.
28
As of December 31, 2015, we had 25 principal operating facilities, one administrative facility, and one research and development facility, which comprised an aggregate of approximately 3.2 million square feet of space. The following table describes the principal facilities and indicates the location, function, approximate size, and ownership status of each location.
|
|
|
|
|
|
|
Facility |
|
|
|
|
|
|
|
|
|
|
Size |
|
|
|
|
Segment |
|
Location |
|
Purpose |
|
(Sq. Feet) |
|
Ownership |
|
|
|
|
|
|
|
|
|
|
|
|
|
Commercial Aircraft |
|
Winston-Salem, North Carolina |
|
Manufacturing |
|
639,000 |
|
Leased/Owned |
|
|
|
|
Batangas, Philippines |
|
Manufacturing |
|
290,500 |
|
Leased |
|
|
|
|
Everett, Washington |
|
Manufacturing |
|
240,500 |
|
Leased |
|
|
|
|
Kilkeel, United Kingdom |
|
Manufacturing |
|
176,000 |
|
Owned |
|
|
|
|
Lenexa, Kansas |
|
Manufacturing |
|
130,000 |
|
Leased |
|
|
|
|
Leighton Buzzard, United Kingdom |
|
Manufacturing |
|
129,000 |
|
Owned |
|
|
|
|
Anaheim, California |
|
Manufacturing |
|
108,900 |
|
Leased |
|
|
|
|
Simpsonville, South Carolina |
|
Manufacturing |
|
95,000 |
|
Owned |
|
|
|
|
Lübeck, Germany |
|
Manufacturing |
|
91,200 |
|
Leased |
|
|
|
|
Westminster, California |
|
Manufacturing |
|
85,000 |
|
Leased |
|
|
|
|
Mountainhome, Pennsylvania |
|
Manufacturing |
|
75,000 |
|
Owned |
|
|
|
|
Nieuwegein, the Netherlands |
|
Manufacturing |
|
60,000 |
|
Leased |
|
|
|
|
Savannah, Georgia |
|
Manufacturing |
|
50,500 |
|
Leased |
|
|
|
|
Hampton, New Hampshire |
|
Manufacturing |
|
49,000 |
|
Leased |
|
|
|
|
Rockford, Illinois |
|
Manufacturing |
|
38,000 |
|
Leased |
|
|
Business Jet |
|
Miami, Florida |
|
Manufacturing |
|
156,800 |
|
Leased |
|
|
|
|
Fenwick, West Virginia |
|
Manufacturing |
|
148,800 |
|
Owned |
|
|
|
|
Tucson, Arizona |
|
Manufacturing |
|
142,500 |
|
Leased |
|
|
|
|
Nogales, Mexico |
|
Manufacturing |
|
153,000 |
|
Leased |
|
|
|
|
Bohemia, New York |
|
Manufacturing |
|
60,000 |
|
Leased |
|
|
|
|
Hyderabad, India |
|
R&D |
|
48,900 |
|
Leased |
|
|
|
|
New Berlin, Wisconsin |
|
Manufacturing |
|
97,850 |
|
Leased |
|
|
|
|
Great Falls, Montana |
|
Manufacturing |
|
20,200 |
|
Leased |
|
|
|
|
Winnipeg, Canada |
|
Manufacturing |
|
37,600 |
|
Leased |
|
|
|
|
Landshut, Germany |
|
Manufacturing |
|
26,900 |
|
Owned |
|
|
|
|
Havant, United Kingdom |
|
Manufacturing |
|
24,000 |
|
Leased |
|
|
Corporate |
|
Wellington, Florida |
|
Administrative |
|
31,300 |
|
Leased/Owned |
|
|
|
|
|
|
|
|
3,205,450 |
|
|
|
We believe that our facilities are suitable for their present intended purposes and are adequate for our present and anticipated level of operations.
We are a defendant in various legal actions arising in the normal course of business, the outcomes of which, in the opinion of management, neither individually nor in the aggregate are likely to result in a material adverse effect on our business, results of operations or financial condition.
There are no material pending legal proceedings, other than the ordinary routine litigation incidental to the business discussed above, to which we, or any of our subsidiaries, are a party or of which any of our property is the subject.
ITEM 4. MINE SAFETY DISCLOSURES
Not applicable.
29
ITEM 5. MARKET FOR REGISTRANT'S COMMON EQUITY, RELATED STOCKHOLDER MATTERS, AND ISSUER PURCHASES OF EQUITY SECURITIES
Our common stock is quoted on the NASDAQ Global Select Market under the symbol "BEAV.” The following table sets forth, for the periods indicated, the range of high and low per share sales prices for the common stock as reported by NASDAQ (2014 adjusted to reflect the Spin-Off) as well as the amount of cash dividends paid per share during such periods.
|
|
Common Stock |
|
|
Cash Dividends |
||||
|
|
High |
|
Low |
|
|
Per Share |
||
|
Fiscal 2014: |
|
|
|
|
|
|
|
|
|
First Quarter |
$ |
64.25 |
|
$ |
53.92 |
|
$ |
— |
|
Second Quarter |
|
73.21 |
|
|
57.87 |
|
|
— |
|
Third Quarter |
|
70.05 |
|
|
58.97 |
|
|
— |
|
Fourth Quarter |
|
61.08 |
|
|
50.08 |
|
|
— |
|
|
|
|
|
|
|
|
|
|
|
Fiscal 2015: |
|
|
|
|
|
|
|
|
|
First Quarter |
$ |
64.58 |
|
$ |
55.13 |
|
$ |
0.19 |
|
Second Quarter |
|
64.38 |
|
|
54.34 |
|
|
0.19 |
|
Third Quarter |
|
55.85 |
|
|
42.65 |
|
|
0.19 |
|
Fourth Quarter |
|
49.41 |
|
|
40.39 |
|
|
0.19 |
On February 23, 2016, the last reported sale price of our common stock as reported by NASDAQ was $42.84 per share. As of such date, based on information provided to us by Computershare, our transfer agent, we had approximately 1,616 registered holders, and because many of these shares are held by brokers and other institutions on behalf of the beneficial holders, we are unable to estimate the number of beneficial stockholders represented by these holders of record.
We have not paid any cash dividends prior to 2015. The Board of Directors authorized a $0.76 per share annual dividend beginning in 2015. The payments of future dividends are at the discretion of our Board of Directors and will depend on our future earnings, capital requirements, financial conditions, operating conditions, contractual restrictions, including those restrictions in the Credit Agreement (which are described under the heading “Outstanding Debt and Other Financing Arrangements” in “Item 7. Management’s Discussion and Analysis of Financial Condition and Results of Operations”) and such other factors as our Board of Directors may deem relevant.
The following line graph compares the annual percentage change in our cumulative total stockholder return on our common stock relative to the cumulative total returns of the S&P 500 Index, the NASDAQ Composite Index, the Dow Jones US Aerospace & Defense Index and a Peer Group Index that is used in the Compensation Discussion & Analysis section of our Proxy Statement. The Peer Group Index was calculated by Zacks Investment Research, Inc. and includes AAR Corp., Crane Co., Curtis-Wright Corp., Esterline Technologies Corporation, Harris Corporation, Hexel Corporation, Huntington Ingalls Industries Inc., Moog Inc., Orbital ATK, Inc., Rockwell-Collins Inc., Spirit AeroSystems Holdings, Teledyne Technologies, Inc., Terex Corp., Transdigm Group, Inc., Triumph Group, Inc. and Wesco Aircraft Holdings, Inc. An investment of $100 (with reinvestment of all dividends) is assumed to have been made in our common stock and in each of
30
the indexes on December 31, 2010 and its relative performance is tracked through December 31, 2015 and extended through February 23, 2016.
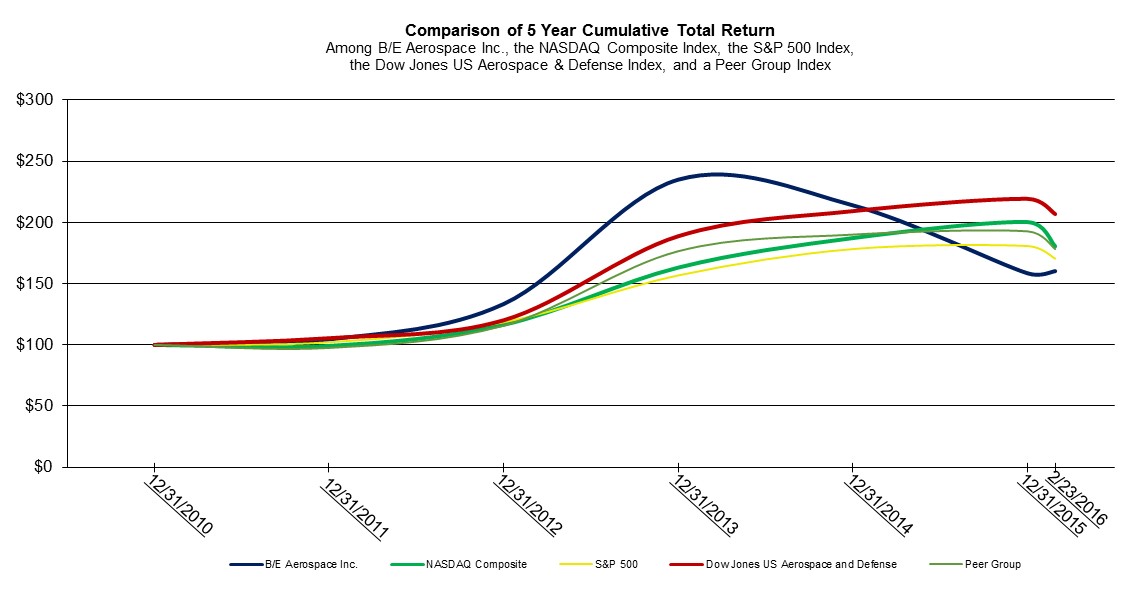
*$100 invested on 12/31/10 in stock or index, including reinvestment of dividends.
Fiscal year ending December 31. Data complete through last fiscal year and extended through February 23, 2016.
Peer group index uses beginning of period market capitalization weighting.
Prepared by Zacks Investment Research, Inc. Used with permission. All rights reserved. Copyright 1980-2016.
Index Data: Copyright NASDAQ OMX, Inc. Used with permission. All rights reserved.
Copyright© 2016 S&P, a division of The McGraw-Hill Companies Inc. All rights reserved.
Copyright© 2016 Dow Jones & Co. All rights reserved.
During the twelve-month period ended December 31, 2015, we repurchased 117,349 shares of our common stock from employees in connection with the settlement of income tax and related benefit withholding obligations arising from vesting of restricted stock grants. In the first, second, third and fourth quarters of 2015, 6,982, 101, 6,475 and 103,791 of these shares, respectively, were repurchased and held as treasury stock.
31
Issuer Purchases of Equity Securities
The following table provides information on the Company’s repurchases of our common stock during the fourth quarter of 2015:
|
|
|
|
|
|
|
|
|
|
|
|
|
|
|
|
|
|
|
|
|
Total Number of |
|
Approximate Dollar |
||
|
|
|
|
|
|
|
|
Shares Purchased |
|
Value of |
||
|
|
|
|
|
|
|
|
as Part of |
|
Shares That May |
||
|
|
|
|
|
|
|
Publicly |
|
Yet Be Purchased |
|||
|
|
|
Total Number of |
|
Average Price |
|
Announced |
|
Under the |
|||
|
Period |
Shares Purchased(1) |
Paid per Share(1) |
Program(2) |
Program(2) |
|||||||
|
October 1-31, 2015 |
|
384,040 |
|
$ |
45.53 |
|
|
379,349 |
|
|
322,713,504 |
|
November 1-30, 2015 |
|
347,779 |
|
|
45.94 |
|
|
318,345 |
|
|
308,058,174 |
|
December 1-31, 2015 |
|
1,457,054 |
|
|
41.89 |
|
|
1,387,388 |
|
|
249,924,535 |
|
Total |
|
2,188,873 |
|
$ |
43.17 |
|
|
2,085,082 |
|
|
|
|
(1) |
Includes 103,791 shares purchased from employees in connection with the settlement of income tax and related benefit withholding obligations arising from vesting of restricted stock grants under the Company’s Long-Term Incentive Plan. |
|
(2) |
On November 11, 2014, the Board of Directors authorized a share repurchase program for the repurchase of outstanding shares of the Company’s common stock having an aggregate purchase price of up to $400 million. The share repurchase program expires November 10, 2016. |
32
ITEM 6. SELECTED FINANCIAL DATA
(In millions, except per share data)
The financial data for each of the years in the five-year period ended December 31, 2015 have been derived from audited financial statements. The following financial information is qualified by reference to, and should be read in conjunction with, “Item 7. Management’s Discussion and Analysis of Financial Condition and Results of Operations” and our historical financial statements, including notes thereto, which are included in Item 15 of this Form 10-K. Our historical results are not necessarily indicative of our future results.
|
|
|
|
|
|
|
|
|
|
|
|
|
|
|
|
|
|
|
|
|
Year Ended December 31, |
|
|||||||||||||
|
|
|
2015 |
|
2014 |
|
2013 |
|
2012 |
|
2011 |
|
|||||
|
Statements of Earnings Data: |
|
|
|
|
|
|
|
|
|
|
|
|
|
|
|
|
|
Revenues |
|
$ |
2,729.6 |
|
$ |
2,599.0 |
|
$ |
2,203.3 |
|
$ |
1,914.3 |
|
$ |
1,556.3 |
|
|
Cost of sales |
|
|
1,642.5 |
|
|
1,582.8 |
|
|
1,296.0 |
|
|
1,113.7 |
|
|
925.3 |
|
|
Selling, general and administrative |
|
|
360.4 |
|
|
347.9 |
|
|
323.5 |
|
|
315.9 |
|
|
257.6 |
|
|
Research, development and engineering |
|
|
274.4 |
|
|
284.3 |
|
|
220.9 |
|
|
191.7 |
|
|
158.6 |
|
|
Operating earnings |
|
|
452.3 |
|
|
384.0 |
|
|
362.9 |
|
|
293.0 |
|
|
214.8 |
|
|
Operating margin |
|
|
16.6 |
% |
|
14.8 |
% |
|
16.5 |
% |
|
15.3 |
% |
|
13.8 |
% |
|
Interest expense, net |
|
|
94.8 |
|
|
130.6 |
|
|
123.4 |
|
|
124.2 |
|
|
108.7 |
|
|
Debt prepayment costs(1) |
|
|
0.9 |
|
|
243.6 |
|
|
— |
|
|
82.1 |
|
|
— |
|
|
Earnings before income taxes |
|
|
356.6 |
|
|
9.8 |
|
|
239.5 |
|
|
86.7 |
|
|
106.1 |
|
|
Income tax (benefit) expense |
|
|
70.9 |
|
|
(47.9) |
|
|
44.6 |
|
|
7.1 |
|
|
31.2 |
|
|
Earnings from continuing operations |
|
|
285.7 |
|
|
57.7 |
|
|
194.9 |
|
|
79.6 |
|
|
74.9 |
|
|
Earnings from discontinued operations, net of income taxes |
|
|
— |
|
|
46.6 |
|
|
170.7 |
|
|
154.1 |
|
|
152.9 |
|
|
Net earnings |
|
$ |
285.7 |
|
$ |
104.3 |
|
$ |
365.6 |
|
$ |
233.7 |
|
$ |
227.8 |
|
|
|
|
|
|
|
|
|
|
|
|
|
|
|
|
|
|
|
|
Basic net earnings per share: |
|
|
|
|
|
|
|
|
|
|
|
|
|
|
|
|
|
Net earnings per share from continuing operations |
|
$ |
2.75 |
|
$ |
0.55 |
|
$ |
1.89 |
|
$ |
0.78 |
|
$ |
0.74 |
|
|
Net earnings per share from discontinued operations |
|
|
— |
|
|
0.45 |
|
|
1.65 |
|
|
1.51 |
|
|
1.51 |
|
|
Net earnings per share - basic |
|
$ |
2.75 |
|
$ |
1.00 |
|
$ |
3.54 |
|
$ |
2.29 |
|
$ |
2.25 |
|
|
Weighted average common shares |
|
|
104.0 |
|
|
104.0 |
|
|
103.2 |
|
|
102.2 |
|
|
101.1 |
|
|
|
|
|
|
|
|
|
|
|
|
|
|
|
|
|
|
|
|
Diluted net earnings per share: |
|
|
|
|
|
|
|
|
|
|
|
|
|
|
|
|
|
Net earnings per share from continuing operations |
|
$ |
2.73 |
|
$ |
0.55 |
|
$ |
1.88 |
|
$ |
0.77 |
|
$ |
0.74 |
|
|
Net earnings per share from discontinued operations |
|
|
— |
|
|
0.45 |
|
|
1.64 |
|
|
1.50 |
|
|
1.50 |
|
|
Net earnings per share - diluted |
|
$ |
2.73 |
|
$ |
1.00 |
|
$ |
3.52 |
|
$ |
2.27 |
|
$ |
2.24 |
|
|
Weighted average common shares |
|
|
104.5 |
|
|
104.5 |
|
|
103.9 |
|
|
102.9 |
|
|
101.9 |
|
|
|
|
|
|
|
|
|
|
|
|
|
|
|
|
|
|
|
|
Cash dividends per share |
|
$ |
0.76 |
|
$ |
— |
|
$ |
— |
|
$ |
— |
|
$ |
— |
|
|
|
|
|
|
|
|
|
|
|
|
|
|
|
|
|
|
|
|
Balance Sheet Data (end of period):(2)(4) |
||||||||||||||||
|
Working capital |
|
$ |
836.2 |
|
$ |
852.8 |
|
$ |
2,251.4 |
|
$ |
1,963.6 |
|
$ |
1,567.7 |
|
|
Goodwill, intangible and other assets, net |
|
|
1,091.3 |
|
|
1,139.1 |
|
|
2,077.9 |
|
|
2,000.7 |
|
|
1,419.7 |
|
|
Total assets |
|
|
3,140.9 |
|
|
3,173.1 |
|
|
5,633.9 |
|
|
5,027.9 |
|
|
3,775.5 |
|
|
Long-term debt, net of current maturities |
|
|
2,034.1 |
|
|
2,147.3 |
|
|
1,926.5 |
|
|
1,924.0 |
|
|
1,220.6 |
|
|
Stockholders' equity |
|
|
55.5 |
|
|
10.1 |
|
|
2,609.2 |
|
|
2,178.9 |
|
|
1,872.6 |
|
|
Other Data:(3) |
||||||||||||||||
|
Depreciation and amortization |
|
$ |
85.3 |
|
$ |
142.3 |
|
$ |
89.6 |
|
$ |
75.0 |
|
$ |
62.1 |
|
33
|
(1) |
During the year ended December 31, 2015, we repaid $136.0 of our term loan facility. During the year ended December 31, 2014, we incurred a loss on debt extinguishment of $243.6 related to unamortized debt issue costs and fees and expenses related to the repurchase of our 5.25% and 6.875% Notes in connection with the Spin-Off. During the year ended December 31, 2012, we incurred a loss on debt extinguishment of $82.1 related to unamortized debt issue costs and fees and expenses related to the repurchase of our 8.5% Notes. |
|
(2) |
Includes KLX for periods 2011-2013. |
|
(3) |
Includes KLX for periods 2011-2014. |
|
(4) |
Certain amounts for prior years have been reclassified to conform to the current presentation. |
34
ITEM 7. MANAGEMENT'S DISCUSSION AND ANALYSIS OF FINANCIAL CONDITION AND RESULTS OF OPERATIONS
(In millions, except per share data)
OVERVIEW
Based on our experience in the industry, we believe we are the world’s largest manufacturer of cabin interior products for commercial aircraft and for business jets. We sell our products and provide our services directly to virtually all of the world’s major airlines and aerospace manufacturers. In addition, based on our experience, we believe that we have achieved leading global market positions in each of our major product categories, which include:
|
· |
commercial aircraft seats, including an extensive line of super first class, first class, business class, tourist class and regional aircraft seats; |
|
· |
a full line of aircraft food and beverage preparation and storage equipment, including coffee and espresso makers, water boilers, beverage containers, refrigerators, freezers, chillers and a line of ovens that includes microwave, high efficiency convection and steam ovens; |
|
· |
modular lavatory systems, wastewater management systems and galley systems; |
|
· |
both chemical and gaseous aircraft oxygen storage, distribution and delivery systems, protective breathing equipment and a broad range of lighting products; and |
|
· |
business jet and general aviation interior products, including an extensive line of executive aircraft and helicopter seats, direct and indirect overhead lighting systems, exterior lighting systems, passenger and crew oxygen systems, air valve systems, and high-end furniture and cabinetry. |
We provide comprehensive aircraft cabin interior reconfiguration, program management and certification services. In addition, we also design, engineer and manufacture customized fully integrated thermal and power management solutions for participants in the defense industry, aerospace OEMs and the airlines.
On December 16, 2014 (the “Distribution Date”), we completed the spin-off of KLX Inc. (“KLX”) by means of the transfer of our Consumables Management Segment (“CMS”) to KLX and the subsequent distribution to B/E Aerospace stockholders of all the outstanding shares of KLX common stock (the “Spin-Off”). We retained our commercial aircraft and business jet segments. On the Distribution Date, each of our stockholders of record as of the close of business on December 5, 2014 (the “Record Date”) received one share of KLX common stock for every two shares of our common stock held as of the Record Date.
During the third quarter of 2015, the Company implemented a cost reduction program. The charges reflect costs associated with facilities consolidation, product line rationalization, workforce reductions and program discontinuance. The Company expects these initiatives to offset inflationary pressures on wages, occupancy and infrastructure costs, and to be substantially complete by the end of the third quarter of 2016.
We generally derive our revenues from the sale of our cabin interior equipment for new aircraft deliveries for the new build market and from refurbishment or upgrade programs for the existing worldwide fleets of commercial and general aviation aircraft and the aftermarket. For the 2015, 2014 and 2013 years, approximately 40% of our revenues were derived from the aftermarket, with the remaining portions attributable to the sale of cabin interior equipment associated with new aircraft deliveries. We believe our large installed base of commercial and general aviation aircraft cabin interior products for the principal products of the type which we manufacture, valued at replacement prices, of approximately $12.3 billion as of December 31, 2015, gives us a significant advantage over our competitors in obtaining orders both for spare parts and for refurbishment programs, principally due to the tendency of the airlines to purchase equipment for such programs from the incumbent supplier. Approximately 62% of our booked backlog is
35
expected to be delivered over the next twelve months, and approximately 28% is expected to be delivered over the following twelve month period.
We conduct our operations through strategic business units that have been aggregated under two reportable segments: commercial aircraft and business jet.
Revenues by reportable segment for the years ended December 31, 2015, 2014 and 2013 were as follows:
|
|
|
Year Ended December 31, |
|
|||||||||||||
|
|
|
2015 |
|
2014 |
|
2013 |
|
|||||||||
|
|
|
|
|
|
% of |
|
|
|
|
% of |
|
|
|
|
% of |
|
|
|
|
Revenues |
|
Revenues |
|
Revenues |
|
Revenues |
|
Revenues |
|
Revenues |
|
|||
|
Commercial aircraft |
|
$ |
2,098.3 |
|
76.9 |
% |
$ |
2,058.9 |
|
79.2 |
% |
$ |
1,784.7 |
|
81.0 |
% |
|
Business jet |
|
|
631.3 |
|
23.1 |
% |
|
540.1 |
|
20.8 |
% |
|
418.6 |
|
19.0 |
% |
|
Total revenues |
|
$ |
2,729.6 |
|
100.0 |
% |
$ |
2,599.0 |
|
100.0 |
% |
$ |
2,203.3 |
|
100.0 |
% |
Substantially all of our sales and purchases are denominated in U.S. dollars, which is consistent with the industry. Revenues by domestic and foreign operations for the years ended December 31, 2015, 2014 and 2013 were as follows:
|
|
|
Year Ended December 31, |
|
|||||||
|
|
|
2015 |
|
2014 |
|
2013 |
|
|||
|
Domestic |
|
$ |
1,619.3 |
|
$ |
1,552.8 |
|
$ |
1,315.2 |
|
|
Foreign |
|
|
1,110.3 |
|
|
1,046.2 |
|
|
888.1 |
|
|
Total revenues |
|
$ |
2,729.6 |
|
$ |
2,599.0 |
|
$ |
2,203.3 |
|
Revenues by geographic segment (based on destination) for the years ended December 31, 2015, 2014 and 2013 were as follows:
|
|
|
Year Ended December 31, |
|
|||||||||||||||
|
|
|
2015 |
|
|
2014 |
|
|
2013 |
|
|||||||||
|
|
|
|
|
|
% of |
|
|
|
|
|
% of |
|
|
|
|
|
% of |
|
|
|
|
Revenues |
|
Revenues |
|
|
Revenues |
|
Revenues |
|
|
Revenues |
|
Revenues |
|
|||
|
U.S. |
|
$ |
966.3 |
|
35.4 |
% |
|
$ |
859.1 |
|
33.1 |
% |
|
$ |
788.3 |
|
35.8 |
% |
|
Europe |
|
|
663.5 |
|
24.3 |
% |
|
|
684.6 |
|
26.3 |
% |
|
|
549.3 |
|
24.9 |
% |
|
Asia, Pacific Rim, Middle East and Other |
|
|
1,099.8 |
|
40.3 |
% |
|
|
1,055.3 |
|
40.6 |
% |
|
|
865.7 |
|
39.3 |
% |
|
Total revenues |
|
$ |
2,729.6 |
|
100.0 |
% |
|
$ |
2,599.0 |
|
100.0 |
% |
|
$ |
2,203.3 |
|
100.0 |
% |
New product development is a strategic initiative for us. Our customers regularly request that we engage in new product development and enhancement activities. We believe that these activities protect and enhance our leadership position. We believe our investments in research and development over the past several years have been the driving force behind our ongoing market share gains. As of December 31, 2015 we employed approximately 2,236 engineers and program managers. Engineering, research and development (“ER&D”) expense was approximately 10.1% of revenues during 2015. We expect research and development expense to approximate 10.0% of revenues during 2016.
We also believe in providing our businesses with the tools required to remain competitive. In that regard, we have invested, and will continue to invest, in property and equipment that enhance our productivity. Taking into consideration recent program awards to deliver multi-year programs for various Airbus and Boeing aircraft, our targeted capacity utilization levels, recent acquisitions and current industry conditions, we expect that capital expenditures will be approximately $90 during 2016.
36
RESULTS OF OPERATIONS
Year Ended December 31, 2015 Compared to the Year Ended December 31, 2014
Revenues for the year ended December 31, 2015 were $2,729.6, an increase of 5.0% as compared to 2014.
Revenues for each of our segments are set forth in the following table:
|
|
|
|
|
|
|
|
|
|
|
|
|
|
|
|
|
Year Ended December 31, |
|
|||||||||
|
|
|
|
|
|
|
|
|
|
|
|
Percent |
|
|
|
|
2015 |
|
2014 |
|
Change |
|
Change |
|
|||
|
Commercial aircraft |
|
$ |
2,098.3 |
|
$ |
2,058.9 |
|
$ |
39.4 |
|
1.9 |
% |
|
Business jet |
|
|
631.3 |
|
|
540.1 |
|
|
91.2 |
|
16.9 |
% |
|
Total revenues |
|
$ |
2,729.6 |
|
$ |
2,599.0 |
|
$ |
130.6 |
|
5.0 |
% |
For the year ended December 31, 2015, consolidated revenues of $2,729.6 increased $130.6, or 5.0% (5.8% constant currency) over the prior year. Commercial Aircraft Segment (“CAS”) 2015 revenues of $2,098.3 increased $39.4, or 1.9% (2.8% constant currency), as compared with 2014 as a result of higher volumes of buyer furnished equipment, including aftermarket products, sold directly to our airline and leasing customers and seller furnished equipment (“SFE”) programs sold to the aircraft OEMs offset by lower volumes of products sold to Russia and the adverse effects of currency. Business Jet Segment (“BJS”) 2015 revenues of $631.3 increased $91.2, or 16.9%, as compared with 2014 as a result of higher volumes of super first class products.
During 2015, the Company recognized a $49.0 charge in connection with its cost reduction program. This program includes costs associated with facilities consolidation, product rationalization, workforce reductions and program discontinuance. During 2014, the Company recognized $60.1 of charges primarily related to business repositioning and expedited development costs. These costs are included in the amounts and descriptions below, unless indicated otherwise.
Cost of sales for 2015 was $1,642.5, or 60.2% of revenues, as compared with cost of sales of $1,582.8, or 60.9% of revenues, in the prior year period. Gross margins increased by 70 basis points primarily due to favorable product mix for buyer furnished equipment and aftermarket products partially offset by unfavorable product mix at BJS. Excluding the restructuring charge, cost of sales was 59.6% of revenues for 2015.
Selling, general and administrative (“SG&A”) expense for 2015 were $360.4, or 13.2% of revenues, as compared with $347.9, or 13.4% of revenues in 2014. The decrease in SG&A expense as a percentage of revenues reflects lower relative spending offset by unfavorable impact of foreign currency as compared to the prior period. Excluding the restructuring charge, SG&A expense was 12.1% of revenues for 2015. We expect that SG&A expense will approximate 12.0% of revenues for the full year of 2016.
Engineering, research and development (“ER&D”) expense for 2015 was $274.4 or 10.1% of revenues as compared with $284.3 or 10.9% of revenues in 2014. The 80 basis point decrease in spending is primarily due to program mix and lower research and development expense. During 2015, we applied for 289 U.S. and foreign patents as compared with 317 during 2014. Excluding the restructuring charge, ER&D expense was 9.9% of revenues for 2015. We expect that ER&D expense will approximate 10.0% of revenues for the full year of 2016.
For the year ended December 31, 2015, operating earnings of $452.3 increased $68.3, or 17.8% as compared with the prior year. Operating margin in 2015 of 16.6% increased 180 basis points as compared with 2014. Excluding the restructuring charge, operating earnings were $501.3 and operating margin was 18.4% for 2015.
37
The foregoing results were achieved in spite of significant macro headwinds that we confronted during 2015. Such headwinds included adverse foreign exchange impacts and the collapse in oil prices, which negatively impacted our business with Russia and other emerging countries, as well as our business jet and helicopter OEM customers.
The following is a summary of operating earnings performance by segment:
|
|
|
Year Ended December 31, |
|
|||||||||
|
|
|
|
|
|
|
|
|
|
|
|
Percent |
|
|
|
|
2015 |
|
2014 |
|
Change |
|
Change |
|
|||
|
Commercial aircraft |
|
$ |
367.5 |
|
$ |
356.3 |
|
$ |
11.2 |
|
3.1 |
% |
|
Business jet |
|
|
84.8 |
|
|
50.0 |
|
|
34.8 |
|
69.6 |
% |
|
KLX corporate allocations |
|
|
— |
|
|
(22.3) |
|
|
22.3 |
|
— |
% |
|
Total operating earnings |
|
$ |
452.3 |
|
$ |
384.0 |
|
$ |
68.3 |
|
17.8 |
% |
For the year ended December 31, 2015, CAS revenues of $2,098.3 increased 1.9% (2.8% constant currency) over the prior year. Operating earnings of $367.5 increased 3.1% as compared with the prior year and operating margin of 17.5% increased by 20 basis points as a result of lower operating costs. Operating earnings excluding the restructuring charge were $396.8, or 18.9% of revenues for the year ended December 31, 2015.
For the year ended December 31, 2015, BJS revenues of $631.3 increased 16.9% over the prior year. Operating earnings of $84.8 increased 69.6% as compared with the prior year period and operating margin of 13.4% increased 410 basis points as a result of favorable product mix and better program performance. Operating earnings excluding the restructuring charge were $104.5, or 16.6% of revenues for the year ended December 31, 2015.
Interest expense for the year ended December 31, 2015 of $94.8 decreased by $35.8 as a result of lower effective borrowing rates associated with the Company’s debt outstanding and a lower amount of debt outstanding.
2015 income tax expense of $70.9 was $118.8 greater than the $47.9 income tax benefit for 2014. Taxes for 2014 were primarily affected by the impact of the Spin-Off and the associated refinancing of our credit facilities, including debt extinguishment costs.
2015 net earnings and earnings per diluted share were $285.7 and $2.73 per share. Excluding the restructuring charge, net earnings and earnings per diluted share were $316.4 and $3.03 per share.
Year Ended December 31, 2014 Compared to the Year Ended December 31, 2013
Revenues for the year ended December 31, 2014 were $2,599.0, an increase of 18.0% as compared to 2013.
Revenues for each of our segments are set forth in the following table:
|
|
|
|
|
|
|
|
|
|
|
|
|
|
|
|
|
Year Ended December 31, |
|
|||||||||
|
|
|
|
|
|
|
|
|
|
|
|
Percent |
|
|
|
|
2014 |
|
2013 |
|
Change |
|
Change |
|
|||
|
Commercial aircraft |
|
$ |
2,058.9 |
|
$ |
1,784.7 |
|
$ |
274.2 |
|
15.4 |
% |
|
Business jet |
|
|
540.1 |
|
|
418.6 |
|
|
121.5 |
|
29.0 |
% |
|
Total revenues |
|
$ |
2,599.0 |
|
$ |
2,203.3 |
|
$ |
395.7 |
|
18.0 |
% |
For the year ended December 31, 2014, consolidated revenues of $2,599.0 increased $395.7, or 18.0% over the prior year. CAS 2014 revenues of $2,058.9 increased $274.2, or 15.4%, as compared with 2013 as a result of higher volumes of new equipment seating and life support systems. BJS 2014 revenues
38
of $540.1 increased $121.5, or 29.0%, as compared with 2013 as a result of higher sales of super first class products and the acquisitions completed in 2014.
Cost of sales for 2014 of $1,582.8 increased by $286.8, as compared with the prior year. The 210 basis point increase in cost of sales as a percentage of total revenues is primarily due to a higher level of spending within BJS to facilitate expedited development of a new product suite to support a major customer initiative in addition to an unfavorable product mix.
SG&A expense for 2014 was $347.9, or 13.4% of revenues, as compared with $323.5, or 14.7% of revenues in 2013. The higher level of SG&A expense in 2014 is primarily due to costs and expenses associated with the 18.0% increase in revenues and the 2014 acquisitions which were somewhat offset by lower marketing expenses as a percentage of revenues.
ER&D expense for 2014 was $284.3 or 10.9% of revenues as compared with $220.9 or 10.0% of revenues in 2013. The $63.4 increase in spending is primarily due to new product development activities in CAS associated with our growing backlog and the impact of the acquisitions completed in 2014. During 2014, we applied for 317 U.S. and foreign patents as compared with 225 during 2013.
For the year ended December 31, 2014, operating earnings of $384.0 increased $21.1, or 5.8% as compared with the prior year. Operating margin in 2014 of 14.8% decreased 170 basis points as compared with 2013 primarily as a result of $60.1 of business repositioning and acquisition costs.
The following is a summary of operating earnings performance by segment:
|
|
|
|
|
|
|
|
|
|
|
|
|
|
|
|
|
Year Ended December 31, |
|
|||||||||
|
|
|
|
|
|
|
|
|
|
|
|
Percent |
|
|
|
|
2014 |
|
2013 |
|
Change |
|
Change |
|
|||
|
Commercial aircraft |
|
$ |
356.3 |
|
$ |
320.3 |
|
$ |
36.0 |
|
11.2 |
% |
|
Business jet |
|
|
50.0 |
|
|
69.1 |
|
|
(19.1) |
|
(27.6) |
% |
|
KLX corporate allocations |
|
|
(22.3) |
|
|
(26.5) |
|
|
4.2 |
|
(15.8) |
% |
|
Total operating earnings |
|
$ |
384.0 |
|
$ |
362.9 |
|
$ |
21.1 |
|
5.8 |
% |
For the year ended December 31, 2014, CAS operating earnings of $356.3 increased 11.2% as compared with the prior year and operating margin of 17.3% decreased by 60 basis points as a result of business repositioning costs of $18.8 in 2014.
For the year ended December 31, 2014, BJS operating earnings of $50.0 decreased 27.6% as compared with the prior year period. Operating earnings and operating margin were negatively impacted by one-time costs totaling $41.3. The one-time costs reflect higher engineering and product launch costs to support expedited deliveries associated with new business development of a unique new product suite to support a major customer initiative as well as costs associated with the 2014 acquisitions.
Interest expense for the year ended December 31, 2014 of $130.6 increased by $7.2 as a result of higher borrowing levels under the Company’s revolving credit facility during 2014. As a result of the Spin-Off during the fourth quarter, we recorded a $243.6 loss on the early extinguishment of debt aggregating $2.6 billion.
2014 income tax benefit of $47.9 was $92.5 less than the $44.6 income tax expense for 2013. The change reflects the underlying effective tax rate for 2014 of approximately 22% and the applicable marginal tax related impact of the following specified items: KLX corporate allocations, business repositioning, acquisition costs and charges related to the early extinguishment of debt. The 2013 effective tax rate of approximately 18.6% is different from the 2014 effective tax rate of approximately 22% mainly due to the inclusion of both the 2012 and 2013 U.S. R&D tax credit in 2013.
39
2014 net earnings from continuing operations and earnings from continuing operations per diluted share were $57.7 and $0.55 per share, reflecting decreases of 70.4% and 70.9%, respectively, as compared with the prior year for the reasons set forth above.
2014 net earnings from discontinued operations and earnings from discontinued operations per diluted share were $46.6 and $0.45 per share, reflecting decreases of 72.7% and 72.7%, respectively, as compared with the prior year.
2014 net earnings and earnings per diluted share were $104.3 and $1.00 per share, reflecting decreases of 71.5% and 71.8%, respectively.
Spin-off of KLX
On June 10, 2014, we announced a plan to spin-off CMS into a separate publicly traded company. To accomplish the Spin-Off, we formed KLX. On the Distribution Date, we completed the Spin-Off by means of the transfer of CMS to KLX and the subsequent distribution to our stockholders of all of the outstanding shares of KLX common stock. The historical operating results of CMS prior to the Spin-Off are excluded from earnings from continuing operations and are presented as earnings from discontinued operations in our consolidated statements of earnings and comprehensive income. Discontinued operations include the results of KLX’s business except for certain corporate overhead costs and certain costs associated with transition services that will be provided by us to KLX. Discontinued operations also include other costs incurred by us to Spin-Off KLX. The assets, liabilities, and cash flows of CMS are included in our consolidated balance sheet and our consolidated statements of cash flows for periods prior to December 16, 2014.
The following is a summary of the assets and liabilities transferred to KLX as part of the Spin-Off on December 16, 2014: (in millions)
|
Assets |
|
|
|
|
|
Cash and cash equivalents |
|
$ |
460.0 |
|
|
Accounts receivable |
|
|
310.8 |
|
|
Inventories |
|
|
1,303.4 |
|
|
Deferred income taxes |
|
|
40.2 |
|
|
Other current assets |
|
|
52.3 |
|
|
Property and equipment |
|
|
323.1 |
|
|
Goodwill |
|
|
1,370.4 |
|
|
Identifiable intangible assets |
|
|
430.7 |
|
|
Other assets |
|
|
119.1 |
|
|
|
|
|
4,410.0 |
|
|
Liabilities |
|
|
|
|
|
Accounts payable |
|
|
167.1 |
|
|
Accrued liabilities |
|
|
182.4 |
|
|
Long-term debt |
|
|
1,200.0 |
|
|
Deferred income taxes |
|
|
121.1 |
|
|
Other non-current liabilities |
|
|
112.0 |
|
|
|
|
|
1,782.6 |
|
|
Net assets divested in the Spin-Off |
|
$ |
2,627.4 |
|
40
The operating results of our Discontinued Operations for the period January 1, 2014 through December 16, 2014 (prior to the Spin-Off) are presented as follows:
|
|
|
|
|
|
|
Revenues |
|
$ |
1,611.2 |
|
|
Cost of sales |
|
|
1,144.7 |
|
|
Selling, general and administrative expenses |
|
|
258.6 |
|
|
Earnings before income taxes |
|
$ |
207.9 |
|
We entered into transitional services agreements with KLX prior to the Spin-Off pursuant to which we and KLX are providing various services to each other on an interim transitional basis. Transition services may be provided for up to 24 months, and for information technology services, KLX has an option for a one-year extension. Services being provided by us include certain information technology and back office support. We record billings under these transition services agreements which are recorded as a reduction of the costs of the respective service in the applicable expense category in the Consolidated Statement of Earnings. This transitional support will enable KLX to establish its stand-alone processes for various activities that were previously provided by us and does not constitute significant continuing support of KLX’s operations.
Under the Tax Sharing and Indemnification Agreement between the Company and KLX we generally assume liability for all federal and state income taxes for all tax periods ending on or prior to December 31, 2014. We assume the liability for all federal and state income taxes of KLX’s U.S. operations through the Distribution Date. KLX assumes all other federal taxes, foreign income tax/non-income taxes and state/local non-income taxes related to their business for all periods and we assume all other federal taxes, foreign income tax/non-income taxes and state/local non-income taxes related to our business for all periods. Additional taxes incurred related to the internal restructuring to separate the businesses to complete the Spin-Off shall be shared equally between the Company and KLX. Taxes incurred related to certain international tax initiatives for the KLX business shall be assumed by KLX subject to the calculation provisions of the Tax Sharing and Indemnification Agreement. In addition, we transferred to KLX all of its deferred tax assets and liabilities as of December 16, 2014.
In connection with the Spin-Off, we have adjusted our employee stock compensation awards and separated our employee medical and dental benefit plans.
41
LIQUIDITY AND CAPITAL RESOURCES
Current Financial Condition
As of December 31, 2015, our net debt-to-net-capital ratio was 97.1%. Net debt was $1,880.0, which represented total debt of $2,034.1, less cash and cash equivalents of $154.1. As of December 31, 2015, net capital (total debt plus total stockholders’ equity less cash and cash equivalents) was $1,935.5.
In connection with the Spin-Off, the Company entered into its Credit Agreement, dated as of December 16, 2014 consisting of (a) a five-year, $600.0 revolving credit facility (the “Revolving Credit Facility”) and (b) a seven-year, $2,200.0 term loan facility (the “Term Loan Facility”). At December 31, 2015 and 2014 there were no amounts outstanding under the Revolving Credit Facility. The Revolving Credit Facility matures in December 2019 unless terminated earlier. Outstanding long-term debt as of December 31, 2015 consisted of $2,064.0 outstanding under the Term Loan Facility, none of which was current. During 2015, the Company repaid $136.0 of its outstanding Term Loan Facility. On a net basis, after taking into consideration the unamortized original issue discount and debt issue costs for the Term Loan Facility, long-term debt was $2,034.1.
Cash on hand at December 31, 2015 decreased by $138.4 as compared with cash on hand at December 31, 2014 primarily as a result of cash flows from operating activities of $310.8, less capital expenditures of $80.5, dividend payments of $79.3, share repurchases of $155.3 and debt repayments of $136.0. Our liquidity requirements consist of working capital needs, ongoing capital expenditures, payments of interest and principal on our indebtedness and any dividends or share repurchases. Our primary requirements for working capital are directly related to the level of our operations. Our sources of liquidity are from cash on hand, cash flow from operations and the Revolving Credit Facility. As of December 31, 2015, we had $154.1 of cash and cash equivalents and the Revolving Credit Facility with no borrowings outstanding and no maturities in the near term. In addition, the substantial majority of our cash is held within the United States and all of our foreign cash may be brought back into the United States in a tax efficient manner.
Working capital as of December 31, 2015 was $836.2, a decrease of $16.6 as compared with working capital at December 31, 2014. As of December 31, 2015, total current assets increased by $22.0 and total current liabilities increased by $38.6, as compared to the prior year. The increase in current assets resulted from a $138.4 decrease in cash as described above, a $66.3 increase in accounts receivable, and an increase in inventories of $167.6 (both net of foreign currency translations). The increase in total current liabilities was primarily due to increases in accounts payable of $25.5 and accrued liabilities of $30.5.
Cash Flows
As of December 31, 2015, cash and cash equivalents were $154.1 as compared to $292.5 as of December 31, 2014. Cash provided by operating activities was $310.8 for the year ended December 31, 2015 as compared to $250.9 for the year ended December 31, 2014. The primary sources of cash provided by operating activities during 2015 were net earnings of $285.7, adjusted by depreciation and amortization of $85.3 and non-cash compensation of $30.2, and a $67.7 decrease in other current and non-current assets primarily related to a $58.7 decrease in income tax receivable and $5.0 of tax benefits realized from the prior exercises of employee stock options and restricted stock. The primary uses of cash in operating activities during the year ended December 31, 2015 were related to a $184.6 net increase in inventories and a $84.7 increase in accounts receivable.
As of December 31, 2014, cash and cash equivalents were $292.5 as compared to $637.8 as of December 31, 2013. Cash provided by operating activities, including CMS, was $250.9 for the year ended December 31, 2014 as compared to $379.1 for the year ended December 31, 2013. The primary sources of cash provided by operating activities during 2014 were net earnings of $104.3, adjusted by depreciation and amortization of $142.3 and non-cash compensation of $29.7. The primary uses of cash in operating activities during the year ended December 31, 2014 were related to a $284.0 net increase in inventories, a $77.0 increase in accounts receivable, a $220.2 increase in other current and non-current assets primarily
42
related to a $77.0 income tax receivable and $3.5 of tax benefits realized from the prior exercises of employee stock options and restricted stock.
As of December 31, 2013, cash and cash equivalents were $637.8 as compared to $513.7 at December 31, 2012. The primary sources of cash provided by operating activities during 2013 were net earnings of $365.6, adjusted by depreciation and amortization of $89.6, non-cash compensation of $24.2, and deferred income taxes of $32.9. The primary uses of cash in operating activities during the year ended December 31, 2013 were related to a $181.8 net increase in inventories, a $67.2 increase in accounts receivable and $9.2 of tax benefits realized from the prior exercises of employee stock options and restricted stock.
The primary uses of cash in investing activities during the year ended December 31, 2015 were related to capital expenditures of $80.5. The primary uses of cash in investing activities, including CMS, during the year ended December 31, 2014 were related to capital expenditures of $255.6 and acquisitions of $1,043.1. The primary uses of cash in investing activities during the year ended December 31, 2013 were related to capital expenditures of $154.9 and acquisitions of $118.1.
The primary uses of cash in financing activities during the year ended December 31, 2015 were related to purchases of treasury stock including share repurchases of $155.3, principal payments on long-term debt of $136.0 and cash paid for dividends of $79.3. The primary source of cash in financing activities during the year ended December 31, 2014 were proceeds from the Term Loan Facility.
Capital Spending
Our capital expenditures were $80.5 and $255.6 during the years ended December 31, 2015 and 2014, respectively. Capital expenditures from our continuing operations were $80.5 in 2015 compared to $131.6 in 2014. Taking into consideration our backlog, including approximately $5,600 of awarded but unbooked backlog, targeted capacity utilization levels, recent capital expenditure investments, recent acquisitions and current industry conditions, we anticipate capital expenditures of approximately $90 during 2016. We have no material commitments for capital expenditures. We have, in the past, generally funded our capital expenditures from cash from operations and funds available to us under bank credit facilities. We expect to fund future capital expenditures from cash on hand, from operations and from funds available to us under the Revolving Credit Facility.
Between 1989 and 2014, we completed 31 acquisitions associated with continuing operations for an aggregate purchase price of approximately $1.8 billion. All of our acquisitions over the past four years were financed with cash on hand, our then existing credit facilities or new debt issuances.
Payment of Cash Dividends and Share Repurchase Program
During the first quarter of 2015, the Company declared a quarterly cash dividend of $0.19 per share on its common stock, resulting in total dividends of $19.9. During the second quarter of 2015, the Company declared a quarterly cash dividend of $0.19 per share on its common stock, resulting in total dividends of $19.9. During the third quarter of 2015, the Company declared a quarterly cash dividend of $0.19 per share on its common stock, resulting in total dividends of $19.8. During the fourth quarter of 2015, the Company declared a quarterly cash dividend of $0.19 per share on its common stock, resulting in total dividends of $19.6.
On November 13, 2014, the Company announced that its Board of Directors authorized a $400.0 share repurchase program. During 2015, the Company repurchased 3,347,258 shares of common stock at an average price of $44.84 per share for a total of $150.1. In addition, during 2015, we repurchased 117,349 shares of our common stock from employees in connection with the settlement of income taxes and related benefits withholding obligations arising from vesting of restricted stock. At December 31, 2015, the Company had $249.9 of authorization remaining under its share repurchase program.
43
Outstanding Debt and Other Financing Arrangements
Long-term debt at December 31, 2015 primarily consisted of a $2,064.0 Term Loan Facility ($2,034.1 net of debt issue costs and original issue discount).
We also have the Revolving Credit Facility. The Revolving Credit Facility provides an option to request additional incremental revolving credit borrowing capacity and incremental term loans, in each case upon the satisfaction of certain customary terms and conditions. There were no amounts outstanding under the Revolving Credit Facility at December 31, 2015 and December 31, 2014, respectively.
Our obligations under the Credit Agreement are secured by liens on substantially all of our domestic assets, including a pledge of a portion of the capital stock of certain foreign subsidiaries owned directly. Amounts borrowed and outstanding under the Term Loan Facility will, in certain circumstances, be required to be prepaid with the proceeds from certain asset sales, subject to certain thresholds and reinvestment rights. The Term Loan Facility amortizes at 1% of the initial funded principal amount annually, with the balance due for repayment at final maturity in December 2021. At the Company’s election, the Credit Agreement allows for the prepayment of the Term Loan Facility to be applied to reduce any subsequent scheduled amortization payments. Unless terminated earlier or extended, the Revolving Credit Facility will mature in December 2019.
The Revolving Credit Facility contains an interest coverage ratio financial covenant (as defined in the facility) that must be maintained at a level greater than 3.0 to 1. The Revolving Credit Facility also contains a total leverage ratio covenant (as defined in the facility) which limits gross debt to a 5.25 to 1 multiple of EBITDA (as defined in the facility). The Credit Agreement contains customary affirmative covenants, negative covenants, restrictions on the payment of dividends and the repurchase of our stock and conditions precedent for borrowing. We were in compliance with all of the covenants, restrictions and conditions precedent in the Credit Agreement as of December 31, 2015.
Contractual Obligations
The following chart reflects our contractual obligations and commercial commitments as of December 31, 2015. Commercial commitments include lines of credit, guarantees and other potential cash outflows resulting from a contingent event that requires performance by us or our subsidiaries pursuant to a funding commitment.
|
Contractual Obligations |
|
2016 |
|
2017 |
|
2018 |
|
2019 |
|
2020 |
|
Thereafter |
|
Total |
|
|||||||
|
Long-term debt and other non-current liabilities(1) |
|
$ |
— |
|
$ |
3.8 |
|
$ |
1.2 |
|
$ |
1.3 |
|
$ |
1.3 |
|
$ |
2,073.8 |
|
$ |
2,081.4 |
|
|
Operating leases |
|
|
27.6 |
|
|
25.5 |
|
|
23.4 |
|
|
20.4 |
|
|
18.7 |
|
|
74.5 |
|
|
190.1 |
|
|
Purchase obligations(2) |
|
|
5.9 |
|
|
— |
|
|
— |
|
|
— |
|
|
— |
|
|
— |
|
|
5.9 |
|
|
Future interest payment on outstanding debt(3) |
|
|
85.0 |
|
|
85.0 |
|
|
85.0 |
|
|
85.0 |
|
|
85.0 |
|
|
85.0 |
|
|
510.0 |
|
|
Total |
|
$ |
118.5 |
|
$ |
114.3 |
|
$ |
109.6 |
|
$ |
106.7 |
|
$ |
105.0 |
|
$ |
2,233.3 |
|
$ |
2,787.4 |
|
|
|
|
|
|
|
|
|
|
|
|
|
|
|
|
|
|
|
|
|
|
|
|
|
|
Commercial Commitments |
|
|
|
|
|
|
|
|
|
|
|
|
|
|
|
|
|
|
|
|
|
|
|
Letters of Credit |
|
$ |
7.7 |
|
|
— |
|
|
— |
|
|
— |
|
|
— |
|
|
— |
|
$ |
7.7 |
|
|
(1) |
Our liability for unrecognized tax benefits of $89.1 at December 31, 2015 has been omitted from the above table because we cannot determine with certainty when this liability will be settled. It is reasonably possible that the amount of liability for unrecognized tax benefits will change in the next twelve months; however, we do not expect the change to have a material impact on our consolidated financial statements. |
|
(2) |
Occasionally, we enter into purchase commitments for production materials and other items, which are reflected in the table above. We also enter into unconditional purchase obligations with various vendors and suppliers of goods and services in the normal course of operations through purchase orders or other documentation or just with an invoice. Such obligations are generally outstanding for periods less than a year and are settled by cash payments upon delivery of goods and services and are not reflected in purchase obligations. |
44
|
(3) |
Interest payments include interest payments due on the Term Loan Facility based on minimum principal payments and using the London interbank offered rate (“LIBOR”) as in effect at December 31, 2015 which was the higher of three-month LIBOR or 0.75%. Actual interest payments on the Term Loan Facility and, to the extent we draw under it, the Revolving Credit Facility, will fluctuate based on LIBOR or the ABR (as defined in the Credit Agreement) pursuant to their terms. |
We believe that our cash flows, together with cash on hand and the availability under the Revolving Credit Facility, provide us with the ability to fund our operations, make planned capital expenditures, make scheduled debt service payments and fund dividends and share repurchases, if any, for at least the next twelve months. However, such cash flows are dependent upon our future operating performance, which, in turn, is subject to prevailing economic conditions and to financial, business and other factors, including the conditions of our markets, some of which are beyond our control. If, in the future, we cannot generate sufficient cash from operations to meet our debt service or other obligations, we will need to refinance such debt obligations, obtain additional financing or sell assets. We cannot assure you that our business will generate cash from operations or that we will be able to obtain financing from other sources sufficient to satisfy our debt service, dividends, share repurchases or other requirements.
Off-Balance Sheet Arrangements
Lease Arrangements
We finance our use of certain equipment under committed lease arrangements provided by various financial institutions. Since the terms of these arrangements meet the accounting definition of operating lease arrangements, the aggregate sum of future minimum lease payments is not reflected in our consolidated balance sheet. Future minimum lease payments under these arrangements aggregated approximately $190.1 at December 31, 2015.
Indemnities, Commitments and Guarantees
During the normal course of business, we made certain indemnities, commitments and guarantees under which we may be required to make payments in relation to certain transactions. These indemnities include non-infringement of patents and intellectual property indemnities to our customers in connection with the delivery, design, manufacture and sale of our products, indemnities to various lessors in connection with facility leases for certain claims arising from such facility or lease, and indemnities to other parties to certain acquisition agreements. The duration of these indemnities, commitments and guarantees varies, and in certain cases, is indefinite. We believe that many of our indemnities, commitments and guarantees provide for limitations on the maximum potential future payments we could be obligated to make. However, we are unable to estimate the maximum amount of liability related to our indemnities, commitments and guarantees because such liabilities are contingent upon the occurrence of events that are not reasonably determinable. We believe that any liability for these indemnities, commitments and guarantees would not be material to our consolidated financial statements.
We record backlog when we enter into a definitive order for the delivery of products to our customers in the future. Within backlog, we differentiate between booked backlog and awarded but unbooked backlog. For manufacturing programs, generally if there are definitive delivery dates then the backlog is considered booked. When we receive the delivery date specificity in writing from our customers on these long-term contracts, we include such amount in booked backlog. If a contract does not provide that level of specificity, the production requirements are generally provided to us through purchase orders issued against the underlying contracts at which point the amount of the purchase orders is classified as booked. The remaining portion of the underlying contract is considered awarded but unbooked.
Critical Accounting Policies
The discussion and analysis of our financial condition and results of operations is based upon our consolidated financial statements, which have been prepared in accordance with accounting principles
45
generally accepted in the United States of America. The preparation of these financial statements requires us to make estimates and judgments that affect the reported amount of assets and liabilities, revenues and expenses, and related disclosure of contingent assets and liabilities at the date of our financial statements. Actual results may differ from these estimates under different assumptions or conditions.
Critical accounting policies are defined as those that are reflective of significant judgments and uncertainties, and potentially result in materially different results under different assumptions and conditions. We believe that our critical accounting policies are limited to those described below. For a detailed discussion on the application of these and other accounting policies, see note 1 to our consolidated financial statements.
Revenue Recognition
Product revenues are recorded when the earnings process is complete. This generally occurs when the products are shipped to the customer in accordance with the contract or purchase order, risk of loss and title has passed to the customer, collectability is reasonably assured and pricing is fixed and determinable. In instances where title does not pass to the customer upon shipment, we recognize revenue upon delivery or customer acceptance, depending on the terms of the sales contract.
Service revenues primarily consist of engineering activities and are recorded when services are performed.
Revenues and costs under certain long-term contracts are recognized using contract accounting under the percentage-of-completion method in accordance with Accounting Standards Codification (“ASC”) 605-35, Construction–Type and Production–Type Contracts, with the majority of the contracts accounted for under the cost-to-cost method. Under the cost-to-cost method, the revenues related to the long-term contracts are recognized based on the ratio of actual costs incurred to total estimated costs to be incurred. We also use the units-of-delivery method to account for certain of our contracts. Under the units-of-delivery method, revenues are recognized based on the contract price of units delivered.
The percentage-of-completion method requires the use of estimates of costs to complete long-term contracts. Due to the duration of these contracts as well as the technical nature of the products involved, the estimation of these costs requires management judgment in connection with assumptions and projections related to the outcome of future events. Management’s assumptions include future labor performance and rates and projections relative to material and overhead costs, as well as the quantity and timing of product deliveries. We re-evaluate our contract estimates periodically and reflect changes in estimates in the current period using the cumulative catch-up method. There were no significant changes in our contract estimates during 2015, 2014 or 2013 that resulted in material cumulative catch-up adjustments to operating earnings other than cost estimate changes resulting from the extraordinary expedited development of a new product suite to support a major customer initiative during 2014. Revenues associated with any contractual claims are recognized when it is probable that the claim will result in additional contract revenue and the amount can be reasonably estimated. Anticipated losses on contracts are recognized in the period in which the losses become evident and determinable. Advance payments and engineering development costs on certain long-term contracts are deferred and included in revenues and research, development and engineering, respectively, when the products are shipped.
Accounts Receivable
We perform ongoing credit evaluations of our customers and adjust credit limits based upon payment history and the customer's current creditworthiness, as determined by our review of their current credit information. We continuously monitor collections and payments from our customers and maintain an allowance for estimated credit losses based upon our historical experience and any specific customer collection issues that we have identified. If the actual uncollected amounts significantly exceed the estimated allowance, our operating results would be significantly adversely affected. While such credit
46
losses have historically been within our expectations and the provisions established, we cannot guarantee that we will continue to experience the same credit loss rates that we have in the past.
Inventories
We value our inventories at the lower of cost to purchase, using FIFO or weighted average cost method, or market. The inventory balance, which includes the cost of raw materials, purchased parts, labor and production overhead costs, is recorded net of a reserve for excess, obsolete or unmarketable inventories. We regularly review inventory quantities on hand and record a reserve for excess, obsolete and unmarketable inventories based primarily on historical usage and on our estimated forecast of product demand and production requirements. In accordance with industry practice, costs in inventory include amounts relating to long-term contracts with long production cycles and to inventory items with long procurement cycles, some of which are not expected to be realized within one year. Demand for our products can fluctuate significantly. Our estimates of future product demand may prove to be inaccurate, in which case we may have understated or overstated the provision required for excess, obsolete and unmarketable inventories. In the future, if our inventories are determined to be overvalued, we would be required to recognize such costs in our cost of goods sold at the time of such determination. Likewise, if our inventories are determined to be undervalued, we may have over-reported our costs of goods sold in previous periods and would be required to recognize such additional operating income at the time of sale.
Long-Lived Assets and Goodwill
Goodwill, identifiable intangible assets and property and equipment were $813.2, $231.3, and $391.2 and $840.4, $250.7 and $397.6 at December 31, 2015 and 2014, respectively. To conduct our global business operations and execute our strategy, we acquire tangible and intangible assets, which affect the amount of future period amortization expense and possible impairment expense that we may incur. The determination of the value of such intangible assets requires management to make estimates and assumptions that affect our consolidated financial statements. In accordance with ASC 350, Intangibles – Goodwill and Other (“ASC 350”), we assess potential impairment to goodwill of a reporting unit on an annual basis, or between annual tests if an event occurs or circumstances change that would more likely than not reduce the fair value of a reporting unit below its carrying amount. In accordance with ASC 360, Property, Plant, and Equipment, we assess potential impairment to long-lived assets (property and equipment and amortized intangible assets) when there is evidence that events or changes in circumstances indicate that the carrying amount of an asset may not be recovered. Our judgment regarding the existence of impairment indicators and future cash flows related to intangible assets is based on operational performance of our acquired businesses, expected changes in the global economy, aerospace industry projections, discount rates and other judgmental factors. Future events could cause us to conclude that impairment indicators exist and that goodwill or other acquired tangible or intangible assets associated with our acquired businesses are impaired. Any resulting impairment loss could have an adverse impact on our results of operations. As of December 31, 2015 and 2014, management believes the estimated fair value of each of our reporting units with goodwill balances were substantially in excess of their carrying values. There were no indicators of goodwill or intangible asset impairment at December 31, 2015 or 2014.
Accounting for Income Taxes
Significant management judgment is required in evaluating our tax positions and in determining our provision for income taxes, our deferred tax assets and liabilities and any valuation allowance recorded against our net deferred tax assets. We have recorded a valuation allowance of $17.1 as of December 31, 2015, due to uncertainties related to our ability to utilize our deferred tax assets, primarily consisting of our state net operating losses and research credits. The valuation allowance is based on our estimates of taxable income by jurisdictions in which we operate and the period over which our deferred tax assets will be recoverable. In the event that actual results differ from these estimates, or we revise these estimates in future periods, we may need to adjust the valuation allowance which could materially impact our financial position and results of operations. We have not provided for any residual U.S. income taxes on approximately $624.0
47
of earnings from our foreign subsidiaries because such earnings are intended to be indefinitely reinvested. It is not practicable to determine the amount of U.S. income and foreign withholding tax payable in the event all such foreign earnings are repatriated.
ITEM 7A. QUANTITATIVE AND QUALITATIVE DISCLOSURES ABOUT MARKET RISK
We are exposed to a variety of risks, including foreign currency fluctuations and changes in interest rates affecting the cost of our variable-rate debt.
Foreign currency – We have direct operations in Europe and the Philippines that receive revenues from customers primarily in U.S. dollars and we purchase raw materials and component parts from foreign vendors primarily in British pounds, Euros and Philippine pesos. Accordingly, we are exposed to transaction gains and losses that could result from changes in foreign currency exchange rates relative to the U.S. dollar. Our largest foreign currency exposure results from activity in British pounds and Euros.
From time to time, we and our foreign subsidiaries may enter into foreign currency exchange contracts to manage risk on transactions conducted in foreign currencies. At December 31, 2015, we had no outstanding foreign currency exchange contracts. In addition, we have not entered into any other derivative financial instruments.
Interest Rates – As of December 31, 2015, we have $2.1 billion of adjustable rate debt outstanding. We have not engaged in transactions intended to hedge our exposure to changes in interest rates. If adjustable interest rates were to increase or decrease by 10%, we estimate interest expense would increase or decrease by approximately $8.3 million.
As of December 31, 2015, we maintained a portfolio of cash securities consisting mainly of taxable, interest-bearing deposits with weighted average maturities of less than three months. If short-term interest rates were to increase or decrease by 10%, we estimate interest income would increase or decrease by less than $0.1 million.
ITEM 8. FINANCIAL STATEMENTS AND SUPPLEMENTARY DATA
The information required by this section is set forth beginning on page F-1 of this Form 10-K.
ITEM 9. CHANGES IN AND DISAGREEMENTS WITH ACCOUNTANTS ON ACCOUNTING AND FINANCIAL DISCLOSURE
None.
ITEM 9A. CONTROLS AND PROCEDURES
Disclosure Controls and Procedures
We carried out an evaluation, under the supervision and with the participation of our management, including our Chief Executive Officer and Vice President and Chief Financial Officer, of the effectiveness, as of December 31, 2015, of the design and operation of our disclosure controls and procedures (as defined in Rule 13a-15(e) of the Securities Exchange Act of 1934 (the “Exchange Act”)). Based upon that evaluation, our Chief Executive Officer and Vice President and Chief Financial Officer concluded that our disclosure controls and procedures were effective as of December 31, 2015.
48
Internal Control over Financial Reporting
There were no changes in our internal control over financial reporting that occurred during the fourth quarter of 2015 that have materially affected, or are reasonably likely to materially affect, our internal control over financial reporting.
49
MANAGEMENT’S ANNUAL REPORT ON INTERNAL CONTROL OVER FINANCIAL REPORTING
The management of B/E Aerospace, Inc. and its subsidiaries (the “Company”) is responsible for establishing and maintaining adequate internal control over financial reporting for the Company. Internal control over financial reporting is a process designed by, or under the supervision of, the Company’s principal executive and principal financial officers, and effected by the Company’s Board of Directors, management and other personnel, to provide reasonable assurance regarding the reliability of financial reporting and the preparation of the Company’s financial statements for external purposes in accordance with generally accepted accounting principles.
The Company’s internal control over financial reporting includes those policies and procedures that: (1) pertain to the maintenance of records that, in reasonable detail, accurately and fairly reflect the transactions and dispositions of the assets of the Company; (2) provide reasonable assurance that transactions are recorded as necessary to permit preparation of financial statements in accordance with generally accepted accounting principles and the receipts and expenditures of the Company are being made only in accordance with authorizations of the management and directors of the Company; and (3) provide reasonable assurance regarding prevention or timely detection of unauthorized acquisition, use or disposition of the Company’s assets that could have a material effect on the financial statements.
Because of its inherent limitations, internal control over financial reporting may not prevent or detect misstatements. Projections of any evaluation of effectiveness to future periods are subject to the risk that controls may become inadequate because of changes in conditions or that the degree of compliance with the policies or procedures may deteriorate.
The Company’s management assessed the effectiveness of the Company’s internal control over financial reporting as of December 31, 2015. In making the assessment, the Company’s management used the criteria set forth by the Committee of Sponsoring Organizations of the Treadway Commission in Internal Control – Integrated Framework (2013). Based on its assessment, management believes that, as of December 31, 2015, the Company’s internal control over financial reporting is effective.
The independent registered public accounting firm that audited the financial statements included in this annual report has issued an attestation report on the Company’s internal control over financial reporting.
50
REPORT OF INDEPENDENT REGISTERED PUBLIC ACCOUNTING FIRM
The Board of Directors and Stockholders of
B/E Aerospace, Inc.
Wellington, Florida
We have audited the internal control over financial reporting of B/E Aerospace, Inc. and subsidiaries (the "Company") as of December 31, 2015, based on criteria established in Internal Control — Integrated Framework (2013) issued by the Committee of Sponsoring Organizations of the Treadway Commission. The Company's management is responsible for maintaining effective internal control over financial reporting and for its assessment of the effectiveness of internal control over financial reporting, included in the accompanying Management’s Annual Report on Internal Control over Financial Reporting. Our responsibility is to express an opinion on the Company's internal control over financial reporting based on our audit.
We conducted our audit in accordance with the standards of the Public Company Accounting Oversight Board (United States). Those standards require that we plan and perform the audit to obtain reasonable assurance about whether effective internal control over financial reporting was maintained in all material respects. Our audit included obtaining an understanding of internal control over financial reporting, assessing the risk that a material weakness exists, testing and evaluating the design and operating effectiveness of internal control based on the assessed risk, and performing such other procedures as we considered necessary in the circumstances. We believe that our audit provides a reasonable basis for our opinion.
A company's internal control over financial reporting is a process designed by, or under the supervision of, the company's principal executive and principal financial officers, or persons performing similar functions, and effected by the company's board of directors, management, and other personnel to provide reasonable assurance regarding the reliability of financial reporting and the preparation of financial statements for external purposes in accordance with generally accepted accounting principles. A company's internal control over financial reporting includes those policies and procedures that (1) pertain to the maintenance of records that, in reasonable detail, accurately and fairly reflect the transactions and dispositions of the assets of the company; (2) provide reasonable assurance that transactions are recorded as necessary to permit preparation of financial statements in accordance with generally accepted accounting principles, and that receipts and expenditures of the company are being made only in accordance with authorizations of management and directors of the company; and (3) provide reasonable assurance regarding prevention or timely detection of unauthorized acquisition, use, or disposition of the company's assets that could have a material effect on the financial statements.
Because of the inherent limitations of internal control over financial reporting, including the possibility of collusion or improper management override of controls, material misstatements due to error or fraud may not be prevented or detected on a timely basis. Also, projections of any evaluation of the effectiveness of the internal control over financial reporting to future periods are subject to the risk that the controls may become inadequate because of changes in conditions, or that the degree of compliance with the policies or procedures may deteriorate.
In our opinion, the Company maintained, in all material respects, effective internal control over financial reporting as of December 31, 2015, based on the criteria established in Internal Control — Integrated Framework (2013) issued by the Committee of Sponsoring Organizations of the Treadway Commission.
We have also audited, in accordance with the standards of the Public Company Accounting Oversight Board (United States), the consolidated financial statements and financial statement schedule as of and for the year ended December 31, 2015 of the Company and our report dated February 25, 2016 expressed an unqualified opinion on those financial statements and financial statement schedule.
/s/ Deloitte & Touche LLP
Certified Public Accountants
Miami, Florida
February 25, 2016
51
None.
ITEM 10. DIRECTORS, EXECUTIVE OFFICERS AND CORPORATE GOVERNANCE
The following table sets forth information regarding our directors and executive officers as of February 25, 2016. Officers of the Company are elected annually by the Board of Directors.
|
|
|
|
|
|
|
Title |
|
Age |
|
Position |
|
|
|
|
|
|
|
Amin J. Khoury |
|
76 |
|
Executive Chairman of the Board of Directors |
|
|
|
|
|
|
|
Richard G. Hamermesh |
|
68 |
|
Director (1), (2), (3) |
|
|
|
|
|
|
|
Jonathan M. Schofield |
|
75 |
|
Director (1), (2), (3) |
|
|
|
|
|
|
|
James F. Albaugh |
|
65 |
|
Director (2) |
|
|
|
|
|
|
|
John T. Whates |
|
68 |
|
Director (2), (3) |
|
|
|
|
|
|
|
David J. Anderson |
|
66 |
|
Director (1) |
|
|
|
|
|
|
|
Mary M. VanDeWeghe |
|
56 |
|
Director (1) |
|
|
|
|
|
|
|
Werner Lieberherr |
|
55 |
|
President and Chief Executive Officer |
|
|
|
|
|
|
|
Joseph T. Lower |
|
49 |
|
Vice President and Chief Financial Officer |
|
|
|
|
|
|
|
Sean J. Cromie |
|
49 |
|
Vice President and General Manager, Commercial Aircraft Segment |
|
|
|
|
|
|
|
Tommy G. Plant |
|
47 |
|
Vice President and General Manager, Business Jet Segment |
|
|
|
|
|
|
|
Ryan M. Patch |
|
55 |
|
Vice President – Law, General Counsel, Secretary and Chief Compliance Officer |
|
|
|
|
|
|
|
Stephen R. Swisher |
|
57 |
|
Vice President – Finance, Controller and Assistant Secretary |
|
|
|
|
|
|
|
Eric J. Wesch |
|
48 |
|
Vice President – Finance, Treasurer and Assistant Secretary |
|
(1) |
Member, Audit Committee |
|
(2) |
Member, Compensation Committee |
|
(3) |
Member, Nominating and Corporate Governance Committee |
52
Director Classification
Our Restated Certificate of Incorporation, as amended, provides that the Board of Directors is to be divided into three classes, each nearly as equal in number as possible, so that each director (in certain circumstances after a transitional period) will serve for three years, with one class of directors being elected each year. The Board of Directors is currently comprised of three Class I Directors (John T. Whates, Mary M. VanDeWeghe and James F. Albaugh), two Class II Directors (Amin J. Khoury and Jonathan M. Schofield) and two Class III Directors (Richard G. Hamermesh and David J. Anderson). The terms of the Class I, Class II and Class III Directors expire at the end of each respective three-year term and upon the election and qualification of successor directors at annual meetings of stockholders held each respective year. Our executive officers are elected annually by the Board of Directors following the annual meeting of stockholders and serve at the discretion of the Board of Directors.
Current Directors
Amin J. Khoury has been the Executive Chairman of the Board of Directors since December 16, 2014, and was previously the Chairman of the Board of Directors from July 1987 when he co-founded the Company. Mr. Khoury also served as the Company’s Co-Chief Executive Officer from January 1, 2014 through December 15, 2014, and Chief Executive Officer from July 1987 through April 1996 and again from December 31, 2005 through December 31, 2013. Mr. Khoury has been Chairman of the Board of Directors and Chief Executive Officer of KLX Inc. since October 2014. From 1986 until April 2012, Mr. Khoury was a director of Synthes, Inc. Mr. Khoury was a Trustee of the Scripps Research Institute from 2008 to 2014. Mr. Khoury holds an Executive Masters Professional Director Certification, the highest level, from the American College of Corporate Directors, which is earned by completing a minimum of 90 hours of public company director education, and an Advanced Director Certification from the Corporate Directors Group.
Richard G. Hamermesh has been a Director since July 1987. Dr. Hamermesh is a Senior Fellow at the Harvard Business School, where he was formerly the MBA Class of 1961 Professor of Management Practice from 2002 to 2015. From 1987 to 2001, he was a co-founder and a Managing Partner of The Center for Executive Development, an executive education and development consulting firm. From 1976 to 1987, Dr. Hamermesh was a member of the faculty of Harvard Business School. He is also an active investor and entrepreneur, having participated as a principal, director and investor in the founding and early stages of more than 15 organizations. Dr. Hamermesh is a member of the Board of Directors of b.good, SmartCloud, and KLX Inc.
Jonathan M. Schofield has been a Director since April 2001. From December 1992 through February 2000, Mr. Schofield served as Chairman and CEO of Airbus North America Holdings, a subsidiary of Airbus Industrie, a manufacturer of large civil aircraft. Mr. Schofield served as Chairman of Airbus North America from February 2000 until his retirement in March 2001. Prior to 1989, Mr. Schofield served in various executive positions at Pratt & Whitney, a division of United Technologies Corporation. From 1989 until he joined Airbus, Mr. Schofield was President of United Technologies International Corporation. Mr. Schofield is currently a member of the Board of Directors of Nordam Group and is a trustee of LIFT Trust and was formerly a member of the Board of Directors of Aero Sat, Inc. and TurboCombustor Technology, Inc. Mr. Schofield became a member of the Ordre National De La Legion D’Honneur in 2002.
John T. Whates has been a Director since February 2012. Mr. Whates has been an independent tax advisor and involved in venture capital and private investing since 2005. He is a member of the Board of Directors of KLX Inc. and Chairman of the Board of Dynamic Healthcare Systems, Inc. From 1994 to 2011, Mr. Whates was a tax and financial advisor to the Company, providing business and tax advice on essentially all of our significant strategic acquisitions. Previously, Mr. Whates was a tax partner in several of the largest public accounting firms, most recently leading the High Technology Group Tax Practice of Deloitte LLP in Orange County, California. He has extensive experience working with aerospace and other public companies in the fields of tax, equity financing and mergers and acquisitions.
53
David J. Anderson has been a Director since June 2014. Mr. Anderson was the Senior Vice President and Chief Financial Officer of Honeywell International Inc. from 2003 until his retirement in April 2014. While at Honeywell, Mr. Anderson was a member of the senior leadership team where he was responsible for the company’s Corporate Finance activities including tax, accounting, treasury, audit, investment, financial planning, acquisitions and real estate. Mr. Anderson was integral to the reshaping of Honeywell’s portfolio including supporting nearly $10 billion of acquisitions in higher growth, global markets. Prior to joining Honeywell, Mr. Anderson had senior financial roles at ITT Industries, Inc., Newport News Shipbuilding and RJR Nabisco Holding Corporation. Mr. Anderson currently serves as a member of the Board of Directors of American Electric Power Company, Inc. and Cardinal Health, Inc., and as chairperson for the University of Chicago’s Booth School of Business CFO Forum, and formerly served as a member of the Board of Directors of Fifth Street Asset Management Inc.
Mary M. (“Meg”) VanDeWeghe has been a Director since September 2014. Ms. VanDeWeghe is the Chief Executive Officer and President of Forte Consulting Inc., a financial and management consulting firm, and a Professor of the Practice of Finance at Georgetown University’s McDonough School of Business. Prior to holding her current positions, Ms. VanDeWeghe served as Senior Vice President of Finance for Lockheed Martin Corporation, and previously held positions in corporate finance, capital markets and general management at J.P. Morgan, where she rose to the rank of Managing Director. Ms. VanDeWeghe currently serves on the Board of Directors of W.P. Carey and Brown Advisory. She previously served on the Board of Directors of Ecolab Inc. and Nalco.
James F. Albaugh has been a Director since November 2014. Mr. Albaugh has been a Senior Advisor to The Blackstone Group since December 2012. From September 2009 until his retirement in June 2012, Mr. Albaugh served as President and Chief Executive Officer of the Commercial Airplanes business unit, and was also a member of the Executive Council, of The Boeing Company. Mr. Albaugh also served as President and Chief Executive Officer of Boeing’s Integrated Defense Systems business unit and in other executive positions at Boeing, including President and Chief Executive Officer of Space and Communications and President of Space Transportation after Boeing’s acquisition in 1997 of Rockwell, where Mr. Albaugh began his career in 1975. Mr. Albaugh is an elected member of both the National Academy of Engineering and the International Academy of Astronautics, a Fellow and Honorary Fellow of the American Institute of Aeronautics and Astronautics, and an elected Fellow of the Royal Aeronautical Society. Mr. Albaugh is President of the American Institute of Aeronautics and Astronautics, Chairman of the National Aeronautic Association, a Director of American Airlines Group Inc., a former Director of TRW Automotive Holdings Corp., and serves as a member of other nonprofit organization boards and other professional organizations.
Executive Officers
Werner Lieberherr has been President and Chief Executive Officer of the Company since December 16, 2014. Prior to this role, Mr. Lieberherr was our President and Co-Chief Executive Officer from January 1, 2014 through December 15, 2014 and President and Chief Operating Officer from December 31, 2010 through December 31, 2013. From July 2006 through December 2010, Mr. Lieberherr was Senior Vice President and General Manager for the Commercial Aircraft Segment. Prior to joining the Company, Mr. Lieberherr spent 15 years with ABB and Alstom in operations in the energy industry, serving in various senior management positions in Europe, Asia and as President of North America operations. Mr. Lieberherr is also a member of the Board of Directors of the International Transport Aircraft Seating Suppliers’ Association.
Joseph T. Lower has been Vice President and Chief Financial Officer since December 16, 2014. Previously, Mr. Lower served as Vice President – Finance from November 1, 2014. Prior to joining the Company, Mr. Lower was Vice President of Business Development and Strategy for The Boeing Company from 2002 to 2014. Prior to joining Boeing in 2002, among other finance positions, Mr. Lower spent six years with Credit Suisse in various investment banking roles including positions in Mergers and Acquisitions, and Corporate Finance.
54
Sean J. Cromie has been Vice President and General Manager for the Commercial Aircraft Segment since January 2011. From November 2007 to December 2010, Mr. Cromie served as Vice President and Managing Director of the Seating Facility in Kilkeel, Northern Ireland and previously as Business Unit Director. Prior to joining the Company, Mr. Cromie spent six years in operational management roles with Sanmina SCI and NACCO MHG. Mr. Cromie also spent seven years with Kerry Group PLC.
Tommy G. Plant has been Vice President and General Manager, Business Jet Segment since August 2015. From 2006 to July 2015, Mr. Plant served as Vice President and General Manager of Seating Products Group of the Commercial Aircraft Segment. Prior to that, Mr. Plant held various senior management positions within the Seating Products Group, including Vice President and General Manager of the Seating Business, Vice President of Engineering and Vice President of Premium Class Seating Programs. Prior to joining the Company, Mr. Plant spent six years in engineering roles for the Army Weapons Division of British Aerospace PLC.
Ryan M. Patch has been Vice President – Law, General Counsel, Secretary and Chief Compliance Officer since July 2009 and was previously Vice President – Law from December 2008 to July 2009. From 2005 to 2008, Mr. Patch was a shareholder and member of the Board of Directors of Jackson Tidus in Irvine, California. Prior to that, Mr. Patch was a partner in a boutique California law firm since 1992. Mr. Patch is Authorized House Counsel in the State of Florida and has been admitted to practice before the State Bar of California and various U.S. District Courts in California.
Stephen R. Swisher has been Vice President – Finance, Controller and Assistant Secretary since August 2001 and Vice President – Finance and Controller since August 1999. Mr. Swisher has been Controller since 1996 and served as Director, Finance from 1994 to 1996. Prior to 1994, Mr. Swisher held various management positions at Burger King Corporation and Deloitte & Touche LLP.
Eric J. Wesch has been Vice President – Finance, Treasurer and Assistant Secretary since July 2011 and previously served as Corporate Treasurer from 2008 to 2011, Director, Treasury Services from 2005 to 2008, Manager, Treasury Services from 2003 to 2005, and Manager, Financial Planning & Analysis from 1997 to 2003. Before joining the Company, Mr. Wesch worked for Blockbuster Entertainment Group.
Audit Committee
We have a separately-designated standing Audit Committee established in accordance with Section 3(a)(58)(A) of the Exchange Act. Messrs. Hamermesh, Schofield and Anderson and Ms. VanDeWeghe currently serve as members of the Audit Committee. Under the current SEC rules and the rules of the NASDAQ, all of the members are independent. All members of the Audit Committee are independent, as that term is used in Item 407 of Regulation S-K of the federal securities laws. Our Board of Directors has determined that Mr. Hamermesh is an “audit committee financial expert” in accordance with current SEC rules.
Section 16(a) Beneficial Ownership Reporting Compliance
Section 16(a) of the Exchange Act requires our directors and executive officers, and persons who own more than ten percent of a registered class of our equity securities, to file with the SEC initial reports of ownership and reports of changes in ownership of our common stock and other equity securities. Officers, directors and greater-than-ten-percent stockholders are required by SEC regulations to furnish us with copies of all Section 16(a) forms they file.
Code of Ethics
We have adopted a code of ethics, or Code of Business Conduct, to comply with the rules of the SEC and NASDAQ. The Code of Business Conduct applies to our directors, officers and employees worldwide, including our principal executive officer, principal financial officer, controller, treasurer and all other employees
55
performing similar functions. We maintain a copy of our Code of Business Conduct, on our website at http://www.beaerospace.com and intend to disclose any amendments thereto and any waivers applicable to any of our directors or officers, on the website within four business days following the date of the amendment or waiver.
ITEM 11. EXECUTIVE COMPENSATION
Information set forth under the captions “Compensation Committee Interlocks and Insider Participation,” “Compensation of Directors” and “Compensation Discussion and Analysis” in the Proxy Statement is incorporated by reference herein.
ITEM 12. SECURITY OWNERSHIP OF CERTAIN BENEFICIAL OWNERS AND MANAGEMENT AND RELATED STOCKHOLDER MATTERS
Information set forth under the captions “Security Ownership of Certain Beneficial Owners and Management” and “Equity Compensation Plan Information” in the Proxy Statement is incorporated by reference herein.
ITEM 13. CERTAIN RELATIONSHIPS AND RELATED TRANSACTIONS, AND DIRECTOR INDEPENDENCE
Information set forth under the caption “Certain Relationships and Related Transactions” in the Proxy Statement is incorporated by reference herein.
ITEM 14. PRINCIPAL ACCOUNTANT FEES AND SERVICES
Information set forth under the caption “Principal Accountant Fees and Services” in the Proxy Statement is incorporated by reference herein.
56
ITEM 15. EXHIBITS AND FINANCIAL STATEMENT SCHEDULES
(a)Documents filed as part of report on Form 10-K
|
1. |
Financial Statements |
Report of Independent Registered Public Accounting Firm
Consolidated Balance Sheets, December 31, 2015 and December 31, 2014
Consolidated Statements of Earnings and Comprehensive Income for the Years Ended December 31, 2015, 2014, and 2013
Consolidated Statements of Stockholders' Equity for the Years Ended December 31, 2015, 2014, and 2013
Consolidated Statements of Cash Flows for the Years Ended December 31, 2015, 2014, and 2013
Notes to Consolidated Financial Statements for the Years Ended December 31, 2015, 2014, and 2013
|
2. |
Financial Statement Schedules |
Schedule II – Valuation and Qualifying Accounts
All other consolidated financial statement schedules are omitted because such schedules are not required or the information required has been presented in the aforementioned consolidated financial statements.
|
3. |
Exhibits – The exhibits listed in the following "Index to Exhibits" are filed with this Form 10-K or incorporated by reference as set forth below. |
57
|
Exhibit Number |
|
Description |
|
|
|
|
|
Exhibit 2 Plan of Acquisition, Reorganization, Arrangement, Liquidation or Succession |
||
|
|
|
|
|
2.1 |
|
Separation and Distribution Agreement, dated as of December 15, 2014, by and between KLX Inc. and the Company (incorporated by reference to Exhibit 2.1 to KLX Inc.’s Current Report on Form 8-K dated December 19, 2014, filed with the SEC on December 19, 2014). |
|
|
|
|
|
Exhibits 3 Articles of Incorporation and By-Laws |
||
|
|
|
|
|
3.1 |
|
Amended and Restated Certificate of Incorporation (incorporated by reference to Exhibit 3.1 to the Company’s Registration Statement on Form S-1/A, as amended (No. 33-33689), filed with the SEC on April 18, 1990). |
|
|
|
|
|
3.2 |
|
Certificate of Amendment of the Restated Certificate of Incorporation (incorporated by reference to Exhibit 3 to the Company’s Registration Statement on Form S-1 (No. 333-54146), filed with the SEC on November 3, 1992). |
|
|
|
|
|
3.3 |
|
Certificate of Amendment of the Restated Certificate of Incorporation (incorporated by reference to Exhibit 3.3 to the Company’s Registration Statement on Form S-3/A (No. 333-60209), filed with the SEC on December 21, 1998). |
|
|
|
|
|
3.4 |
|
Certificate of Amendment of the Restated Certificate of Incorporation (incorporated by reference to Exhibit 3.5 the Company’s Registration Statement on Form S-3/A (No. 333-112493), as amended, filed with the SEC on February 13, 2004). |
|
|
|
|
|
3.5 |
|
Certificate of Amendment of the Restated Certificate of Incorporation (incorporated by reference to Exhibit 3.1 to the Company’s Quarterly Report on Form 10-Q for the quarter ended June 30, 2006, filed with the SEC on August 7, 2006). |
|
|
|
|
|
3.6 |
|
Certificate of Amendment of the Restated Certificate of Incorporation (incorporated by reference to Exhibit 3.6 to the Company’s Quarterly Report on Form 10-Q for the quarter ended June 30, 2012, filed with the SEC on August 8, 2012). |
|
|
|
|
|
3.7 |
|
Certificate of Amendment of the Restated Certificate of Incorporation (incorporated by reference to Exhibit 3.1 to the Company’s Quarterly Report on Form 10-Q for the quarter ended June 30, 2014, filed with the SEC on July 30, 2014). |
|
|
|
|
|
3.8 |
|
Amended and Restated By-Laws (incorporated by reference to Exhibit 3.1 to the Company’s Current Report on Form 8-K dated December 19, 2014, filed with the SEC on December 19, 2014). |
|
|
|
|
|
Exhibits 4 Instruments Defining the Rights of Security Holders, including debentures |
||
|
|
|
|
|
4.1 |
|
Specimen Common Stock Certificate (incorporated by reference to Exhibit 4 to the Company’s Registration Statement on Form S-1/A, as amended (No. 33-33689), filed with the SEC on April 18, 1990). |
|
|
|
|
|
|
|
|
58
|
Exhibits 10(i) Material Contracts |
||
|
|
|
|
|
10.1 |
|
Stockholders Agreement, dated as of July 28, 2008, among the Company and Honeywell International Inc., Honeywell UK Limited, Honeywell Holding France SAS and Honeywell Deutschland GmbH (incorporated by reference to Exhibit 10.3 to the Company’s Quarterly Report on Form 10-Q for the quarter ended September 30, 2008, filed with the SEC on November 7, 2008). |
|
|
|
|
|
10.2 |
|
Credit Agreement, dated as of December 16, 2014, among the Company, as Borrower, JPMorgan Chase Bank, N.A., as Administrative Agent, Citigroup Global Markets Inc. and Goldman Sachs Bank USA, as Syndication Agents, Credit Suisse AG, Cayman Islands Branch, TD Bank, N.A., Royal Bank of Canada, Deutsche Bank Securities Inc., Barclays Bank PLC, Bank of Tokyo-Mitsubishi UFJ, Ltd. and Capital One Business Credit Corp., as Documentation Agents, and certain lenders party thereto (incorporated by reference to Exhibit 10.2 to the Company’s Current Report on Form 8-K dated December 19, 2014, filed with the SEC on December 19, 2014). |
|
|
|
|
|
10.3 |
|
Tax Sharing and Indemnification Agreement, dated as of December 15, 2014, by and between KLX Inc. and the Company (incorporated by reference to Exhibit 10.1 to KLX Inc.’s Current Report on Form 8-K dated December 19, 2014, filed with the SEC on December 19, 2014). |
|
|
|
|
|
10.4 |
|
Amendment No. 1 to Credit Agreement, dated as of January 30, 2015, between the Company and JPMorgan Chase Bank, N.A., as Administrative Agent (incorporated by reference to Exhibit 10.4 to the Company’s Annual Report on Form 10-K for the fiscal year ended December 31, 2014, filed with the SEC on February 27, 2015). |
|
|
|
|
|
|
|
|
|
Exhibits 10(iii) Management Contracts and Executive Compensation Plans, Contracts and Arrangements |
||
|
|
|
|
|
10.5 |
|
Amended and Restated Employment Agreement for Amin J. Khoury dated as of September 15, 2014 (incorporated by reference to Exhibit 10.1 to the Company’s Quarterly Report on Form 10-Q for the quarter ended September 30, 2014, filed with the SEC on October 30, 2014). |
|
|
|
|
|
10.6 |
|
Amended and Restated Death Benefit Agreement dated November 30, 2012 between the Company and Amin J. Khoury (incorporated by reference to Exhibit 10.10 to the Company’s Annual Report on Form 10-K for the fiscal year ended December 31, 2012, filed with the SEC on February 21, 2013). |
|
|
|
|
|
10.7 |
|
Amended and Restated Employment Agreement for Werner Lieberherr dated as of July 29, 2013 (incorporated by reference to Exhibit 10.2 to the Company’s Quarterly Report on Form 10-Q for the quarter ended June 30, 2013, filed with the SEC on July 29, 2013). |
|
|
|
|
|
10.8 |
|
First Amendment to Amended and Restated Employment Agreement for Werner Lieberherr dated as of January 1, 2014 (incorporated by reference to Exhibit 10.9 to the Company’s Annual Report on Form 10-K for the fiscal year ended December 31, 2013, filed with the SEC on February 24, 2014). |
|
|
|
|
|
10.9 |
|
Death Benefit Agreement dated November 30, 2012 between the Company and Werner Lieberherr (incorporated by reference to Exhibit 10.13 to the Company’s Annual Report on Form 10-K for the fiscal year ended December 31, 2012, filed with the SEC on February 21, 2013). |
59
|
|
|
|
|
10.10 |
|
Amended and Restated Employment Agreement for Ryan M. Patch dated as of July 29, 2013 (incorporated by reference to Exhibit 10.4 to the Company’s Quarterly Report on Form 10-Q for the quarter ended June 30, 2013, filed with the SEC on July 29, 2013). |
|
|
|
|
|
10.11 |
|
Amended and Restated Employment Agreement for Sean J. Cromie dated as of May 4, 2012 (incorporated by reference to Exhibit 10.1 to the Company’s Quarterly Report on Form 10-Q for the quarter ended March 31, 2012, filed with the SEC on May 4, 2012). |
|
|
|
|
|
10.12 |
|
Second Amended and Restated Employment Agreement for Wayne R. Exton dated as of May 4, 2012 (incorporated by reference to Exhibit 10.2 to the Company’s Quarterly Report on Form 10-Q for the quarter ended March 31, 2012, filed with the SEC on May 4, 2012). |
|
|
|
|
|
10.13 |
|
Second Amended and Restated Employment Agreement for Stephen R. Swisher dated July 1, 2014 (incorporated by reference to Exhibit 10.15 to the Company’s Annual Report on Form 10-K for the fiscal year ended December 31, 2014, filed with the SEC on February 27, 2015). |
|
|
|
|
|
10.14 |
|
Employment Agreement for Eric J. Wesch dated as of July 13, 2012 (incorporated by reference to Exhibit 10.18 to the Company’s Annual Report on Form 10-K for the fiscal year ended December 31, 2013, filed with the SEC on February 24, 2014). |
|
|
|
|
|
10.15 |
|
Retirement Agreement dated as of December 31, 2005 between the Company and Robert J. Khoury (incorporated by reference to Exhibit 10.10 to the Company’s Annual Report on Form 10-K for the fiscal year ended December 31, 2005, filed with the SEC on March 15, 2006). |
|
|
|
|
|
10.16 |
|
Consulting Agreement dated as of December 31, 2014 between the Company and Robert J. Khoury (incorporated by reference to Exhibit 10.18 to the Company’s Annual Report on Form 10-K for the fiscal year ended December 31, 2014, filed with the SEC on February 27, 2015). |
|
|
|
|
|
10.17 |
|
BE Aerospace, Inc. 2005 Long-Term Incentive Plan (Amended and Restated as of July 25, 2012) (incorporated by reference to Exhibit 99.1 to the Company’s Current Report on Form 8-K dated July 27, 2012, filed with the SEC on July 27, 2012). |
|
|
|
|
|
10.18 |
|
BE Aerospace, Inc. 2010 Deferred Compensation Plan (incorporated by reference to Exhibit 4.7 to the Company’s Registration Statement on Form S-8 (333-170494), filed with the SEC on November 9, 2010). |
|
|
|
|
|
10.19 |
|
B/E Aerospace, Inc. Senior Executive Management Incentive Plan - FY 2011 (incorporated by reference to Exhibit 10.3 to the Company’s Quarterly Report on Form 10-Q for the quarter ended March 31, 2011, filed with the SEC on May 4, 2011). |
|
|
|
|
|
10.20 |
|
B/E Aerospace, Inc. Corporate Executive Incentive Plan 90% - FY 2011(incorporated by reference to Exhibit 10.4 to the Company’s Quarterly Report on Form 10-Q for the quarter ended March 31, 2011, filed with the SEC on May 4, 2011). |
|
|
|
|
|
10.21 |
|
B/E Aerospace, Inc. Amended and Restated Non-Employee Directors Stock and Deferred Compensation Plan (incorporated by reference to Exhibit 10.1 to the Company’s Quarterly Report on Form 10-Q for the quarter ended June 30, 2015, filed with the SEC on July 31, 2015). |
|
|
|
|
60
|
10.22 |
|
B/E Aerospace, Inc. Amended and Restated 1994 Employee Stock Purchase Plan (incorporated by reference to Exhibit 10.24 to the Company’s Annual Report on Form 10-K for the fiscal year ended December 31, 2014, filed with the SEC on February 27, 2015). |
|
|
|
|
|
10.23 |
|
Amendment One to the BE Aerospace, Inc. 2010 Deferred Compensation Plan (incorporated by reference to Exhibit 10.1 to the Company’s Quarterly Report on Form 10-Q for the quarter ended September 30, 2013, filed with the SEC on October 30, 2013). |
|
|
|
|
|
10.24 |
|
Amended and Restated Medical Care Reimbursement Plan for Executives of B/E Aerospace, Inc. (incorporated by reference to Exhibit 10.32 to the Company’s Annual Report on Form 10-K for the fiscal year ended December 31, 2013, filed with the SEC on February 24, 2014). |
|
|
|
|
|
10.25 |
|
Form of Restricted Stock Award Agreement (Time-Based Vesting) (incorporated by reference to Exhibit 10.27 to the Company’s Annual Report on Form 10-K for the fiscal year ended December 31, 2014, filed with the SEC on February 27, 2015). |
|
|
|
|
|
10.26 |
|
Form of Restricted Stock Award Agreement (Time and Performance-Based Vesting) (incorporated by reference to Exhibit 10.28 to the Company’s Annual Report on Form 10-K for the fiscal year ended December 31, 2014, filed with the SEC on February 27, 2015). |
|
|
|
|
|
10.27 |
|
Form of Restricted Stock Award Agreement for Amin J. Khoury (Time-Based Vesting) (incorporated by reference to Exhibit 10.29 to the Company’s Annual Report on Form 10-K for the fiscal year ended December 31, 2014, filed with the SEC on February 27, 2015). |
|
|
|
|
|
10.28 |
|
Form of Restricted Stock Award Agreement for Amin J. Khoury (Time and Performance-Based Vesting) (incorporated by reference to Exhibit 10.30 to the Company’s Annual Report on Form 10-K for the fiscal year ended December 31, 2014, filed with the SEC on February 27, 2015). |
|
|
|
|
|
10.29 |
|
Form of Restricted Stock Award Agreement (Time-Based Vesting).* |
|
|
|
|
|
10.30 |
|
Form of Restricted Stock Award Agreement (Time and Performance-Based Vesting).* |
|
|
|
|
|
10.31 |
|
Form of Restricted Stock Unit Award Agreement (Time-Based Vesting).* |
|
|
|
|
|
10.32 |
|
Form of Restricted Stock Unit Award Agreement (Time and Performance-Based Vesting).* |
|
|
|
|
|
10.33 |
|
Form of Restricted Stock Unit Agreement for Amin J. Khoury (Time and Performance-Based Vesting).* |
|
|
|
|
|
10.34 |
|
Form of Restricted Stock Unit Award Agreement for Corporate Named Executive Officers (Time and Performance-Based Vesting).* |
|
|
|
|
|
10.35 |
|
Form of Restricted Stock Unit Award Agreement for Segment Named Executive Officers (Time and Performance-Based Vesting).* |
|
|
|
|
61
|
10.36 |
|
First Amendment to Amended and Restated Employment Agreement for Ryan M. Patch dated as of April 29, 2014 (incorporated by reference to Exhibit 10.1 to the Company’s Quarterly Report on Form 10-Q for the quarter ended March 31, 2014, filed with the SEC on April 30, 2014). |
|
|
|
|
|
10.37 |
|
Second Amendment to Amended and Restated Employment Agreement for Werner Lieberherr dated as of May 12, 2014 (incorporated by reference to Exhibit 10.3 to the Company’s Quarterly Report on Form 10-Q for the quarter ended June 30, 2014, filed with the SEC on July 30, 2014). |
|
|
|
|
|
10.38 |
|
Second Amendment to Amended and Restated Employment Agreement for Ryan M. Patch dated as of May 12, 2014 (incorporated by reference to Exhibit 10.5 to the Company’s Quarterly Report on Form 10-Q for the quarter ended June 30, 2014, filed with the SEC on July 30, 2014). |
|
|
|
|
|
10.39 |
|
Letter Agreement of Amin J. Khoury, dated August 29, 2014 (incorporated by reference to Exhibit 10.1 to the Company’s Current Report on Form 8-K dated August 29, 2014, filed with the SEC on August 29, 2014). |
|
|
|
|
|
10.40 |
|
Employment Agreement for Joseph T. Lower dated as of October 1, 2014 (incorporated by reference to Exhibit 10.1 to the Company’s Current Report on Form 8-K dated October 6, 2014, filed with the SEC on October 6, 2014). |
|
|
|
|
|
10.41 |
|
Third Amendment to Amended and Restated Employment Agreement for Ryan M. Patch dated as of October 21, 2014 (incorporated by reference to Exhibit 10.3 to the Company’s Quarterly Report on Form 10-Q for the quarter ended September 30, 2014, filed with the SEC on October 30, 2014). |
|
|
|
|
|
10.42 |
|
Amendment No. 1 to the Amended and Restated Medical Care Reimbursement Plan for Executives of B/E Aerospace, Inc. (incorporated by reference to Exhibit 10.40 to the Company’s Annual Report on Form 10-K for the fiscal year ended December 31, 2014, filed with the SEC on February 27, 2015). |
|
|
|
|
|
10.43 |
|
Restricted Stock Inducement Award Agreement, dated as of November 1, 2014, between the Company and Joseph T. Lower (incorporated by reference to Exhibit 10.41 to the Company’s Annual Report on Form 10-K for the fiscal year ended December 31, 2014, filed with the SEC on February 27, 2015). |
|
|
|
|
|
10.44 |
|
Employment Agreement for Tom Plant dated as of February 4, 2013 (incorporated by reference to Exhibit 10.1 to the Company’s Quarterly Report on Form 10-Q for the quarter ended September 30, 2015, filed with the SEC on October 30, 2015). |
|
|
|
|
|
10.45 |
|
First Amendment to Employment Agreement for Tom Plant dated as of August 10, 2015 (incorporated by reference to Exhibit 10.2 to the Company’s Quarterly Report on Form 10-Q for the quarter ended September 30, 2015, filed with the SEC on October 30, 2015). |
|
|
|
|
|
10.46 |
|
Consulting Agreement dated as of August 10, 2015 between the Company and Wayne Exton.* |
|
|
|
|
|
10.47 |
|
Letter Agreement for Amin J. Khoury, dated November 16, 2015.* |
|
|
|
|
|
10.48 |
|
Fourth Amendment to Amended and Restated Employment Agreement for Ryan M. Patch dated as of February 17, 2016.* |
62
|
|
|
|
|
Exhibit 21 Subsidiaries of the Registrant |
||
|
|
|
|
|
21.1 |
|
Subsidiaries* |
|
|
|
|
|
|
|
|
|
Exhibit 23 Consents of Experts and Counsel |
||
|
|
|
|
|
23.1 |
|
Consent of Independent Registered Public Accounting Firm – Deloitte & Touche LLP* |
|
|
|
|
|
Exhibits 31 Rule 13a-14(a)/15d-14(a) Certifications |
||
|
|
|
|
|
31.1 |
|
Certification of Chief Executive Officer* |
|
|
|
|
|
31.2 |
|
Certification of Chief Financial Officer* |
|
|
|
|
|
|
|
|
|
Exhibits 32 Section 1350 Certifications |
||
|
|
|
|
|
32.1 |
|
Certification of Chief Executive Officer pursuant to 18 U.S.C. Section 1350* |
|
|
|
|
|
32.2 |
|
Certification of Chief Financial Officer pursuant to 18 U.S.C. Section 1350* |
|
|
|
|
|
Exhibit 99 Additional Exhibits |
||
|
|
|
|
|
99.1 |
|
Stipulation and Order of Dismissal from the Delaware Chancery Court in re Ironworkers Local No. 25 Pension Fund v. the Company, et al.* |
|
|
|
|
|
Exhibits 101 Interactive Data File |
||
|
|
|
|
|
101.INS |
|
XBRL Instance Document* |
|
|
|
|
|
101.SCH |
|
XBRL Taxonomy Extension Schema Document* |
|
|
|
|
|
101.CAL |
|
XBRL Taxonomy Extension Calculation Linkbase Document* |
|
|
|
|
|
101.DEF |
|
XBRL Taxonomy Extension Definition Linkbase Document* |
|
|
|
|
|
101.LAB |
|
XBRL Taxonomy Extension Label Linkbase Document* |
|
|
|
|
|
101.PRE |
|
XBRL Taxonomy Extension Presentation Linkbase Document* |
63
Pursuant to the requirements of Section 13 or 15(d) of the Securities Exchange Act of 1934, the registrant has duly caused this report to be signed on its behalf by the undersigned, thereunto duly authorized.
|
B/E AEROSPACE, INC. |
||||
|
By: |
/s/ Werner Lieberherr |
|||
|
Werner Lieberherr |
||||
|
President and Chief Executive Officer |
||||
Date: February 25, 2016
Pursuant to the requirements of the Securities Exchange Act of 1934, this report has been signed below by the following persons on behalf of the registrant and in the capacities and on the dates indicated.
|
|
|
|
|
|
|
Signature |
|
Title |
|
Date |
|
|
|
|
|
|
|
/s/ Amin J. Khoury |
|
Executive Chairman of the Board of |
|
February 25, 2016 |
|
Amin J. Khoury |
|
Directors |
|
|
|
|
|
|
|
|
|
|
|
|
|
|
|
/s/ Werner Lieberherr |
|
President and Chief Executive Officer |
|
February 25, 2016 |
|
Werner Lieberherr |
|
(Principal Executive Officer) |
|
|
|
|
|
|
|
|
|
|
|
|
|
|
|
/s/ Joseph T. Lower |
|
Vice President and Chief Financial Officer |
|
February 25, 2016 |
|
Joseph T. Lower |
|
(Principal Financial Officer) |
|
|
|
|
|
|
|
|
|
|
|
|
|
|
|
/s/ Stephen R. Swisher |
|
Vice President – Finance, Controller and |
|
February 25, 2016 |
|
Stephen R. Swisher |
|
Assistant Secretary |
|
|
|
|
|
(Principal Accounting Officer) |
|
|
|
|
|
|
|
|
|
/s/ Richard G. Hamermesh |
|
Director |
|
February 25, 2016 |
|
Richard G. Hamermesh |
|
|
|
|
|
|
|
|
|
|
|
|
|
|
|
|
|
/s/ David J. Anderson |
|
Director |
|
February 25, 2016 |
|
David J. Anderson |
|
|
|
|
|
|
|
|
|
|
|
|
|
|
|
|
|
/s/ Mary M. VanDeWeghe |
|
Director |
|
February 25, 2016 |
|
Mary M. VanDeWeghe |
|
|
|
|
|
|
|
|
|
|
|
|
|
|
|
|
|
/s/ Jonathan M. Schofield |
|
Director |
|
February 25, 2016 |
|
Jonathan M. Schofield |
|
|
|
|
|
|
|
|
|
|
|
|
|
|
|
|
|
/s/ James F. Albaugh |
|
Director |
|
February 25, 2016 |
|
James F. Albaugh |
|
|
|
|
|
|
|
|
|
|
|
|
|
|
|
|
|
/s/ John T. Whates |
|
Director |
|
February 25, 2016 |
|
John T. Whates |
|
|
|
|
64
INDEX TO CONSOLIDATED FINANCIAL STATEMENTS AND SCHEDULE
|
|
|
Page |
|
|
|
|
|
|
F-2 |
|
|
|
|
|
|
Consolidated Financial Statements: |
|
|
|
|
|
|
|
|
F-3 |
|
|
|
|
|
|
|
F-4 |
|
|
|
|
|
|
Consolidated Statements of Stockholders' Equity for the Years Ended December 31, 2015, 2014 and 2013 |
|
F-5 |
|
|
|
|
|
Consolidated Statements of Cash Flows for the Years Ended December 31, 2015, 2014 and 2013 |
|
F-6 |
|
|
|
|
|
Notes to Consolidated Financial Statements for the Years Ended December 31, 2015, 2014 and 2013 |
|
F-8 |
|
|
|
|
|
Consolidated Financial Statement Schedule: |
|
|
|
|
|
|
|
Schedule II - Valuation and Qualifying Accounts for the Years Ended December 31, 2015, 2014 and 2013 |
|
F-31 |
F-1
REPORT OF INDEPENDENT REGISTERED PUBLIC ACCOUNTING FIRM
The Board of Directors and Stockholders of
B/E Aerospace, Inc.
Wellington, Florida
We have audited the accompanying consolidated balance sheets of B/E Aerospace, Inc. and subsidiaries (the "Company") as of December 31, 2015 and 2014, and the related consolidated statements of earnings and comprehensive income, stockholders' equity, and cash flows for each of the three years in the period ended December 31, 2015. Our audits also included the financial statement schedule listed in Item 15(a)(2). These financial statements and financial statement schedule are the responsibility of the Company's management. Our responsibility is to express an opinion on the financial statements and financial statement schedule based on our audits.
We conducted our audits in accordance with the standards of the Public Company Accounting Oversight Board (United States). Those standards require that we plan and perform the audit to obtain reasonable assurance about whether the financial statements are free of material misstatement. An audit includes examining, on a test basis, evidence supporting the amounts and disclosures in the financial statements. An audit also includes assessing the accounting principles used and significant estimates made by management, as well as evaluating the overall financial statement presentation. We believe that our audits provide a reasonable basis for our opinion.
In our opinion, such consolidated financial statements present fairly, in all material respects, the financial position of B/E Aerospace, Inc. and subsidiaries as of December 31, 2015 and 2014, and the results of their operations and their cash flows for each of the three years in the period ended December 31, 2015, in conformity with accounting principles generally accepted in the United States of America. Also, in our opinion, such financial statement schedule, when considered in relation to the basic consolidated financial statements taken as a whole, present fairly, in all material respects, the information set forth therein.
We have also audited, in accordance with the standards of the Public Company Accounting Oversight Board (United States), the Company's internal control over financial reporting as of December 31, 2015, based on the criteria established in Internal Control — Integrated Framework (2013) issued by the Committee of Sponsoring Organizations of the Treadway Commission and our report dated February 25, 2016 expressed an unqualified opinion on the Company's internal control over financial reporting.
/s/ Deloitte & Touche LLP
Certified Public Accountants
Miami, Florida
February 25, 2016
F-2
B/E AEROSPACE, INC.
CONSOLIDATED BALANCE SHEETS, DECEMBER 31, 2015 AND 2014
(In millions, except per share data)
|
|
|
December 31, |
|
December 31, |
|
||
|
2015 |
2014 |
||||||
|
ASSETS |
|
|
|
|
|
|
|
|
|
|
|
|
|
|
|
|
|
Current assets: |
|
|
|
|
|
|
|
|
Cash and cash equivalents |
|
$ |
154.1 |
|
$ |
292.5 |
|
|
Accounts receivable |
|
|
354.6 |
|
|
288.3 |
|
|
Inventories |
|
|
1,091.9 |
|
|
924.3 |
|
|
Other current assets |
|
|
57.8 |
|
|
131.3 |
|
|
Total current assets |
|
|
1,658.4 |
|
|
1,636.4 |
|
|
|
|
|
|
|
|
|
|
|
Property and equipment |
|
|
391.2 |
|
|
397.6 |
|
|
Goodwill |
|
|
813.2 |
|
|
840.4 |
|
|
Identifiable intangible assets |
|
|
231.3 |
|
|
250.7 |
|
|
Other assets |
|
|
46.8 |
|
|
48.0 |
|
|
|
|
$ |
3,140.9 |
|
$ |
3,173.1 |
|
|
|
|
|
|
|
|
|
|
|
|
|
|
|
|
|
|
|
|
LIABILITIES AND STOCKHOLDERS’ EQUITY |
|
|
|
|
|
|
|
|
|
|
|
|
|
|
|
|
|
Current liabilities: |
|
|
|
|
|
|
|
|
Accounts payable |
|
$ |
300.5 |
|
$ |
275.0 |
|
|
Accrued liabilities |
|
|
521.7 |
|
|
491.2 |
|
|
Current maturities of long-term debt |
|
|
— |
|
|
17.4 |
|
|
Total current liabilities |
|
|
822.2 |
|
|
783.6 |
|
|
|
|
|
|
|
|
|
|
|
Long-term debt |
|
|
2,034.1 |
|
|
2,147.3 |
|
|
Deferred income taxes |
|
|
92.7 |
|
|
110.4 |
|
|
Other non-current liabilities |
|
|
136.4 |
|
|
121.7 |
|
|
|
|
|
|
|
|
|
|
|
Commitments, contingencies and off-balance sheet arrangements (Note 8) |
|
|
|
|
|
|
|
|
|
|
|
|
|
|
|
|
|
Stockholders' equity: |
|
|
|
|
|
|
|
|
Preferred stock, $0.01 par value; 1.0 shares authorized; no shares outstanding |
|
|
— |
|
|
— |
|
|
Common stock, $0.01 par value; 200.0 shares authorized; 107.4 shares issued as of December 31, 2015 and 106.7 shares issued as of December 31, 2014 |
|
|
1.1 |
|
|
1.1 |
|
|
Additional paid-in capital |
|
|
(847.8) |
|
|
(884.6) |
|
|
Treasury stock; 4.2 shares at December 31, 2015 and 0.7 shares at December 31, 2014 |
|
|
(183.9) |
|
|
(28.6) |
|
|
Retained earnings |
|
|
1,232.9 |
|
|
1,027.6 |
|
|
Accumulated other comprehensive loss |
|
|
(146.8) |
|
|
(105.4) |
|
|
Total stockholders' equity |
|
|
55.5 |
|
|
10.1 |
|
|
|
|
$ |
3,140.9 |
|
$ |
3,173.1 |
|
See accompanying notes to consolidated financial statements.
F-3
B/E AEROSPACE, INC.
CONSOLIDATED STATEMENTS OF EARNINGS AND COMPREHENSIVE INCOME
FOR THE YEARS ENDED DECEMBER 31, 2015, 2014 AND 2013
(In millions, except per share data)
|
|
|
|
|
|
|
|
|
|
|
|
|
|
|
Year Ended December 31, |
|
|||||||
|
|
|
2015 |
|
2014 |
|
2013 |
|
|||
|
|
|
|
|
|
|
|
|
|
|
|
|
Revenues |
|
$ |
2,729.6 |
|
$ |
2,599.0 |
|
$ |
2,203.3 |
|
|
Cost of sales |
|
|
1,642.5 |
|
|
1,582.8 |
|
|
1,296.0 |
|
|
Selling, general and administrative |
|
|
360.4 |
|
|
347.9 |
|
|
323.5 |
|
|
Research, development and engineering |
|
|
274.4 |
|
|
284.3 |
|
|
220.9 |
|
|
Operating earnings |
|
|
452.3 |
|
|
384.0 |
|
|
362.9 |
|
|
Interest expense, net |
|
|
94.8 |
|
|
130.6 |
|
|
123.4 |
|
|
Debt prepayment costs |
|
|
0.9 |
|
|
243.6 |
|
|
- |
|
|
Earnings before income taxes |
|
|
356.6 |
|
|
9.8 |
|
|
239.5 |
|
|
Income tax (benefit) expense |
|
|
70.9 |
|
|
(47.9) |
|
|
44.6 |
|
|
Earnings from continuing operations |
|
|
285.7 |
|
|
57.7 |
|
|
194.9 |
|
|
Earnings from discontinued operations, net of income taxes |
|
|
— |
|
|
46.6 |
|
|
170.7 |
|
|
Net earnings |
|
|
285.7 |
|
|
104.3 |
|
|
365.6 |
|
|
|
|
|
|
|
|
|
|
|
|
|
|
Other comprehensive income: |
|
|
|
|
|
|
|
|
|
|
|
Foreign currency translation adjustment and other |
|
|
41.4 |
|
|
101.4 |
|
|
28.1 |
|
|
Comprehensive income |
|
$ |
327.1 |
|
$ |
205.7 |
|
$ |
393.7 |
|
|
|
|
|
|
|
|
|
|
|
|
|
|
Net earnings per share from continuing operations - basic |
|
$ |
2.75 |
|
$ |
0.55 |
|
$ |
1.89 |
|
|
Net earnings per share from discontinued operations - basic |
|
|
— |
|
|
0.45 |
|
|
1.65 |
|
|
Net earnings per share - basic |
|
$ |
2.75 |
|
$ |
1.00 |
|
$ |
3.54 |
|
|
|
|
|
|
|
|
|
|
|
|
|
|
Net earnings per share from continuing operations - diluted |
|
$ |
2.73 |
|
$ |
0.55 |
|
$ |
1.88 |
|
|
Net earnings per share from discontinued operations - diluted |
|
|
— |
|
|
0.45 |
|
|
1.64 |
|
|
Net earnings per share - diluted |
|
$ |
2.73 |
|
$ |
1.00 |
|
$ |
3.52 |
|
|
|
|
|
|
|
|
|
|
|
|
|
|
Dividends declared per share |
|
$ |
0.76 |
|
$ |
— |
|
$ |
— |
|
|
|
|
|
|
|
|
|
|
|
|
|
|
Weighted average common shares - basic |
|
|
104.0 |
|
|
104.0 |
|
|
103.2 |
|
|
Weighted average common shares - diluted |
|
|
104.5 |
|
|
104.5 |
|
|
103.9 |
|
See accompanying notes to consolidated financial statements.
F-4
B/E AEROSPACE, INC.
CONSOLIDATED STATEMENTS OF STOCKHOLDERS' EQUITY
FOR THE YEARS ENDED DECEMBER 31, 2015, 2014 AND 2013
(In millions)
|
|
|
|
|
|
|
|
|
|
|
|
|
|
|
|
|
|
|
|
|
|
|
|
|
|
|
|
|
|
|
|
|
|
|
|
|
|
|
|
Accumulated |
|
|
|
|
|
|
|
|
|
|
|
|
|
Additional |
|
|
|
|
|
|
|
Other |
|
Total |
|
|||
|
|
|
Common Stock |
|
Paid-in |
|
|
Treasury |
|
Retained |
|
Comprehensive |
|
Stockholders' |
|
|||||||
|
|
|
Shares |
|
Amount |
|
Capital |
|
|
Stock |
|
Earnings |
|
Loss |
|
Equity |
|
|||||
|
Balance, December 31, 2012 |
|
105.4 |
|
$ |
1.1 |
|
$ |
1,670.5 |
|
$ |
(18.3) |
|
$ |
557.7 |
|
$ |
(32.1) |
|
$ |
2,178.9 |
|
|
Sale of stock under employee stock purchase plan |
|
0.1 |
|
|
— |
|
|
7.3 |
|
|
— |
|
|
— |
|
|
— |
|
|
7.3 |
|
|
Purchase of treasury stock |
|
— |
|
|
— |
|
|
— |
|
|
(3.3) |
|
|
— |
|
|
— |
|
|
(3.3) |
|
|
Exercise of stock options |
|
— |
|
|
— |
|
|
0.2 |
|
|
— |
|
|
— |
|
|
— |
|
|
0.2 |
|
|
Restricted stock grants |
|
0.2 |
|
|
— |
|
|
23.2 |
|
|
— |
|
|
— |
|
|
— |
|
|
23.2 |
|
|
Tax benefits realized from prior exercises of employee stock options and restricted stock |
|
— |
|
|
— |
|
|
9.2 |
|
|
— |
|
|
— |
|
|
— |
|
|
9.2 |
|
|
Net earnings |
|
— |
|
|
— |
|
|
— |
|
|
— |
|
|
365.6 |
|
|
— |
|
|
365.6 |
|
|
Other comprehensive income |
|
— |
|
|
— |
|
|
— |
|
|
— |
|
|
— |
|
|
28.1 |
|
|
28.1 |
|
|
Balance, December 31, 2013 |
|
105.7 |
|
|
1.1 |
|
|
1,710.4 |
|
|
(21.6) |
|
|
923.3 |
|
|
(4.0) |
|
|
2,609.2 |
|
|
Sale of stock under employee stock purchase plan |
|
0.1 |
|
|
— |
|
|
8.4 |
|
|
— |
|
|
— |
|
|
— |
|
|
8.4 |
|
|
Purchase of treasury stock |
|
— |
|
|
— |
|
|
— |
|
|
(7.0) |
|
|
— |
|
|
— |
|
|
(7.0) |
|
|
Exercise of stock options |
|
0.1 |
|
|
— |
|
|
0.3 |
|
|
— |
|
|
— |
|
|
— |
|
|
0.3 |
|
|
Restricted stock grants |
|
0.8 |
|
|
— |
|
|
28.2 |
|
|
— |
|
|
— |
|
|
— |
|
|
28.2 |
|
|
Tax benefits realized from prior exercises of employee stock options and restricted stock |
|
— |
|
|
— |
|
|
3.5 |
|
|
— |
|
|
— |
|
|
— |
|
|
3.5 |
|
|
Net earnings |
|
— |
|
|
— |
|
|
— |
|
|
— |
|
|
104.3 |
|
|
— |
|
|
104.3 |
|
|
Spin-Off of KLX Inc. |
|
— |
|
|
— |
|
|
(2,635.4) |
|
|
— |
|
|
— |
|
|
8.0 |
|
|
(2,627.4) |
|
|
Other comprehensive loss |
|
— |
|
|
— |
|
|
— |
|
|
— |
|
|
— |
|
|
(109.4) |
|
|
(109.4) |
|
|
Balance, December 31, 2014 |
|
106.7 |
|
|
1.1 |
|
|
(884.6) |
|
|
(28.6) |
|
|
1,027.6 |
|
|
(105.4) |
|
|
10.1 |
|
|
Sale of stock under employee stock purchase plan |
|
0.1 |
|
|
— |
|
|
6.8 |
|
|
— |
|
|
— |
|
|
— |
|
|
6.8 |
|
|
Purchase of treasury stock |
|
— |
|
|
— |
|
|
— |
|
|
(155.3) |
|
|
— |
|
|
— |
|
|
(155.3) |
|
|
Cash dividends declared |
|
— |
|
|
— |
|
|
— |
|
|
— |
|
|
(80.4) |
|
|
— |
|
|
(80.4) |
|
|
Restricted stock grants |
|
0.6 |
|
|
— |
|
|
28.9 |
|
|
— |
|
|
— |
|
|
— |
|
|
28.9 |
|
|
Tax benefits realized from prior exercises of employee stock options and restricted stock |
|
— |
|
|
— |
|
|
5.0 |
|
|
— |
|
|
— |
|
|
— |
|
|
5.0 |
|
|
Net earnings |
|
— |
|
|
— |
|
|
— |
|
|
— |
|
|
285.7 |
|
|
— |
|
|
285.7 |
|
|
Spin-Off of KLX Inc. |
|
— |
|
|
— |
|
|
(3.9) |
|
|
— |
|
|
— |
|
|
— |
|
|
(3.9) |
|
|
Other comprehensive loss |
|
— |
|
|
— |
|
|
— |
|
|
— |
|
|
— |
|
|
(41.4) |
|
|
(41.4) |
|
|
Balance, December 31, 2015 |
|
107.4 |
|
$ |
1.1 |
|
$ |
(847.8) |
|
$ |
(183.9) |
|
$ |
1,232.9 |
|
$ |
(146.8) |
|
$ |
55.5 |
|
See accompanying notes to consolidated financial statements.
F-5
B/E AEROSPACE, INC.
CONSOLIDATED STATEMENTS OF CASH FLOWS
FOR THE YEARS ENDED DECEMBER 31, 2015, 2014 AND 2013
(In millions)
|
|
|
|
|
|
|
|
|
|
|
|
|
|
|
Year Ended December 31, |
|
|||||||
|
|
|
2015 |
|
2014 |
|
2013 |
|
|||
|
CASH FLOWS FROM OPERATING ACTIVITIES: |
|
|
|
|
|
|
|
|
|
|
|
Net earnings |
|
$ |
285.7 |
|
$ |
104.3 |
|
$ |
365.6 |
|
|
Adjustments to reconcile net earnings to net cash flows provided |
|
|
|
|
|
|
|
|
|
|
|
by operating activities, net of effects from acquisitions: |
|
|
|
|
|
|
|
|
|
|
|
Depreciation and amortization |
|
|
85.3 |
|
|
142.3 |
|
|
89.6 |
|
|
Deferred income taxes |
|
|
(4.1) |
|
|
36.3 |
|
|
32.9 |
|
|
Non-cash compensation |
|
|
30.2 |
|
|
29.7 |
|
|
24.2 |
|
|
Tax benefits realized from prior exercises of employee stock options and restricted stock |
|
|
(5.0) |
|
|
(3.5) |
|
|
(9.2) |
|
|
Provision for doubtful accounts |
|
|
7.2 |
|
|
9.6 |
|
|
1.3 |
|
|
Loss on disposal of property and equipment |
|
|
9.2 |
|
|
3.8 |
|
|
2.4 |
|
|
Debt prepayment costs |
|
|
0.9 |
|
|
243.6 |
|
|
— |
|
|
Changes in operating assets and liabilities: |
|
|
|
|
|
|
|
|
|
|
|
Accounts receivable |
|
|
(84.7) |
|
|
(77.0) |
|
|
(67.2) |
|
|
Inventories |
|
|
(184.6) |
|
|
(284.0) |
|
|
(181.8) |
|
|
Other current and non-current assets |
|
|
67.7 |
|
|
(220.2) |
|
|
(8.3) |
|
|
Accounts payable and accrued liabilities |
|
|
103.0 |
|
|
266.0 |
|
|
129.6 |
|
|
Net cash flows provided by operating activities |
|
|
310.8 |
|
|
250.9 |
|
|
379.1 |
|
|
|
|
|
|
|
|
|
|
|
|
|
|
CASH FLOWS FROM INVESTING ACTIVITIES: |
|
|
|
|
|
|
|
|
|
|
|
Capital expenditures |
|
|
(80.5) |
|
|
(255.6) |
|
|
(154.9) |
|
|
Acquisitions, net of cash acquired |
|
|
3.9 |
|
|
(1,043.1) |
|
|
(118.1) |
|
|
Other |
|
|
(6.4) |
|
|
0.8 |
|
|
0.1 |
|
|
Net cash flows used in investing activities |
|
|
(83.0) |
|
|
(1,297.9) |
|
|
(272.9) |
|
|
|
|
|
|
|
|
|
|
|
|
|
|
CASH FLOWS FROM FINANCING ACTIVITIES: |
|
|
|
|
|
|
|
|
|
|
|
Proceeds from common stock issued |
|
|
5.8 |
|
|
7.5 |
|
|
6.4 |
|
|
Purchase of treasury stock, including share repurchases |
|
|
(155.3) |
|
|
(7.0) |
|
|
(3.3) |
|
|
Proceeds from long-term debt |
|
|
— |
|
|
2,189.0 |
|
|
— |
|
|
Proceeds from KLX long-term debt |
|
|
— |
|
|
1,200.0 |
|
|
— |
|
|
Principal payments on long-term debt |
|
|
(136.0) |
|
|
(1,950.0) |
|
|
(0.3) |
|
|
Borrowings on line of credit |
|
|
— |
|
|
868.0 |
|
|
— |
|
|
Repayments on line of credit |
|
|
— |
|
|
(868.0) |
|
|
— |
|
|
Debt prepayment costs |
|
|
— |
|
|
(210.9) |
|
|
— |
|
|
Debt origination costs |
|
|
— |
|
|
(61.3) |
|
|
— |
|
|
Tax benefits realized from prior exercises of employee stock options and restricted stock |
|
|
5.0 |
|
|
3.5 |
|
|
9.2 |
|
|
Cash divested in connection with Spin-Off of KLX |
|
|
— |
|
|
(460.0) |
|
|
— |
|
|
Dividends |
|
|
(79.3) |
|
|
— |
|
|
— |
|
|
Net cash flows (used in) provided by financing activities |
|
|
(359.8) |
|
|
710.8 |
|
|
12.0 |
|
|
|
|
|
|
|
|
|
|
|
|
|
|
Effect of foreign exchange rate changes on cash and cash equivalents |
|
|
(6.4) |
|
|
(9.1) |
|
|
5.9 |
|
|
|
|
|
|
|
|
|
|
|
|
|
|
Net (decrease) increase in cash and cash equivalents |
|
|
(138.4) |
|
|
(345.3) |
|
|
124.1 |
|
|
Cash and cash equivalents, beginning of year |
|
|
292.5 |
|
|
637.8 |
|
|
513.7 |
|
|
Cash and cash equivalents, end of year |
|
$ |
154.1 |
|
$ |
292.5 |
|
$ |
637.8 |
|
F-6
|
|
|
Year Ended December 31, |
|
|||||||
|
|
|
2015 |
|
2014 |
|
2013 |
|
|||
|
Supplemental disclosures of cash flow information: |
|
|
|
|
|
|
|
|
|
|
|
Cash paid (refunded) during period for: |
|
|
|
|
|
|
|
|
|
|
|
Interest |
|
$ |
77.3 |
|
$ |
148.3 |
|
$ |
118.4 |
|
|
Income taxes, net of $32.0 payments in 2015 |
|
|
(11.8) |
|
|
124.0 |
|
|
86.7 |
|
|
|
|
|
|
|
|
|
|
|
|
|
|
Supplemental schedule of non-cash activities: |
|
|
|
|
|
|
|
|
|
|
|
Accrued property additions |
|
$ |
3.6 |
|
$ |
9.1 |
|
$ |
8.7 |
|
See accompanying notes to consolidated financial statements.
F-7
NOTES TO CONSOLIDATED FINANCIAL STATEMENTS
FOR THE YEARS ENDED DECEMBER 31, 2015, 2014 AND 2013
(In millions, except share and per share data)
1.SUMMARY OF SIGNIFICANT ACCOUNTING POLICIES
Organization and Basis of Presentation – B/E Aerospace, Inc. and its wholly owned subsidiaries (the “Company”) designs, manufactures, sells and services commercial aircraft and business jet cabin interior products consisting of a broad range of seating and interior systems, including structures for food and beverage storage and preparation equipment. The Company’s principal customers are the operators of commercial and business jet aircraft, aircraft manufacturers and their suppliers. As a result, the Company’s business is directly dependent upon the conditions in the commercial airline, business jet and aircraft manufacturing industries. The accompanying consolidated financial statements are prepared in accordance with accounting principles generally accepted in the United States of America.
On December 16, 2014 (the “Distribution Date”), we completed the spin-off of KLX Inc. (“KLX”) by means of the transfer of our Consumables Management Segment to KLX and the subsequent distribution to B/E Aerospace stockholders of all the outstanding shares of KLX common stock (the “Spin-Off”). We retained our commercial aircraft and business jet segments. On the Distribution Date, each of our stockholders of record as of the close of business on December 5, 2014 (the “Record Date”) received one share of KLX common stock for every two shares of our common stock held as of the Record Date.
Consolidation – The accompanying consolidated financial statements include the accounts of B/E Aerospace, Inc. and its wholly owned subsidiaries. Intercompany transactions and balances have been eliminated in consolidation.
Financial Statement Preparation – The preparation of the consolidated financial statements in conformity with accounting principles generally accepted in the United States of America requires management to make estimates and assumptions that affect the reported amounts and related disclosures. Actual results could differ from those estimates.
Revenue Recognition – Sales of products are recorded when the earnings process is complete. This generally occurs when the products are shipped to the customer in accordance with the contract or purchase order, risk of loss and title has passed to the customer, collectability is reasonably assured and pricing is fixed and determinable. In instances where title does not pass to the customer upon shipment, the Company recognizes revenue upon delivery or customer acceptance, depending on the terms of the sales contract.
Service revenues primarily consist of engineering activities and are recorded when services are performed.
Revenues and costs under certain long-term contracts are recognized using contract accounting under the percentage-of-completion method in accordance with the Financial Accounting Standards Board (“FASB”) Accounting Standards Codification (“ASC”) 605-35, Construction–Type and Production–Type Contracts (“ASC 605-35”), with the majority of the contracts accounted for under the cost-to-cost method. Under the cost-to-cost method, the revenues related to the long-term contracts are recognized based on the ratio of actual costs incurred to total estimated costs to be incurred. The Company uses the units-of-delivery method to account for certain contracts. Under the units-of delivery method, revenues are recognized based on the contract price of units delivered.
The percentage-of-completion method requires the use of estimates of costs to complete long-term contracts. Due to the duration of these contracts as well as the technical nature of the products involved, the estimation of these costs requires management’s judgment in connection with assumptions and projections related to the outcome of future events. Management’s assumptions include future labor performance and rates and projections relative to material and overhead costs, as well as the quantity and
F-8
timing of product deliveries. The Company reevaluates its contract estimates periodically and reflects changes in estimates in the current period using the cumulative catch-up method. There were no significant changes in our contract estimates during 2015, 2014 or 2013 that resulted in material cumulative catch-up adjustments to operating earnings other than cost estimate changes resulting from the extraordinary expedited development of a new product suite to support a major customer initiative during 2014. Revenues associated with any contractual claims are recognized when it is probable that the claim will result in additional contract revenue and the amount can be reasonably estimated. For the years ended December 31, 2015, 2014 and 2013, approximately 27.7%, 25.5% and 25.4% of our revenues, respectively, were derived from contracts accounted for using percentage-of-completion accounting. Net costs and estimated earnings in excess of billings on uncompleted contracts were $50.9 and $93.7 at December 31, 2015 and 2014, respectively, and recorded as work-in-process inventory. Capitalized development costs on long-term seller furnished equipment contracts were $438.1 and $320.6 at December 31, 2015 and 2014, respectively and recorded as work-in-process inventory. Anticipated losses on contracts are recognized in the period in which the losses become evident and determinable. Advance payments and engineering development costs on certain long-term contracts are deferred and included in revenues and research, development and engineering, respectively, when the products are shipped.
Income Taxes – The Company provides deferred income taxes for temporary differences between the amounts of assets and liabilities recognized for financial reporting purposes and such amounts recognized for income tax purposes. Deferred income taxes are computed using enacted tax rates that are expected to be in effect when the temporary differences reverse. A valuation allowance related to a deferred tax asset is recorded when it is more likely than not that some portion or the entire deferred tax asset will not be realized. The Company records uncertain tax positions within income tax expense and classifies interest and penalties related to income taxes as income tax expense.
Cash Equivalents – The Company considers all highly liquid debt instruments purchased with an original maturity of three months or less to be cash equivalents.
Accounts Receivable – The Company performs ongoing credit evaluations of its customers and adjusts credit limits based upon payment history and the customer's current creditworthiness, as determined by review of their current credit information. The Company continuously monitors collections and payments from its customers and maintains a provision for estimated credit losses based upon historical experience and any specific customer collection issues that have been identified. The allowance for doubtful accounts at December 31, 2015 and 2014 was $6.3 and $5.4, respectively.
Inventories – The Company values inventories at the lower of cost or market, using FIFO or weighted average cost method. The Company regularly reviews inventory quantities on hand and records a provision for excess and obsolete inventory based primarily on historical demand, as well as an estimated forecast of product demand and production requirements, and the age of the inventory among other factors. Demand for the Company’s products can fluctuate significantly. In accordance with industry practice, costs in inventory include amounts relating to long-term contracts with long production cycles and to inventory items with long procurement cycles, some of which are not expected to be realized within one year.
Property and Equipment – Property and equipment are stated at cost and depreciated generally under the straight-line method over their estimated useful lives of one to fifty years (or the lesser of the term of the lease for leasehold improvements, as appropriate).
Debt Issuance Costs – Costs incurred to issue debt are deferred and amortized as interest expense over the term of the related debt. Unamortized debt issue costs are written off at the time of prepayment.
Goodwill and Intangible Assets – Under FASB ASC 350, Intangibles – Goodwill and Other (“ASC 350”), goodwill is reviewed at least annually for impairment. Acquired intangible assets with definite lives are amortized over their individual useful lives. Patents and other intangible assets are amortized using the straight-line method over periods ranging from three to thirty-four years.
F-9
The Company has five reporting units, which were determined based on the guidelines contained in FASB ASC Topic 350, Subtopic 20, Section 35. Each reporting unit represents either (a) an operating segment (which is also a reportable segment) or (b) a component of an operating segment, which constitutes a business, for which there is discrete financial information available that is regularly reviewed by segment management.
On at least an annual basis, management assesses whether there has been any impairment in the value of goodwill by first comparing the fair value to the net carrying value of reporting units. If the carrying value exceeds its estimated fair value, a second step is performed to compute the amount of the impairment. An impairment loss is recognized if the implied fair value of the asset being tested is less than its carrying value. In this event, the asset is written down accordingly. The fair values of reporting units for goodwill impairment testing are determined using valuation techniques based on estimates, judgments and assumptions management believes are appropriate under the circumstances. The sum of the fair values of the reporting units are evaluated based on market capitalization determined using average share prices within a reasonable period of time near the selected testing date (calendar year-end), plus an estimated control premium plus the fair value of the Company’s debt obligations. For the years ended December 31, 2015, 2014 and 2013, the Company’s annual impairment testing yielded no impairments of goodwill.
Long-Lived Assets – The Company assesses potential impairments to its long-lived assets when there is evidence that events or changes in circumstances indicate that the carrying amount of an asset may not be recovered. An impairment loss is recognized when the undiscounted cash flows expected to be generated by an asset (or group of assets) is less than its carrying amount. Any required impairment loss is measured as the amount by which the asset's carrying value exceeds its fair value and is recorded as a reduction in the carrying value of the related asset and a charge to operating results. There were no impairments of long lived assets in 2015, 2014, and 2013.
Product Warranty Costs – Estimated costs related to product warranties are accrued at the time products are sold. In estimating its future warranty obligations, the Company considers various relevant factors, including the Company's stated warranty policies and practices, the historical frequency of claims and the cost to replace or repair its products under warranty. Estimated warranty costs are included in accrued liabilities on the consolidated balance sheet. The following table provides a reconciliation of the activity related to the Company's accrued warranty expense:
|
|
|
|
|
|
|
|
|
|
|
|
|
|
|
Year Ended December 31, |
|
|||||||
|
|
|
2015 |
|
2014 |
|
2013 |
|
|||
|
Balance at beginning of period |
|
$ |
75.4 |
|
$ |
67.0 |
|
$ |
63.2 |
|
|
Provision for warranty expense |
|
|
66.1 |
|
|
41.9 |
|
|
42.6 |
|
|
Settlements of warranty claims |
|
|
(41.7) |
|
|
(33.5) |
|
|
(38.8) |
|
|
Balance at end of period |
|
$ |
99.8 |
|
$ |
75.4 |
|
$ |
67.0 |
|
Accounting for Stock-Based Compensation – The Company accounts for share-based compensation arrangements in accordance with the provisions of FASB ASC 718, Compensation – Stock Compensation (“ASC 718”), whereby share-based compensation cost is measured on the date of grant, based on the fair value of the award, and is recognized over the requisite service period.
Compensation cost recognized during the three years ended December 31, 2015 related to grants of restricted stock and restricted stock units. No compensation cost related to stock options was recognized during those periods as no options were granted during the three year period ended December 31, 2015 and all options were vested as of December 31, 2006.
The Company has established a qualified Employee Stock Purchase Plan. The Plan allows qualified employees (as defined in the plan) to participate in the purchase of designated shares of the Company's common stock at a price equal to 85% of the closing price for each semi-annual stock purchase period. The fair value of employee purchase rights represents the difference between the closing price of the Company’s
F-10
shares on the date of purchase and the purchase price of the shares. The value of the rights granted during the years ended December 31, 2015, 2014 and 2013 was $1.0, $1.3 and $1.1, respectively.
Treasury Stock – The Company may periodically repurchase shares of its common stock from employees for the satisfaction of their individual payroll tax withholding upon vesting of restricted stock and restricted stock units in connection with the Company’s Long-Term Incentive Plan. The Company’s repurchases of common stock are recorded at the average cost of the common stock. The Company repurchased 117,349, 99,911 and 41,376 shares of its common stock for $5.2, $7.0 and $3.3 during the years ended December 31, 2015, 2014 and 2013, respectively. On November 11, 2014, the Board of Directors authorized a $400.0 share repurchase program. During 2015, the Company repurchased 3,347,258 shares of common stock at an average price of $44.84 per share for a total of $150.1.
Research and Development – Research and development expenditures are expensed as incurred.
Foreign Currency Translation – The assets and liabilities of subsidiaries located outside the United States are translated into U.S. dollars at the rates of exchange in effect at the balance sheet dates. Revenue and expense items are translated at the average exchange rates prevailing during the period. Gains and losses resulting from foreign currency transactions are recognized currently in income, and those resulting from translation of financial statements are accumulated as a separate component of stockholders’ equity. The Company's foreign subsidiaries primarily utilize the British pound, the Euro or the Philippine Peso as their local functional currency.
Concentration of Risk – The Company’s products and services are primarily concentrated within the aerospace industry with customers consisting primarily of commercial airlines, a wide variety of business jet customers and commercial aircraft manufacturers. In addition to the overall business risks associated with the Company’s concentration within the airline and aerospace industries, the Company is exposed to a concentration of collection risk on credit extended to commercial airlines and commercial aircraft manufacturers. The Company’s management performs ongoing credit evaluations on the financial condition of all customers it has extended credit to and maintains allowances for uncollectible accounts receivable based on expected collectability. Credit losses have historically been within management's expectations and the provisions established.
Significant customers change from year to year depending on the level of refurbishment activity and/or the level of new aircraft purchases by such customers. During the years ended December 31, 2015, 2014 and 2013, The Boeing Company accounted for 10%, 12% and 12%, respectively, of the Company’s consolidated revenues. No other individual customer accounted for more than 10% of the Company’s consolidated revenues during the years ended December 31, 2015, 2014 and 2013.
Recent Accounting Pronouncements
In November 2015, the FASB issued Accounting Standards Update (“ASU”) 2015-17, Balance Sheet Classification of Deferred Taxes (“ASU 2015-17”). The updated guidance requires entities to present deferred tax assets (“DTAs”) and deferred tax liabilities (“DTLs”) as non-current in a classified balance sheet. The updated guidance is effective either prospectively or retrospectively for annual periods and interim periods within the annual periods beginning after December 15, 2016. The Company has elected to early adopt ASU 2015-17 as of December 31, 2015 and retrospectively applied ASU 2015-17 to all periods presented. As of December 31, 2014 the Company reclassified $19.2 of deferred tax assets from current assets to the non-current liability section of the consolidated balance sheets.
In April 2015, the FASB issued ASU 2015-03, Simplifying the Presentation of Debt Issuance Costs, and, in August 2015, the FASB issued ASU 2015-15, Presentation and Subsequent Measurement of Debt Issuance Costs Associated with Line-of-Credit Arrangements, which updated the guidance in ASC Topic 835, Interest. The updated guidance is effective retrospectively for annual periods and interim periods within the annual periods beginning after December 15, 2015. The amendment requires that debt issuance costs related to a
F-11
recognized debt liability be presented in the balance sheet as a direct deduction from the carrying amount of that debt liability. The Company adopted these ASUs effective January 1, 2015 and has presented debt issuance costs related to its Term Loan Facility of $20.7 and $24.4 as of December 31, 2015 and December 31, 2014, respectively, as a direct deduction from the carrying amounts of its debt liabilities. The 2014 amount was previously recorded in other assets.
In June 2014, the FASB issued ASU 2014-12, Compensation – Stock Compensation (“ASU 2014-12”), which updated the guidance in ASC Topic 718, Compensation – Stock Compensation (“ASC Topic 718”). The update is effective for annual periods and interim periods within those annual periods beginning after December 15, 2015. Earlier adoption is permitted. ASU 2014-12 brings consistency to the accounting for share-based payment awards that require a specific performance target to be achieved in order for employees to become eligible to vest in the awards. The guidance permits two implementation approaches, either prospectively to all awards granted or modified after the effective date, or retrospectively to all awards with performance targets that are outstanding as of the beginning of the earliest annual period presented in the financial statements and to all new or modified awards thereafter. The adoption of ASU 2014-12 is not expected to have a material impact on the Company’s consolidated financial statements.
In May 2014, the FASB issued ASU 2014-09, Revenue from Contracts with Customers, which updated the guidance in ASC Topic 606, Revenue Recognition. The new standard was originally effective for reporting periods beginning after December 15, 2016 and early adoption was not permitted. In August 2015, the FASB issued ASU 2015-14 which amended the effective date of this ASU to fiscal years beginning after December 15, 2017, and early adoption is permitted only for fiscal years beginning after December 15, 2016. Accordingly, we plan to adopt this ASU on January 1, 2018. The core principle of the guidance is that an entity should recognize revenue to depict the transfer of promised goods or services to customers in an amount that reflects the consideration to which the entity expects to be entitled in exchange for those goods or services. To achieve that core principle, an entity should identify the contract(s) with a customer, identify the performance obligations in the contract(s), determine the transaction price, allocate the transaction price to the performance obligations in the contract(s) and recognize revenue when (or as) the entity satisfies a performance obligation. The two permitted transition methods under the new standard are the full retrospective method, in which case the standard would be applied to each prior reporting period presented, or the modified retrospective method, in which case the cumulative effect of applying the standard would be recognized at the date of initial application. The Company is currently evaluating the impact this guidance will have on its consolidated financial condition, results of operations, cash flows and disclosures and is currently unable to estimate the impact of adopting this guidance.
In April 2014, the FASB issued ASU 2014-08, Presentation of Financial Statements (ASC Topic 205) and Property, Plant and Equipment (“ASU 2014-08”), which updated the guidance in ASC Topic 360, Property, Plant and Equipment. The updated guidance is effective prospectively for years beginning on or after December 15, 2014, with early application permitted. The amendments in this update change the requirements for reporting discontinued operations in ASC Subtopic 205-20, Presentation of Financial Statements-Discontinued Operations. Under this updated guidance, a discontinued operation will include a disposal of a major part of an entity’s operations and financial results such as a separate major line of business or a separate major geographical area of operations. The guidance raises the threshold to be a major operation but no longer precludes discontinued operations presentation where there is significant continuing involvement or cash flows with a disposed component of an entity. The guidance expands disclosures to include cash flows where there is significant continuing involvement with a discontinued operation and the pre-tax profit or loss of disposal transactions not reported as discontinued operations. The adoption of ASU 2014-08 did not have a material impact on the Company’s consolidated financial statements.
F-12
2. DIVESTITURES AND BUSINESS COMBINATIONS
Spin-off of KLX Inc.
On June 10, 2014, we announced a plan to spin-off our Consumables Management Segment into a separate publicly traded company. To accomplish the Spin-Off, we formed KLX. On the Distribution Date, we completed the Spin-Off by means of the transfer of our Consumables Management Segment to KLX and the subsequent distribution of all the outstanding KLX common stock to our stockholders. We retained our commercial aircraft and business jet segments. On the Distribution Date, each of our stockholders of record as of the close of business on the Record Date received one share of KLX common stock for every two shares of our common stock held as of the Record Date. The distribution was structured to be tax free to our U.S. stockholders for U.S. federal income tax purposes.
The divested KLX is presented as a discontinued operation on the consolidated statements of earnings and comprehensive income for all periods prior to 2015. The cash flows of KLX are included within our consolidated statements of cash flows through December 16, 2014.
Summary results of operations for KLX through December 16, 2014 were as follows:
|
|
|
|
|
|
|
|
|
|
|
|
For the Period from |
|
|
|
||
|
|
|
January 1, 2014 to |
|
For the Year Ended |
|
||
|
|
|
December 16, 2014 |
|
December 31, 2013 |
|
||
|
Revenues |
|
$ |
1,611.2 |
|
$ |
1,280.4 |
|
|
|
|
|
|
|
|
|
|
|
Earnings before income taxes |
|
|
207.9 |
|
|
267.5 |
|
|
Provision for income taxes |
|
|
161.3 |
|
|
96.8 |
|
|
Earnings from discontinued operations, net of income taxes |
|
$ |
46.6 |
|
$ |
170.7 |
|
The results of KLX discontinued operations exclude certain corporate and group allocations which were historically allocated to KLX. These costs include primarily corporate overhead and information systems.
On December 16, 2014, we divested the following assets and liabilities in connection with the Spin-Off:
|
|
|
|
|
|
|
Assets |
|
|
|
|
|
Cash and cash equivalents |
|
$ |
460.0 |
|
|
Accounts receivable |
|
|
310.8 |
|
|
Inventories |
|
|
1,303.4 |
|
|
Deferred income taxes |
|
|
40.2 |
|
|
Other current assets |
|
|
52.3 |
|
|
Property and equipment |
|
|
323.1 |
|
|
Goodwill |
|
|
1,370.4 |
|
|
Identifiable intangible assets |
|
|
430.7 |
|
|
Other assets |
|
|
119.1 |
|
|
|
|
|
4,410.0 |
|
|
Liabilities |
|
|
|
|
|
Accounts payable |
|
|
167.1 |
|
|
Accrued liabilities |
|
|
182.4 |
|
|
Long-term debt |
|
|
1,200.0 |
|
|
Deferred income taxes |
|
|
121.1 |
|
|
Other non-current liabilities |
|
|
112.0 |
|
|
|
|
|
1,782.6 |
|
|
Net assets divested in the Spin-Off |
|
$ |
2,627.4 |
|
F-13
During 2013 and 2014, the Company completed seven energy services acquisitions (the “Energy Services Acquisitions”) for a total purchase price of $627.8. The Energy Services Acquisitions were accounted for as purchases under FASB ASC 805, Business Combinations (“ASC 805”). The assets purchased and liabilities assumed for the Energy Services Acquisitions have been reflected in the amounts divested in connection with the Spin-Off.
We entered into transitional services agreements with KLX prior to the Spin-Off pursuant to which we and KLX are providing various services to each other on an interim transitional basis. Transition services may be provided for up to 24 months, and for information technology services, KLX has an option for a one-year extension by the recipient. Services being provided by us include certain information technology and back office support. We record billings under these transition services agreements which are recorded as a reduction of the costs of the respective service in the applicable expense category in the consolidated statement of earnings and comprehensive income. This transitional support will enable KLX to establish its stand-alone processes for various activities that were previously provided by us and does not constitute significant continuing support of KLX’s operations.
Under the Tax Sharing and Indemnification Agreement between the Company and KLX, we generally assume liability for all federal and state income taxes for all tax periods ending on or prior to December 31, 2014. We assume the liability for all federal and state income taxes of KLX’s U.S. operations through the Distribution Date. KLX assumes all other federal taxes, foreign income tax/non-income taxes and state/local non-income taxes related to their business for all periods and we assume all other federal taxes, foreign income tax/non-income taxes and state/local non-income taxes related to our business for all periods. Additional taxes incurred related to the internal restructuring to separate the businesses to complete the Spin-Off shall be shared equally between the Company and KLX. Taxes incurred related to certain international tax initiatives for the KLX business shall be assumed by KLX subject to the calculation provisions of the Tax Sharing and Indemnification Agreement. In addition, we transferred to KLX all of its deferred tax assets and liabilities as of December 16, 2014.
In connection with the Spin-Off, we have adjusted our employee stock compensation awards and separated our employee medical and dental benefit plans.
Sales and cost of sales to KLX for the year ended December 31, 2015 were immaterial to the consolidated financial statements. There were no material balances due to or due from KLX as of December 31, 2015. Total purchases from KLX for the year ended December 31, 2015 were approximately $18.3.
Acquisitions
During the second quarter of 2014, the Company acquired the outstanding shares of the Emteq, Inc. group of companies (“EMTEQ”), a domestic provider of aircraft interior and exterior lighting systems, as well as aircraft cabin management and power systems for a purchase price of $253.2, net of cash acquired. The Company also acquired the outstanding shares of the F+E Fischer + Entwicklungen GmbH & Co. KG group of companies (“Fischer”), a leading Europe-based manufacturer of seating products for civilian helicopters for a purchase price of $211.7, net of cash acquired. The Company also acquired the outstanding shares of Wessex Advanced Switching Products Ltd. (“WASP”), which is engaged in the production of lighting, control units and switches and is based in Europe, for a purchase price of $63.0, net of cash acquired. These acquisitions are included in the business jet segment and collectively referred to as the “2014 Acquisitions”.
The excess of the purchase price over the fair value of the identifiable assets acquired in the 2014 Acquisitions approximated $530.5, of which $137.0 was allocated to identified intangible assets, consisting of customer contracts and relationships, developed technologies, trade names and covenants not to compete, and $393.5 was allocated to goodwill. The useful life assigned to the customer contracts and relationships and developed technologies is 15 to 20 years, the useful life assigned to trade names is five to 20 years, and the covenants not to compete are being amortized over their contractual periods of three to five years.
F-14
The 2014 Acquisitions were accounted for as purchases under FASB ASC 805, Business Combinations (“ASC 805”). The assets purchased and liabilities assumed for the 2014 Acquisitions have been reflected in the accompanying consolidated balance sheets as of December 31, 2015 and December 31, 2014. The results of operations for the 2014 Acquisitions are included in the accompanying consolidated statements of earnings and comprehensive income from their respective dates of acquisition. The Company’s 2014 consolidated revenues and earnings before income taxes include approximately $82.6 and $11.4, respectively, from the 2014 acquisitions.
The Company completed its evaluation and allocation of the purchase price of the 2014 Acquisitions resulting in adjustments to increase identifiable intangible assets and deferred income tax liabilities of $32.5 and $10.5, respectively, and to decrease goodwill by $19.1. These adjustments were applied retrospectively to the acquisition date. Accordingly, the Company's consolidated balance sheet as of December 31, 2014 has been adjusted to reflect the effects of the measurement period adjustments. There was no material impact of the measurement period adjustments on the retrospective period statement of earnings and comprehensive income.
F-15
The following table summarizes the fair values of assets acquired and liabilities assumed in the 2014 Acquisitions in accordance with ASC 805:
|
|
|
EMTEQ |
|
Fischer |
|
|
WASP |
||
|
Accounts receivable-trade |
|
$ |
12.5 |
|
$ |
7.1 |
|
$ |
4.9 |
|
Inventories |
|
|
12.3 |
|
|
4.6 |
|
|
3.3 |
|
Other current and non-current assets |
|
|
2.5 |
|
|
0.9 |
|
|
0.3 |
|
Property and equipment |
|
|
6.5 |
|
|
5.9 |
|
|
1.2 |
|
Goodwill |
|
|
194.0 |
|
|
155.6 |
|
|
43.9 |
|
Identified intangibles |
|
|
45.7 |
|
|
73.7 |
|
|
17.6 |
|
Accounts payable |
|
|
(4.2) |
|
|
(1.3) |
|
|
(2.3) |
|
Other current and non-current liabilities |
|
|
(16.1) |
|
|
(34.8) |
|
|
(5.9) |
|
Total purchase price |
|
$ |
253.2 |
|
$ |
211.7 |
|
$ |
63.0 |
|
|
|
|
|
|
|
|
|
|
|
The majority of the goodwill and intangible assets related to the 2014 Acquisitions are not expected to be deductible for tax purposes. The primary items that generated the goodwill recognized were the premiums paid by the Company for the future earnings potential of the 2014 Acquisitions and the value of its assembled workforce that do not qualify for separate recognition.
Consolidated unaudited pro forma revenues, net earnings and diluted net earnings per share giving effect to the 2014 Acquisitions as if they had occurred on January 1, 2013 were $2,668.0, $77.4, and $0.74, and $2,372.5, $120.9 and $1.16, for the years ended December 31, 2014 and 2013, respectively.
3.INVENTORIES
Inventories are stated at the lower of cost or market. Cost is determined using FIFO or the weighted average cost method. Finished goods and work-in-process inventories include material, labor and manufacturing overhead costs. In accordance with industry practice, costs in inventory include amounts relating to long-term contracts with long production cycles and inventory items with long procurement cycles, some of which are not expected to be realized within one year. Work-in-process inventories include costs and estimated earnings in excess of billings on uncompleted contracts of $87.7 and $127.9 and capitalized development costs on long-term seller furnished equipment contracts of $438.1 and $320.6 as of December 31, 2015 and December 31, 2014, respectively. Inventories consist of the following:
|
|
|
December 31, |
|
December 31, |
|
||
|
|
|
2015 |
|
2014 |
|
||
|
Purchased materials and component parts |
|
$ |
322.7 |
|
$ |
257.4 |
|
|
Work-in-process |
|
|
722.7 |
|
|
605.9 |
|
|
Finished goods |
|
|
46.5 |
|
|
61.0 |
|
|
|
|
$ |
1,091.9 |
|
$ |
924.3 |
|
F-16
4.PROPERTY AND EQUIPMENT
Property and equipment consist of the following:
|
|
|
Useful Life |
|
December 31, |
|
December 31, |
|
||||
|
|
|
(Years) |
|
2015 |
|
2014 |
|
||||
|
Buildings and improvements |
|
1 |
- |
50 |
|
$ |
133.3 |
|
$ |
138.9 |
|
|
Machinery |
|
1 |
- |
20 |
|
|
169.2 |
|
|
163.8 |
|
|
Tooling |
|
1 |
- |
14 |
|
|
107.5 |
|
|
97.8 |
|
|
Computer equipment and software |
|
1 |
- |
17 |
|
|
271.4 |
|
|
280.5 |
|
|
Furniture and equipment |
|
1 |
- |
16 |
|
|
29.8 |
|
|
28.6 |
|
|
|
|
|
|
|
|
|
711.2 |
|
|
709.6 |
|
|
Less accumulated depreciation |
|
|
|
|
|
|
(320.0) |
|
|
(312.0) |
|
|
|
|
|
|
|
|
$ |
391.2 |
|
$ |
397.6 |
|
Depreciation expense was $68.1, $97.7 and $58.9 for the years ended December 31, 2015, 2014 and 2013, respectively. Depreciation expense from continuing operations was $63.2 and $60.0 for the years ended December 31, 2014 and 2013, respectively.
5.GOODWILL AND INTANGIBLE ASSETS
The following sets forth the intangible assets by major asset class, all of which were acquired through business purchase transactions:
|
|
|
|
|
|
December 31, 2015 |
|
December 31, 2014 |
|
||||||||||||||
|
|
Useful Life |
|
Original |
|
Accumulated |
|
Net Book |
|
Original |
|
Accumulated |
|
Net Book |
|
||||||||
|
|
(Years) |
|
Cost |
|
Amortization |
|
Value |
|
Cost |
|
Amortization |
|
Value |
|
||||||||
|
Customer contracts and relationships |
13 |
- |
23 |
|
$ |
129.4 |
|
$ |
20.1 |
|
$ |
109.3 |
|
$ |
136.9 |
|
$ |
13.4 |
|
$ |
123.5 |
|
|
Acquired technologies and other |
5 |
- |
34 |
|
|
150.0 |
|
|
65.3 |
|
|
84.7 |
|
|
173.6 |
|
|
81.0 |
|
|
92.6 |
|
|
Trademarks and patents |
3 |
- |
20 |
|
|
27.1 |
|
|
16.3 |
|
|
10.8 |
|
|
24.1 |
|
|
16.5 |
|
|
7.6 |
|
|
Covenants not to compete |
3 |
- |
5 |
|
|
2.5 |
|
|
1.0 |
|
|
1.5 |
|
|
0.7 |
|
|
1.7 |
|
|
(1.0) |
|
|
Trade names |
5 |
- |
20 |
|
|
29.0 |
|
|
4.0 |
|
|
25.0 |
|
|
29.7 |
|
|
1.7 |
|
|
28.0 |
|
|
|
|
|
|
|
$ |
338.0 |
|
$ |
106.7 |
|
$ |
231.3 |
|
$ |
365.0 |
|
$ |
114.3 |
|
$ |
250.7 |
|
Amortization expense of intangible assets was $17.2, $44.6 and $30.7 for the years ended December 31, 2015, 2014 and 2013, respectively. Amortization expense from continuing operations was $15.4 and $10.8 for the years ended December 31, 2014 and 2013, respectively. Amortization expense associated with identified intangible assets as of December 31, 2015 is expected to be approximately $17 in each of the next five years. The future amortization amounts are estimates. Actual future amortization expense may be different due to future acquisitions, impairments, changes in amortization periods or other factors such as changes in exchange rates for assets acquired outside the United States. The Company expenses costs to renew or extend the term of a recognized intangible asset.
Goodwill decreased by $27.2 due to foreign currency translation.
In accordance with ASC 350, goodwill is not amortized but is subject to an annual impairment test. As of December 31, 2015, the Company completed step one of the impairment test and fair value analysis for goodwill. No impairment loss was recorded during the years ended December 31, 2015, 2014 or 2013.
F-17
The changes in the carrying amount of goodwill for the years ended December 31, 2015 and 2014 are as follows:
|
|
|
Commercial |
|
|
|
Business |
|
|
|
|
|||
|
|
|
Aircraft |
|
KLX |
|
Jet |
|
Total |
|
||||
|
Balance as of December 31, 2013 |
|
$ |
394.6 |
|
$ |
1,086.5 |
|
$ |
89.9 |
|
$ |
1,571.0 |
|
|
Acquisitions |
|
|
— |
|
|
305.9 |
|
|
394.5 |
|
|
700.4 |
|
|
Spin-Off of KLX |
|
|
— |
|
|
(1,370.4) |
|
|
— |
|
|
(1,370.4) |
|
|
Effect of foreign currency translation and other |
|
|
(14.8) |
|
|
(22.0) |
|
|
(23.8) |
|
|
(60.6) |
|
|
Balance as of December 31, 2014 |
|
|
379.8 |
|
|
— |
|
|
460.6 |
|
|
840.4 |
|
|
Effect of foreign currency translation and other |
|
|
(7.2) |
|
|
— |
|
|
(20.0) |
|
|
(27.2) |
|
|
Balance as of December 31, 2015 |
|
$ |
372.6 |
|
$ |
— |
|
$ |
440.6 |
|
$ |
813.2 |
|
6.ACCRUED LIABILITIES
Accrued liabilities consist of the following:
|
|
|
|
|
|
|
|
|
|
|
|
December 31, |
|
December 31, |
|
||
|
|
|
2015 |
|
2014 |
|
||
|
Accrued salaries, vacation and related benefits |
|
$ |
75.0 |
|
$ |
83.4 |
|
|
Accrued product warranties |
|
|
99.8 |
|
|
75.4 |
|
|
Accrued interest |
|
|
15.4 |
|
|
3.6 |
|
|
Income taxes payable |
|
|
23.0 |
|
|
18.4 |
|
|
Deferred revenue |
|
|
128.2 |
|
|
112.9 |
|
|
Other accrued liabilities |
|
|
180.3 |
|
|
197.5 |
|
|
|
|
$ |
521.7 |
|
$ |
491.2 |
|
Deferred revenue includes billings in excess of costs and estimated earnings of $36.8 and $34.2 at December 31, 2015 and 2014, respectively.
7.LONG-TERM DEBT
Long-term debt consists of the following:
|
|
|
December 31, |
|
December 31, |
|
||
|
|
|
2015 |
|
2014 |
|
||
|
Term loan facility |
|
$ |
2,064.0 |
|
$ |
2,200.0 |
|
|
Less unamortized original issue discount and debt issue costs |
|
|
29.9 |
|
|
35.3 |
|
|
Less current portion of long-term debt |
|
|
— |
|
|
17.4 |
|
|
|
|
$ |
2,034.1 |
|
$ |
2,147.3 |
|
In connection with the Spin-Off, the Company entered into a credit agreement dated as of December 16, 2014 (the “Credit Agreement”) governing its senior secured bank credit facilities, consisting of (a) a five-year, $600.0 revolving credit facility (the “Revolving Credit Facility”) and (b) a seven-year, $2,200.0 term loan facility (the “Term Loan Facility”). Borrowings under the Revolving Credit Facility bear interest at an annual rate equal to the London interbank offered rate (“LIBOR”) plus 200 basis points or prime (as defined therein) plus 100 basis points. There were no amounts outstanding under the Revolving Credit Facility as of December 31, 2015 and 2014. Borrowings under the Term Loan Facility bear interest at an annual rate equal to LIBOR plus 325 basis points (LIBOR shall not be less than 75 basis points per annum) or ABR (as defined therein) plus 225 basis points (4.0% at December 31, 2015). Long-term debt as of December 31, 2015 consisted of $2,064.0 outstanding under the Term Loan Facility, none of which was current. During 2015, the Company repaid $136.0 of its outstanding Term Loan Facility.
F-18
In connection with the Spin-Off in December 2014, the Company redeemed $1,300.0 of its 5.25% Notes due 2022 and $650.0 of its 6.875% Notes due 2020. The Company incurred a loss on debt extinguishment of $243.6 related to unamortized debt issue costs and fees and expenses related to the repurchase of its 5.25% and 6.875% Notes during December 2014.
Letters of credit outstanding under the Revolving Credit Facility aggregated $7.7 at December 31, 2015 ($7.7 at December 31, 2014).
The Revolving Credit Facility contains an interest coverage ratio financial covenant (as defined therein) that must be maintained at a level greater than 3.0 to 1 and a total leverage ratio covenant (as defined therein) which limits gross debt to a 5.25 to 1 multiple of EBITDA (as defined therein). The Credit Agreement is collateralized by substantially all of the Company’s assets and contains customary affirmative covenants, negative covenants and conditions precedent for borrowings, all of which were met as of December 31, 2015.
Maturities of long-term debt are as follows:
|
|
|
|
|
|
|
Year Ending December 31, |
|
|
|
|
|
2016 |
|
$ |
— |
|
|
2017 |
|
|
— |
|
|
2018 |
|
|
— |
|
|
2019 |
|
|
— |
|
|
2020 |
|
|
— |
|
|
Thereafter |
|
|
2,064.0 |
|
|
|
|
$ |
2,064.0 |
|
Interest expense amounted to $94.8, $130.6 and $123.4 for the years ended December 31, 2015, 2014 and 2013, respectively.
8.COMMITMENTS, CONTINGENCIES AND OFF-BALANCE-SHEET ARRANGEMENTS
Lease Commitments – The Company finances its use of certain facilities and equipment under committed lease arrangements provided by various institutions. Since the terms of these arrangements meet the accounting definition of operating lease arrangements, the aggregate sum of future minimum lease payments is not reflected on the consolidated balance sheets. At December 31, 2015, future minimum lease payments under these arrangements approximated $190.1, of which $161.5 is related to long-term real estate leases.
Rent expense for the years ended December 31, 2015, 2014 and 2013 was $32.4, $29.7 and $30.2, respectively. Future payments under operating leases with terms greater than one year as of December 31, 2015 are as follows:
|
|
|
|
|
|
|
Year Ending December 31, |
|
|
|
|
|
2016 |
|
$ |
27.6 |
|
|
2017 |
|
|
25.5 |
|
|
2018 |
|
|
23.4 |
|
|
2019 |
|
|
20.4 |
|
|
2020 |
|
|
18.7 |
|
|
Thereafter |
|
|
74.5 |
|
|
|
|
$ |
190.1 |
|
Litigation – The Company is a defendant in various legal actions arising in the normal course of business, the outcomes of which, in the opinion of management, neither individually nor in the aggregate are likely to result in a material adverse effect on the Company's consolidated financial statements.
F-19
Indemnities, Commitments and Guarantees – During its normal course of business, the Company has made certain indemnities, commitments and guarantees under which it may be required to make payments in relation to certain transactions. These indemnities include non-infringement of patents and intellectual property indemnities to the Company’s customers in connection with the design, manufacture, sale and delivery of its products, indemnities to various lessors in connection with facility leases for certain claims arising from such facility or lease, and indemnities to other parties to certain acquisition agreements. The duration of these indemnities, commitments and guarantees varies, and in certain cases is indefinite. Many of these indemnities, commitments and guarantees provide for limitations on the maximum potential future payments the Company could be obligated to make. However, the Company is unable to estimate the maximum amount of liability related to its indemnities, commitments and guarantees because such liabilities are contingent upon the occurrence of events that are not reasonably determinable. Management believes that any liability for these indemnities, commitments and guarantees would not be material to the accompanying consolidated financial statements. Accordingly, no significant amounts have been accrued for indemnities, commitments and guarantees.
Employment Agreements – The Company has employment and compensation agreements with two key officers of the Company. An agreement for one of the officers provides for the officer to earn a minimum of $0.9 per year, which may be adjusted annually as determined by the Company's Board of Directors or the Compensation Committee of the Board of Directors, for a three-year period from the effective date (as defined in such agreement), which is automatically extended for successive one-year period(s) thereafter, unless either party provides notice of non-renewal, as well as quarterly contributions to a tax-deferred compensation plan which in the aggregate, on an annual basis, would amount to a contribution equal to 100% of such officer's base salary in effect at the time.
One other agreement provides for an officer to receive annual minimum compensation of $1.0 per year, which may be adjusted annually as determined by the Company's Compensation Committee of the Board of Directors, for a three-year period ending from any date after which it is measured, and to receive monthly contributions to a tax-deferred compensation plan in an amount equal to 7.5% of the monthly amount of such officer’s base salary in effect at the time and, on January 1 of each year, a contribution to such plan in an amount equal to 20% of such officer’s base salary in effect at the time.
In addition, the Company has employment agreements with certain other key members of management expiring on various dates. The Company's employment agreements generally provide for certain protections in the event of a change of control. These protections generally include the payment of severance and related benefits under certain circumstances in the event of a change of control.
9.INCOME TAXES
The components of earnings from continuing operations before income taxes were:
|
|
|
|
|
|
|
|
|
|
|
|
|
|
|
Year Ended December 31, |
|
|||||||
|
|
|
2015 |
|
2014 |
|
2013 |
|
|||
|
Earnings (loss) from continuing operations before income taxes: |
|
|
|
|
|
|
|
|
|
|
|
United States |
|
$ |
92.1 |
|
$ |
(216.6) |
|
$ |
65.9 |
|
|
Foreign |
|
|
264.5 |
|
|
226.4 |
|
|
173.6 |
|
|
Earnings before income taxes |
|
$ |
356.6 |
|
$ |
9.8 |
|
$ |
239.5 |
|
F-20
Income tax expense (benefit) consists of the following:
|
|
|
|
|
|
|
|
|
|
|
|
|
|
|
Year Ended December 31, |
|
|||||||
|
|
|
2015 |
|
2014 |
|
2013 |
|
|||
|
Current: |
|
|
|
|
|
|
|
|
|
|
|
Federal |
|
$ |
27.0 |
|
$ |
(83.8) |
|
$ |
19.5 |
|
|
State |
|
|
3.3 |
|
|
— |
|
|
— |
|
|
Foreign |
|
|
44.7 |
|
|
39.4 |
|
|
30.4 |
|
|
|
|
$ |
75.0 |
|
$ |
(44.4) |
|
$ |
49.9 |
|
|
Deferred: |
|
|
|
|
|
|
|
|
|
|
|
Federal |
|
|
(5.2) |
|
|
(6.6) |
|
|
(6.1) |
|
|
State |
|
|
— |
|
|
1.6 |
|
|
(1.1) |
|
|
Foreign |
|
|
1.1 |
|
|
1.5 |
|
|
1.9 |
|
|
|
|
|
(4.1) |
|
|
(3.5) |
|
|
(5.3) |
|
|
Total income tax expense (benefit) |
|
$ |
70.9 |
|
$ |
(47.9) |
|
$ |
44.6 |
|
The difference between income tax (benefit) expense and the amount computed by applying the statutory U.S. federal income tax rate (35%) to the pre-tax earnings consists of the following:
|
|
|
|
|
|
|
|
|
|
|
|
|
|
|
Year Ended December 31, |
|
|||||||
|
|
|
2015 |
|
2014 |
|
2013 |
|
|||
|
Statutory federal income tax expense |
|
$ |
124.8 |
|
$ |
3.4 |
|
$ |
83.8 |
|
|
U.S. state income taxes |
|
|
3.2 |
|
|
(7.6) |
|
|
2.3 |
|
|
Foreign tax rate differential |
|
|
(48.5) |
|
|
(39.9) |
|
|
(30.6) |
|
|
Non-deductible charges/losses and other |
|
|
5.0 |
|
|
8.9 |
|
|
3.0 |
|
|
Research and development credit |
|
|
(13.6) |
|
|
(12.7) |
|
|
(13.9) |
|
|
|
|
$ |
70.9 |
|
$ |
(47.9) |
|
$ |
44.6 |
|
F-21
The tax effects of temporary differences and carryforwards that give rise to deferred income tax assets and liabilities consist of the following:
|
|
|
|
|
|
|
|
|
|
|
|
December 31, |
|
||||
|
|
|
2015 |
|
2014 |
|
||
|
Deferred tax assets: |
|
|
|
|
|
|
|
|
Inventory reserves |
|
$ |
11.0 |
|
$ |
11.4 |
|
|
Warranty reserves |
|
|
19.6 |
|
|
16.6 |
|
|
Accrued liabilities |
|
|
30.5 |
|
|
27.9 |
|
|
Net operating loss carryforward |
|
|
3.5 |
|
|
2.8 |
|
|
Research and development credit carryforward |
|
|
48.9 |
|
|
34.4 |
|
|
Alternative minimum tax credit carryforward |
|
|
5.0 |
|
|
5.0 |
|
|
Other |
|
|
6.8 |
|
|
3.8 |
|
|
|
|
$ |
125.3 |
|
$ |
101.9 |
|
|
|
|
|
|
|
|
|
|
|
Deferred tax liabilities: |
|
|
|
|
|
|
|
|
Book to tax revenue differences |
|
|
(11.9) |
|
|
(4.3) |
|
|
Intangible assets |
|
|
(171.1) |
|
|
(171.4) |
|
|
Depreciation |
|
|
(17.9) |
|
|
(14.9) |
|
|
Other |
|
|
— |
|
|
(8.7) |
|
|
Software development costs |
|
|
— |
|
|
(0.1) |
|
|
|
|
|
(200.9) |
|
|
(199.4) |
|
|
Deferred tax liability before valuation allowance |
|
|
(75.6) |
|
|
(97.5) |
|
|
Valuation allowance |
|
|
(17.1) |
|
|
(12.9) |
|
|
Net deferred tax liability |
|
$ |
(92.7) |
|
$ |
(110.4) |
|
The Company has included $23.9 and $82.6 of income tax receivables in other current assets in the consolidated balance sheets as of December 31, 2015 and 2014.
The Company maintained a valuation allowance of $17.1 and $12.9 as of December 31, 2015 and 2014, respectively, primarily related to state net operating losses and research credits.
As of December 31, 2015, the Company had state and foreign net operating loss carryforwards of approximately $31.8 and $4.9, respectively. The U.S. state net operating loss carryforwards begin to expire in 2016. As of December 31, 2015, the Company had federal and U.S. state research and development tax credit carryforwards of $48.9, which expire from 2016 to 2030.
The Company has not provided for any residual U.S. income taxes on the approximately $624.0 of earnings from its foreign subsidiaries because such earnings are intended to be indefinitely reinvested. It is not practicable to determine the amount of U.S. income and foreign withholding tax payable in the event all such foreign earnings are repatriated.
In 2015, the Company recognized tax deductions of $13.0 related to restricted share vestings. Pursuant to ASC 718, these deductions are not deemed realized until they reduce taxes payable. During 2015, the Company recorded a credit to additional paid-in capital of $5.0 as these deductions reduced our current year tax liability.
F-22
A reconciliation of the beginning and ending amounts of gross uncertain tax positions is presented below:
|
|
|
2015 |
|
2014 |
|
2013 |
|
|||
|
Balance, beginning of the period |
|
$ |
75.7 |
|
$ |
47.5 |
|
$ |
34.6 |
|
|
Additions for current year tax positions |
|
|
16.1 |
|
|
38.1 |
|
|
10.8 |
|
|
Additions for tax positions of prior years |
|
|
0.8 |
|
|
1.6 |
|
|
2.1 |
|
|
Settlements of tax positions |
|
|
(2.7) |
|
|
— |
|
|
— |
|
|
Impact of Spin-Off |
|
|
— |
|
|
(11.2) |
|
|
— |
|
|
Currency fluctuations |
|
|
(0.7) |
|
|
(0.3) |
|
|
— |
|
|
Balance, end of the period |
|
$ |
89.2 |
|
$ |
75.7 |
|
$ |
47.5 |
|
The difference between the gross uncertain tax position of $89.2 and the liability for unrecognized tax benefits of $89.0 is due to the netting of certain items when calculating the liability for unrecognized tax benefits and interest relating to our gross uncertain tax positions. This liability, if recognized, would affect the Company’s effective tax rate. It is reasonably possible that the amount of liability for unrecognized tax benefits will change in the next twelve months; however, the Company does not expect the change to have a material impact on the Company’s consolidated financial statements.
With minor exceptions, the Company is currently open to audit by the tax authorities for the nine tax years ending December 31, 2015. There are currently no material income tax audits in progress.
The Company classifies interest and penalties related to income tax as income tax expense. The increase in the Company’s liability for unrecognized tax benefits for interest was approximately $2.3 for the year ended December 31, 2015 and less than $2.0 for the year ended December 31, 2014.
10.EMPLOYEE RETIREMENT PLANS
The Company sponsors and contributes to a qualified, defined contribution savings and investment plan, covering substantially all U.S. employees. The B/E Aerospace, Inc. Savings Plan was established pursuant to Section 401(k) of the Internal Revenue Code. Under the terms of this plan, covered employees may contribute up to 100% of their pay, limited to certain statutory maximum contributions for 2015. Participants are vested in matching contributions immediately and the matching percentage is 100% of the first 3% of employee contributions and 50% on the next 2% of employee contributions. Total expense for the plan was $11.3, $13.3 and $11.3 for the years ended December 31, 2015, 2014 and 2013. In addition, the Company contributes to the B/E Aerospace, Inc. Hourly Tax-Sheltered Retirement Plan. This plan was established pursuant to Section 401(k) of the Internal Revenue Code and covers certain U.S. union employees. Total expense for the plan was $0.4, $0.4 and $0.3 for the years ended December 31, 2015, 2014 and 2013.
The Company sponsors and contributes to a supplemental executive retirement plan (“SERP”) for certain employees. This deferred compensation plan was established pursuant to Section 409A of the Internal Revenue Code. The SERP is an unfunded plan maintained for the purpose of providing deferred compensation for certain employees. This plan allows certain employees to annually elect to defer a portion of their compensation, on a pre-tax basis, until their retirement or a specified date. The benefit to be provided is based on the amount of compensation deferred. The Company makes cash matching contributions and earnings on deferrals. Compensation expense under this program was $2.1, $1.8 and $1.7 in 2015, 2014 and 2013, respectively.
The Company and its subsidiaries participate in government-sponsored programs in certain foreign countries. The Company funds these plans based on legal requirements, tax considerations, local practices and investment opportunities.
F-23
11.STOCKHOLDERS' EQUITY
Earnings Per Share - Basic net earnings per common share is computed using the weighted average of common shares outstanding during the year. Diluted net earnings per common share reflects the potential dilution from assumed conversion of all dilutive securities such as stock options and unvested restricted stock using the treasury stock method. When the effects of the outstanding stock options and unvested restricted stock are anti-dilutive, they are not included in the calculation of diluted earnings per common share. For the years ended December 31, 2015, 2014 and 2013, securities totaling approximately 0.6, 0.1, and 0.1 million shares, respectively, were excluded from the determination of diluted earnings per common share because the effect would have been anti-dilutive.
The following table sets forth the computation of basic and diluted net earnings per share for the years ended December 31, 2015, 2014 and 2013:
|
|
|
Year Ended December 31, |
|
|||||||
|
|
|
2015 |
|
2014 |
|
2013 |
|
|||
|
Numerator: Net earnings |
|
$ |
285.7 |
|
$ |
104.3 |
|
$ |
365.6 |
|
|
Denominator: |
|
|
|
|
|
|
|
|
|
|
|
Denominator for basic earnings per share - Weighted average shares (in millions) |
|
|
104.0 |
|
|
104.0 |
|
|
103.2 |
|
|
Effect of dilutive securities (in millions) |
|
|
0.5 |
|
|
0.5 |
|
|
0.7 |
|
|
Denominator for diluted earnings per share - Adjusted weighted average shares (in millions) |
|
|
104.5 |
|
|
104.5 |
|
|
103.9 |
|
|
Basic net earnings per share: |
|
|
|
|
|
|
|
|
|
|
|
Net earnings per share from continuing operations |
|
$ |
2.75 |
|
$ |
0.55 |
|
$ |
1.89 |
|
|
Net earnings per share from discontinued operations |
|
|
— |
|
|
0.45 |
|
|
1.65 |
|
|
Basic net earnings per share |
|
$ |
2.75 |
|
$ |
1.00 |
|
$ |
3.54 |
|
|
Diluted net earnings per share: |
|
|
|
|
|
|
|
|
|
|
|
Net earnings per share from continuing operations |
|
$ |
2.73 |
|
$ |
0.55 |
|
$ |
1.88 |
|
|
Net earnings per share from discontinued operations |
|
|
— |
|
|
0.45 |
|
|
1.64 |
|
|
Diluted net earnings per share |
|
$ |
2.73 |
|
$ |
1.00 |
|
$ |
3.52 |
|
Long-Term Incentive Plan - The Company has a Long-Term Incentive Plan under which the Company’s Compensation Committee may grant stock options, stock appreciation rights, restricted stock, restricted stock units or other forms of equity based or equity related awards.
During 2015, 2014 and 2013, the Company granted restricted stock to certain members of the Company’s Board of Directors and management. Restricted stock grants vest over periods ranging from three to four years and are granted at the discretion of the Compensation Committee of the Board of Directors. Certain awards also vest upon attainment of performance goals. Compensation cost is recorded on a straight-line basis over the vesting term of the shares based on the grant date value using the closing trading price. Share based compensation of $28.7, $28.1 and $23.0 was recorded during 2015, 2014, and 2013, respectively. Unrecognized compensation cost related to these grants was $71.1, $59.9, and $53.6 at December 31, 2015, 2014, and 2013, respectively.
F-24
The following table summarizes shares of restricted stock awards that were granted, vested, forfeited and outstanding:
|
|
|
|
|
|
|
|
|
|
|
|
|
|
|
|
|
||||||||||||||||
|
|
|
December 31, 2015 |
|
December 31, 2014 |
|
||||||||||||||||||||||||||
|
|
|
|
|
|
|
|
Weighted |
|
|
|
|
|
|
Weighted |
|
||||||||||||||||
|
|
|
|
|
Weighted |
|
Average |
|
|
|
Weighted |
|
Average |
|
||||||||||||||||||
|
|
|
|
|
Average |
|
Remaining |
|
|
|
Average |
|
Remaining |
|
||||||||||||||||||
|
|
|
Shares |
|
Grant Date |
|
Vesting Period |
|
Shares |
|
Grant Date |
|
Vesting Period |
|
||||||||||||||||||
|
|
|
(in thousands) |
|
Fair Value |
|
(in years) |
|
(in thousands) |
|
Fair Value |
|
(in years) |
|
||||||||||||||||||
|
|
|
|
|
|
|
|
|
|
|
|
|
|
|
|
|
||||||||||||||||
|
Outstanding, beginning of period |
|
1,545 |
|
$ |
49.03 |
|
2.65 |
|
1,248 |
|
$ |
52.67 |
|
2.37 |
|
||||||||||||||||
|
Shares granted |
|
727 |
|
|
51.45 |
|
— |
|
642 |
|
|
77.91 |
|
— |
|
||||||||||||||||
|
Shares vested |
|
(587) |
|
|
44.07 |
|
— |
|
(538) |
|
|
46.46 |
|
— |
|
||||||||||||||||
|
Shares forfeited |
|
(163) |
|
|
51.14 |
|
— |
|
(96) |
|
|
50.76 |
|
— |
|
||||||||||||||||
|
Spin-Off make-whole grants |
|
— |
|
|
— |
|
— |
|
444 |
|
|
— |
|
— |
|
||||||||||||||||
|
Spin-Off cancellations |
|
— |
|
|
— |
|
— |
|
(155) |
|
|
67.42 |
|
— |
|
||||||||||||||||
|
Outstanding, end of period |
|
1,522 |
|
|
51.97 |
|
2.74 |
|
1,545 |
|
|
49.03 |
|
2.65 |
|
||||||||||||||||
During the years ended December 31, 2015, 2014 and 2013, the Company granted 7,146, 16,148 and 12,081 units of deferred restricted stock pursuant to the Deferred Compensation Plan. During the year ended December 31, 2015, 2,444 deferred restricted stock units were forfeited. As of December 31, 2015, the weighted average remaining vesting period for the 14,544 outstanding deferred restricted stock units was 2.51 years.
During the year ended December 31, 2015, the Company granted 243,840 units of time and performance based restricted stock. During the year ended December 31, 2015, no restricted stock units were forfeited. As of December 31, 2015, the weighted average remaining vesting period for the 245,440 outstanding restricted stock units was 3.10 years.
No stock options were granted during the three years ended December 31, 2015 and no related stock compensation was recognized as all options were fully vested as of December 31, 2006. Outstanding stock options at December 31, 2015, 2014 and 2013 totaled approximately 0, 0 and 31,500, all of which were exercisable. During the years ended December 31, 2015, 2014 and 2013, 0, 29,750 and 19,525 stock options were exercised with an aggregate intrinsic value of $0, $2.0 and $1.1, respectively, determined as of the date of option exercise.
12.EMPLOYEE STOCK PURCHASE PLAN
The Company has established a qualified Employee Stock Purchase Plan, the terms of which allow for qualified employees (as defined in the plan) to participate in the purchase of designated shares of the Company's common stock at a price equal to 85% of the closing price on the last business day of each semi-annual stock purchase period. The Company issued approximately 141,000, 98,000 and 101,000 shares of common stock during the years ended December 31, 2015, 2014 and 2013, respectively, pursuant to this plan at a weighted average price per share of $41.03, $72.51 and $61.96, respectively. Shares issued during 2014 were purchased prior to the Spin-Off.
13.SEGMENT REPORTING
The Company is organized based on the products and services it offers. The Company’s reportable segments, which are also its operating segments, are comprised of commercial aircraft and business jet. Each segment regularly reports its results of operations and makes requests for capital expenditures and acquisition funding to the Company’s chief operational decision-making group (“CODM”). This group is
F-25
comprised of the Executive Chairman of the Board of Directors, the President and Chief Executive Officer and the Vice President and Chief Financial Officer. Each operating segment has separate management teams and infrastructures dedicated to providing a full range of products and services to their commercial, business jet, military, maintenance, aircraft leasing and aircraft manufacturing customers. The Company has not included product line information due to the similarity of commercial aircraft segment product offerings.
The following table presents revenues and other financial information by business segment:
|
|
|
Year Ended December 31, 2015 |
|
|||||||
|
|
|
Commercial |
|
Business |
|
|
|
|
||
|
|
|
Aircraft |
|
Jet |
|
Consolidated |
|
|||
|
Revenues |
|
$ |
2,098.3 |
|
$ |
631.3 |
|
$ |
2,729.6 |
|
|
Operating earnings(1) |
367.5 | 84.8 | 452.3 | |||||||
|
Total assets(2) |
2,120.5 | 1,020.4 | 3,140.9 | |||||||
|
Goodwill |
|
|
372.6 |
|
|
440.6 |
|
|
813.2 |
|
|
Capital expenditures(3) |
61.7 | 18.8 | 80.5 | |||||||
|
Depreciation and amortization(3) |
63.1 | 22.2 | 85.3 | |||||||
|
|
|
Year Ended December 31, 2014 |
|||||||
|
|
|
Commercial |
|
Business |
|
|
|
||
|
|
|
Aircraft |
|
Jet |
|
Consolidated |
|||
|
Revenues |
|
$ |
2,058.9 |
|
$ |
540.1 |
|
$ |
2,599.0 |
|
Operating earnings excluding KLX corporate allocations (1) |
356.3 | 50.0 | 406.3 | ||||||
|
KLX corporate allocations |
|
|
|
|
|
|
|
|
(22.3) |
|
Operating earnings |
|
|
|
|
|
|
|
|
384.0 |
|
Total assets(2) |
2,129.5 | 1,043.6 | 3,173.1 | ||||||
|
Goodwill |
|
|
379.8 |
|
|
460.6 |
|
|
840.4 |
|
Capital expenditures(3) |
|||||||||
|
Continuing operations |
|
|
102.8 |
|
|
28.8 |
|
|
131.6 |
|
Discontinued operations |
|
|
|
|
|
|
|
|
124.0 |
|
Total capital expenditures |
|
|
|
|
|
|
|
|
255.6 |
|
Depreciation and amortization(3) |
|
|
|
|
|
|
|
|
|
|
Continuing operations |
|
|
63.4 |
|
|
17.4 |
|
|
80.8 |
|
Discontinued operations |
|
|
|
|
|
|
|
|
61.5 |
|
Total depreciation and amortization |
|
|
|
|
|
|
|
|
142.3 |
F-26
|
|
|
Year Ended December 31, 2013 |
|||||||
|
|
|
Commercial |
|
Business |
|
|
|
||
|
|
|
Aircraft |
|
Jet |
|
Consolidated |
|||
|
Revenues |
|
$ |
1,784.7 |
|
$ |
418.6 |
|
$ |
2,203.3 |
|
Operating earnings excluding KLX corporate allocations (1) |
320.3 | 69.0 | 389.3 | ||||||
|
KLX corporate allocations |
|
|
|
|
|
|
|
|
(26.4) |
|
Operating earnings |
|
|
|
|
|
|
|
|
362.9 |
|
Total assets(2) |
1,977.3 | 458.2 | 2,435.5 | ||||||
|
Goodwill |
|
|
394.6 |
|
|
89.9 |
|
|
484.5 |
|
Capital expenditures(3) |
|||||||||
|
Continuing operations |
|
|
96.5 |
|
|
17.8 |
|
|
114.3 |
|
Discontinued operations |
|
|
|
|
|
|
|
|
40.6 |
|
Total capital expenditures |
|
|
|
|
|
|
|
|
154.9 |
|
Depreciation and amortization(3) |
|
|
|
|
|
|
|
|
|
|
Continuing operations |
|
|
50.4 |
|
|
9.4 |
|
|
59.8 |
|
Discontinued operations |
|
|
|
|
|
|
|
|
29.8 |
|
Total depreciation and amortization |
|
|
|
|
|
|
|
|
89.6 |
|
(1) |
Operating earnings includes an allocation of corporate IT costs, employee benefits and general and administrative costs based on the proportion of each segment’s systems users, number of employees and sales, respectively. |
|
(2) |
Corporate assets (including cash and cash equivalents) of $322.2, $324.9 and $674.5 at December 31, 2015, 2014 and 2013, respectively, have been allocated to the above segments in a manner consistent with our corporate expense allocations. |
|
(3) |
Corporate capital expenditures and depreciation and amortization have been allocated to the above segments in a manner consistent with our corporate expense allocations. |
Geographic Information
The Company operates principally in three geographic areas, the United States, Europe (primarily the United Kingdom) and emerging markets, such as Asia, Pacific Rim, and the Middle East. There were no significant transfers among geographic areas during these periods. Revenues from the United Kingdom were $749.5 and $734.7 and assets from the Philippines were $527.6 and $350.7 as of December 31, 2015 and 2014, respectively.
F-27
The following table presents revenues and operating earnings based on the originating location for the years ended December 31, 2015, 2014 and 2013. Additionally, it presents all identifiable assets related to the operations in each geographic area as of December 31, 2015 and 2014:
|
|
|
|
|
|
|
|
|
|
|
|
|
|
|
Year Ended December 31, |
|
|||||||
|
|
|
2015 |
|
2014 |
|
2013 |
|
|||
|
Revenues: |
|
|
|
|
|
|
|
|
|
|
|
Domestic |
|
$ |
1,619.3 |
|
$ |
1,552.8 |
|
$ |
1,315.2 |
|
|
Foreign |
|
|
1,110.3 |
|
|
1,046.2 |
|
|
888.1 |
|
|
|
|
$ |
2,729.6 |
|
$ |
2,599.0 |
|
$ |
2,203.3 |
|
|
|
|
|
|
|
|
|
|
|
|
|
|
Operating earnings: |
|
|
|
|
|
|
|
|
|
|
|
Domestic |
|
$ |
177.6 |
|
$ |
147.2 |
|
$ |
169.0 |
|
|
Foreign |
|
|
274.7 |
|
|
236.8 |
|
|
193.9 |
|
|
|
|
$ |
452.3 |
|
$ |
384.0 |
|
$ |
362.9 |
|
|
|
|
|
|
|
|
|
|
|
|
|
|
|
|
December 31, |
|
|
|
|
||||
|
|
|
2015 |
|
2014 |
|
|
|
|
||
|
Identifiable assets: |
|
|
|
|
|
|
|
|
|
|
|
Domestic |
|
$ |
1,781.8 |
|
$ |
1,955.9 |
|
|
|
|
|
Foreign |
|
|
1,359.1 |
|
|
1,217.2 |
|
|
|
|
|
|
|
$ |
3,140.9 |
|
$ |
3,173.1 |
|
|
|
|
Revenues by geographic area, based on destination, for the years ended December 31, 2015, 2014, and 2013 were as follows:
|
|
|
Year Ended December 31, |
|
|||||||||||||
|
|
|
2015 |
|
2014 |
|
2013 |
|
|||||||||
|
|
|
|
|
|
% of |
|
|
|
|
% of |
|
|
|
|
% of |
|
|
|
|
Revenues |
|
Revenues |
|
Revenues |
|
Revenues |
|
Revenues |
|
Revenues |
|
|||
|
U.S. |
|
$ |
966.3 |
|
35.4 |
% |
$ |
859.1 |
|
33.1 |
% |
$ |
788.3 |
|
35.8 |
% |
|
Europe |
|
|
663.5 |
|
24.3 |
% |
|
684.6 |
|
26.3 |
% |
|
549.3 |
|
24.9 |
% |
|
Asia, Pacific Rim, Middle East and other |
|
|
1,099.8 |
|
40.3 |
% |
|
1,055.3 |
|
40.6 |
% |
|
865.7 |
|
39.3 |
% |
|
|
|
$ |
2,729.6 |
|
100.0 |
% |
$ |
2,599.0 |
|
100.0 |
% |
$ |
2,203.3 |
|
100.0 |
% |
Export revenues from the United States to customers in foreign countries amounted to $880.8, $863.4 and $713.6 in the years ended December 31, 2015, 2014 and 2013, respectively. Revenues from transactions with other operating segments were $24.4, $24.5, and $18.1 for the years ended December 31, 2015, 2014, and 2013, respectively.
14.FAIR VALUE INFORMATION
All financial instruments are carried at amounts that approximate estimated fair value. The fair value is the price at which an asset could be exchanged in a current transaction between knowledgeable, willing parties. Assets measured at fair value are categorized based upon the lowest level of significant input to the valuations.
Level 1 – quoted prices in active markets for identical assets and liabilities.
Level 2 – quoted prices for identical assets and liabilities in markets that are not active, or observable inputs other than quoted prices in active markets for identical assets and liabilities.
F-28
Level 3 – unobservable inputs in which there is little or no market data available, which require the reporting entity to develop its own assumptions.
The carrying amounts of cash and cash equivalents (which the Company classifies as Level 1 assets), accounts receivable-trade, and accounts payable represent their respective fair values due to their short-term nature. There was no debt outstanding under the Revolving Credit Facility as of December 31, 2015 or December 31, 2014. The carrying value of the Term Loan Facility approximates fair value based upon observable market data (which the Company classifies as Level 2).
The fair value information presented herein is based on pertinent information available to management at December 31, 2015 and 2014, respectively. Although management is not aware of any factors that would significantly affect the estimated fair value amounts, such amounts have not been comprehensively revalued for purposes of these consolidated financial statements since those dates, and current estimates of fair value may differ significantly from the amounts presented herein.
15. RESTRUCTURING AND OTHER CHARGES
During 2015, the Company recognized charges totaling $49.0 in connection with its cost reduction program. The charges reflect costs associated with facilities consolidation, product rationalization, workforce reductions and program discontinuance. The charges are included in the amounts and descriptions below, as appropriate. The Company expects the cost reduction initiatives to offset inflationary pressures on wages, occupancy and infrastructure costs. The majority of the activities related to the cost reduction program are expected to be completed by the third quarter of 2016 and future charges are not expected to be material.
The following table presents the liability balance and activity related to restructuring and other charges:
|
|
|
|
|
|
|
|
|
|
|
|
|
|
|
|
|
|
|
Disposals |
|
|
|
|
|
|
|
|
|
|
|
|
and Other |
|
|
|
|
|
Balance at |
|
|
|
Original Accrual |
|
|
Non-cash Charges |
|
|
Cash Paid |
|
|
December 31, 2015 |
|
Facility Consolidations |
$ |
30.2 |
|
$ |
(15.7) |
|
$ |
(5.3) |
|
$ |
9.2 |
|
Employee Severance |
|
6.9 |
|
|
(0.6) |
|
|
(4.1) |
|
|
2.2 |
|
Program Discontinuance and other |
|
11.9 |
|
|
(11.9) |
|
|
- |
|
|
- |
|
|
$ |
49.0 |
|
$ |
(28.2) |
|
$ |
(9.4) |
|
$ |
11.4 |
The following table presents the pretax distribution of total restructuring and other charges by classification in the consolidated statement of earnings and comprehensive income for the year ended December 31, 2015:
|
Cost of Sales |
$ |
15.3 |
|
Selling, general and administrative |
|
28.8 |
|
Research, development and engineering |
|
4.9 |
|
|
$ |
49.0 |
The following table presents the pretax impact of total restructuring and other charges(1) by segment for the year ended December 31, 2015:
|
Commercial aircraft |
$ |
29.3 |
|
Business jet |
|
19.7 |
|
|
$ |
49.0 |
|
(1) |
Corporate cost reduction and other charges have been allocated to the above segments in a manner consistent with our corporate expense allocations. |
F-29
16. SELECTED QUARTERLY DATA (Unaudited)
Selected unaudited financial data for each quarter of the last two fiscal years is presented in the tables below and has been recast for 2014 to reflect the Spin-Off for all periods presented as discontinued operations.
|
|
|
Year Ended December 31, 2015 |
|
||||||||||
|
|
|
First |
|
Second |
|
Third |
|
Fourth |
|
||||
|
|
|
Quarter |
|
Quarter |
|
Quarter |
|
Quarter |
|
||||
|
|
|
|
|
|
|
|
|
|
|
|
|
|
|
|
Revenues(1) |
|
$ |
690.0 |
|
$ |
700.6 |
|
$ |
679.8 |
|
$ |
659.2 |
|
|
Cost of sales |
|
|
401.6 |
|
|
420.1 |
|
|
424.4 |
|
|
396.4 |
|
|
Gross profit |
|
|
288.4 |
|
|
280.5 |
|
|
255.4 |
|
|
262.8 |
|
|
Net earnings |
|
|
77.6 |
|
|
78.9 |
|
|
45.8 |
|
|
83.4 |
|
|
Basic net earnings per share(3) |
|
|
0.74 |
|
|
0.76 |
|
|
0.44 |
|
|
0.81 |
|
|
Diluted net earnings per share(3) |
|
|
0.74 |
|
|
0.75 |
|
|
0.44 |
|
|
0.81 |
|
|
|
|
Year Ended December 31, 2014 |
|
||||||||||
|
|
|
First |
|
Second |
|
Third |
|
Fourth |
|
||||
|
|
|
Quarter |
|
Quarter |
|
Quarter |
|
Quarter |
|
||||
|
Continuing Operations: |
|
|
|
|
|
|
|
|
|
|
|
|
|
|
Revenues(1) |
|
$ |
644.7 |
|
$ |
662.7 |
|
$ |
653.8 |
|
$ |
637.8 |
|
|
Cost of sales |
|
|
382.4 |
|
|
386.9 |
|
|
424.5 |
|
|
389.0 |
|
|
Gross profit |
|
|
262.3 |
|
|
275.8 |
|
|
229.3 |
|
|
248.8 |
|
|
Net earnings (loss)(2) |
|
|
109.0 |
|
|
108.6 |
|
|
102.2 |
|
|
(215.5) |
|
|
Basic net earnings (loss) per share(3) |
|
|
1.05 |
|
|
1.05 |
|
|
0.98 |
|
|
(2.07) |
|
|
Diluted net earnings (loss) per share(3) |
|
|
1.05 |
|
|
1.04 |
|
|
0.98 |
|
|
(2.07) |
|
|
(1) |
Revenues relate to B/E Aerospace, Inc. |
|
(2) |
Fourth quarter 2014 net loss reflects debt prepayment costs of $243.6. |
|
(3) |
Net earnings per share are computed individually for each quarter presented. Therefore, the sum of the quarterly net earnings per share may not necessarily equal the total for the year. |
F-30
SCHEDULE II ‑ VALUATION AND QUALIFYING ACCOUNTS
FOR THE YEARS ENDED DECEMBER 31, 2015, 2014 AND 2013
(In millions)
|
|
|
|
|
|
|
|
|
|
|
|
|
|
|
|
|
|
|
|
Balance |
|
|
|
|
|
|
|
|
|
|
|
|
|
|
|
|
At |
|
|
|
|
|
|
|
|
|
Balance |
|
||
|
|
|
Beginning |
|
|
|
|
|
|
Write- |
|
At End |
|
|||
|
|
|
Of |
|
|
|
|
|
|
Offs/ |
|
Of |
|
|||
|
|
|
Period |
|
Expenses |
|
Other |
(1) |
Disposals |
|
Period |
|
||||
|
Deducted From Assets: |
|
|
|
|
|
|
|
|
|
|
|
|
|
|
|
|
Allowance for doubtful accounts: |
|
|
|
|
|
|
|
|
|
|
|
|
|
|
|
|
Year Ended December 31, 2015 |
|
$ |
5.4 |
|
$ |
7.2 |
$ |
(0.1) |
|
$ |
(6.2) |
|
$ |
6.3 |
|
|
Year Ended December 31, 2014 |
|
|
10.4 |
|
|
9.6 |
|
(13.0) |
|
|
(1.6) |
|
|
5.4 |
|
|
Year Ended December 31, 2013 |
|
|
12.1 |
|
|
1.3 |
|
0.4 |
|
|
(3.4) |
|
|
10.4 |
|
|
|
|
|
|
|
|
|
|
|
|
|
|
|
|
|
|
|
Reserve for obsolete inventories: |
|
|
|
|
|
|
|
|
|
|
|
|
|
|
|
|
Year Ended December 31, 2015 |
|
$ |
50.8 |
|
$ |
18.1 |
$ |
— |
|
$ |
(19.3) |
|
$ |
49.6 |
|
|
Year Ended December 31, 2014 |
|
|
64.4 |
|
|
25.1 |
|
(30.3) |
|
|
(8.4) |
|
|
50.8 |
|
|
Year Ended December 31, 2013 |
|
|
63.5 |
|
|
11.2 |
|
— |
|
|
(10.3) |
|
|
64.4 |
|
|
|
|
|
|
|
|
|
|
|
|
|
|
|
|
|
|
|
Deferred tax asset valuation allowance: |
|
|
|
|
|
|
|
|
|
|
|
|
|
|
|
|
Year Ended December 31, 2015 |
|
$ |
12.9 |
|
$ |
— |
$ |
4.2 |
|
$ |
— |
|
$ |
17.1 |
|
|
Year Ended December 31, 2014 |
|
|
31.1 |
|
|
— |
|
(18.2) |
|
|
— |
|
|
12.9 |
|
|
Year Ended December 31, 2013 |
|
|
26.5 |
|
|
— |
|
4.6 |
|
|
— |
|
|
31.1 |
|
|
(1) |
Primarily related to the Spin-Off of KLX and acquisitions. |
F-31