Attached files
| file | filename |
|---|---|
| 8-K - 8-K - Thompson Creek Metals Co Inc. | a8-kfy2015.htm |
| EX-99.1 - PRESS RELEASE - Thompson Creek Metals Co Inc. | pressrelease2015q4.htm |

2015 Financial Results Investor Conference Call February 25, 2016 TSX: TCM OTCQX: TCPTF

2 Webcast Information Webcast: This Webcast can be accessed on the Thompson Creek Metals Company website under the Events Section: www.thompsoncreekmetals.com Q&A Instructions: If you would like to ask a question, please press star 1 on your telephone keypad. If you’re using a speakerphone, please make sure your mute function is turned off to allow your signal to reach the operator.

3 Cautionary Statement Certain statements in this presentation, other than purely historical information are "forward-looking statements" within the meaning of the Private Securities Litigation Reform Act of 1995, Section 27A of the Securities Act of 1933 and Section 21E of the Securities Exchange Act of 1934, and applicable Canadian securities legislation and are intended to be covered by the safe harbor provided by these regulations. These forward-looking statements can, in some cases, be identified by the use of such terms as "believe," "project," "expect," "anticipate," "estimate," "intend," "strategy," "future," "opportunity," "plan," "may," "should," "will," "would," "will be," "will continue," "will likely result," and similar expressions. Our forward-looking statements may include, without limitation, statements with respect to: future financial or operating performance of the Company or its subsidiaries and its projects; future liquidity; access to existing or future financing arrangements and ability to refinance or reduce debt on favorable terms or at all; future inventory, production, sales, payments from customers, cash costs, capital expenditures and exploration expenditures; future earnings and operating results; expected mining and concentrate grades and recoveries; estimates of mineral reserves and resources, including estimated mine life and annual production; expectations regarding the optimization of Mount Milligan Mine and construction of a permanent secondary crusher, including the effects of secondary crushing; future concentrate shipment dates and shipment sizes; future operating plans and goals, including expected financial and operating results of the molybdenum business; expected impact of an internal corporate restructuring on utilization of tax attributes; expected costs, including any severance costs; personnel decisions, including reductions in work force; future copper, gold, and molybdenum prices; and future foreign exchange rates.

4 Overview Jacques Perron President and Chief Executive Officer

5 Improving Safety Performance Company All Incident Recordable Rate (AIRR)1 1 Includes Lost Time and Reportable Incidents. 5.03 2.60 2.25 1.40 2.48 2.46 0.67 0.00 1.00 2.00 3.00 4.00 5.00 6.00 7.00 2009 2010 2011 2012 2013 2014 2015 Thompson Creek Metals Company U.S. Metals Manufacturing AIRR Average Surface Metals Mining U.S. AIRR Average Mining Association British Columbia AIRR Average

6 2015 Company Achievements Significantly improved safety performance Ended year with strong cash position of ≈ $177 million Achieved production and cash cost guidance Generated revenue of ≈ $494 million Copper sales ≈ $151 million Gold sales ≈ $210 million Molybdenum sales ≈ $104 million Tolling, calcining and other ≈ $29 million Transformed molybdenum business with the expectation of generating sufficient revenue to substantially cover care and maintenance costs and to maintain the future option value of molybdenum assets

7 2015 Mount Milligan Achievements Payable production Copper ≈ 71 million pounds; Gold ≈ 218,000 ounces Achieved unit cash cost of $0.55 1 per pound of copper produced on a by-product basis net of gold credits Completed 15 copper and gold concentrate shipments Continued optimizing the operation Improved fragmentation in the mine Enhanced coarse ore stockpile management practices during winter months Operated temporary secondary crushing plant Completed planned modifications, including the installation of the second SAG discharge screen deck and various modifications to the both the rougher/scavenger and cleaner floatation circuits Achieved average daily mill throughput of 61,212 tonnes during last week of Dec Foreign exchange rate favorably impacted Mount Milligan operating costs 2015 US$1.00 = C$1.28 Favorable impact of ≈ $25 million 1 Please refer to Appendix for non-GAAP reconciliation.

8 Financial Review Pam Saxton Executive Vice President and Chief Financial Officer
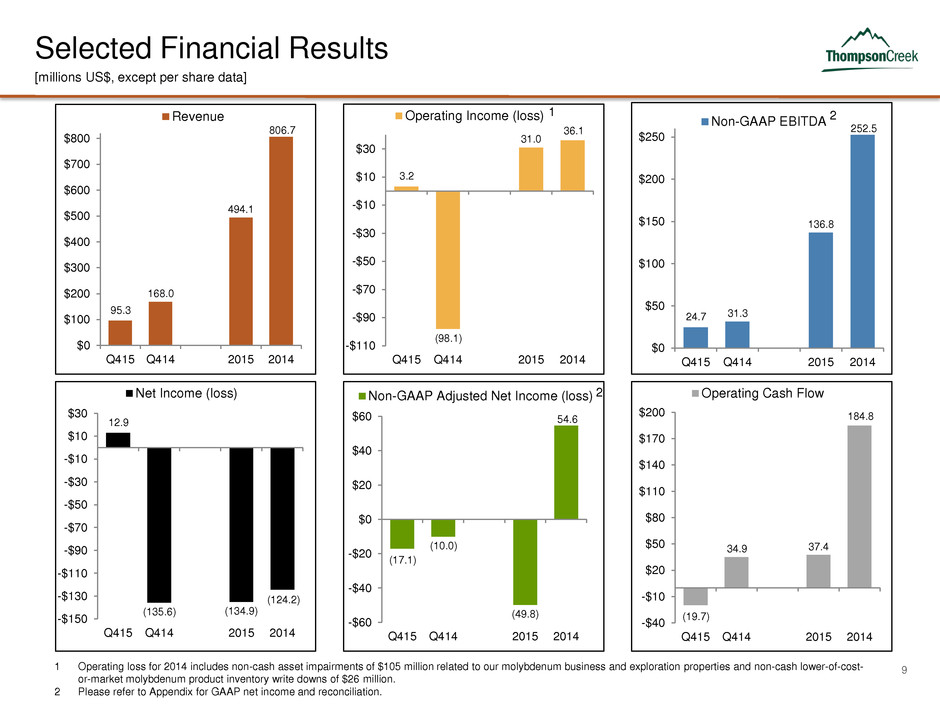
9 Selected Financial Results 24.7 31.3 136.8 252.5 $0 $50 $100 $150 $200 $250 Q415 Q414 2015 2014 Non-GAAP EBITDA 95.3 168.0 494.1 806.7 $0 $100 $200 $300 $400 $500 $600 $700 $800 Q415 Q414 2015 2014 Revenue [millions US$, except per share data] 1 Operating loss for 2014 includes non-cash asset impairments of $105 million related to our molybdenum business and exploration properties and non-cash lower-of-cost- or-market molybdenum product inventory write downs of $26 million. 2 Please refer to Appendix for GAAP net income and reconciliation. 3.2 (98.1) 31.0 36.1 -$110 -$90 -$70 -$50 -$30 -$10 $10 $30 Q415 Q414 2015 2014 Operating Income (loss) (19.7) 34.9 37.4 184.8 -$40 -$10 $20 $50 $80 $110 $140 $170 $200 Q415 Q414 2015 2014 Operating Cash Flow (17.1) (10.0) (49.8) 54.6 -$60 -$40 -$20 $0 $20 $40 $60 Q415 Q414 2015 2014 Non-GAAP Adjusted Net Income (loss) 12.9 (135.6) (134.9) (124.2) -$150 -$130 -$110 -$90 -$70 -$50 -$30 -$10 $10 $30 Q415 Q414 2015 2014 Net Income (loss) 2 2 1

10 Years Ended December 31, 2015 2014 Cash Flow from Operations 37.4 184.8 Cash (Used) in Investing Activities (55.7) (93.9) Cash (Used) in Financing Activities (68.9) (55.8) Effect of Exchange Rate Changes on Cash (1.6) (3.4) Increase (Decrease) in Cash and Cash Equivalents (88.8) 31.7 Cash and Cash Equivalents, beginning of period 265.6 233.9 Cash and Cash Equivalents, end of period 176.8 265.6 Summary of Statement of Cash Flows [US$ in millions]

11 Engaged advisors to assist the Board in evaluating strategic and financial alternatives available to the Company, including debt financing and restructuring, new capital transactions and asset sales Goal is to have solution in place in advance of debt maturity dates Since completion of Mount Milligan Mine, reduced debt by $134 million, or ≈13% (including net repayments of the Company’s capital leases) Reduced Debt by $134 Million over 10 Quarters $1,019 $1,013 $1,004 $984 $977 $945 $939 $898 $892 $885 $800 $850 $900 $950 $1,000 $1,050 Q313 Q413 Q114 Q214 Q314 Q414 Q115 Q215 Q315 Q415 (US$ in millions)

12 2016 Production and Cash Cost Guidance Year Ending December 31, 2016 (Estimate) Mount Milligan Mine Copper and Gold 1 Concentrate production (000’s dry tonnes) 125 – 135 Copper payable production (millions lb) 55 – 65 Gold payable production (000’s oz) 240 – 270 Unit cash cost – By-product (US$/payable lb copper production) 2 $0.25 – $0.70 Cash Capital Expenditures (US$ in millions, plus or minus 10%) Mount Milligan operations $5 Mount Milligan tailings dam $20 Mount Milligan permanent secondary crushing circuit 3 $47 Total Capital Expenditures $72 1 Estimates for cash costs and capital expenditures assume an average foreign exchange rate of US$1.00 = C$1.35 for 2016. Average daily mill throughput for 2016 is estimated to be 55,000 to 60,000 tonnes per day. 2 Assumes gold by-product credits at a weighted average gold price of $750/oz, which takes into account the $435/oz under the streaming arrangement with Royal Gold (“Gold Stream Arrangement”). 3 Excludes $6.2 million in accruals as of December 31, 2015 that will be paid in 2016. The guidance we issued on January 14, 2016 showed a capital expenditure estimate for the permanent secondary crusher of $27 million. We noted that if we decided to move forward with the construction of the permanent secondary crusher in 2016, the estimate would increase by approximately $20 million. Now that we have made the decision to move forward with construction in 2016, we have increased the estimated capital expenditure by the $20 million (plus or minus 10%) expected to be incurred in connection with the construction and commissioning of the permanent secondary crusher.

13 Hedging1 Quantity Sell Price Maturities Through Forward Gold Sales (oz) 11,500 $1,130 – 1,193 Jan 2016 – Jun 2016 Quantity Put Price Call Price Maturities Through Gold Collars (oz) 28,100 $1,050- $1,125 $1,164 - $1,278 Jan 2016 – Dec 2016 1 Information is as of December 31, 2015.
14 Significant Positive Impact on Mount Milligan Margins from US$/C$ Foreign Exchange Rate Current US$/C$ exchange rate continues to have positive impact on Mount Milligan operating costs Approximately 90% of costs are in C$ The US$ to C$ average exchange rate in 2015 was US$1.00 = C$1.28. This exchange rate had a positive impact on Mount Milligan operating costs for the twelve months of 2015 of approximately $25 million, or a positive unit cost impact of $0.35 per pound of copper, compared to applying the average US$ to C$ exchange rate for the twelve months of 2014 of US$1.00 = C$1.10 The weakening Canadian dollar supports margins and somewhat mitigates the effects of copper and gold pricing volatility

15 Recent Gold and Copper Prices Correlation with CAD/USD

16 Sales Summary and Market Commentary Mark Wilson Executive Vice President and Chief Commercial Officer

17 Copper (Cu) and Gold (Au) Sales Q415 vs Q414 1 Please refer to Appendix for non-GAAP reconciliation. Cu Sales (millions lbs) Average Realized Sales Price1 (US$/lb) Au Sales (000’s oz) Average Realized Sales Price1 (US$/oz) Cu Revenue (millions US$) Au Revenue (millions US$) $1.92 $2.75 Q415 Q414 Three Months Ended December 31 Three Months Ended December 31 16.1 15.5 $26.1 $38.1 Q415 Q414 Q415 Q414 51.8 38.9 $48.0 $38.8 Q415 Q414 Q415 Q414 $932 $1,003 Q415 Q414

18 Copper (Cu) and Gold (Au) Sales 2015 vs 2014 1 Please refer to Appendix for non-GAAP reconciliation. Cu Sales (millions lbs) Average Realized Sales Price1 (US$/lb) Au Sales (000’s oz) Average Realized Sales Price1 (US$/oz) $950 $1,002 2015 2014 Cu Revenue (millions US$) Au Revenue (millions US$) Year Ended December 31 Year Ended December 31 221.9 172.7 $209.8 $172.3 2015 2014 2015 2014 76.5 64.7 $151.1 $178.4 2015 2014 2015 2014 $2.28 $3.02 2015 2014
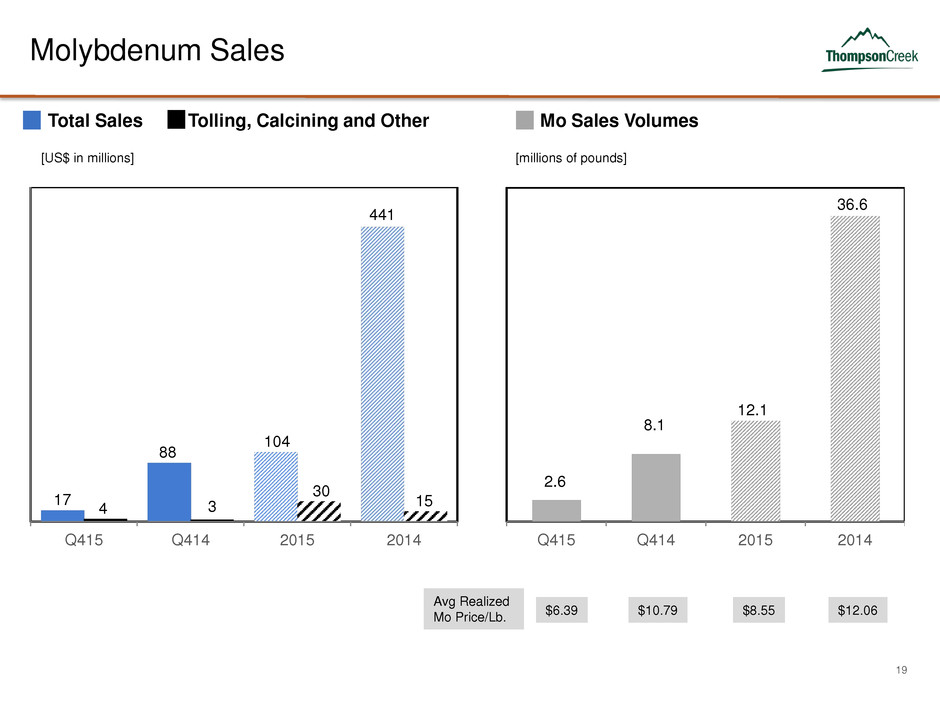
19 Molybdenum Sales Total Sales Tolling, Calcining and Other 17 88 104 441 4 3 30 15 Q415 Q414 2015 2014 2.6 8.1 12.1 36.6 Q415 Q414 2015 2014 Avg Realized Mo Price/Lb. $8.55 $12.06 Mo Sales Volumes [US$ in millions] [millions of pounds] $6.39 $10.79
20 Molybdenum Business Strategy Langeloth Metallurgical Facility Provides tolling services converting molybdenum concentrates to molybdenum oxide powder or briquettes, and to ferromolybdenum One of the largest toll conversion plants in the world with an annual capacity of 36 million pounds of roasted molybdenum and more than 9 million pounds Mo as ferromolybdenum Purchase molybdenum concentrates to convert to upgraded products, which are sold to the metallurgical and specialty markets Langeloth is well positioned within 2 day delivery to the US molybdenum market We source both our toll and purchased concentrates from North and South America by-product copper mines Our forecast operating cash flow from our Langeloth operation is expected to cover the holding costs of both of our shutdown molybdenum mines in 2016

21 Operations Review and Closing Remarks Jacques Perron President and Chief Executive Officer

22 Operating Statistics – Q4 and FY 2015 Copper (Cu) 19.5 18.0 71.4 64.6 16.1 15.5 76.5 64.7 0.0 10.0 20.0 30.0 40.0 50.0 60.0 70.0 80.0 90.0 Q415 Q414 2015 2014 Cu-Payable Production (millions lbs) Cu-Sales (millions lbs) $0.79 $1.16 $0.55 $1.15 $0.00 $0.20 $0.40 $0.60 $0.80 $1.00 $1.20 $1.40 Q415 Q414 2015 2014 Cu-Cash cost ($/payable lb produced) By-Product1 Q415 Q414 2015 2014 Cu Ore Grade 0.27% 0.27% 0.26% 0.27% Cu Recovery 79.3% 79.0% 80.2% 80.4% 1 Please refer to Appendix for non-GAAP reconciliation.
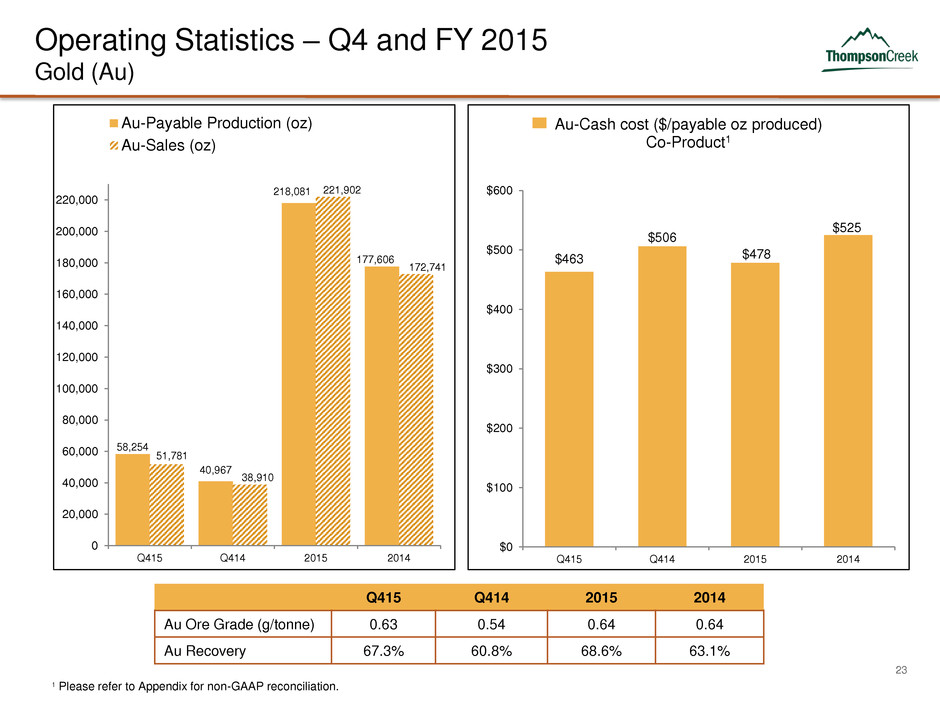
23 Operating Statistics – Q4 and FY 2015 Gold (Au) 58,254 40,967 218,081 177,606 51,781 38,910 221,902 172,741 0 20,000 40,000 60,000 80,000 100,000 120,000 140,000 160,000 180,000 200,000 220,000 Q415 Q414 2015 2014 Au-Payable Production (oz) Au-Sales (oz) $463 $506 $478 $525 $0 $100 $200 $300 $400 $500 $600 Q415 Q414 2015 2014 Au-Cash cost ($/payable oz produced) Co-Product1 Q415 Q414 2015 2014 Au Ore Grade (g/tonne) 0.63 0.54 0.64 0.64 Au Recovery 67.3% 60.8% 68.6% 63.1% 1 Please refer to Appendix for non-GAAP reconciliation.

24 Mount Milligan Permanent Secondary Crushing Circuit Provide more reliable throughput levels for the long-term at lower cost compared to temporary secondary crushing plant Once installed and commissioned, average daily mill throughput expected to increase to approximately 62,500 tonnes Decision recently made to move forward with project construction Capex estimate is $60 – $65 million1, inclusive of $15 million incurred in 2015 2 for engineering and concrete and long lead items 1 Plus or minus 10%. Assumes an exchange rate of US$1.00 = C$1.35 for 2016. Excludes $6.2 million in accruals as of December 31, 2015 that will be paid in 2016. 2 Of the amount incurred in 2015, approximately $6.2 million was accrued as of December 31, 2015. US$ Millions1 2016 Long Lead Items $27 Jan – July Construction $18 Apr – Sep Commissioning $2 Sep – Dec Total Capex $47

25 Key Messages Strong liquidity of $177 million in cash as of December 31, 2015 Low cost copper producer on by-product basis 2015 unit cash cost of $0.55 per pound 2016 unit cash cost guidance of $0.25 to $0.70 per pound Continuous optimization of Mount Milligan operation Transformed molybdenum business with the expectation of generating sufficient revenue to substantially cover care and maintenance costs and to maintain the future option value of assets Remain focused on addressing debt Engaged advisors to assist the Board in evaluating strategic and financial alternatives available to the Company, including debt financing and restructuring, new capital transactions and asset sales Goal to have a solution in place in advance of debt maturity dates

26 OTCQX: TCPTF TSX:TCM Thompson Creek Metals Company www.thompsoncreekmetals.com Pamela Solly Director, Investor Relations and Corporate Responsibility Phone (303) 762-3526 Email psolly@tcrk.com

27 Appendix
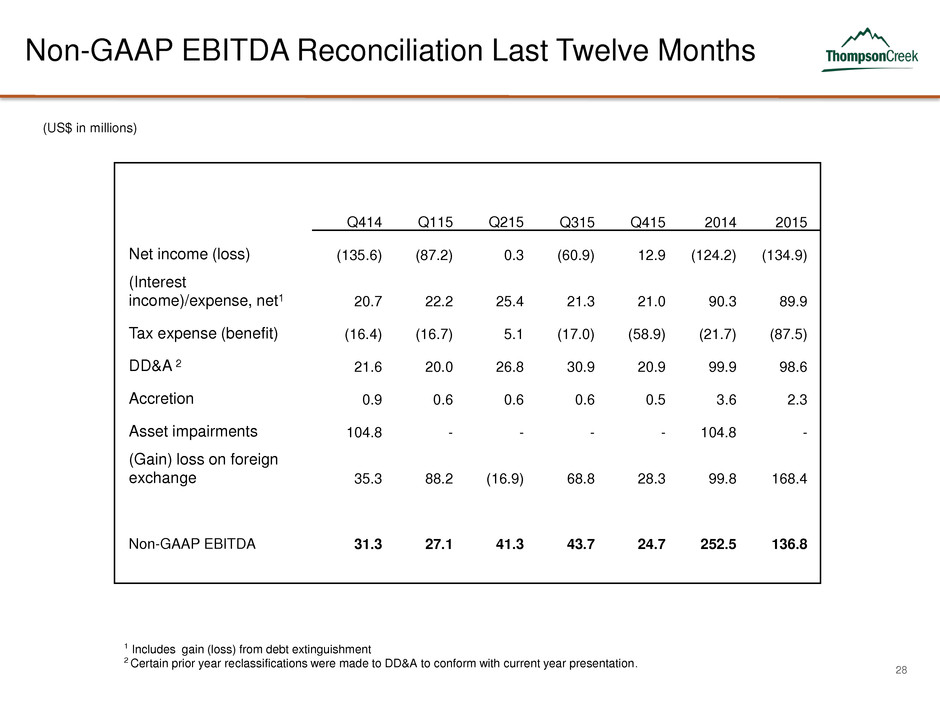
28 Non-GAAP EBITDA Reconciliation Last Twelve Months 1 Includes gain (loss) from debt extinguishment 2 Certain prior year reclassifications were made to DD&A to conform with current year presentation. (US$ in millions) Q414 Q115 Q215 Q315 Q415 2014 2015 Net income (loss) (135.6) (87.2) 0.3 (60.9) 12.9 (124.2) (134.9) (Interest income)/expense, net1 20.7 22.2 25.4 21.3 21.0 90.3 89.9 Tax expense (benefit) (16.4) (16.7) 5.1 (17.0) (58.9) (21.7) (87.5) DD&A 2 21.6 20.0 26.8 30.9 20.9 99.9 98.6 Accretion 0.9 0.6 0.6 0.6 0.5 3.6 2.3 Asset impairments 104.8 - - - - 104.8 - (Gain) loss on foreign exchange 35.3 88.2 (16.9) 68.8 28.3 99.8 168.4 Non-GAAP EBITDA 31.3 27.1 41.3 43.7 24.7 252.5 136.8
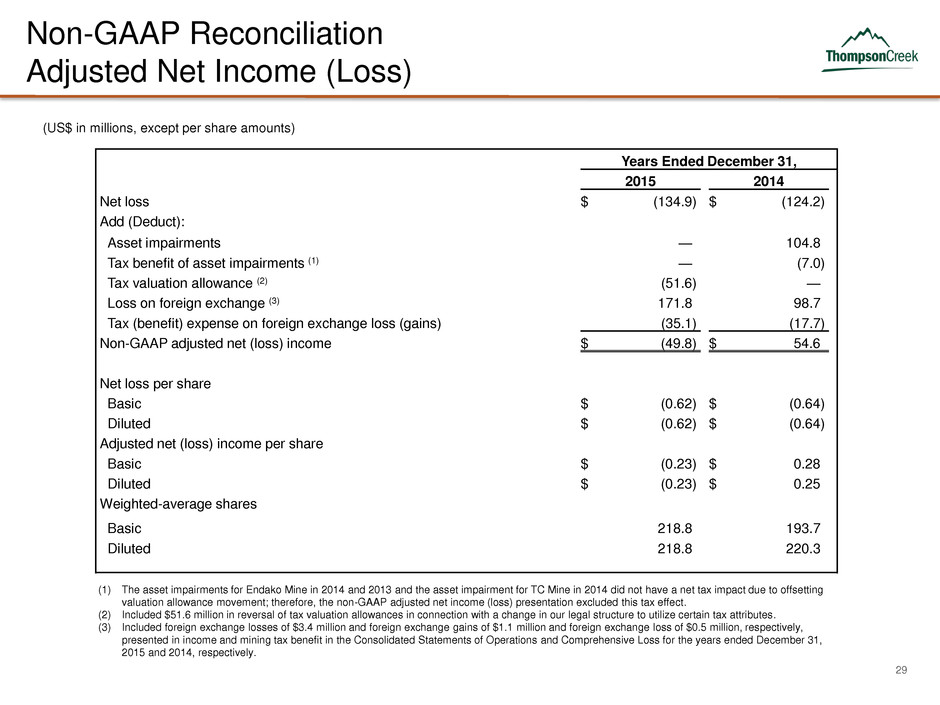
29 Non-GAAP Reconciliation Adjusted Net Income (Loss) (US$ in millions, except per share amounts) Years Ended December 31, 2015 2014 Net loss $ (134.9 ) $ (124.2 ) Add (Deduct): Asset impairments — 104.8 Tax benefit of asset impairments (1) — (7.0 ) Tax valuation allowance (2) (51.6 ) — Loss on foreign exchange (3) 171.8 98.7 Tax (benefit) expense on foreign exchange loss (gains) (35.1 ) (17.7 ) Non-GAAP adjusted net (loss) income $ (49.8 ) $ 54.6 Net loss per share Basic $ (0.62 ) $ (0.64 ) Diluted $ (0.62 ) $ (0.64 ) Adjusted net (loss) income per share Basic $ (0.23 ) $ 0.28 Diluted $ (0.23 ) $ 0.25 Weighted-average shares Basic 218.8 193.7 Diluted 218.8 220.3 (1) The asset impairments for Endako Mine in 2014 and 2013 and the asset impairment for TC Mine in 2014 did not have a net tax impact due to offsetting valuation allowance movement; therefore, the non-GAAP adjusted net income (loss) presentation excluded this tax effect. (2) Included $51.6 million in reversal of tax valuation allowances in connection with a change in our legal structure to utilize certain tax attributes. (3) Included foreign exchange losses of $3.4 million and foreign exchange gains of $1.1 million and foreign exchange loss of $0.5 million, respectively, presented in income and mining tax benefit in the Consolidated Statements of Operations and Comprehensive Loss for the years ended December 31, 2015 and 2014, respectively.

30 Non-GAAP Reconciliation Copper-Gold Operations Non-GAAP Cash Cost (US$ in millions) Non-GAAP Cash Cost (1) Mining, milling and on-site general and administration costs. Mining includes all stripping costs but excludes costs capitalized related to the construction of the tailings dam. Stripping costs that provide access to mineral reserves that will be produced in future periods are expensed as incurred under US GAAP. (2) Silver sales are reflected as a credit to operating costs. Three Months Ended December 31, Years Ended December 31, 2015 2014 2015 2014 Direct mining costs (1) $ 44.5 $ 45.2 $ 168.2 $ 183.4 Truck and rail transportation and warehousing costs 2.7 3.3 14.8 13.3 Costs reflected in inventory and operations costs $ 47.2 $ 48.5 $ 183.0 $ 196.7 Refining and treatment costs 5.2 4.6 24.2 17.5 Ocean freight and insurance costs 1.8 1.5 8.1 6.1 Direct costs reflected in revenue and selling and marketing costs $ 7.0 $ 6.1 $ 32.3 $ 23.6 Non-GAAP cash costs $ 54.2 $ 54.6 $ 215.3 $ 220.3 Reconciliation to amounts reported Direct costs $ (7.0 ) $ (6.1 ) $ (32.3 ) $ (23.6 ) Changes in inventory (10.2 ) (6.2 ) (1.3 ) 7.8 Silver by-product credits (2) (0.9 ) (0.9 ) (4.7 ) (4.3 ) Non cash costs and other 0.1 — 0.7 1.1 Copper-Gold segment US GAAP operating expenses $ 36.2 $ 41.4 $ 177.7 $ 201.3

31 By-Product (US$ in millions, except pounds and per pound amounts) Non-GAAP Reconciliation Copper-Gold Operations By-Product Unit Cost Per Pound Produced (1) Excluded refining and treatment charges. (2) Silver sales are reflected as a credit to operating costs. Three Months Ended December 31, Years Ended December 31, 2015 2014 2015 2014 Copper payable production (000's lbs) 19,473 18,024 71,400 64,569 Non-GAAP cash cost $ 54.2 $ 54.6 $ 215.3 $ 220.3 Less by-product credits Gold sales (1) $ 48.2 $ 39.0 $ 210.8 $ 173.1 Gold sales related to deferred portion of Gold Stream Arrangement (10.4 ) (6.3 ) (39.9 ) (31.2 ) Net gold by-product credits $ 37.8 $ 32.7 $ 170.9 $ 141.9 Silver by-product credits (2) 0.9 0.9 4.7 4.3 Total by-product credits $ 38.7 $ 33.6 $ 175.6 $ 146.2 Non-GAAP cash cost net of by-product credits $ 15.5 $ 21.0 $ 39.7 $ 74.1 Non-GAAP unit cash cost $ 0.79 $ 1.16 $ 0.55 $ 1.15

32 Co- Product (US$ in millions, except pounds, ounces and per unit amounts) Non-GAAP Reconciliation Copper-Gold Operations Co-Product Costs (1) For the years ended December 31, 2015 and 2014, gold has been converted from payable ounces to thousands of copper equivalent pounds by using the gold production for the periods presented, using a gold price of $785 and $829 per ounce, respectively, (adjusted for the Royal Gold price of $435 per ounce) and a copper price of $2.50 and $3.10 per pound, respectively. For the quarters ended December 31, 2015 and December 31, 2014, gold has been converted from payable ounces to thousands of copper equivalent pounds by using the gold production for the periods presented, using a gold price of $757 and $829 per ounce, respectively, (adjusted for the Royal Gold price of $435 per ounce) and a copper price of $2.21 and $3.10 per pound, respectively. Three Months Ended December 31, Years Ended December 31, 2015 2014 2015 2014 Copper payable production (000’s lbs) 19,473 18,024 71,400 64,569 Gold payable production in Cu eq. (000’s lbs) (1) 19,962 10,954 68,560 47,495 Payable production (000’s lbs) 39,435 28,978 139,960 112,064 Non-GAAP cash cost allocated to Copper $ 27.7 $ 34.0 $ 110.9 $ 126.9 Non-GAAP unit cash cost $ 1.39 $ 1.88 $ 1.55 $ 1.97 Non-GAAP cash cost allocated to Gold $ 26.5 $ 20.6 $ 104.4 $ 93.4 Gold payable production (ounces) 58,254 40,967 218,081 177,606 Non-GAAP unit cash cost $ 463 $ 506 $ 478 $ 525
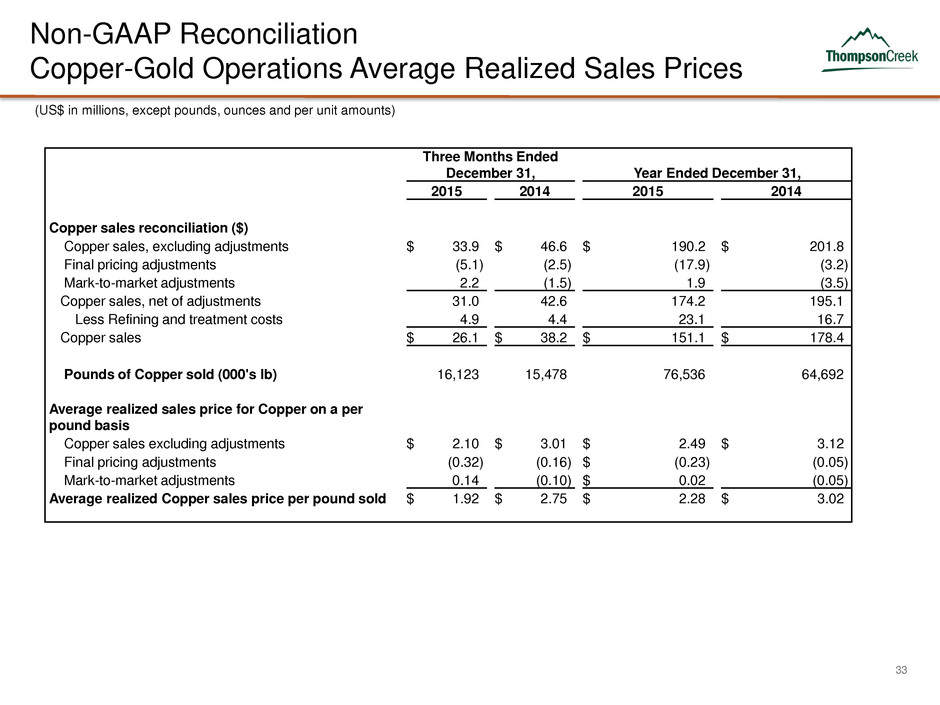
33 Non-GAAP Reconciliation Copper-Gold Operations Average Realized Sales Prices (US$ in millions, except pounds, ounces and per unit amounts) Three Months Ended December 31, Year Ended December 31, 2015 2014 2015 2014 Copper sales reconciliation ($) Copper sales, excluding adjustments $ 33.9 $ 46.6 $ 190.2 $ 201.8 Final pricing adjustments (5.1 ) (2.5 ) (17.9 ) (3.2 ) Mark-to-market adjustments 2.2 (1.5 ) 1.9 (3.5 ) Copper sales, net of adjustments 31.0 42.6 174.2 195.1 Less Refining and treatment costs 4.9 4.4 23.1 16.7 Copper sales $ 26.1 $ 38.2 $ 151.1 $ 178.4 Pounds of Copper sold (000's lb) 16,123 15,478 76,536 64,692 Average realized sales price for Copper on a per pound basis Copper sales excluding adjustments $ 2.10 $ 3.01 $ 2.49 $ 3.12 Final pricing adjustments (0.32 ) (0.16 ) $ (0.23 ) (0.05 ) Mark-to-market adjustments 0.14 (0.10 ) $ 0.02 (0.05 ) Average realized Copper sales price per pound sold $ 1.92 $ 2.75 $ 2.28 $ 3.02

34 Non-GAAP Reconciliation (continued) Copper-Gold Operations Average Realized Sales Prices (US$ in millions, except pounds, ounces and per unit amounts) Three Months Ended December 31, Year Ended December 31, 2015 2014 2015 2014 Gold sales reconciliation ($) Gold sales related to cash portion of Gold Stream Arrangement $ 11.7 $ 8.8 $ 50.1 $ 39.0 Gold sales related to deferred portion of Gold Stream Arrangement 10.4 6.3 39.9 31.2 Gold sales under Gold Stream Arrangement 22.1 15.1 90.0 70.2 TCM share of gold sales to MTM Customers 26.6 24.0 122.0 106.8 Final pricing adjustments 0.1 (2.5 ) (0.7 ) (3.0 ) Mark-to-market adjustments (0.6 ) 2.4 (0.5 ) (0.9 ) Gold sales TCM Share 26.1 23.9 120.8 102.9 Gold sales, net of adjustments 48.2 39.0 210.8 173.1 Less Refining and treatment costs 0.2 0.2 1.0 0.8 Gold sales 48.0 38.8 209.8 172.3 Ounces of gold sold to Royal Gold 26,819 20,217 115,104 89,546 TCM share of ounces of gold sold to MTM customers 24,962 18,692 106,798 83,194 Total ounces of Gold sold 51,781 38,909 221,902 172,740 Average realized sales price for Gold on a per ounce basis Gold sales related to cash portion of Gold Stream Arrangement $ 435 $ 435 $ 435 $ 435 Gold sales related to deferred portion of Gold Stream Arrangement 390 312 347 $ 348 Average realized sales price per ounce sold to Royal Gold $ 825 $ 747 $ 782 $ 783 TCM share of gold sales to MTM Customers $ 1,066 $ 1,284 1,142 $ 1,284 Final pricing adjustments 3 (134 ) (7 ) (36 ) Mark-to-market adjustments (23 ) 129 (4 ) (11 ) Average realized sales price per ounce sold for TCM share $ 1,046 $ 1,279 $ 1,131 $ 1,237 Average realized sales price per ounce sold $ 932 $ 1,002 $ 950 $ 1,002 (1) The average realized sales price per payable pound of copper sold and per payable ounce of gold sold is impacted by any final volume and pricing adjustments and mark-to-market adjustments for shipments made in prior periods.
