Attached files
| file | filename |
|---|---|
| EX-21.1 - SUBSIDIARIES OF THE REGISTRANT - NETSUITE INC | n12312015ex211.htm |
| EX-23.1 - CONSENT OF INDEPENDENT REGISTERED PUBLIC ACCOUNTING FIRM - NETSUITE INC | n12312015ex231.htm |
| EX-31.1 - CEO CERTIFICATION SOX 302 - NETSUITE INC | n12312015ex311.htm |
| EX-32.1 - CEO AND CFO CERTIFICATION SOX 906 - NETSUITE INC | n12312015ex321.htm |
| EX-31.2 - CFO CERTIFICATION SOX 302 - NETSUITE INC | n12312015ex312.htm |
UNITED STATES
SECURITIES AND EXCHANGE COMMISSION
Washington, D.C. 20549
_______________________
FORM 10-K
_____________________
(Mark one)
x | ANNUAL REPORT PURSUANT TO SECTION 13 OR 15(d) OF THE SECURITIES EXCHANGE ACT OF 1934 | |
For the fiscal year ended December 31, 2015
¨ | TRANSITION REPORT PURSUANT TO SECTION 13 OR 15(d) OF THE SECURITIES EXCHANGE ACT OF 1934 | |
For the transition period from to .
Commission file number 001-33870
______________________
NetSuite Inc.
(Exact name of registrant as specified in its charter)
_______________________
Delaware | 94-3310471 | |
(State or other jurisdiction of incorporation or organization) | (I.R.S. Employer Identification No.) | |
2955 Campus Drive, Suite 100 San Mateo, California | 94403-2511 | |
(Address of principal executive offices) | (Zip Code) | |
(650) 627-1000
(Registrant's telephone number, including area code)
_______________________
Securities registered pursuant to Section 12(b) of the Act:
Common Stock, $0.01 par value | New York Stock Exchange, Inc. | |
(Title of class) | (Name of each exchange on which registered) | |
Securities registered pursuant to Section 12(g) of the Act:
None
_______________________
Indicate by check mark if the Registrant is a well-known seasoned issuer as defined in Rule 405 of the Securities Act. Yes x No ¨
Indicate by check mark if the Registrant is not required to file reports pursuant to Section 13 or Section 15(d) of the Act. Yes ¨ No x
Indicate by check mark whether the Registrant (1) has filed all reports required to be filed by Section 13 or 15(d) of the Securities Exchange Act of 1934 during the preceding 12 months (or for such shorter period that the registrant was required to file such reports), and (2) has been subject to such filing requirements for the past 90 days. Yes x No ¨
Indicate by check mark whether the Registrant has submitted electronically and posted on its corporate Web site, if any, every Interactive Data File required to be submitted and posted pursuant to Rule 405 of Regulation S-T during the preceding 12 months (or for such shorter period that the Registrant was required to submit and post such files). Yes x No ¨
Indicate by check mark if disclosure of delinquent filers pursuant to Item 405 of Regulation S-K is not contained herein, and will not be contained, to the best of the Registrant's knowledge, in definitive proxy or information statements incorporated by reference in Part III of this Form 10-K or any amendment to this Form 10-K. ¨
Indicate by check mark whether the Registrant is a large accelerated filer, an accelerated filer, a non-accelerated filer, or a smaller reporting company. See definitions of "large accelerated filer," "accelerated filer," and "smaller reporting company" in Rule 12b-2 of the Exchange Act. (Check one):
Large accelerated filer x Accelerated filer ¨ Non-accelerated filer (Do not check if a smaller reporting company) ¨ Smaller reporting company ¨
Indicate by check mark whether the Registrant is a shell company (as defined in Rule 12b-2 of the Exchange Act). Yes ¨ No x
The aggregate market value of the Common Stock held by non-affiliates, based upon the closing sale price of the Common Stock on June 30, 2015, as reported as reported by the New York Stock Exchange, was approximately $3.5 billion. Shares of Common Stock held by each officer, director, and holder of 5% or more of the outstanding Common Stock have been excluded in that such persons may be deemed to be affiliates. This calculation does not reflect a determination that persons are affiliates for any other purposes.
On February 18, 2016, 79,983,660 shares of the registrant's Common Stock, $0.01 par value, were issued and outstanding.
DOCUMENTS INCORPORATED BY REFERENCE
_______________________
Portions of the Registrant's definitive proxy statement for its fiscal 2016 Annual Meeting of Stockholders to be filed within 120 days of the Registrant's fiscal year ended December 31, 2015 are incorporated by reference into Part III of this Annual Report on Form 10-K where indicated.
NetSuite Inc.
Index
PART I | ||||
Item 1. | ||||
Item 1A. | ||||
Item 1B. | ||||
Item 2. | ||||
Item 3. | ||||
Item 4. | ||||
PART II | ||||
Item 5. | ||||
Item 6. | ||||
Item 7. | ||||
Item 7A. | ||||
Item 8. | ||||
Item 9. | ||||
Item 9A. | ||||
Item 9B. | ||||
PART III | ||||
Item 10. | ||||
Item 11. | ||||
Item 12. | ||||
Item 13. | ||||
Item 14. | ||||
PART IV | ||||
Item 15. | ||||
SIGNATURES AND EXHIBIT INDEX | ||||
1
PART I
Item 1. | Business |
Overview
NetSuite Inc. ("NetSuite" or the "Company") is the industry's leading provider of cloud-based financials / Enterprise Resource Planning (“ERP”) and omnichannel commerce software suites. In addition to financials/ERP and omnichannel commerce software suites, we offer a broad suite of applications, including financial management, Customer Relationship Management (“CRM”), ecommerce and retail management, commerce marketing automation, Professional Services Automation (“PSA”) and Human Capital Management ("HCM") that enable companies to manage most of their core business operations in our single integrated suite. Our "real-time dashboard" technology provides an easy-to-use view into up-to-date, role-specific business information. We also offer customer support and professional services related to the support and implementation of our suite of applications. We deliver our suite over the Internet as a subscription service using the software-as-a-service ("SaaS") model.
Our revenue has grown from $17.7 million during the year ended December 31, 2004 to $741.1 million during the year ended December 31, 2015. For the year ended December 31, 2015 the percentage of our revenue generated outside of the United States was 25%. For each of the years ended December 31, 2014, and 2013 the percentage of our revenue generated outside of the United States was 26%.
Industry Background
The 1990s saw the widespread adoption among large enterprises of packaged business management software applications that automated a variety of departmental functions, such as accounting, finance, order and inventory management, human resources, professional services, sales and customer support. These sophisticated applications required significant cash outlays for the initial purchase and for ongoing maintenance and support. In addition, these applications were internally managed and maintained, requiring large staffs to support complex information technology infrastructures. Most importantly, the applications generally were provided by multiple vendors, with each application providing only a departmental view of the enterprise. To gain an enterprise-wide view, organizations attempted to tie together their various incompatible packaged applications through long, complex and costly integration efforts. Many of these attempts failed, in whole or in part, often after significant delay and expense. As a consequence, many large enterprises have transitioned from multiple point products to comprehensive, integrated business management suites, such as those offered by Oracle Corporation ("Oracle") and SAP AG ("SAP"), as their core business management platforms.
Medium-sized businesses and divisions of large enterprises have application software requirements that are similar, in many respects, to large enterprises because their core business processes are substantially similar to those of large enterprises. These requirements include the integration of back-office activities, such as managing payroll and tracking inventory; front-office activities, including order management and customer support; and, increasingly, sophisticated ecommerce capabilities.
Medium-sized businesses are generally less capable than large enterprises of performing the costly, complex and time-consuming integration of multiple point products from one or more vendors. As a result, medium-sized businesses can frequently derive greater benefits from a comprehensive business suite. Suites designed for, and broadly adopted by, large enterprises to provide a comprehensive, integrated platform for managing these core business processes, however, generally are not well suited to medium-sized businesses due to the complexity and cost of such applications.
Medium-sized businesses and divisions of large enterprises have begun to benefit from the development of the cloud computing delivery model. Cloud computing uses the Internet to deliver software applications from a centrally hosted computing facility to end users through a web browser. Cloud computing eliminates the costs associated with installing and maintaining applications within the customer's information technology infrastructure. Cloud applications are generally licensed for a monthly, quarterly or annual subscription fee, as opposed to on-premise enterprise applications that typically require the payment of a much larger, upfront license fee. As a result, cloud applications require substantially less initial and ongoing investment in software, hardware and implementation services and lower ongoing support and maintenance, making them substantially more cost effective to run for medium-sized businesses.
To date, the cloud computing software model has been applied to a variety of types of business software applications, including CRM, security, accounting, HCM, messaging and others, and it has been adopted by a wide variety of businesses.
While cloud applications have enabled medium-sized businesses to benefit from enterprise-class capabilities, most are still point products that require extensive, costly and time-consuming integration to work with other applications. Medium-sized businesses generally have been unable to purchase a comprehensive business management application suite at an affordable cost that enables them to run their businesses using a single system of record, provides real-time views of their operations and can be readily customized and rapidly implemented. We believe NetSuite was the first company to provide a cloud-based integrated suite of business management applications that addresses the needs of medium-sized businesses in the comprehensive manner that Oracle and SAP address the similar needs of large enterprises.
Our Solution
Our comprehensive business management application suite provides an integrated solution for running the core functions of a business. All elements of our application suite share the same customer and transaction data, enabling seamless, cross-departmental business process automation and real-time monitoring of core business metrics. Businesses can deploy our solution as a business management suite, or deploy specific applications such as financials/ERP, CRM, omnichannel commerce, PSA or HCM that can be integrated with existing
2
application investments. In addition, our financials/ERP, CRM, omnichannel commerce, PSA and HCM capabilities provide users with real-time visibility and appropriate application functionality through dashboards tailored to their particular job function and access rights.
Because our offering is delivered as a cloud-based solution via the Internet, it is available wherever a user has Internet access, whether on a personal computer or a mobile device. The key advantages of our application suite for our customers are:
One Integrated Solution for Running a Business. Our integrated business application suite provides the functionality required to automate the core operations of medium-sized businesses, as well as divisions of large companies. This unified approach to managing a business enables companies to create cross-functional business processes; extend access to appropriate customers, partners, suppliers or other relevant constituencies; and efficiently share and disseminate information in real time. Our suite is designed to be easy to use, while also providing in-depth functionality to meet the needs of our most sophisticated customers. Our customers can use our application suite to manage mission-critical business processes, including complex financials/ERP (finance, accounting, inventory and payroll), CRM (sales, order management, marketing and customer support), PSA (projects, resources, time, expense and billing) and ecommerce (hosting, online stores and website analytics) functions. We also have tailored our offering to meet the specific needs of customers in the wholesale/distribution, manufacturing, retail, professional services and software industries, to better serve those customers' distinct business requirements and accelerate the implementation of our offerings for customers in those industries.
Role-Based Application Functionality and Real-Time Business Intelligence. Users access our suite through a role-based user interface, or dashboard, which delivers specific application functionality and information appropriate for each user's job responsibilities in a format familiar to them. For example, the dashboard for a salesperson would deliver functionality for managing contacts, leads and forecasts, while the dashboard for a warehouse manager would deliver capabilities appropriate for managing shipping, receiving and returns. These dashboards also incorporate sophisticated business intelligence tools that enable users to track key performance indicators, analyze operational data to identify trends, issues and opportunities and make decisions that can improve the performance of their business, all in real time.
Cloud Delivery Model. We deliver our suite over the Internet as a subscription service via the cloud, eliminating the need for customers to buy and maintain on-premise hardware and software. Our suite is designed to achieve levels of reliability, scalability and security for our customers that have typically only been available to large enterprises with substantial information technology resources. Our architecture enables us to maintain very high levels of availability, scale easily as our customers grow and provide a safe and secure environment for their business-critical data and applications.
Flexible Deployment. As larger organizations increasingly choose cloud computing software to take advantage of the resulting cost savings and business efficiencies, our solution can also be rapidly deployed as a standalone financials/ERP solution rather than as a business management suite. This flexible deployment allows businesses to use our cloud-based financials/ERP capabilities within line of business and integrate it with their existing CRM, PSA and ecommerce investments, or grow into the suite over time. Additionally, global enterprises with entrenched enterprise-class financials/ERP investments at their corporate headquarters can deploy NetSuite OneWorld using a “two-tier” approach. NetSuite OneWorld can integrate with their existing enterprise-class financials/ERP at headquarters. In this case, NetSuite OneWorld is deployed across subsidiaries, divisions or countries allowing the organization to standardize its previously heterogeneous on-premise financials/ERP investments on a cloud-based solution with all the cost savings and rapid deployment options the cloud enables.
Low Total Cost of Ownership. Our suite incorporates the functionality of multiple applications, thereby eliminating the costs associated with attempting to integrate disparate applications, whether managed on-premise or delivered on-demand. Our on-demand delivery model and our application's ease of use and configurability significantly reduce implementation costs for hardware, software and services, upgrades and the need for dedicated information technology personnel. Customers typically subscribe to our application suite for a quarterly or annual fee based on the number of users and the solutions they elect to deploy. Our subscription fees are generally significantly less than typical upfront costs to purchase perpetual licenses, and our on-demand delivery system eliminates ongoing maintenance and upgrade charges.
Rapid Implementation. Because we offer a relatively comprehensive application suite that incorporates the functionality of multiple applications, we generally significantly reduce the time and risk associated with implementing and integrating multiple point products. Our cloud delivery model enables remote implementations and eliminates many of the steps associated with on-premise installations, such as purchasing and setting up hardware. In addition to our industry-specific offerings, our professional services organization is organized along customers' industries; therefore, knowledge gained through an implementation with one customer may be applied to other customers within that industry, thereby speeding implementations. Customers can implement our offerings themselves, engage our professional services organization or utilize the services of our partners.
Ease of Customization and Configuration. We enable users to customize our application suite to the particular needs of their businesses. Our application suite can be configured by end users without software programming expertise. In contrast to traditional on-premise applications, as new versions of our application suite become available, each customer's customizations and configurations are maintained with little or no additional effort or expense required.
Our Business Strategy
Our goal is to enhance our position as the leading provider of cloud-based financials/ERP software suites for medium-sized businesses. The key elements of our strategy include:
Expanding Our Leadership in Cloud-Based, Integrated Business Suites. We believe we were the first software vendor to integrate front-office, back-office and ecommerce management capabilities into a single cloud-based software suite. We intend to improve our position in the cloud-based applications market by continuing to provide high-quality offerings that encompass the enterprise-class functionality and ease-of-use our customers require. We also intend to leverage our position as our customers' primary business management platform to add new and enhanced functionality that will help them run their businesses more efficiently and expand our presence within their organizations.
3
Further Penetrate Global Enterprises. We believe there is a substantial opportunity to increase the presence of cloud-based financials/ERP solutions within global enterprises through a “two-tier” deployment model. Under a “two-tier” approach, a global business retains its existing investment in enterprise-class on-premise financials/ERP applications at headquarters, but selects a different solution that financial/ERP needs and is more cost effective to deploy and manage throughout its subsidiaries. We believe NetSuite OneWorld ("OneWorld") provides an ideal solution for this approach to global financials/ERP deployment, given that it provides multi-subsidiary, multi-currency and multi-tax intelligence in real-time with local control for in-country operations, while being deployed as a cloud application for fast and cost-effective delivery.
Tailoring Our Offering to Customers' Specific Industries. While we provide a general purpose suite applicable to all businesses, we believe that tailoring our application to customers' specific industries has been and will continue to be important to our growth. We currently offer industry-specific editions of our service for wholesale/distribution, manufacturing, professional services, retail and software companies. We will continue to enhance the capabilities of our application by further tailoring the functionality for these and other industries.
Growing Our Customer Base and Expanding Use of Our Service Within Existing Accounts. We intend to broaden our offerings and expand our direct and indirect sales efforts to grow our customer base. In addition, we seek to increase ongoing subscription revenue from our existing customers by broadening their use of our suite, thereby increasing the number of users and modules deployed.
Fostering the Continued Development of the NetSuite Partner Network. We provide tools and programs to foster the development of a network of value-added resellers, or ("VARs"), systems integrators and independent software vendors. In addition to programs that enable our partners to resell our suite, our SuiteCloud Platform allows these partners to extend our platform by developing products of their own, including industry-specific versions of our application suite. We intend to continue to enhance our platform and establish distribution models to bring these new solutions to market.
Addressing the Multinational Business Requirements of our Clients. Medium-sized businesses are increasingly seeking global business opportunities, in large part by leveraging the Internet. We believe that there is significant opportunity to address the needs of medium-sized businesses with multinational business operations, and we currently offer a localized version of our suite in a number of countries and languages. We will continue to extend our application offerings to support the requirements of multinational medium-sized businesses.
Enabling our Clients to Deliver an Omni-Channel Customer Experience. Customers today demand a seamless experience regardless of how they interact with a business - whether online, in-store, via phone or in-person. We believe there is a significant opportunity to provide our clients with tools that allow them to redefine the experience for any touch point and any business model: business-to-consumer, business-to-business or business-to-employee. We will continue to enhance and extend our SuiteCommerce offerings, including SuiteCommerce InStore and SuiteCommerce Advance, and NetSuite point-of-sale ("POS") offering to allow our clients to transform their businesses and deliver this omnichannel experience to their customers.
Our Offerings
Our main offering is NetSuite, which is designed to provide the core business management capabilities that most of our customers require. NetSuite, OneWorld and NetSuite CRM+ are designed for use by most types of businesses. NetSuite OpenAir ("OpenAir") is designed for use specifically by professional services businesses. In addition, we offer industry-specific configurations for use by wholesale/distribution, manufacturing, retail, nonprofit, services and software companies. We also sell additional cloud-based application modules that customers can purchase to obtain additional functionality required for their specific business needs.
NetSuite. NetSuite, which is targeted at medium-sized businesses and divisions of large companies, provides a single platform for financials/ERP, CRM, PSA and ecommerce capabilities. It contains a broad array of features that enables users to do their individual jobs more effectively. In addition, because all users are transacting business on the same database system, NetSuite can easily automate processes across departments. For example, when a sales representative enters an order, upon approval it automatically appears on the warehouse manager's dashboard as an item to be shipped and, once the item has been shipped, it automatically appears on the finance manager's dashboard as an item to be billed. Each customer can automate its key business functions across all departments, including sales, marketing, service, finance, inventory, order fulfillment, purchasing and employee management. As with all of our offerings, users access the application and data through a role-based user interface, or dashboard, tailored to deliver specific functionality and information appropriate for their position.
NetSuite OneWorld. OneWorld is targeted at global businesses and divisions of large companies operating in multinational and multi-subsidiary environments. NetSuite OneWorld delivers rich international product capabilities including global financial consolidation, subsidiary management and transactions in more than 190 currencies, support for 20 languages and configurable compliance across more than 100 countries. OneWorld allows users to utilize our single platform for financials/ERP, CRM, PSA and ecommerce capabilities in multi-currency and multi-language environments across multiple subsidiaries and legal entities. OneWorld provides the ability to manage multiple companies or legal entities, with potentially different currencies, taxation rules, and reporting requirements, within a single NetSuite account. OneWorld's tax and compliance management capabilities provide a robust foundation for transparency, automation, simplicity and controls in the management of global tax and compliance responsibilities, enabling multinational businesses to grow globally with confidence. OneWorld has global CRM capabilities that allow for management of multi-currency quotas, forecasts, commission payments, sales tax calculations and real-time reporting for everyone in a global sales organization from the local sales representative, to the regional vice president to the head of worldwide sales. Additionally, growing companies typically employ multiple sales channels for their global sales operations so OneWorld allows for automation of common sales channels employed internationally including direct sales, distribution partner networks and ecommerce. Marketing and customer support operations can also be managed globally using OneWorld so processes such as lead routing and trouble ticket assignment can easily be handled across regions or in-country, with global customer visibility and real-time measurement of marketing and service operational performance.
NetSuite CRM+. NetSuite CRM+ is targeted at a wide range of companies, including companies larger than our traditional medium-sized business customers. Medium-sized businesses may use NetSuite CRM+ as an entry point into the entire suite, while larger enterprises often implement it as an alternative to more limited CRM offerings. This application provides traditional sales force automation, marketing
4
automation, customer support and service management functionality. NetSuite CRM+ contrasts with competitive CRM products by also incorporating order management and many other financials/ERP and ecommerce capabilities without requiring additional integration. This provides users with a more comprehensive, real-time view of customer interactions than can be provided by traditional, stand-alone CRM products, whether on-premise or on-demand. NetSuite CRM+ also offers incentive management, project tracking, website hosting and analytics and partner relationship management.
NetSuite OpenAir PSA. NetSuite OpenAir is a Professional Services Automation ("PSA") solution that is used by professional services organizations and is targeted at some of the world’s largest companies with thousands of employees. NetSuite OpenAir provides a clear view into the services organization’s performance and profitability with dashboards and reports. With NetSuite OpenAir’s project accounting functionality, professional services organizations can efficiently monitor and manage projects’ revenues, expenses and profitability over the lifetime of the project. This solution provides resource management functionality to improve resource utilization, and delivers web-based project management that improves on-time project delivery and drives project success rates. NetSuite OpenAir provides online and mobile time and expense management and enables services professionals to improve their productivity by entering their expenses while on the road. NetSuite OpenAir can be deployed either as a stand-alone PSA software solution, integrated with NetSuite, or integrated with an existing enterprise CRM or financials/ERP system.
SuiteCommerce. The SuiteCommerce solution is built with the idea that ecommerce is no longer a standalone channel but a core capability for retail and business-to-business ("B2B") businesses. SuiteCommerce enables businesses to move from standalone transactional channels such as online, in-store or telephone to an integrated commerce solution that puts the customer at the center of every experience. SuiteCommerce captures preferences and transactions into rich customer profiles to support personalized marketing, merchandising and promotions across all channels.
Business-to-consumer ("B2C") and B2B businesses are increasingly adopting SuiteCommerce’s robust, reliable, scalable and flexible cloud-based commerce solution to meet customer expectations to buy, fulfill and return via the channel of their choice. By using SuiteCommerce, businesses can provide customers with consistent, relevant shopping experiences across channels including brick-and-mortar, online, and mobile while gaining a 360-degree view of customers to deliver innovative experiences that are differentiated and more personalized. Companies are relying on SuiteCommerce to run their entire business on a single, unified cloud commerce platform - from ecommerce, in-store and financials to order management, inventory management, customer relationship management and customer support.
Bronto Marketing Platform. Bronto Marketing Platform is our commerce marketing automation platform that delivers timely, relevant and data-driven digital marketing.
NetSuite InStore POS. NetSuite InStore POS provides retailers with a solution that unifies the physical and digital shopping experiences within a single, cloud-based commerce platform. Built on NetSuite’s order and inventory management system, SuiteCommerce InStore provides visibility into inventory anywhere in the business, including the ability to combine different fulfillment models such as cash-and-carry and ship-to-home in a single transaction. Built-in CRM provides retail associates access to a comprehensive 360-degree customer history from the store floor and a visual timeline shows all purchases, exchanges, store visits and service requests regardless of channel.
LightCMS. LightCMS is a web-based software platform. LightCMS functionality simplifies the process of building a website and an online store.
Add-On Modules. We also offer advanced capabilities that are part of our integrated suite, but are typically sold separately. These modules allow our customers to specifically augment aspects of our suite to enhance its relevance to their businesses.
NetSuite Industry Editions. We have configured NetSuite to meet the requirements of selected industries. Our current editions serve companies in the wholesale/distribution, manufacturing, services, retail and software industries. Within each edition, we offer advanced industry specific functionality to complement our core NetSuite offering, templates of best practices, and dedicated sales and professional services teams with industry-specific expertise.
SuiteCloud Platform. SuiteCloud is our technology platform that allows customers, partners and developers to tailor and extend our suite to meet specific company, vertical and industry requirements for personalization, business processes and best practices. It allows partners to rapidly develop and distribute cloud-based products of their own, including industry-specific versions of our application suite. NetSuite provides partners building on SuiteCloud with a website – SuiteApp.com – that enables them to market and distribute their value-added solutions to NetSuite. Our application development and customization environment is designed to continue to operate across version upgrades.
Sales and Marketing
Sales. We generate sales through both direct and indirect approaches, with most selling done over the phone. Our direct sales team consists of professionals in various locations across the United States, Europe and the Asia-Pacific region. Within these regions, our direct sales organization focuses on selling to medium-sized businesses and divisions of large companies. Indirect sales are generated through our relationships with channel partners in North America, Latin America, Europe and the Asia-Pacific region.
Our sales process typically begins with the generation of a sales lead from a marketing program or customer referral. After the lead is qualified, our sales personnel conduct focused web-based demonstrations along with initial price discussions. Members of our professional services team are engaged as needed to offer insight around aspects of the implementation. Our sales cycle typically ranges from one to six months, but can vary based on the specific application, the size and complexity of the potential customer's information technology environment and other factors.
Marketing. We tailor our marketing efforts around relevant application categories, customer sizes and customer industries. As part of our marketing strategy, we have established a number of key programs and initiatives including online and search engine advertising, email campaigns and web seminars, product launch events, trade show and industry event sponsorship and participation, marketing support for channel partners, and referral programs.
5
Service and Support
Professional Services. We have developed repeatable, cost-effective consulting and implementation services to assist our customers with integrating and importing data from other systems, changing their business processes to take advantage of the enhanced capabilities enabled by our integrated suite, implementing those new business processes within their organization and configuring and customizing our application suite for their business processes and requirements.
Our consulting and implementation methodology leverages the nature of our cloud-based software architecture, the industry-specific expertise of our professional services employees and the design of our platform to simplify, streamline and expedite the implementation process. We generally employ a joint staffing model for implementation projects whereby we involve the customer more actively in the implementation process than traditional software companies. We believe this better prepares our customers to support the application throughout their use of our service. In addition, because our service is cloud-based, our professional services employees can remotely configure our application for most customers based on telephonic consultations. Our consulting and implementation services are offered on a fixed price and time and material basis. Our network of partners also provides professional services to our customers.
Client Support. Our technical support organization, with personnel in Canada, Europe and Asia, offers support 24 hours a day, seven days a week. Our system allows for skills-based and time zone-based routing to address general and technical inquiries across all aspects of our suite. For our direct customers, we offer tiered customer support programs depending upon the service needs of our customers' deployments. Support contracts typically have a one-year term. For customers purchasing through resellers, primary product support is provided by our resellers, with escalation support provided by us.
Training. We offer complimentary training videos, public training courses and end-user training to facilitate the successful adoption of our suite throughout the customer's organization. We also provide self-study training content on a subscription basis for consumption by partners and customers.
Operations, Technology and Development
Our customers rely on our application suite to run their businesses and, as a result, we need to ensure the availability and reliability of our service. We have developed our infrastructure with the goal of achieving availability of our services, which are hosted on a highly-scalable network located in secure third-party facilities. We host the NetSuite services and serve our customers primarily from our California-based data center facilities, which we operate in conjunction with colocation services from CenturyLink Technology Solutions (“CenturyLink”). CenturyLink was formerly SAVVIS Communications Corporation and changed names in January 2014. We also operate data center facilities located in Massachusetts and Washington, which we operate in conjunction with CenturyLink. For purposes of disaster recovery, the California data center serves as back-up for Massachusetts and Washington; while the Massachusetts data center serves as backup for California. In October 2015, we announced the opening of two European data center deployments in Amsterdam, Netherlands and Dublin, Ireland. For purposes of disaster recovery, the Netherlands and Ireland locations serve as back-up for one another.
Our NetSuite OpenAir applications are hosted from a Massachusetts-based data center, which we operate in conjunction with CenturyLink. Our NetSuite POS applications are hosted using a hardware solution provided by a partner with various hosting from data centers based on the East Coast of the United States, which we also operate in conjunction with Amazon. NetSuite POS was formerly known as “Retail Anywhere". The OrderMotion applications are hosted from a Texas-based datacenter which we operate in conjunction with RackSpace. The LightCMS applications are hosted from a datacenter which we operate in conjunction with CenturyLink. The Tribe HR applications are hosted from a Canada-based datacenter which we operate in conjunction with VM Farms.
Our service delivery operations incorporate industry-standard hardware, the Linux open-source operating system and Oracle databases and application servers into a flexible, scalable architecture. Elements of our application suite's infrastructure can be replaced or added with no interruption in service, helping to ensure that the failure of any single device is not expected to cause a broad service outage of the NetSuite Service.
Our single-instance, multi-tenant architecture allows us to provide our customers with enterprise-class capabilities, high quality of service, scalability and security, all at an affordable price. Our architecture enables us to host multiple smaller customers on a single database instance while preserving the ability to migrate any customer to its own server without material interruption or alteration when the customers' growth and business needs require it. In addition to the enhanced flexibility and scalability our architecture provides, it also is designed to work on inexpensive, industry-standard hardware, thereby providing us a significant cost advantage that is reflected in the pricing we are able to offer our customers.
Unlike other SaaS companies that deploy major new releases to all customers at once, we deploy all major releases and many upgrades of our application suite to only a portion of our customer base at any one time. This "phased release process" is designed to allow us to mitigate the impact of major changes and new releases, ensuring that any potential issues affect only a portion of our customers before they are addressed.
The combination of our hosting infrastructure, robust networks, flexible architecture and phased release process enables us to offer a service-level commitment to our customers of 99.5% uptime per period, excluding designated periods of maintenance. Under the terms of this commitment, we offer to credit a full month's service fees for any period where we do not meet this service level.
Product development expenses were $135.5 million, $106.7 million and $78.3 million during the years ended December 31, 2015, 2014 and 2013, respectively. In developing features for our service offerings, we integrate customer feedback, prospect requests, partner requirements and our own industry expertise. We also spend significant time with our customers in formal user testing sessions as well as less formal "ride-alongs" and customer roundtables. We use the NetSuite service to track customer interest in service enhancements and actual work done on these enhancements. We develop our offerings using Java and the Oracle database on the server and Asynchronous JavaScript and XML on the client with a goal of making our service scalable, high performance, robust and easy to use. Finally, we expose many development tools to third-party developers via SuiteFlex to allow extensions to the service that extend and complement the built-in capabilities we develop internally. Our use of the Oracle database is pursuant to various software license agreements with Oracle USA, Inc.,
6
an affiliate of Oracle. Lawrence J. Ellison, who beneficially owns a significant portion of our common stock, is the Chief Technology Officer, a principal stockholder and Executive Chairman of the Board of Oracle. See Note 17 to our Consolidated Financial Statements for a further description of this software license agreement.
Customers
Our customers are diverse in size and type across a wide variety of industries, with a focus on medium-sized businesses and divisions of large companies. In 2015, the top 10 industries in which our customers operated, as measured by our recognized revenue, were as follows: Distribution & Wholesale; Professional, Consulting and Other Services; Computer Software; ecommerce & Retail; Manufacturing; Computer & IT Services; Telecommunications Services; Financial Services; Healthcare Services; and Education. We had customers in approximately 100 countries in 2015. No single customer accounted for more than 3% of our revenue in 2015, 2014 or 2013.
Competition
We compete with a broad array of financials/ERP, CRM, ecommerce, PSA and HCM companies. Our markets are highly competitive, fragmented and subject to rapid changes in technology. Many of our potential customers evaluate a wide range of alternatives during their purchase process. Although we believe that none of our larger competitors currently offer a cloud-based comprehensive business management suite, we face significant competition within each of our markets from companies with broad product suites and greater name recognition and resources than we have, as well as smaller companies focused on specialized solutions. In addition, some of our larger competitors have announced plans to launch new products that could compete more closely with our cloud-based application suite. Internationally, we face competition from local companies as well as larger competitors, each of which has products tailored for those local markets. To a lesser extent, we compete with internally developed and maintained solutions. Our current principal competitors include Epicor Software Corporation, Intuit Inc., Microsoft Corporation, Oracle Corporation, SAP AG, The Sage Group plc, salesforce.com, inc. and Workday, Inc.
We believe the principal competitive factors in our markets include:
• | service breadth and functionality; | ||
• | service performance, security and reliability; | ||
• | ability to tailor and customize services for a specific company, vertical or industry; | ||
• | ease of use; | ||
• | speed and ease of deployment, integration and configuration; | ||
• | total cost of ownership, including price and implementation and support costs; | ||
• | sales and marketing approach; and | ||
• | financial resources and reputation of the vendor. | ||
We believe that we compete favorably with most of our competitors on the basis of each of the factors listed above, except that certain of our competitors have greater sales, marketing and financial resources, more extensive geographic presence and greater name recognition than we do. In addition, although we have extended the number of applications we have introduced for specific vertical markets, we may be at a disadvantage in certain vertical markets compared to certain of our competitors. We may face future competition in our markets from other large, established companies, as well as from emerging companies. In addition, we expect that there is likely to be continued consolidation in our industry that could lead to increased price competition and other forms of competition.
Intellectual Property
Our success depends upon our ability to protect our core technology and intellectual property. To accomplish this, we rely on a combination of intellectual property rights, including trade secrets, patents, copyrights and trademarks, as well as customary contractual protections. We view our trade secrets and know-how as a significant component of our intellectual property assets, as we have spent years designing and developing our cloud-based, integrated application suite, which we believe differentiates us from our competitors.
As of December 31, 2015, we have numerous issued US patents and pending US patent applications. We do not know whether any of our pending patent applications will result in the issuance of patents or whether the examination process will require us to narrow our claims. There can be no assurances that our patents, or our pending patent applications even if granted, will provide us with protection.
We have a number of registered and unregistered trademarks. We maintain a policy requiring our employees, consultants and other third parties to enter into confidentiality and proprietary rights agreements and to control access to software, documentation and other proprietary information.
In addition, we license third-party technologies that are incorporated into some elements of our services. Licenses of third-party technologies may not continue to be available to us at a reasonable cost, or at all. The steps we have taken to protect our intellectual property rights may not be adequate. Third parties may infringe or misappropriate our proprietary rights. Competitors may also independently develop technologies that are substantially equivalent or superior to the technologies we employ in our services. Failure to protect our proprietary rights adequately could significantly harm our competitive position and operating results.
7
The software and technology industries are characterized by the existence of a large number of patents, copyrights, trademarks and trade secrets and by frequent litigation based on allegations of infringement or other violations of intellectual property rights. As we face increasing competition, the possibility of intellectual property rights claims against us grows. Many of our service agreements require us to indemnify our customers for certain third-party intellectual property infringement claims, which would increase our costs as a result of defending those claims and might require that we pay damages if there were an adverse ruling in any such claims. We, and certain of our customers, have in the past received correspondence from third parties alleging that certain of our services, or customers' use of our services, violate these third parties' patent rights. These types of correspondence and future claims could harm our relationships with our customers and might deter future customers from subscribing to our services.
With respect to any intellectual property rights claim against us or our customers, we may have to pay damages or stop using technology found to be in violation of a third party's rights. We may have to seek a license for the technology, which may not be available on reasonable terms, significantly increase our operating expenses or require us to restrict our business activities in one or more respects. The technology also may not be available for license to us at all. As a result, we may be required to develop alternative non-infringing technology, which could require significant effort and expense.
Employees
As of December 31, 2015, we had 4,603 employees. We also engage a number of independent contractors and consultants. None of our employees is represented by a labor union with respect to his or her employment with us. We have not experienced any work stoppages, and we consider our relations with our employees to be good. Our future success will depend upon our ability to attract and retain qualified personnel. Competition for qualified personnel remains intense, and we may not be successful in retaining our key employees or attracting skilled personnel.
Available Information
You can obtain copies of our Form 10-K, Quarterly Reports on Form 10-Q, Current Reports on Form 8-K, and other filings with the Securities and Exchange Commission ("SEC"), and all amendments to these filings, free of charge from our Web site at http://www.netsuite.com/investors as soon as reasonably practicable following our filing of any of these reports with the SEC. You can also obtain copies free of charge by contacting our Investor Relations department at our corporate headquarters. The information found on our website is not a part of this or any other report we file with or furnish to the SEC.
You can also read and copy any materials we file with the SEC at the SEC's Public Reference Room at 100 F Street, N.E., Washington, DC 20549. You can obtain additional information about the operation of the Public Reference Room by calling the SEC at 1-800-SEC-0330. In addition, the SEC maintains a website (http://www.sec.gov) that contains reports, proxy and information statements, and other information regarding issuers that file electronically with the SEC, including us.
Executive Officers of the Registrant
Our executive officers, and their ages and positions as of February 23, 2016, are set forth below:
Name | Age | Position(s) | ||
Zachary Nelson | 54 | Chief Executive Officer and Director | ||
Evan M. Goldberg | 49 | Chief Technology Officer and Chairman of the Board | ||
James McGeever | 49 | President and Chief Operating Officer and Director | ||
Ronald Gill | 49 | Chief Financial Officer | ||
Douglas P. Solomon | 49 | Senior Vice President, General Counsel and Secretary | ||
Marc Huffman | 45 | President, Worldwide Sales and Distribution | ||
Zachary Nelson has served as a director since July 2002 and as our Chief Executive Officer since January 2003. Prior to that, Mr. Nelson served as our President and Chief Operating Officer from July 2002 to January 2003. Previously he served as senior executive at Network Associates, Inc., Oracle Corporation and Sun Microsystems, Inc. He holds B.S. and M.A. degrees from Stanford University.
Evan M. Goldberg co-founded our company in 1998 and has served as Chairman of our Board of Directors and as our Chief Technology Officer since January 2003. From October 1998 through January 2003, Mr. Goldberg held various positions with us, including President and Chief Executive Officer and Chief Technology Officer. Prior to joining us, Mr. Goldberg founded mBed Software, Inc., a software company focused on multimedia tools for website developers, where he served as Chief Executive Officer from November 1995 to September 1998. From August 1987 to November 1995, Mr. Goldberg held various positions in product development at Oracle Corporation, including Vice President of Development in the New Media Division. Mr. Goldberg holds a B.A. from Harvard College.
James McGeever has served as a director since July 2015 and as our President and Chief Operating Officer since July 2015. Prior to that, Mr. McGeever served as our Chief Operating Officer from July 2010 to July 2015. Mr. McGeever also served as Chief Financial Officer from June 2000 to July 2010. From January 2000 to June 2000, Mr. McGeever served as our Director of Finance. Prior to joining us, Mr. McGeever was the controller of Clontech Laboratories, Inc., a privately held biotechnology company from 1998 to 2000 and the corporate controller at Photon Dynamics, Inc., a capital equipment maker from 1994 to 1998. Mr. McGeever holds a B.Sc. from the London School of Economics. Mr. McGeever has qualified as a chartered accountant in the United Kingdom. Mr. McGeever serves on the Board of Directors of Cornerstone OnDemand, Inc., a provider of comprehensive talent management solutions delivered as Software-as-a-Service.
8
Ronald Gill has served as Chief Financial Officer since July 2010. Prior to that, Mr. Gill served as Senior Vice President, Finance from August 2007 to July 2010. Prior to joining our company in August 2007, Mr. Gill was Vice President, Finance at Hyperion Solutions Corporation, a provider of performance management software from August 2006 until July 2007. Hyperion Solutions Corporation was acquired by Oracle Corporation in April 2007. From 2004 until May 2006, Mr. Gill was the Chief Controller, Product and Technology Group at SAP. Mr. Gill holds a B.A. from Baylor University and a Master of International Business Studies degree from the University of South Carolina. Mr. Gill serves on the Board of Directors of HubSpot, Inc., a cloud-based marketing and sales software platform provider.
Douglas P. Solomon has served as our Senior Vice President, General Counsel and Secretary since July 2008. Mr. Solomon served as our Vice President, Legal & Corporate Affairs from November 2006 to July 2008 and has been our Secretary since January 2007. Prior to joining us, Mr. Solomon served in senior legal and management roles at Unwired Planet (formerly Openwave Systems Inc.), a software company, from April 2000 through March 2006, including Vice President, Legal & Corporate Affairs. He holds a B.A. from the University of Michigan and a J.D. from Harvard Law School.
Marc Huffman has served as our President, Worldwide Sales and Distribution since April 2014. Prior to that, Mr. Huffman served as our Senior Vice President of North American Verticals, Channels and APAC from 2010 to April 2014. From 2008 to 2010, Mr. Huffman served as our Senior Vice President of Sales, North America. From December 2003 to 2008, Mr. Huffman served as our Vice President of Sales. Prior to joining us, Mr. Huffman served as a director of sales responsible for Canada and the central U.S. at Oracle Corp. Mr. Huffman holds a B.S. from California State University, Chico.
9
Item 1A. | Risk Factors |
A description of the risks and uncertainties associated with our business is set forth below. If any of such risks and uncertainties actually occurs, our business, financial condition or operating results could differ materially from the plans, projections and other forward-looking statements included in the section titled "Management's Discussion and Analysis of Financial Condition and Results of Operations" and elsewhere in this report and in our other public filings. In addition, if any of the following risks and uncertainties, or if any other risks and uncertainties, actually occurs, our business, financial condition or operating results could be harmed substantially, which could cause the market price of our stock to decline, perhaps significantly.
Risks Related to Our Business
Continued adverse economic conditions or reduced investments in cloud-based applications and information technology spending may harm our business.
Our business depends on the overall demand for cloud-based applications and information technology spending and on the economic health and general willingness of our current and prospective customers to make capital commitments. If the conditions in the U.S. and global economic environment remain uncertain or continue to be volatile, or if they deteriorate further, our business, operating results, and financial condition may be materially adversely affected. Continued weak or volatile economic conditions, or a reduction in spending for cloud-based applications and information technology even if economic conditions improve, would likely harm our business and operating results in a number of ways, including longer sales cycles, extended payment terms, lower prices for our products and services, reduced sales, and lower customer retention rates.
We have a history of losses, and we may not achieve profitability in the future.
We have not been profitable on a generally accepted accounting principles (“GAAP”) basis during any quarterly or annual period since our formation. We experienced a net loss of $124.7 million for the year ended December 31, 2015. As of that date, our accumulated deficit was $674.0 million. We expect to make significant future expenditures related to the development and expansion of our business. As a result of these increased expenditures, we will have to generate and sustain increased revenue to achieve and maintain future profitability. While historically our revenue has grown, this growth may not be sustainable and we may not achieve sufficient revenue to achieve or maintain profitability. We may incur significant losses in the future for a number of reasons, including due to the other risks described in this Annual Report, and we may encounter unforeseen expenses, difficulties, complications and delays and other unknown factors. Accordingly, we may not be able to achieve or maintain profitability and we may continue to incur significant losses for the foreseeable future.
Many of our customers are small- and medium‑sized businesses and divisions of large companies, which may result in increased costs as we attempt to reach, acquire and retain customers.
We market and sell our application suite to small- and medium-sized businesses and divisions of large companies. To grow our revenue quickly, we must add new customers, sell additional services to existing customers and encourage existing customers to renew their subscriptions. However, selling to and retaining small- and medium-sized businesses can be more difficult than selling to and retaining large enterprises because small- and medium-sized business customers:
• | are more price sensitive; |
• | are more difficult to reach with broad marketing campaigns; |
• | have high churn rates in part because of the nature of their businesses; |
• | often lack the staffing to benefit fully from our application suite’s rich feature set; and |
• | often require higher sales, marketing and support expenditures by vendors that sell to them per revenue dollar generated for those vendors. |
If we are unable to cost‑effectively market and sell our service to our target customers, our ability to grow our revenue and become profitable will be harmed.
Our business depends substantially on customers renewing, upgrading and expanding their subscriptions for our services. Any decline in our customer renewals, upgrades and expansions would harm our future operating results.
We sell our application suite pursuant to service agreements that are generally one year in length. Our customers have no obligation to renew their subscriptions after their subscription period expires, and they may not renew their subscriptions at the same or higher levels. Moreover, under specific circumstances, our customers have the right to cancel their service agreements before they expire. In addition, in the first year of a subscription, customers often purchase a higher level of professional services than they do in renewal years. As a result, our ability to grow is dependent in part on customers purchasing additional subscriptions and modules after the first year of their subscriptions. We may not accurately predict future
10
trends in customer renewals. Our customers’ renewal rates may decline or fluctuate because of several factors, including their satisfaction or dissatisfaction with our services, the prices of our services, the prices of services offered by our competitors or reductions in our customers’ spending levels due to the macroeconomic environment or other factors. If our customers do not renew their subscriptions for our services, renew on less favorable terms, or do not purchase additional functionality or subscriptions, our revenue may grow more slowly than expected or decline and our profitability and gross margin may be harmed.
Any disruption of service at our data centers could interrupt or delay our ability to deliver our service to our customers.
We host our services, serve our customers and support our operations primarily from California-based data centers, which we operate in conjunction with CenturyLink. However, we host our NetSuite OpenAir applications from a Massachusetts-based data center, which we also operate in conjunction with CenturyLink. We also operate some customer and partner accounts along with Release Preview and trial accounts from a Massachusetts-based data center, which we operate in conjunction with CenturyLink. In 2015, we added a data center facility located in Washington, which we also operate in conjunction with CenturyLink. The OrderMotion applications are hosted from a Texas-based data center which we operate in conjunction with RackSpace. The LightCMS applications are hosted from a data center which we operate in conjunction with CenturyLink. The Tribe HR applications are hosted from a Canada-based data center which we operate in conjunction with VM Farms. We do not have sole control over the operations of these facilities. These facilities are vulnerable to damage or interruption from earthquakes, hurricanes, floods, fires, cyber security attacks, terrorist attacks, power losses, telecommunications failures and similar events. The occurrence of a natural disaster or an act of terrorism, a decision to close the facilities without adequate notice or other unanticipated problems could result in lengthy interruptions in our services. As part of our current disaster recovery arrangements, the California data center serves as back-up for Massachusetts and Washington; while the Massachusetts data center serves as backup for California. In particular, our California-based data facilities are located in an area known for seismic activity, increasing our susceptibility to the risk that an earthquake could significantly harm the operations of these facilities. Likewise, facilities operated on the East coast of the United States are susceptible to hurricanes, winter storms and other regionally disruptive events. The facilities also could be subject to break-ins, computer viruses, sabotage, intentional acts of vandalism and other misconduct. In October 2015, we announced the opening of two European data center deployments in Amsterdam, Netherlands and Dublin, Ireland. For purposes of disaster recovery, the Netherlands and Ireland locations serve as back-up for one another.
Our data center facilities providers have no obligations to renew their agreements with us on commercially reasonable terms, or at all. If we are unable to renew our agreements with the facilities providers on commercially reasonable terms, if our agreements with our facility providers are prematurely terminated, or if in the future we add additional data center facility providers, we may experience costs or downtime in connection with the transfer to, or the addition of, new data center facilities.
Any errors, defects, disruptions or other performance problems with our services could harm our reputation and may damage our customers’ businesses. Interruptions in our services might reduce our revenue, cause us to issue credits to customers, subject us to potential liability, cause customers to terminate their subscriptions and harm our renewal rates.
We may become liable to our customers and lose customers if we have defects or disruptions in our service or if we provide poor service.
Because we deliver our application suite as a service, errors or defects in the software applications underlying our service, or a failure of our hosting infrastructure, may make our service unavailable to our customers. We are also reliant on third-party software and infrastructure, including the infrastructure of the Internet, to provide our services. Any failure of or disruption to this software and infrastructure could also make our service unavailable to our customers. Since our customers use our suite to manage critical aspects of their business, any errors, defects, disruptions in service or other performance problems with our suite, whether in connection with the day‑to‑day operation of our suite, upgrades or otherwise, could damage our customers’ businesses. If we have any errors, defects, disruptions in service or other performance problems with our suite, customers could elect not to renew, or delay or withhold payment to us, we could lose future sales or customers may make warranty claims against us, which could result in an increase in our provision for doubtful accounts, an increase in collection cycles for accounts receivable or costly litigation.
The market for cloud-based applications may develop more slowly than we expect.
Our success will depend, to a large extent, on the willingness of medium-sized businesses to accept cloud-based services for applications that they view as critical to the success of their business. Many companies have invested substantial effort and financial resources to integrate traditional enterprise software into their businesses and may be reluctant or unwilling to switch to a different application or to migrate these applications to cloud-based services. Other factors that may affect market acceptance of our application include:
• | the security capabilities, reliability and availability of cloud-based services; |
• | customer concerns with entrusting a third party to store and manage their data, especially confidential or sensitive data; |
• | our ability to minimize the time and resources required to implement our suite; |
• | our ability to maintain high levels of customer satisfaction; |
• | our ability to implement upgrades and other changes to our software without disrupting our service; |
11
• | the level of customization or configuration we offer; |
• | our ability to provide rapid response time during periods of intense activity on customer websites; and |
• | the price, performance and availability of competing products and services. |
The market for these services may not develop further, or may develop more slowly than we expect, either of which would harm our business.
If our security measures are breached and unauthorized access is obtained to a customer’s data, we may incur significant liabilities, our service may be perceived as not being secure and customers may curtail or stop using our suite.
The services we offer involve the storage of large amounts of our customers’ sensitive and proprietary information. If our security measures are breached as a result of third‑party action, employee error, malfeasance or otherwise, and someone disrupts the confidentiality, integrity, or availability our customers’ data, we could incur significant liability to our customers and to individuals or businesses whose information was being stored by our customers, our business may suffer and our reputation will be damaged. Because techniques used to obtain unauthorized access to, or to sabotage, systems change frequently and generally are not recognized until launched against a target, we may be unable to anticipate these techniques or to implement adequate preventive measures. If an actual or perceived breach of our security occurs, the market perception of the effectiveness of our security measures could be harmed and we could lose sales and customers. Such an actual or perceived breach could also cause a significant and rapid decline in our stock price and the value of our convertible senior notes (the “Notes”).
We provide service-level commitments to our customers, which could cause us to issue credits for future services if the stated service levels are not met for a given period and could significantly harm our revenue.
Our customer agreements provide service-level commitments. If we are unable to meet the stated service-level commitments or suffer extended periods of unavailability for our service, we may be contractually obligated to provide these customers with credits for future services. Our revenue could be significantly impacted if we suffer unscheduled downtime that exceeds the allowed downtimes under our agreements with our customers. In light of our historical experience with meeting our service-level commitments, we do not currently have any liabilities on our balance sheet for these commitments. Our service-level commitment to customers is generally 99.5% uptime per period, excluding scheduled maintenance. The failure to meet this level of service availability may require us to credit qualifying customers for the value of an entire month of their subscription fees, not just the value of the subscription fee for the period of the downtime. As a result, a failure to deliver services for a relatively short duration could cause us to issue these credits to all qualifying customers. Any extended service outages could harm our reputation, revenue and operating results.
In light of the Company’s historical experience with meeting its service level commitments, the Company's accrued liability related to such obligations in the accompanying consolidated financial statements is negligible.
Assertions by a third party that we infringe its intellectual property, whether successful or not, could subject us to costly and time‑consuming litigation or expensive licenses.
The software and technology industries are characterized by the existence of a large number of patents, copyrights, trademarks and trade secrets and by frequent and an increasing amount of litigation based on allegations of infringement or other violations of intellectual property rights. We have from time to time received claims from third parties alleging we are infringing their intellectual property, and as we continue to grow, the possibility of these and other intellectual property rights claims against us may increase. Our technologies or technologies that we license may not be able to withstand any third‑party claims that they infringe or otherwise violate intellectual property rights. Furthermore, many of our service agreements require us to indemnify our customers for certain third‑party intellectual property infringement claims, which could increase our costs as a result of defending such claims and may require that we pay damages if there were an adverse ruling related to any such claims. These types of claims could harm our relationships with our customers, may deter future customers from subscribing to our services or could expose us to litigation for these claims. Even if we are not a party to any litigation between a customer and a third party, an adverse outcome in any such litigation could make it more difficult for us to defend our intellectual property in any subsequent litigation in which we are a named party.
Any intellectual property rights claim against us or our customers, with or without merit, could be time‑consuming, expensive to litigate or settle and could divert management attention and financial resources. An adverse determination also could prevent us from offering our suite to our customers and may require that we procure or develop substitute services that do not infringe.
For any intellectual property rights claim against us or our customers, we may have to pay damages, license fees and/or stop using technology found to be in violation of a third party’s rights. We may have to seek a license for the technology. Such license may not be available on reasonable terms, if at all, and may significantly increase our operating expenses or may require us to restrict our business activities and limit our ability to deliver certain products and services. As a result, we may also be required to develop alternative non‑infringing technology, which could require significant effort and expense and/or cause us to alter our product and service offerings which could negatively affect our business.
Our success depends in large part on our ability to protect and enforce our intellectual property rights.
We rely on a combination of patent, copyright, service mark, trademark and trade secret laws, as well as confidentiality procedures and contractual restrictions, to establish and protect our proprietary rights, all of which provide only
12
limited protection. We have numerous issued US patents and pending US patent applications. We cannot assure you that any patents will issue from our currently pending patent applications in a manner that gives us the protection that we seek, if at all, or that any of our current patents or future patents issued to us will not be challenged, invalidated or circumvented. Any of our current patents or patents that may issue in the future from pending or future patent applications may not provide sufficiently broad protection or they may not prove to be enforceable in actions against alleged infringers. Additionally, although we have licensed from other parties proprietary technology covered by patents, we cannot be certain that any such patents will not be challenged, invalidated or circumvented. Also, we cannot assure you that any future service mark or trademark registrations will be issued for pending or future applications or that any registered service marks or trademarks will be enforceable or provide adequate protection of our proprietary rights.
We endeavor to enter into agreements with our employees and contractors and agreements with parties with whom we do business to limit access to and disclosure of our proprietary information. The steps we have taken, however, may not prevent unauthorized use or the reverse engineering of our technology. Moreover, others may independently develop technologies that are competitive to ours or infringe our intellectual property. Enforcement of our intellectual property rights also depends on our successful legal actions against these infringers, but these actions may not be successful, even when our rights have been infringed.
Furthermore, effective patent, trademark, service mark, copyright and trade secret protection may not be available in every country in which our services are available. In addition, the legal standards relating to the validity, enforceability and scope of protection of intellectual property rights in Internet‑related industries are uncertain and still evolving.
Our quarterly and annual operating results may fluctuate in the future. As a result, we may fail to meet or exceed the expectations of research analysts or investors, which could cause our stock price to decline.
Our quarterly and annual operating results may fluctuate as a result of a variety of factors, many of which are outside of our control. A decline in general macroeconomic conditions could adversely affect our customers’ ability or willingness to purchase our application suite, which could adversely affect our operating results or financial outlook. Fluctuations in our quarterly operating annual results or financial outlook may also be due to a number of additional factors, including the risks and uncertainties discussed elsewhere in this report.
Fluctuations in our operating results could cause our stock price to decline rapidly, may lead analysts to change their long‑term model for valuing our common stock, may impact our ability to retain or attract key personnel, or may cause other unanticipated issues. If our operating results or financial outlook fall below the expectations of research analysts or investors, the price of our common stock and the market value of the Notes could decline substantially.
We believe that our revenue and operating results may vary significantly in the future and that period‑to‑period comparisons of our operating results may not be meaningful. You should not rely on the results of one quarter as an indication of future performance.
We have encountered and will continue to encounter risks and difficulties frequently experienced by growing companies in rapidly changing industries.
Our company has been in existence since 1998, and much of our growth has occurred since 2004, with our revenue increasing from $17.7 million during the year ended December 31, 2004 to $741.1 million during the year ended December 31, 2015. We have encountered and will continue to encounter risks and difficulties frequently experienced by growing companies in rapidly changing industries. If we do not address these risks successfully, our business may be harmed.
The markets in which we compete are intensely competitive, and if we do not compete effectively, our operating results may be harmed.
The markets for financials/ERP, CRM, ecommerce, PSA and HCM applications are intensely competitive and rapidly changing with relatively low barriers to entry. With the introduction of new technologies and market entrants, we expect competition to intensify in the future. In addition, pricing pressures and increased competition generally could result in reduced sales, reduced margins or the failure of our service to achieve or maintain more widespread market acceptance. Often we compete to sell our application suite against existing systems that our potential customers have already made significant expenditures to install. Competition in our market is based principally upon service breadth and functionality; service performance, security and reliability; ability to tailor and customize services for a specific company, vertical or industry; ease of use of the service; speed and ease of deployment, integration and configuration; total cost of ownership, including price and implementation and support costs; professional services implementation; and financial resources of the vendor.
We face competition from both traditional software vendors and SaaS providers. Our principal competitors include Epicor Software Corporation, Intuit Inc., Microsoft Corporation, Oracle Corporation, SAP, The Sage Group plc and salesforce.com, inc. Many of our actual and potential competitors enjoy substantial competitive advantages over us, such as greater name recognition, longer operating histories, more varied products and services and larger marketing budgets, as well as substantially greater financial, technical and other resources. In addition, many of our competitors have established marketing relationships and access to larger customer bases, and have major distribution agreements with consultants, system integrators and resellers. If we are not able to compete effectively, our operating results will be harmed.
Our brand name and our business may be harmed by aggressive marketing strategies of our competitors.
Because of the early stage of development of our markets, we believe that building and maintaining brand recognition and customer goodwill is critical to our success. Our efforts in this area have, on occasion, been complicated by the marketing
13
efforts of our competitors, which may include incomplete, inaccurate and false statements about our company and our services that could harm our business. Our ability to respond to our competitors’ misleading marketing efforts may be limited under certain circumstances by legal prohibitions on permissible public communications by us as a public company.
If the prices we charge for our services are unacceptable to our customers, our operating results will be harmed.
As the market for our services matures, or as new competitors introduce new products or services that compete with ours, we may be unable to renew our agreements with existing customers or attract new customers at the same price or based on the same pricing model as previously used. As a result, it is possible that competitive dynamics in our market may require us to change our pricing model or reduce our prices, which could harm our revenue, gross margin and operating results.
If we are unable to develop new services or sell our services into new markets, our revenue growth will be harmed and we may not be able to achieve profitability.
Our ability to attract new customers and increase revenue from existing customers will depend in large part on our ability to enhance and improve our existing application suite and to introduce new services and sell into new markets. The success of any enhancement or new service depends on several factors, including the timely completion, introduction and market acceptance of the enhancement or service. Any new service we develop or acquire may not be introduced in a timely or cost‑effective manner and may not achieve the broad market acceptance necessary to generate significant revenue. Any new markets into which we attempt to sell our application, including new vertical markets and new countries or regions, may not be receptive. If we are unable to successfully develop or acquire new services, enhance our existing services to meet customer requirements or sell our services into new markets, our revenue will not grow as expected and we may not be able to achieve profitability.
Because we are a global organization and our long‑term success depends, in part, on our ability to expand our sales of our and operations outside of the United States, our business is susceptible to risks associated with international sales and operations.
We currently maintain offices outside of the United States and have sales personnel or independent consultants in several countries. Approximately one quarter of our employees are located in an office in the Philippines. We have limited experience operating in foreign jurisdictions and are rapidly building our international operations. Managing a global organization is difficult, time consuming and expensive. Our inexperience in operating our business outside of the United States increases the risk that any international expansion efforts that we may undertake will not be successful. In addition, conducting international operations subjects us to new risks that we have not generally faced in the United States. These risks include:
• | localization of our services, including translation into foreign languages and adaptation for local practices and regulatory requirements; |
• | lack of familiarity with and unexpected changes in foreign regulatory requirements; |
• | longer accounts receivable payment cycles and difficulties in collecting accounts receivable; |
• | difficulties in managing and staffing international operations; |
• | fluctuations in currency exchange rates; |
• | potentially adverse tax consequences, including the complexities of foreign value added tax systems and restrictions on the repatriation of earnings; |
• | dependence on certain third parties, including channel partners with whom we do not have extensive experience; |
• | the burdens of complying with a wide variety of foreign laws and legal standards; |
• | increased financial accounting and reporting burdens and complexities; |
• | political, social and economic instability abroad, terrorist attacks and security concerns in general; and |
• | reduced or varied protection for intellectual property rights in some countries. |
Operating in international markets also requires significant management attention and financial resources. The investment and additional resources required to establish operations and manage growth in other countries may not produce desired levels of revenue or profitability.
We rely on third‑party software, including Oracle database software, which may be difficult to replace or could cause errors or failures of our service that could lead to lost customers or harm to our reputation.
We rely on software licensed from third parties to offer our service, including database software from Oracle. This software may not continue to be available to us on commercially reasonable terms, or at all. Any loss of the right to use any of this software could result in delays in the provisioning of our service until equivalent technology is either developed by us, or,
14
if available, is identified, obtained and integrated, which could harm our business. Any errors or defects in third‑party software could result in errors or a failure of our service which could harm our business.
If we fail to maintain proper and effective internal controls, our ability to produce accurate and timely financial statements could be impaired and investors’ views of us could be harmed.
Ensuring that we have adequate internal financial and accounting controls and procedures in place so that we can produce accurate financial statements on a timely basis is a costly and time‑consuming effort that needs to be re‑evaluated frequently. Our internal control over financial reporting is a process designed to provide reasonable assurance regarding the reliability of financial reporting and the preparation of financial statements in accordance with GAAP. Although we have completed the process of documenting, reviewing and improving our internal controls and procedures for compliance with Section 404 of the Sarbanes‑Oxley Act of 2002, for the fiscal year ended December 31, 2015, there can be no assurances that control deficiencies will not be identified in the future.
Implementing any additional required changes to our internal controls may distract our officers and employees, entail substantial costs to modify our existing processes and add personnel and take significant time to complete. These changes may not, however, be effective in maintaining the adequacy of our internal controls. Any failure to maintain that adequacy, or as consequent inability to produce accurate financial statements on a timely basis, could increase our operating costs and harm our business. In addition, investors’ perceptions that our internal controls are inadequate or that we are unable to produce accurate financial statements on a timely basis may harm our stock price and make it more difficult for us to effectively market and sell our service to new and existing customers.
Our business is subject to changing regulations regarding corporate governance and public disclosure that will increase both our costs and the risk of noncompliance.
As a public company, we incur significant legal, accounting and other expenses associated with compliance with applicable laws, rules, regulations and listing requirements. In addition, the Sarbanes-Oxley Act, the Dodd-Frank Act, and rules subsequently implemented by the SEC and The New York Stock Exchange, have imposed a variety of compliance requirements on public companies, including requiring changes in corporate governance practices. In addition, the SEC and the U.S. Congress may continue to increase the scope of applicable disclosure and corporate governance-related rules. Our management and other personnel may need to devote a substantial amount of time to the compliance requirements associated with being a public company. Moreover, these laws, rules and regulations have increased and may continue to increase the scope, complexity and cost of our corporate governance, reporting and disclosure practices.
Because we recognize subscription revenue over the term of the applicable agreement, the lack of subscription renewals or new service agreements may not be reflected immediately in our operating results.
The majority of our quarterly revenue is attributable to service agreements entered into during previous quarters. A decline in new or renewed service agreements in any one quarter will not be fully reflected in our revenue in that quarter but will harm our revenue in future quarters. As a result, the effect of significant downturns in sales and market acceptance of our services in a particular quarter may not be fully reflected in our operating results until future periods. Our subscription model also makes it difficult for us to rapidly increase our revenue through additional sales in any period, because revenue from new customers must be recognized over the applicable subscription term.
Material defects or errors in the software we use to deliver our services could harm our reputation, result in significant costs to us and impair our ability to sell our services.
The software applications underlying our services are inherently complex and may contain material defects or errors, particularly when first introduced or when new versions or enhancements are released. We have from time to time found defects in our service, and new errors in our existing service may be detected in the future. Any defects that cause interruptions to the availability of our services could result in:
•a reduction in sales or delay in market acceptance of our services;
•sales credits or refunds to our customers;
•loss of existing customers and difficulty in attracting new customers;
•diversion of development resources;
•harm to our reputation; and
•increased warranty and insurance costs.
After the release of our services, defects or errors may also be identified from time to time by our internal team and by our customers. The costs incurred in correcting any material defects or errors in our services may be substantial and could harm our operating results.
Government regulation of the Internet and ecommerce is evolving, and unfavorable changes or our failure to comply with regulations could harm our operating results.
15
As Internet commerce continues to evolve, increasing regulation by federal, state or foreign agencies becomes more likely. For example, we believe increased regulation is likely in the area of data privacy, and laws and regulations applying to the solicitation, collection, processing or use of personal or consumer information could affect our customers’ ability to use and share data, potentially reducing demand for financials/ERP, CRM, PSA and ecommerce solutions and restricting our ability to store, process and share our customers’ data. In addition, taxation of services provided over the Internet or other charges imposed by government agencies or by private organizations for accessing the Internet may also be imposed. Any regulation imposing greater fees for Internet use or restricting information exchanged over the Internet could result in a decline in the use of the Internet and the viability of Internet‑based services, harming our business and operating results.
Privacy concerns and laws or other domestic or foreign regulations may reduce the effectiveness of our application suite and harm our business.
Our customers can use our service to store personal or identifying information regarding their customers and contacts. Federal, state and foreign government bodies and agencies, however, have adopted or are considering adopting laws and regulations regarding the collection, use and disclosure of personal information obtained from consumers and other individuals. The costs of compliance with, and other burdens imposed by, such laws and regulations that are applicable to the businesses of our customers may limit the use and adoption of our service and reduce overall demand for it.
In addition to government activity, privacy advocacy groups and the technology and other industries are considering various new, additional or different self‑regulatory standards that may place additional burdens on us. If the gathering of personal information were to be curtailed, financials/ERP, CRM, ecommerce, PSA and HCM solutions would be less effective, likely reducing demand for our service and harming our business.
In the past our customers have relied on NetSuite’s adherence to the U.S. Department of Commerce’s Safe Harbor Privacy Principles and compliance with the U.S.-EU and U.S.-Swiss Safe Harbor Frameworks as agreed to and set forth by the U.S. Department of Commerce, and the European Commission and Switzerland, which established a means for companies operating in Europe to transfer personally identifiable information, or PII, in compliance with the European Commission’s Directive on Data Protection (the “Directive”) and Swiss data protection laws from the European Economic Area (“EEA”) to the U.S. As a result of the October 6, 2015 European Union Court of Justice (the “ECJ”), opinion in Case C-362/14 (Schrems v. Data Protection Commissioner) regarding the adequacy of the U.S.-EU Safe Harbor Framework, the U.S.-EU Safe Harbor Framework is no longer deemed to be a valid method of compliance with restrictions set forth in the Directive (and member states’ implementations thereof) regarding the transfer of data outside of the EEA. In light of the ECJ opinion, we are offering other methods to our customers to enable compliant data transfers from the EEA to the U.S.
We may be unsuccessful in establishing a means for the transfer of data from the EEA that is acceptable to our customers. In addition, data protection regulation is an area of increased focus and changing requirements. Data protection 42 Table of Contents regulations are currently being reviewed and are expected to change in the future. There is no assurance that we will be able to meet new requirements that may be imposed on the transfer of PII from the EU to the US without incurring substantial expense or at all. We may experience reluctance or refusal by European or multi-national customers to purchase or continue to use our services due to concerns regarding their data protection obligations. In addition, we may be subject to claims, legal proceedings or other actions by individuals or governmental authorities based on data protection regulations and our commitments to customers or others. We may find it necessary to establish additional systems to maintain EU-origin data in the EEA, which may involve substantial expense and distraction from other aspects of our business.
We publicly post our privacy policies and practices concerning our processing, use and disclosure of PII provided by our website visitors. Our publication of our privacy policy and other statements we publish that provide promises and assurances about privacy and security can subject us to potential state and federal action if they are found to be deceptive or misrepresentative of our practices.
If benefits currently available under the Czech Republic government subsidy program are reduced or disallowed, our operational costs could increase.
At our product development facility in the Czech Republic, we participate in a government subsidy program for employing local residents. Under the program, the Czech Republic government will reimburse us for certain operating expenses we incur. In the second quarter of 2015, we reached the initial program's reimbursement limit. Our operational expenses were reduced by approximately $0.6 million, $1.5 million and $2.5 million, for reimbursements of eligible operating expenses incurred during the years ended December 31, 2015, 2014 and 2013, respectively. We received approximately $1.2 million, $2.2 million and $2.0 million in payments from the Czech Republic government during the years ended December 31, 2015, 2014 and 2013, respectively. If the Czech Republic government determines that our expenses are ineligible for reimbursement, our financial condition and operating results may be harmed.
Changes in financial accounting standards or practices may cause adverse, unexpected financial reporting fluctuations and harm our operating results.
A change in accounting standards or practices could harm our operating results and may even affect our reporting of transactions completed before the change is effective. New accounting pronouncements and varying interpretations of accounting pronouncements have occurred and may occur in the future. Changes to existing rules or the questioning of current practices may harm our operating results or the way we conduct our business.
Unanticipated changes in our effective tax rate could harm our future operating results.
16
We are subject to income taxes in the United States and various foreign jurisdictions, and our domestic and international tax liabilities are subject to the allocation of expenses in differing jurisdictions. Our tax rate is affected by changes in the mix of earnings and losses in countries with differing statutory tax rates, certain non‑deductible expenses arising from the requirement to expense stock options and the valuation of deferred tax assets and liabilities, including our ability to utilize our net operating losses. Increases in our effective tax rate could harm our operating results.
We may be unable to integrate acquired businesses and technologies successfully or to achieve the expected benefits of such acquisitions. We may acquire or invest in additional companies, which may divert our management’s attention, result in additional dilution to our stockholders and consume resources that are necessary to sustain our business.
We have undertaken acquisitions in the past and may continue to evaluate and consider potential strategic transactions, including acquisitions and dispositions of businesses, technologies, services, products and other assets in the future. An acquisition, investment or business relationship may result in unforeseen operating difficulties and expenditures. In particular, we may encounter difficulties assimilating or integrating the businesses, technologies, products, personnel or operations of the acquired companies, particularly if the key personnel of the acquired company choose not to work for us, the company’s software is not easily adapted to work with ours or we have difficulty retaining the customers of any acquired business due to changes in management or otherwise. Acquisitions may also disrupt our business, divert our resources and require significant management attention that would otherwise be available for development of our business. Moreover, the anticipated benefits of any acquisition, investment or business relationship may not be realized or we may be exposed to unknown liabilities.
We may in the future seek to acquire or invest in additional businesses, products, technologies or other assets. We also may enter into relationships with other businesses to expand our service offerings or our ability to provide service in foreign jurisdictions, which could involve preferred or exclusive licenses, additional channels of distribution, discount pricing or investments in other companies. Negotiating these transactions can be time‑consuming, difficult and expensive, and our ability to close these transactions may often be subject to approvals that are beyond our control. Consequently, these transactions, even if undertaken and announced, may not close. For one or more of those transactions, we may:
•issue additional equity securities that would dilute our stockholders;
•use cash that we may need in the future to operate our business;
•incur debt on terms unfavorable to us or that we are unable to repay;
•incur large charges or substantial liabilities;
• | encounter difficulties retaining key employees of the acquired company or integrating diverse software codes or business cultures; and |
•become subject to adverse tax consequences, substantial depreciation or deferred compensation charges.
Any of these risks could harm our business and operating results.
We rely on our management team and need additional personnel to grow our business, and the loss of one or more key employees or our inability to attract and retain qualified personnel could harm our business.
Our success and future growth depends to a significant degree on the skills and continued services of our management team. We do not maintain key man insurance on any members of our management team. Meeting our growth plan and our future success depends on our ability to attract, retain and motivate highly skilled technical, managerial, sales, marketing and service and support personnel, including members of our management team. Competition for sales, marketing and technology development personnel is particularly intense in the software and technology industries. As a result, we may be unable to successfully attract or retain qualified personnel. Our inability to attract and retain the necessary personnel could harm our business.
Risks Related to Ownership of our Common Stock and the Notes
Lawrence J. Ellison or members of his family, and related entities, beneficially own a significant portion of our outstanding shares of common stock, which may limit your ability to influence or control certain of our corporate actions. This concentration of ownership may also reduce the market price of our common stock and the value of the Notes and impair a takeover attempt of us.
Entities beneficially owned by Lawrence J. Ellison held an aggregate of approximately 40.1% of our common stock as of December 31, 2015. Further, Mr. Ellison, his family members, trusts for their benefit, and related entities together beneficially owned an aggregate of approximately 45.71% of our common stock as of that date. Mr. Ellison is able to exercise control over approval of significant corporate transactions, including a change of control or liquidation. In addition, if the voting restrictions that apply to NetSuite Restricted Holdings LLC, the investment entity to which Mr. Ellison has transferred his shares, lapse or are amended, Mr. Ellison will be able to exercise control over additional corporate matters, including elections of our directors. So long as Mr. Ellison continues to be either an officer or director of Oracle, these voting restrictions cannot be changed without the approval of an independent committee of Oracle’s board of directors. Mr. Ellison’s interests and investment objectives may differ from our other stockholders. Mr. Ellison is also the Chief Technology Officer, a principal
17
stockholder and Executive Chairman of the Board of Oracle Corporation. Oracle supplies us with database and other software on which we rely to provide our service and is also a potential competitor of ours.
Our Board of Directors adopted resolutions which renounce and provide for a waiver of the corporate opportunity doctrine as it relates to Mr. Ellison. As a result, Mr. Ellison has no fiduciary duty to present corporate opportunities to us. In addition, Mr. Ellison’s significant interest in us could discourage potential acquirers or result in a delay or prevention of a change in control of our company or other significant corporate transactions, even if a transaction of that sort would be beneficial to our other stockholders or in our best interest and, as a result, reduce the market price of our common stock and the value of the Notes.
Volatility in the market price and trading volume of our common stock and the Notes could adversely impact the trading price of our common stock and the Notes.
The stock market in recent years has experienced significant price and volume fluctuations that have often been unrelated to the operating performance of companies. The market price of our common stock could fluctuate significantly for many reasons, including in response to the risks described in this section, elsewhere in this report or for reasons unrelated to our operations, such as reports by industry analysts, investor perceptions or negative announcements by our customers, competitors or suppliers regarding their own performance, as well as industry conditions and general financial, economic and political instability. A decrease in the market price of our common stock would likely adversely impact the trading price of the Notes. The market price of our common stock could also be affected by possible sales of our common stock by investors who view the Notes as a more attractive means of equity participation in us and by hedging or arbitrage trading activity that we expect to develop involving our common stock. This trading activity could, in turn, affect the trading prices of our common stock and the Notes.
We may not have the ability to raise the funds necessary to settle conversions of the Notes or to repurchase the Notes upon a fundamental change, which may affect the trading price of our common stock, and our future debt may contain limitations on our ability to repurchase the Notes.
Holders of the Notes will have the right to require us to repurchase their Notes upon the occurrence of a fundamental change at a repurchase price equal to 100% of their principal amount, plus accrued and unpaid interest, if any. In addition, upon conversion of the Notes, unless we elect to deliver solely shares of our common stock to settle such conversion (other than paying cash in lieu of delivering any fractional share), we will be required to make cash payments in respect of the Notes being converted. However, we may not have enough available cash or be able to obtain financing at the time we are required to make repurchases of Notes surrendered therefor or Notes being converted, which could harm our reputation and affect the trading price of our common stock.
In addition, our ability to repurchase the Notes may be limited by law, by regulatory authority or by agreements governing our future indebtedness. Our failure to repurchase Notes at a time when the repurchase is required by the indenture would constitute a default under the indenture and could harm our reputation and affect the trading price of our common stock. A default under the indenture or the fundamental change itself could also lead to a default under agreements governing our future indebtedness. If the repayment of the related indebtedness were to be accelerated after any applicable notice or grace periods, we may not have sufficient funds to repay the indebtedness and repurchase the Notes.
The conditional conversion feature of the Notes, if triggered, may harm our financial condition and operating results.
In the event the conditional conversion feature of the Notes is triggered, holders of Notes will be entitled to convert the Notes at any time during specified periods at their option. If one or more holders elect to convert their Notes, unless we elect to satisfy our conversion obligation by delivering solely shares of our common stock (other than paying cash in lieu of delivering any fractional share), we would be required to settle a portion or all of our conversion obligation through the payment of cash, which could adversely affect our liquidity. In addition, even if holders do not elect to convert their Notes, we could be required under applicable accounting rules to reclassify all or a portion of the outstanding principal of the Notes as a current rather than long-term liability, which would result in a material reduction of our net working capital.
The accounting method for convertible debt securities that may be settled in cash, such as the Notes, could have a material effect on our reported financial results.
The Financial Accounting Standards Board, which we refer to as FASB, issued FASB Staff Position No. APB 14-1, Accounting for Convertible Debt Instruments That May Be Settled in Cash Upon Conversion (Including Partial Cash Settlement), which has subsequently been codified as Accounting Standards Codification 470-20, Debt with Conversion and Other Options, which we refer to as ASC 470-20. Under ASC 470-20, an entity must separately account for the liability and equity components of the convertible debt instruments (such as the Notes) that may be settled entirely or partially in cash upon conversion in a manner that reflects the issuer's economic interest cost. The effect of ASC 470-20 on the accounting for the Notes is that the equity component is required to be included in the additional paid-in capital section of stockholders' equity on our consolidated balance sheet, and the value of the equity component would be treated as original issue discount for purposes of accounting for the debt component of the Notes. As a result, we will be required to record a greater amount of non-cash interest expense in current periods presented as a result of the amortization of the discounted carrying value of the Notes to their face amount over the term of the Notes. We will report lower net income in our financial results because ASC 470-20 will require interest to include both the current period's amortization of the debt discount and the instrument's coupon interest, which could adversely affect our reported or future financial results, the trading price of our common stock and the trading price of the Notes.
18
In addition, under certain circumstances, we may apply the treasury stock method with respect to the Notes, the effect of which is that only the number of shares of common stock that would be necessary to settle the conversion spread, if any, are included in the diluted earnings per share calculation. If we are unable to use the treasury stock method, then we would assume issuance of the number of shares of common stock that would be necessary to settle both the principal balance of the Notes and the conversion spread, if any, and our diluted earnings per share would be harmed.
Future sales of shares by existing stockholders could cause our stock price to decline and adversely impact the trading price of the Notes.
If our existing stockholders sell or otherwise dispose of, or indicate an intention to sell or dispose of, substantial amounts of our common stock in the public market, the trading price of our common stock could decline. As of December 31, 2015, we had a total of 79,802,618 shares of our common stock outstanding. Although shares that are held by NetSuite Restricted Holdings LLC are subject to certain restrictions on disposition and a portion of the remaining shares are subject to our Insider Trading Compliance Policy during certain periods of each quarter, substantially all of the shares held by parties other than NetSuite Restricted Holdings LLC, representing 59.9% of our outstanding shares as of December 31, 2015, are freely tradable, subject to our quarterly black-out policy that applies to the shares held by our directors, officers, employees and consultants. If a significant number of these shares are sold, or if it is perceived that they will be sold, in the public market, the trading price of our common stock could decline.
Further, in the future, we may sell additional shares of our common stock to raise capital. In addition, a substantial number of shares of our common stock are reserved for issuance upon the exercise of stock options, the vesting of restricted stock units and performance share units and performance shares and upon conversion of the Notes. We cannot predict the size of future issuances or the effect, if any, that they may have on the market price for our common stock. The issuance and sale of substantial amounts of common stock, or the perception that such issuances and sales may occur, could adversely affect the trading price of the Notes and the market price of our common stock and impair our ability to raise capital through the sale of additional equity securities.
The increase in the conversion rate for Notes converted in connection with a make-whole fundamental change may not adequately compensate the holders of the Notes for any lost value of their Notes as a result of such transaction and may cause our existing stockholders to experience additional dilution.
If a make-whole fundamental change occurs prior to the maturity date, under certain circumstances, we will increase the conversion rate by a number of additional shares of our common stock for Notes converted in connection with such make-whole fundamental change, which may cause our existing stockholders to experience additional dilution. The increase in the conversion rate will be determined based on the date on which the specified corporate transaction becomes effective and the price paid (or deemed to be paid) per share of our common stock in such transaction. The increase in the conversion rate for Notes converted in connection with a make-whole fundamental change may not adequately compensate the holders of the Notes for any lost value of their Notes as a result of such transaction. In addition, if the price of our common stock in the transaction is greater than $275.00 per share or less than $86.00 per share (in each case, subject to adjustment), no additional shares will be added to the conversion rate. Moreover, in no event will the conversion rate per $1,000 principal amount of Notes as a result of this adjustment exceed shares of common stock, subject to adjustment pursuant to the terms of the Notes.
Our obligation to increase the conversion rate for Notes converted in connection with a make-whole fundamental change could be considered a penalty, in which case the enforceability thereof would be subject to general principles of reasonableness and equitable remedies.
Provisions in the indenture for the Notes may deter or prevent a business combination that may be favorable to our stockholders.
If a fundamental change occurs prior to the maturity date of the Notes, holders of the Notes will have the right, at their option, to require us to repurchase all or a portion of their Notes. In addition, if a make-whole fundamental change occurs prior to the maturity date of the Notes, we will in some cases be required to increase the conversion rate for a holder that elects to convert its Notes in connection with such fundamental change. Furthermore, the indenture for the Notes prohibits us from engaging in certain mergers or acquisitions unless, among other things, the surviving entity assumes our obligations under the Notes. These and other provisions in the indenture could deter or prevent a third party from acquiring us even when the acquisition may be favorable to our stockholders.
Any adverse rating of the Notes may cause their trading price to fall, which may affect the trading price of our common stock.
We do not intend to seek a rating on the Notes. However, if a rating service were to rate the Notes and if such rating service were to lower its rating on the Notes below the rating initially assigned to the Notes or otherwise announces its intention to put the Notes on credit watch, the trading price of the Notes could decline and the trading price of our common stock may be affected.
Anti‑takeover provisions contained in our amended and restated certificate of incorporation and amended and restated bylaws, as well as provisions of Delaware law, could delay changes in management or impair a takeover attempt of us and, as a result, reduce the market price of our common stock and the value of the Notes.
19
Our amended and restated certificate of incorporation, amended and restated bylaws and Delaware law contain provisions that could have the effect of rendering more difficult or discouraging an acquisition deemed undesirable by our Board of Directors. Our corporate governance documents include provisions:
• | authorizing blank check preferred stock, which could be issued with voting, liquidation, dividend and other rights superior to our common stock; |
• | limiting the liability of, and providing indemnification to, our directors and officers; |
• | limiting the ability of our stockholders to call and bring business before special meetings and to take action by written consent in lieu of a meeting; |
• | requiring advance notice of stockholder proposals for business to be conducted at meetings of our stockholders and for nominations of candidates for election to our Board of Directors; |
• | controlling the procedures for the conduct and scheduling of board and stockholder meetings; |
• | providing the Board of Directors with the express power to postpone previously scheduled annual meetings and to cancel previously scheduled special meetings; |
• | limiting the determination of the number of directors on our board and the filling of vacancies or newly created seats on the board to our Board of Directors then in office; and |
• | providing that directors may be removed by stockholders only for cause. |
These provisions, alone or together, could delay hostile takeovers and changes in control or changes in our management.
As a Delaware corporation, we are also subject to provisions of Delaware law, including Section 203 of the Delaware General Corporation law, which prevents some stockholders holding more than 15% of our outstanding common stock from engaging in certain business combinations without approval of the holders of substantially all of our outstanding common stock. Under Section 203, our largest stockholder, which is beneficially owned by Lawrence J. Ellison, and our current stockholders associated with members of Mr. Ellison’s family are not subject to the prohibition from engaging in such business combinations.
Any provision of our amended and restated certificate of incorporation or bylaws or Delaware law that has the effect of delaying or deterring a change in control could limit the opportunity for our stockholders to receive a premium for their shares of our common stock, and could also affect the price that some investors are willing to pay for our common stock and the Notes.
Our failure to raise additional capital or generate the cash flows necessary to expand our operations and invest in our application services could reduce our ability to compete successfully.
We may need to raise additional funds, and we may not be able to obtain additional debt or equity financing on favorable terms, if at all. If we raise additional equity or convertible debt financing, our stockholders may experience significant dilution of their ownership interests and the per share value of our common stock could decline. If we engage in additional debt financing, we may be required to accept terms that restrict our ability to incur additional indebtedness and force us to maintain specified liquidity or other ratios. If we need additional capital and cannot raise it on acceptable terms, we may not be able to, among other things:
•develop or enhance our application and services;
•continue to expand our product development, sales and marketing organizations;
•acquire complementary technologies, products or businesses;
•expand operations, in the United States or internationally;
•hire, train and retain employees; or
•respond to competitive pressures or unanticipated working capital requirements.
Item 1B. | Unresolved Staff Comments |
None.
Item 2. | Properties |
20
Our corporate headquarters is located in San Mateo, California and comprises approximately 165,000 square feet of leased space. We also have leased facilities in the following U.S. cities: Atlanta, Austin, Boston, Chicago, Denver, Minneapolis, New York, and Oklahoma City. We also have leased facilities in Australia, Canada, the Czech Republic, Hong Kong, Japan, the Netherlands, the Philippines, Spain, Singapore, Thailand, United Kingdom, and Uruguay.
We believe that our existing properties are in good condition and are suitable for the conduct of our business. As our existing leases expire and as we continue to expand our operations, we believe that suitable space will be available to us on commercially reasonable terms.
Item 3. | Legal Proceedings |
From time to time, we are involved in various legal proceedings arising from the normal course of business activities. We are not presently a party to any litigation the outcome of which, we believe, if determined adversely to us, would individually or in the aggregate have a material adverse effect on our business, operating results or financial condition.
Item 4. | Mine Safety Disclosures |
Not Applicable.
21
PART II
Item 5. | Market for the Registrant's Common Equity, Related Stockholder Matters and Issuer Purchases of Equity Securities |
Our common stock has been quoted on the New York Stock Exchange under the symbol "N". The following table sets forth for the indicated periods the high and low sales prices of our common stock as reported by the New York Stock Exchange.
For the quarters ended | High | Low | ||||||
2015: | ||||||||
December 31, 2015 | $ | 91.72 | $ | 79.28 | ||||
September 30, 2015 | 99.73 | 83.65 | ||||||
June 30, 2015 | 98.49 | 90.71 | ||||||
March 31, 2015 | $ | 107.87 | $ | 90.40 | ||||
2014: | ||||||||
December 31, 2014 | $ | 113.13 | $ | 85.12 | ||||
September 30, 2014 | 89.56 | 78.80 | ||||||
June 30, 2014 | 96.42 | 71.42 | ||||||
March 31, 2014 | $ | 119.63 | $ | 91.56 | ||||
We have never paid any cash dividends on our common stock. Our Board of Directors currently intends to retain any future earnings to support operations and to finance the growth and development of our business and does not intend to pay cash dividends on our common stock for the foreseeable future. Any future determination related to our dividend policy will be made at the discretion of our board.
As of December 31, 2015, there were 97 registered stockholders of record of our common stock. The actual number of stockholders is greater than this number of holders of record, and includes stockholders who are beneficial owners, but whose shares are held in street name by brokers and other nominees. This number of holders of record also does not include stockholders whose shares may be held in trust by other entities.
The graph set forth below compares the cumulative total stockholder return on our common stock between December 31, 2010 and December 31, 2015, with the cumulative total return of (i) the Nasdaq Composite Index and (ii) the Nasdaq Computer Index, over the same period. This graph assumes the investment of $100 on December 31, 2010 in our common stock, the Nasdaq Composite Index and the Nasdaq Computer Index, and assumes the reinvestment of dividends, if any. The graph assumes the initial value of our common stock on December 31, 2010 was the close price of $25.00 per share.
22
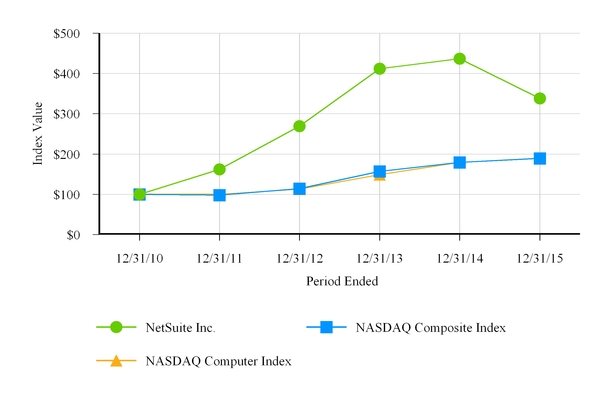
As of December 31, | ||||||||||||||||||
2010 | 2011 | 2012 | 2013 | 2014 | 2015 | |||||||||||||
NetSuite | $ | 100 | $ | 162 | $ | 269 | $ | 412 | $ | 437 | $ | 338 | ||||||
Nasdaq Composite Index | $ | 100 | $ | 98 | $ | 114 | $ | 157 | $ | 179 | $ | 189 | ||||||
Nasdaq Computer Index | $ | 100 | $ | 100 | $ | 113 | $ | 149 | $ | 179 | $ | 190 | ||||||
The comparisons shown in the graph are based upon historical data. We caution that the stock price performance shown in the graph above is not necessarily indicative of, nor is it intended to forecast, the potential future performance of our common stock.
Item 6. | Selected Financial Data |
The following selected condensed consolidated financial data should be read in conjunction with our audited consolidated financial statements and related notes thereto and with Management's Discussion and Analysis of Financial Condition and Results of Operations included elsewhere in this Annual Report. The consolidated statement of operations data for the years ended December 31, 2015, 2014 and 2013 and the selected condensed consolidated balance sheet data as of December 31, 2015 and 2014 are derived from, and are qualified by reference to, the audited consolidated financial statements included in this Annual Report. The condensed consolidated statement of operations data for the fiscal years ended December 31, 2012 and 2011 and the consolidated balance sheet data as of December 31, 2013, 2012 and 2011 are derived from audited consolidated financial statements which are not included in this Annual Report.
23
Condensed Consolidated Statements of Operations Data | |||||||||||||||||||
(Dollars and shares in thousands, except per share amounts) | |||||||||||||||||||
Year ended December 31, | |||||||||||||||||||
2015 | 2014 | 2013 | 2012 | 2011 | |||||||||||||||
Revenue: | |||||||||||||||||||
Subscription and support | $ | 593,093 | $ | 447,782 | $ | 333,556 | $ | 252,903 | $ | 199,579 | |||||||||
Professional services and other | 148,056 | 108,502 | 80,952 | 55,922 | 36,747 | ||||||||||||||
Total revenue | 741,149 | 556,284 | 414,508 | 308,825 | 236,326 | ||||||||||||||
Cost of revenue: | |||||||||||||||||||
Subscription and support | 97,021 | 72,007 | 55,269 | 41,857 | 33,083 | ||||||||||||||
Professional services and other | 148,407 | 104,803 | 79,925 | 53,706 | 37,777 | ||||||||||||||
Total cost of revenue (1) | 245,428 | 176,810 | 135,194 | 95,563 | 70,860 | ||||||||||||||
Gross profit | 495,721 | 379,474 | 279,314 | 213,262 | 165,466 | ||||||||||||||
Operating expenses: | |||||||||||||||||||
Product development (1) | 135,544 | 106,706 | 78,312 | 52,739 | 43,531 | ||||||||||||||
Sales and marketing (1) | 388,741 | 290,961 | 210,079 | 154,294 | 120,172 | ||||||||||||||
General and administrative (1) | 87,101 | 65,138 | 51,693 | 38,469 | 31,951 | ||||||||||||||
Total operating expenses | 611,386 | 462,805 | 340,084 | 245,502 | 195,654 | ||||||||||||||
Operating loss | (115,665 | ) | (83,331 | ) | (60,770 | ) | (32,240 | ) | (30,188 | ) | |||||||||
Other income / (expenses), net and income taxes (1) | (9,078 | ) | (16,706 | ) | (9,639 | ) | (2,989 | ) | (1,819 | ) | |||||||||
Net loss | $ | (124,743 | ) | $ | (100,037 | ) | $ | (70,409 | ) | $ | (35,229 | ) | $ | (32,007 | ) | ||||
Net loss per common share | $ | (1.59 | ) | $ | (1.31 | ) | $ | (0.95 | ) | $ | (0.50 | ) | $ | (0.48 | ) | ||||
Weighted average number of shares used in computing net loss per common share | 78,521 | 76,174 | 74,085 | 70,713 | 66,919 | ||||||||||||||
(1) Includes stock-based compensation expense, amortization of acquisition-related intangibles, transaction costs for business combinations, costs associated with the settlement of a patent dispute, non-cash interest expense on convertible debt and income tax benefits associated with business combinations are as follows: | |||||||||||||||||||
Year ended December 31, | |||||||||||||||||||
2015 | 2014 | 2013 | 2012 | 2011 | |||||||||||||||
Cost of revenue: | |||||||||||||||||||
Subscription and support | $ | 12,200 | $ | 8,342 | $ | 6,135 | $ | 4,691 | $ | 3,568 | |||||||||
Professional services and other | 12,668 | 10,328 | 8,834 | 5,978 | 4,138 | ||||||||||||||
Operating expenses: | |||||||||||||||||||
Product development | 32,787 | 28,587 | 23,543 | 15,301 | 12,015 | ||||||||||||||
Sales and marketing | 45,714 | 38,897 | 26,749 | 16,588 | 13,437 | ||||||||||||||
General and administrative | 34,010 | 25,988 | 19,123 | 11,803 | 9,662 | ||||||||||||||
Other income / (expenses) and income taxes, net | (5,065 | ) | (12,910 | ) | (5,935 | ) | — | — | |||||||||||
Total | $ | 142,444 | $ | 125,052 | $ | 90,319 | $ | 54,361 | $ | 42,820 | |||||||||
24
Condensed Consolidated Balance Sheet Data | |||||||||||||||||||
(Dollars in thousands) | |||||||||||||||||||
Year ended December 31, | |||||||||||||||||||
2015 | 2014 | 2013 | 2012 | 2011 | |||||||||||||||
Cash and cash equivalents | $ | 289,966 | $ | 367,769 | $ | 451,577 | $ | 185,859 | $ | 141,448 | |||||||||
Working capital, excluding deferred revenue | 541,036 | 581,112 | 531,334 | 242,524 | 176,447 | ||||||||||||||
Total assets | 1,140,976 | 922,239 | 772,399 | 369,775 | 281,180 | ||||||||||||||
Deferred revenue | 427,729 | 314,506 | 224,607 | 161,416 | 111,698 | ||||||||||||||
Convertible 0.25% senior notes, net | 277,955 | 265,710 | 254,038 | — | — | ||||||||||||||
Long-term debt (includes current portion) | 5,928 | 8,702 | 11,756 | 1,985 | 4,130 | ||||||||||||||
Equity | $ | 306,201 | $ | 234,234 | $ | 210,052 | $ | 158,769 | $ | 128,010 | |||||||||
ITEM 7. | Management's Discussion and Analysis of Financial Condition and Results of Operations |
This Annual Report on Form 10-K contains "forward-looking statements" that involve risks and uncertainties, as well as assumptions that, if they never materialize or prove incorrect, could cause our results to differ materially from those expressed or implied by such forward-looking statements. Such forward-looking statements include any expectation of earnings, revenues or other financial items; any statements of the plans, strategies and objectives of management for future operations; factors that may affect our operating results; statements concerning new products or services; statements related to future capital expenditures; statements related to future economic conditions or performance; statements as to industry trends and other matters that do not relate strictly to historical facts or statements of assumptions underlying any of the foregoing. These statements are often identified by the use of words such as "anticipate," "believe," "continue," "could," "estimate," "expect," "intend," "may," or "will," and similar expressions or variations. Such forward-looking statements are subject to risks, uncertainties and other factors that could cause actual results and the timing of certain events to differ materially from future results expressed or implied by such forward-looking statements. Factors that could cause or contribute to such differences include, but are not limited to those discussed in the section titled "Risk Factors" included in Item 1A of Part I of this Annual Report on Form 10-K, and the risks discussed in our other SEC filings.
We urge you to consider these factors carefully in evaluating the forward-looking statements contained in this Annual Report on Form 10-K. These statements are based on the beliefs and assumptions of our management based on information currently available to management. The forward-looking statements included in this Annual Report are made only as of the date of this Annual Report on Form 10-K. All subsequent written or oral forward-looking statements attributable to our company or persons acting on our behalf are expressly qualified in their entirety by these cautionary statements. We do not undertake, and specifically disclaim, any obligation to update any forward-looking statements to reflect the occurrence of events or circumstances after the date of such statements except as required by law.
Overview
We are the industry's leading provider of cloud-based financials/ERP and omnichannel commerce software suites. In addition to financials/ERP and omnichannel commerce software suites, we offer a broad suite of applications, including accounting, CRM, ecommerce and retail management, PSA and HCM, which enable companies to manage most of their core business operations in our single integrated suite. Our software allows businesses to automate operations, streamline processes and access real-time business information anytime, anywhere.
We also offer customer support and professional services related to implementing and supporting our suite of applications. We deliver our suite over the Internet as a SaaS model.
In 1999, we released our first application, NetLedger, which focused on accounting applications. We then released ecommerce functionality in 2000 and CRM and sales force automation functionality in 2001. In 2002, we released our next generation suite under the name NetSuite to which we have regularly added features and functionality. In December 2007, we went public. In 2008, we acquired OpenAir, and in 2009 we acquired QuickArrow Inc., both of which offer professional services automation and project portfolio management products.
Our headquarters are located in San Mateo, California. We were incorporated in California in September 1998 and reincorporated in Delaware in November 2007. We conduct our business worldwide, with international locations in Canada, Europe, Asia, Australia and Uruguay.
On August 5, 2015, we completed the purchase of all the outstanding equity of Monexa Services Inc. ("Monexa"), a private company that provides cloud-based invoicing and payment services for its customers. Monexa functionality will enhance our existing invoicing and payment solution. Beginning in the third quarter of 2015, Monexa assets, liabilities and operating results are reflected in our consolidated financial statements from the date of acquisition. On the closing date, we paid approximately $33.1 million in cash. Of the consideration paid, $5.7 million is being held in escrow for up to 15 months following the close of the transaction in the event of certain breaches of representations, warranties and certain potential tax obligations covered in the purchase agreement. In connection with the transaction, the Monexa Board of Directors accelerated
25
the vesting of certain Monexa employee stock options that were exercised shortly before the closing date, August 5, 2015. Since Monexa accelerated the stock option vesting in contemplation of the business combination, we were required to record the $1.8 million in net proceeds received by Monexa employees as compensation cost in the general and administrative expense line item of our financial statements. Acquisition related transaction costs amounted to $4.0 million and are also reflected as general and administrative expense in our statement of operations. As a result of the Monexa acquisition, we will amortize $13.3 million in intangible assets over the next five years.
On June 8, 2015, we completed the purchase of all the outstanding equity of Bronto Software, Inc. (“Bronto"), a private company that provides a cloud-based marketing platform for its customers to drive revenue through their email, mobile and social campaigns. Bronto functionality will enhance our existing email marketing solution and our existing omnichannel commerce platform. Beginning in the second quarter of 2015, Bronto assets, liabilities and operating results are reflected in our consolidated financial statements from the date of acquisition. We paid approximately $98.2 million in cash and issued 1,030,508 unregistered shares of our common stock with a fair value of $85.9 million, inclusive of a discount from the quoted market price due to certain trading restrictions associated with the shares. Of the consideration paid, $39.6 million is being held in escrow for up to 18 months following the close of the transaction in the event of certain breaches of representations and warranties covered in the purchase agreement. Another $3.9 million is being held in escrow for up to two years as protection against tax contingencies and losses. Acquisition related transaction costs amounted to $5.3 million and are reflected as general and administrative expense in the statement of operations. As a result of the Bronto acquisition, we will amortize $32.6 million in intangible assets over the next seven years.
Key Components of Our Results of Operations
Revenue
Our revenue has grown from $17.7 million during the year ended December 31, 2004 to $741.1 million during the year ended December 31, 2015.
We generate sales directly through our sales team and, to a lesser extent, indirectly through channel partners. We sell our service to customers across a broad spectrum of industries, and we have tailored our service for wholesalers/distributors, manufacturers, e-tailers, services companies and software companies. The primary target customers for our service are medium-sized businesses and divisions of large companies. An increasing percentage of our customers and our revenue have been derived from larger businesses within this market. For the year ended December 31, 2015, we did not have any single customer that accounted for more than 3% of our revenue.
We are pursuing a number of strategies that we believe will enable us to continue to grow. The goals of those strategic objectives are to continue to move up-market, to increase the use of NetSuite as a platform, and to extend the verticalization of our product line. Although we have made progress toward our goals in recent periods, there are still many areas where we believe that we can continue to grow. To achieve these goals, we are focused on the following initiatives:
• | Growth of sales of OneWorld, our platform for ERP, CRM, PSA and ecommerce capabilities in multi-currency environments across multiple subsidiaries and legal entities, which supports the needs of large, standalone companies, and divisions of large enterprises; | ||
• | Strengthening our offerings for targeted industries such as wholesale/distribution, manufacturing, e-tail, retail, technology and professional services by adding deeper verticalized functionality; and | ||
• | Developing our SuiteCloud ecosystem to enable third parties to extend our offerings with their vertical expertise or horizontal solution. | ||
We experience competitive pricing pressure when our products are compared with solutions that address a narrower range of customer needs or are not fully integrated (for example, when compared with ecommerce or CRM stand-alone solutions). In addition, since we sell primarily to medium-sized businesses, we also face pricing pressure in terms of the more limited financial resources or budgetary constraints of many of our target customers. We do not currently experience significant pricing pressure from competitors that offer a similar cloud-based integrated business management suite.
We sell our application suite pursuant to subscription agreements. The duration of these agreements is generally one to three years. We rely in part on a large percentage of our customers to renew their agreements to drive our revenue growth. Our customers have no obligation to renew their subscriptions after the expiration of their subscription period.
We generally invoice our customers in advance in monthly, annual or quarterly installments, and typical payment terms provide that our clients pay us within 30 to 60 days of invoice. Amounts that have been invoiced where the customer has a legal obligation to pay are recorded in accounts receivable and deferred revenue. As of December 31, 2015, we had deferred revenue of $427.7 million.
Backlog was approximately $413.5 million and $325.2 million as of December 31, 2015 and 2014, respectively. Of the $413.5 million in backlog as of December 31, 2015, $245.3 million was short-term backlog and $168.2 million was long-term backlog. The $325.2 million in backlog as of December 31, 2014 included $182.8 million in short-term backlog and
26
$142.4 million in long-term backlog. Backlog represents future billings under our subscription agreements that have not been invoiced or have not been recorded as deferred revenue. We expect that the amount of backlog may change from year-to-year for several reasons, including specific timing and duration of large customer subscription agreements, varying billing cycles of non-cancelable subscription agreements, the specific timing of customer renewals, foreign currency fluctuations, the timing of when unbilled deferred revenue is to be recognized as revenue and changes in customer financial circumstances. For multi-year subscription agreements billed annually, the associated backlog is typically high at the beginning of the contract period, zero immediately prior to expiration and increases if the agreement is renewed. Low backlog attributable to a particular subscription agreement is typically associated with an impending renewal and is not an indicator of the likelihood of renewal or future revenue of that customer. Accordingly, we expect that the amount of backlog may change from year to year depending in part upon the number of subscription agreements in particular stages in their renewal cycle. Such fluctuations are not reliable indicators of future revenues.
For the most part, our subscription agreements provide service level commitments of 99.5% uptime per period, excluding scheduled maintenance. The failure to meet this level of service availability may require us to credit qualifying customers up to the value of an entire month of their subscription and support fees. In light of the Company’s historical experience with meeting its service level commitments, the Company's accrued liability related to such obligations in the accompanying consolidated financial statements is negligible.
Revenue by geographic region, based on the billing address of the customer, was as follows for the periods presented:
Year ended December 31, | |||||||||||
2015 | 2014 | 2013 | |||||||||
(dollars in thousands) | |||||||||||
United States | $ | 553,186 | $ | 414,172 | $ | 308,513 | |||||
International | 187,963 | 142,112 | 105,995 | ||||||||
Total revenue | $ | 741,149 | $ | 556,284 | $ | 414,508 | |||||
Percentage of revenue generated outside of the United States | 25 | % | 26 | % | 26 | % | |||||
Employees
As of December 31, 2015, our headcount was 4,603 employees including 1,394 employees in sales and marketing, 1,706 employees in operations, professional services, training and customer support, 1,058 employees in product development, and 445 employees in a general and administrative capacity.
Cost of Revenue
Subscription and support cost of revenue primarily consists of costs related to hosting our application suite, providing customer support, data communications expenses, personnel and related costs of operations, stock-based compensation, software license fees, outsourced subscription services, costs associated with website development activities, allocated overhead which includes IT, facility and recruiting costs, amortization expense associated with capitalized internal use software and acquired developed technology, and related plant and equipment depreciation and amortization expenses. These costs are partially offset by a government subsidy credit received from the Czech government. See Product Development expenses below.
Professional services and other cost of revenue primarily consists of personnel and related costs for our professional services employees and executives, external consultants, stock-based compensation and allocated overhead.
We allocate overhead such as facility costs, information technology costs and employee benefit costs to all departments based on headcount. As such, general overhead expenses are reflected in cost of revenue and each operating expense category.
We expect cost of revenue to remain relatively constant as a percentage of revenue over time; however, it could fluctuate period to period depending on the growth of our professional services business and any associated increased costs relating to the delivery of professional services and the timing of significant expenditures.
Operating Expenses
Product Development
Product development expenses primarily consist of personnel and related costs for our product development employees and executives, including salaries, stock-based compensation, employee benefits and allocated overhead which includes IT, facility and recruiting costs. Our product development efforts have been devoted primarily to increasing the functionality and enhancing the ease of use of our on-demand application suite as well as localizing our product for international use. A key component of our strategy is to expand our business internationally. This will require us to conform our application to comply with local regulations and languages, causing us to incur additional expenses related to translation and localization of our application for use in other countries.
27
At our product development facility in the Czech Republic, we participate in a government program that subsidizes us for employing local residents. Under the program, the Czech government will reimburse us for certain operating expenses we incur. During the years ended December 31, 2015, 2014 and 2013, we reduced our cost of subscription revenue and product development expenses for eligible operational expenses we expect the Czech government to reimburse. We reached the program's reimbursement limit in 2015. Currently, we are evaluating alternative subsidy employment plans offered by the Czech Republic and other countries.
In 2016, we expect product development expenses to increase in absolute dollars as we continue to extend our service offerings in other countries, and as we expand and enhance our application suite technologies. Such expenses may vary due to the timing of these offerings and technologies.
Sales and Marketing
Sales and marketing expenses primarily consist of personnel and related costs for our sales and marketing employees and executives, including wages, benefits, bonuses, commissions and training, stock-based compensation, commissions paid to our channel partners, the cost of marketing programs such as on-line lead generation, promotional events, webinars and other meeting costs, amortization of intangible assets related to trade name and customer relationships, and allocated overhead which includes IT, facility and recruiting costs. We market and sell our application suite worldwide through our direct sales organization and indirect distribution channels such as strategic resellers. We capitalize and amortize our direct and channel sales commissions over the period the related revenue is recognized.
We expect to continue to invest in sales and marketing to pursue new customers and expand relationships with existing customers. As such, we expect our sales and marketing expenses to increase in absolute dollars in 2016.
General and Administrative
General and administrative expenses primarily consist of personnel and related costs for executive, finance, human resources and administrative personnel, stock-based compensation, legal and other professional fees, other corporate expenses and allocated overhead.
In 2016, we expect our general and administrative expenses to increase in absolute dollars as we continue to expand our business.
Income Taxes
Since inception, we have incurred annual operating losses and, accordingly, have not recorded a provision for income taxes for any of the periods presented other than provisions for state, foreign income, and withholding taxes.
Critical Accounting Policies and Judgments
Our consolidated financial statements are prepared in accordance with GAAP in the United States of America. The preparation of these consolidated financial statements requires us to make estimates and assumptions that affect the reported amounts of assets, liabilities, revenue, costs and expenses and related disclosures. We base our estimates on historical experience and on various other assumptions that we believe to be reasonable under the circumstances. In many instances, we could have reasonably used different accounting estimates, and in other instances changes in the accounting estimates are reasonably likely to occur from period-to-period. Accordingly, actual results could differ significantly from the estimates made by our management. To the extent that there are material differences between these estimates and actual results, our future financial statement presentation, financial position, results of operations and cash flows will be affected.
In many cases, the accounting treatment of a particular transaction is specifically dictated by GAAP and does not require management's judgment in its application, while in other cases, significant judgment is required in selecting among available alternative accounting standards that allow different accounting treatment for similar transactions. We consider these policies requiring significant management judgment to be critical accounting policies. These critical accounting policies are:
• | Revenue recognition; | ||
• | Deferred commissions; | ||
• | Accounting for stock-based compensation; and | ||
• | Other intangible assets. | ||
A description of our critical accounting policies and judgments for those areas are presented below. In addition, please refer to the Notes to Consolidated Financial Statements for further discussion of our accounting policies.
Revenue Recognition
28
We generate revenue from two sources: (1) subscription and support services; and (2) professional services and other. Subscription and support revenue includes subscription fees from customers accessing our cloud-based application suite and support fees from customers purchasing support. Our arrangements with customers do not provide the customer with the right to take possession of the software supporting the cloud-based application service at any time. Professional services and other revenue include fees from consultation services to support the business process mapping, configuration, data migration, integration and training. Amounts that have been invoiced are recorded in accounts receivable and in deferred revenue or revenue, depending on whether the revenue recognition criteria have been met.
For the most part, subscription and support agreements are entered into for 12 to 36 months. In aggregate, more than 90% of the professional services component of the arrangements with customers is performed within 300 days of entering into a contract with the customer.
For the most part, the subscription agreements provide service-level commitments of 99.5% uptime per period, excluding scheduled maintenance. The failure to meet this level of service availability may require us to credit qualifying customers up to the value of an entire month of their subscription and support fees. In light of the Company’s historical experience with meeting its service level commitments, the Company's accrued liability related to such obligations in the accompanying consolidated financial statements is negligible.
We commence revenue recognition when all of the following conditions are met:
• | there is persuasive evidence of an arrangement; |
• | the service is being provided to the customer; |
• | the collection of the fees is reasonably assured; and |
• | the amount of fees to be paid by the customer is fixed or determinable. |
In most instances, revenue from a new customer acquisition is generated under sales agreements with multiple elements, comprised of subscription and support fees from customers accessing our cloud-based application suite and professional services associated with consultation services. We evaluate each element in a multiple-element arrangement to determine whether it represents a separate unit of accounting. An element constitutes a separate unit of accounting when the delivered item has standalone value and delivery of the undelivered element is probable and within our control. Subscription and support have standalone value because we routinely sell it separately. For the most part, professional services have standalone value because we have sold professional services separately, and there are several third party vendors that routinely provide similar professional services to our customers on a standalone basis.
We allocate revenue to each element in an arrangement based on a selling price hierarchy. The selling price for a deliverable is based on its vendor-specific objective evidence (“VSOE”), if available, third-party evidence (“TPE”), if VSOE is not available, or estimated selling price (“ESP”), if neither VSOE nor TPE is available. As we have been unable to establish VSOE or TPE for the elements of our sales arrangements, we establish the ESP for each element primarily by considering the weighted average of actual sales prices of professional services sold on a standalone basis and subscription and support including various add-on modules when sold together without professional services, and other factors such as gross margin objectives, pricing practices and growth strategy. The consideration allocated to subscription and support is recognized as revenue over the contract period commencing when the subscription service is made available to the customer. The consideration allocated to professional services is recognized as revenue using the proportional performance method.
The total arrangement fee for a multiple element arrangement is allocated based on the relative ESP of each element. However, since the professional services are generally completed prior to completion of delivery of subscription and support services, the revenue recognized for professional services in a given reporting period does not include fees subject to delivery of subscription and support services. This results in the recognition of revenue for professional services that is generally no greater than the contractual fees for those professional services.
For single element sales agreements, subscription and support revenue is recognized ratably over the contract term beginning on the provisioning date of the contract. We recognize professional services revenue using the proportional performance method for single element arrangements.
Deferred Commissions
We capitalize commission costs that are incremental and directly related to the acquisition of customer contracts. Commission costs are accrued and capitalized upon execution of the sales contract by the customer. Payments to partners and most sales personnel are made shortly after the receipt of the related customer payment. Payments to managers and above are made either partially or in full once sales contracts are executed. Deferred commissions are amortized over the term of the related non-cancelable customer contract and are recoverable through the related future revenue streams. We believe this is the preferable method of accounting as the commission costs are so closely related to the revenue from the customer contracts that they should be expensed over the same period that the related revenue is recognized. We capitalized commission costs of $119.1 million, $95.5 million and $70.4 million during the years ended December 31, 2015, 2014 and 2013, respectively.
Accounting for Stock-Based Compensation
We recognize the fair value of stock-based compensation in the financial statements over the requisite service period of the individual grants, which generally equals a four year vesting period. We recognize compensation expense for stock
29
option awards, restricted stock awards, restricted stock unit awards and employee stock purchase plan awards on a straight-line basis over the requisite service period. We recognize compensation expense related to performance share awards based on the accelerated method which recognizes a larger portion of the expense during the beginning of the vesting period than in the end of the vesting period. Estimates are used in determining the fair value of stock option awards and employee stock purchase plan awards using a Black-Scholes model. The fair value of restricted stock, restricted stock units performance share and performance share units is generally determined based on the intrinsic value of the award on the grant date.
Effective the first quarter of 2014, we changed our methodology for estimating the expected term assumption used to determine employee stock option grant fair value. We changed from the simplified method to a historical data method because we believe we have sufficient data to estimate the stock option exercise period based on historical stock option activity and historical employee termination data.
In recent years, we have awarded more restricted stock, restricted stock units and performance share units than granted stock options. Consequently, our restricted stock, restricted stock units and performance share units stock-based compensation expense represents a larger portion of total stock-based compensation expense recorded in our financial statements than stock options.
As a result of our stock-based compensation activity, we recorded $109.1 million, $96.5 million and $73.7 million of stock-based compensation during the years ended December 31, 2015, 2014 and 2013, respectively, excluding the effect previously capitalized stock-based compensation amortized during the year. Please see Note 13 of Notes to the Consolidated Financial Statements.
Other Intangible Assets
We allocated a portion of the purchase price of the acquisition of our acquired businesses to intangible assets, including customer relationships, developed technology and trade names that are being amortized over their estimated useful lives of one to seven years. We also allocated a portion of the purchase price to tangible assets and assessed the liabilities to be recorded as part of the purchase price. The estimates we made in allocating the purchase price to tangible and intangible assets, and in assessing liabilities recorded as part of the purchase, involved the application of judgment and the use of estimates and these could significantly affect our operating results and financial position.
We continually evaluate whether events or circumstances have occurred that indicate that the estimated remaining useful life of our long-lived assets, including intangible assets, may warrant revision or that the carrying value of these assets may be impaired. Any write-downs are treated as permanent reductions in the carrying amount of the assets. We must use judgment in evaluating whether events or circumstances indicate that useful lives should change or that the carrying value of assets has been impaired. Any resulting revision in the useful life or the amount of impairment also requires judgment. Any of these judgments could affect the timing or size of any future impairment charges. Revision of useful lives or impairment charges could significantly affect our operating results and financial position.
Results of Operations
Revenue, Cost of Revenue, Gross Profit and Gross Margin
30
Our revenue, cost of revenue, gross profit and gross margin was as follows for the periods presented:
Year ended December 31, | |||||||||||
2015 | 2014 | 2013 | |||||||||
(dollars in thousands) | |||||||||||
Revenue: | |||||||||||
Subscription and support | $ | 593,093 | $ | 447,782 | $ | 333,556 | |||||
Professional services and other | 148,056 | 108,502 | 80,952 | ||||||||
Total revenue | 741,149 | 556,284 | 414,508 | ||||||||
Cost of revenue (1): | |||||||||||
Subscription and support | 97,021 | 72,007 | 55,269 | ||||||||
Professional services and other | 148,407 | 104,803 | 79,925 | ||||||||
Total cost of revenue | 245,428 | 176,810 | 135,194 | ||||||||
Gross profit | $ | 495,721 | $ | 379,474 | $ | 279,314 | |||||
Gross margin | 67% | 68% | 67% | ||||||||
(1) Includes stock-based compensation expense and amortization of intangible assets of: | |||||||||||
Cost of revenue: | |||||||||||
Subscription and support | $ | 12,200 | $ | 8,342 | $ | 6,135 | |||||
Professional services and other | 12,668 | 10,328 | 8,834 | ||||||||
$ | 24,868 | $ | 18,670 | $ | 14,969 | ||||||
Twelve Months Ended December 31, 2015 as Compared to the Twelve Months Ended December 31, 2014
Revenue for the year ended December 31, 2015 increased $184.9 million, or 33%, compared to the same period in 2014.
Subscription and support revenue: Subscription and support revenue for the year ended December 31, 2015 increased $145.3 million, or 32%, compared to the same period in 2014. The increase was primarily the result of an $89.5 million increase in revenue resulting from the acquisition of new customers, including $20.0 million in revenue related to Bronto, and a $55.8 million increase in revenue from existing customers. Additionally, subscriptions and support revenue increased during the year due to an increase in number of customers and continued adoption of OneWorld.
Professional services and other revenue: Professional services and other revenue for the year ended December 31, 2015 increased $39.6 million, or 36%, compared to the same period in 2014. The increase was primarily the result of a $73.8 million increase in revenue resulting from the acquisition of new customers including $2.1 million in revenue related to Bronto. The increase in professional services and other revenue was partially offset by a $34.2 million decrease in revenue from existing customers related to services purchased in connection with the initial implementation of our product in 2014 that did not recur for those customers in 2015. Additionally, our billable professional services hours increased as a result of an increase in customer demand and headcount, while our average consulting rates for professional services decreased slightly.
Revenue generated outside of the United States was $188.0 million, or 25%, of our revenue during the year ended December 31, 2015, as compared to $142.1 million, or 26% of our revenue, during the same period in 2014. The decrease resulted from revenue in the United States growing at a higher rate than revenue outside the United States.
Cost of revenue for the year ended December 31, 2015 increased $68.6 million, or 39%, compared to the same period in 2014.
Subscription and support cost of revenue: Subscription and support cost of revenue for the year ended December 31, 2015 increased $25.0 million, or 35%, compared to the same period in 2014. The increase was primarily the result of a $15.9 million increase in data center production costs, a $6.5 million increase in personnel costs and a $2.6 million increase in IT, facility and other operating expenses. Data center and other production costs increased due to an increase in depreciation of new equipment as a result of our data center expansion, an increase in amortization of intangibles related to our 2015 and 2014 business acquisitions and an increase in support costs, maintenance costs and other operational costs associated with an increase in our data center capacity and activity. Personnel costs increased due to an overall increase in headcount and an increase in incentive bonuses. IT, facility and other operating expenses related to our data center increased due to an increase in costs associated with our global expansion.
Professional services and other cost of revenue: Professional services and other cost of revenue for the year ended December 31, 2015 increased $43.6 million, or 42%, compared to the same period in 2014. The increase was primarily the result of a $38.5 million increase in personnel costs and a $7.7 million increase in IT, facility, partially offset by a $2.6 million decrease in fees related to outsourced consulting services. Personnel costs increased due to an overall increase in headcount and annual merit increases. Headcount increased as a result of an increase in the demand for our professional services. Our
31
increase in headcount also resulted in a decrease in outside consulting costs. IT, facility and other operating expenses related to our professional services increased primarily due to our global expansion.
Our gross margin was 67% during the year ended December 31, 2015 and 68% for the same period in 2014. Our gross margin decreased due to an increase in the mix of professional service business which contains a lower gross margin than subscription revenue. Professional services gross margin is lower in comparison to the same period in the prior year because we are integrating recently hired consultants into our professional services operations and from a slight decrease in the average consulting rates in 2015 compared to 2014.
Twelve Months Ended December 31, 2014 as Compared to the Twelve Months Ended December 31, 2013
Revenue for the year ended December 31, 2014 increased $141.8 million, or 34%, compared to the same period in 2013.
Subscription and support revenue: Subscription and support revenue for the year ended December 31, 2014 increased $114.2 million, or 34%, compared to the same period in 2013. The increase was primarily the result of a $69.9 million increase in revenue resulting from the acquisition of new customers and a $44.3 million increase in revenue from existing customers. Additionally, subscriptions and support revenue increased during the year due to an increase in number of customers and continued adoption of OneWorld.
Professional services and other revenue: Professional services and other revenue for the year ended December 31, 2014 increased $27.6 million, or 34%, compared to the same period in 2013. The increase was primarily the result of a $54.2 million increase in revenue resulting from the acquisition of new customers. The increase in professional services and other revenue was partially offset by a $26.6 million decrease in revenue from existing customers related to services purchased in connection with the initial implementation of our product in 2013 that did not recur for those customers in 2014. Additionally, demand for our professional services increased during 2014, while our average consulting rates for professional services remained constant.
Revenue generated outside of the United States was $142.1 million, or 26%, of our revenue during the year ended December 31, 2014, as compared to $106.0 million, or 26%, during the same period in 2013.
Cost of revenue for the year ended December 31, 2014 increased $41.6 million, or 31%, compared to the same period in 2013.
Subscription and support cost of revenue: Subscription and support cost of revenue for the year ended December 31, 2014 increased $16.7 million, or 30%, compared to the same period in 2013. The increase was primarily the result of a $9.9 million increase in data center production costs, a $5.0 million increase in personnel costs and a $1.8 million increase in IT, facility and other operating expenses. Data center and other production costs increased due to an increase in support costs, depreciation of new equipment, amortization of intangibles related to our 2014 and 2013 business acquisitions, maintenance costs and other operational costs associated with an increase in our data center capacity and activity. Personnel costs increased due to an overall increase in headcount and an increase in incentive bonuses. IT, facility and other operating expenses related to our data center increased due to an increase in recruiting and other costs incurred to grow our business.
Professional services and other cost of revenue: Professional services and other cost of revenue for the year ended December 31, 2014 increased $24.9 million, or 31%, compared to the same period in 2013. The increase was primarily the result of a $17.9 million increase in personnel costs, a $4.9 million increase in IT and facility expenses and other operating expenses and a $2.1 million increase in fees related to outsourced consulting services. Personnel costs increased due to an overall increase in headcount and annual merit increases. Headcount increased as a result of an increase in the demand for our professional services. IT, facility, recruiting and other operating expenses related to our professional services increased primarily due to our global expansion. The net increase in outsourced consulting fees resulted from professional service fees incurred to develop our professional services organization, partially offset by a decrease in other outside consulting costs.
Our gross margin was 68% during the year ended December 31, 2014 and 67% for the same period in 2013. Our gross margin increased primarily due to an increase in the average selling price on customer deals and because our gross margin for subscription services is higher than our gross margin for professional services.
Operating Expenses
Operating expenses were as follows for the periods presented:
32
Year ended December 31, | ||||||||||||||||||||
2015 | 2014 | 2013 | ||||||||||||||||||
Amount | % of revenue | Amount | % of revenue | Amount | % of revenue | |||||||||||||||
(dollars in thousands) | ||||||||||||||||||||
Operating expenses (1): | ||||||||||||||||||||
Product development | $ | 135,544 | 18 | % | $ | 106,706 | 19 | % | $ | 78,312 | 19 | % | ||||||||
Sales and marketing | 388,741 | 52 | % | 290,961 | 52 | % | 210,079 | 51 | % | |||||||||||
General and administrative | 87,101 | 12 | % | 65,138 | 12 | % | 51,693 | 12 | % | |||||||||||
Total operating expenses | $ | 611,386 | 82 | % | $ | 462,805 | 83 | % | $ | 340,084 | 82 | % | ||||||||
(1) | Includes stock-based compensation expense, amortization of acquisition-related intangible assets and transaction costs for business combinations as follows: |
Year ended December 31, | |||||||||||
2015 | 2014 | 2013 | |||||||||
(dollars in thousands) | |||||||||||
Product development | $ | 32,787 | $ | 28,587 | $ | 23,543 | |||||
Sales and marketing | 45,714 | 38,897 | 26,749 | ||||||||
General and administrative | 34,010 | 25,988 | 19,123 | ||||||||
Total | $ | 112,511 | $ | 93,472 | $ | 69,415 | |||||
Twelve Months Ended December 31, 2015 as Compared to the Twelve Months Ended December 31, 2014
Product development expenses: Product development expenses for the year ended December 31, 2015 increased $28.8 million, or 27%, as compared to the same period in 2014. The increase was primarily the result of a $23.5 million increase in personnel costs resulting from an overall increase in headcount, annual salary increases, payroll tax increases and an increase in stock-based compensation. The increase in personnel costs includes a $4.1 million increase in stock-based compensation resulting primarily from the issuance of annual employee equity awards and equity grants to new hires. Additionally, IT, facility and other operating expenses related to our product development increased by $5.3 million due to an increase in costs associated with our global expansion.
Sales and marketing expenses: Sales and marketing expenses for the year ended December 31, 2015 increased $97.8 million, or 34%, as compared to the same period in 2014. The increase was primarily the result of a $76.8 million increase in personnel costs, an $8.7 million increase in IT, facility and recruiting costs, a $6.1 million increase in marketing and other operating expenses and a $6.2 million increase in sales related expenses including the amortization of intangibles due to the Bronto and Monexa business acquisitions. The increase in personnel costs related primarily to increases in commission and payroll expenses resulting from higher sales and an increase in headcount. IT, facility and recruiting costs increased due to an increase in costs associated with our global expansion. Marketing and other operating expenses increased due to our annual user conference, trade shows, product branding and other media campaigns.
General and administrative expenses: General and administrative expenses for the year ended December 31, 2015 increased $22.0 million, or 34%, when compared to the same period in 2014. The increase was primarily the result of an $11.4 million increase in personnel costs and a $10.6 million increase in other operational costs. The increase in personnel costs resulted from an increase in headcount, an increase in incentive pay and other personnel costs. Additionally, personnel costs include a $3.8 million increase in stock-based compensation costs resulting primarily from the issuance of annual equity awards and equity awards to new employees. Other operating expenses increased primarily due to legal, outside accounting and other business combination transaction costs incurred in connection with the acquisitions of Bronto and Monexa in 2015.
Twelve Months Ended December 31, 2014 as Compared to the Twelve Months Ended December 31, 2013
Product development expenses: Product development expenses for the year ended December 31, 2014 increased $28.4 million, or 36%, as compared to the same period in 2013. The increase was primarily the result of a $22.1 million increase in personnel costs resulting from an overall increase in headcount, annual salary increases, payroll tax increases and an increase in stock-based compensation. The increase in personnel costs includes a $5.0 million increase in stock-based compensation resulting primarily from the issuance of annual employee equity awards and equity grants to new hires. Additionally, IT, facility and other operating expenses related to our product development increased by $6.3 million due to an increase in outsourced product development services costs associated with our global expansion, data center costs incurred in connection with our product development and a decrease in government subsidies from the Czech Republic.
Sales and marketing expenses: Sales and marketing expenses for the year ended December 31, 2014 increased $80.9 million, or 39%, as compared to the same period in 2013. The increase was primarily the result of a $61.9 million increase in personnel costs, a $9.8 million increase in marketing and other operating expenses, a $4.8 million increase in sales related
33
expenses and a $4.4 million increase in IT, facility and recruiting costs. The increase in personnel costs related primarily to increases in commission and payroll expenses resulting from higher sales and an increase in headcount. Additionally, personnel costs include a $9.5 million increase in stock-based compensation resulting primarily from the issuance of annual equity awards and grants to new employees. Marketing and other operating expenses increased due to our annual user conference, trade shows, product branding and other media campaigns. Sales related costs increased due to outsourced consulting service fees incurred to increase customer demand and an increase in amortization expenses resulting from customer relationship and trade name intangible assets acquired through our business acquisitions in 2014 and 2013. IT, facility and recruiting costs increased due to an increase in costs associated with our global expansion.
General and administrative expenses: General and administrative expenses for the year ended December 31, 2014 increased $13.4 million, or 26%, when compared to the same period in 2013. The increase was primarily the result of an $8.2 million increase in personnel costs and a $5.2 million increase in other operational costs. The increase in personnel costs resulted from an increase in headcount, an increase in incentive pay and other personnel costs. Additionally, personnel costs include a $5.3 million increase in stock-based compensation costs resulting primarily from the issuance of annual equity awards and equity awards to new employees. Other operating expenses increased primarily due to legal, outside accounting and other business combination transaction costs incurred in connection with the acquisitions of Venda and WMS in the third quarter of 2014.
Non-operating items, including interest income and expense, other income / (expense) and income taxes were as follows for the periods presented:
Year ended December 31, | |||||||||||||||||
2015 | 2014 | 2013 | |||||||||||||||
Amount | % of revenue | Amount | % of revenue | Amount | % of revenue | ||||||||||||
(dollars in thousands) | |||||||||||||||||
Interest income | 458 | — | % | 220 | — | % | 67 | — | % | ||||||||
Interest expense | (14,674 | ) | (2 | )% | (14,309 | ) | (3 | )% | (8,424 | ) | (2 | )% | |||||
Other expense, net | (481 | ) | — | % | (451 | ) | — | % | (383 | ) | — | % | |||||
Provision for income taxes | (5,619 | ) | (1 | )% | 2,166 | — | % | 899 | — | % | |||||||
Twelve Months Ended December 31, 2015 as Compared to the Twelve Months Ended December 31, 2014
Our provision for income taxes decreased by $7.8 million during the year ended December 31, 2015 as compared to 2014 because in 2015 we recorded approximately $8.3 million in net deferred tax liabilities related to the Bronto acquisition. These deferred tax liabilities create a new source of taxable income, thereby requiring us to release a portion of our deferred tax asset valuation allowance with a related reduction in income tax expense for the year ended December 31, 2015 of $8.3 million. See Note 15 to our consolidated financial statements for more information regarding our income taxes.
Twelve Months Ended December 31, 2014 as Compared to the Twelve Months Ended December 31, 2013
Our interest expense increased by $5.9 million during the year ended December 31, 2014 as compared to 2013 primarily due to our issuance of $310.0 million in aggregate principal amount of 0.25% convertible senior notes in June 2013. In connection with these notes, we record interest costs consisting of amortization of debt discount, coupon interest and amortization of debt issuance costs. In 2014, we recorded interest cost for an entire year as compared to half a year in 2013.
Our provision for income taxes increased by $1.3 million during the year ended December 31, 2014 as compared to 2013 primarily due to tax benefits associated with our 2013 business combinations. See Note 15 to our consolidated financial statements for more information regarding our income taxes.
Quarterly Results of Operations
The following tables set forth our unaudited quarterly condensed consolidated statements of operations data for each of the eight quarters ended December 31, 2015. The data has been prepared on the same basis as the audited consolidated financial statements and related notes included in this Annual Report on Form 10-K and you should read the following tables in conjunction with such financial statements. The table includes all necessary adjustments, consisting only of normal recurring adjustments that we consider necessary for a fair presentation of this data. The results of historical periods are not necessarily indicative of future results.
34
Three months ended | ||||||||||||||||||||||||||||||||
December 31, | September 30, | June 30, | March 31, | December 31, | September 30, | June 30, | March 31, | |||||||||||||||||||||||||
2015 | 2015 | 2015 | 2015 | 2014 | 2014 | 2014 | 2014 | |||||||||||||||||||||||||
(dollars and shares in thousands, except per share amounts) | ||||||||||||||||||||||||||||||||
(unaudited) | ||||||||||||||||||||||||||||||||
Revenue: | ||||||||||||||||||||||||||||||||
Subscription and support | $ | 164,536 | $ | 154,661 | $ | 140,922 | $ | 132,974 | $ | 126,705 | $ | 115,831 | $ | 105,851 | $ | 99,395 | ||||||||||||||||
Professional services and other | 41,693 | 38,162 | 36,358 | 31,843 | 31,164 | 27,829 | 25,943 | 23,566 | ||||||||||||||||||||||||
Total revenue | 206,229 | 192,823 | 177,280 | 164,817 | 157,869 | 143,660 | 131,794 | 122,961 | ||||||||||||||||||||||||
Cost of revenue: | ||||||||||||||||||||||||||||||||
Subscription and support (1) | 27,594 | 25,983 | 22,454 | 20,990 | 20,041 | 18,522 | 17,084 | 16,360 | ||||||||||||||||||||||||
Professional services and other (1) | 40,236 | 40,113 | 36,687 | 31,371 | 30,496 | 27,477 | 24,513 | 22,317 | ||||||||||||||||||||||||
Total cost of revenue | 67,830 | 66,096 | 59,141 | 52,361 | 50,537 | 45,999 | 41,597 | 38,677 | ||||||||||||||||||||||||
Gross profit | 138,399 | 126,727 | 118,139 | 112,456 | 107,332 | 97,661 | 90,197 | 84,284 | ||||||||||||||||||||||||
Operating expenses: | ||||||||||||||||||||||||||||||||
Product development (1) | 37,176 | 36,112 | 32,537 | 29,719 | 28,548 | 28,610 | 25,376 | 24,172 | ||||||||||||||||||||||||
Sales and marketing (1) | 107,539 | 102,145 | 95,803 | 83,254 | 82,856 | 74,699 | 69,726 | 63,680 | ||||||||||||||||||||||||
General and administrative (1) | 21,202 | 21,824 | 25,642 | 18,433 | 16,902 | 20,097 | 14,106 | 14,033 | ||||||||||||||||||||||||
Total operating expenses | 165,917 | 160,081 | 153,982 | 131,406 | 128,306 | 123,406 | 109,208 | 101,885 | ||||||||||||||||||||||||
Operating loss | (27,518 | ) | (33,354 | ) | (35,843 | ) | (18,950 | ) | (20,974 | ) | (25,745 | ) | (19,011 | ) | (17,601 | ) | ||||||||||||||||
Other income / (expenses), net, and income taxes (1) | (4,885 | ) | (3,986 | ) | 3,556 | (3,763 | ) | (4,371 | ) | (3,550 | ) | (4,153 | ) | (4,632 | ) | |||||||||||||||||
Net loss | $ | (32,403 | ) | $ | (37,340 | ) | $ | (32,287 | ) | $ | (22,713 | ) | $ | (25,345 | ) | $ | (29,295 | ) | $ | (23,164 | ) | $ | (22,233 | ) | ||||||||
Net loss per NetSuite Inc. common share | $ | (0.41 | ) | $ | (0.47 | ) | $ | (0.41 | ) | $ | (0.29 | ) | $ | (0.33 | ) | $ | (0.38 | ) | $ | (0.31 | ) | $ | (0.29 | ) | ||||||||
Weighted average number of shares used in computing net loss per common share | 79,615 | 79,186 | 77,975 | 77,276 | 76,850 | 76,477 | 75,919 | 75,433 | ||||||||||||||||||||||||
(1) Includes stock-based compensation expense, amortization of acquisition-related intangible assets, transaction costs for business combinations, non-cash interest expense on convertible debt and income tax benefits associated with business combination as follows: | ||||||||||||||||||||||||||||||||
Three months ended | ||||||||||||||||||||||||||||||||
December 31, | September 30, | June 30, | March 31, | December 31, | September 30, | June 30, | March 31, | |||||||||||||||||||||||||
2015 | 2015 | 2015 | 2015 | 2014 | 2014 | 2014 | 2014 | |||||||||||||||||||||||||
(in thousands) | ||||||||||||||||||||||||||||||||
Cost of revenue: | ||||||||||||||||||||||||||||||||
Subscription and support | $ | 3,603 | $ | 3,438 | $ | 2,646 | $ | 2,513 | $ | 2,332 | $ | 2,173 | $ | 1,851 | $ | 1,986 | ||||||||||||||||
Professional services and other | 2,750 | 4,296 | 2,826 | 2,796 | 2,845 | 2,684 | 2,317 | 2,482 | ||||||||||||||||||||||||
Operating expenses: | ||||||||||||||||||||||||||||||||
Product development | 8,488 | 8,094 | 8,421 | 7,784 | 7,396 | 7,733 | 6,884 | 6,576 | ||||||||||||||||||||||||
Sales and marketing | 12,307 | 12,940 | 11,196 | 9,271 | 10,945 | 11,156 | 9,087 | 7,709 | ||||||||||||||||||||||||
General and administrative | 6,142 | 8,270 | 13,524 | 6,074 | 6,012 | 10,552 | 4,683 | 4,739 | ||||||||||||||||||||||||
Other income / (expenses) and income taxes, net | (3,452 | ) | (2,932 | ) | 4,613 | (3,294 | ) | (3,291 | ) | (3,287 | ) | (3,191 | ) | (3,141 | ) | |||||||||||||||||
Total | $ | 36,742 | $ | 39,970 | $ | 34,000 | $ | 31,732 | $ | 32,821 | $ | 37,585 | $ | 28,013 | $ | 26,633 | ||||||||||||||||
Liquidity and Capital Resources
As of December 31, 2015, our primary sources of liquidity were our cash and cash equivalents totaling $290.0 million, marketable securities totaling $88.6 million and $176.7 million in accounts receivable, net of allowance.
In the year ended December 31, 2015, cash flows from operations generated $100.4 million of cash.
As of December 31, 2015, we had an accumulated deficit of $674.0 million. We have funded this deficit primarily through the net proceeds raised from the sale of our capital stock and convertible notes and cash flows from operations.
35
Our cash flow activities were as follows for the periods presented:
Year ended December 31, | |||||||||||
2015 | 2014 | 2013 | |||||||||
(in thousands) | |||||||||||
Net cash provided by operating activities | $ | 100,407 | $ | 74,920 | $ | 62,235 | |||||
Net cash used in investing activities | (181,135 | ) | (157,296 | ) | (81,023 | ) | |||||
Net cash (used in) / provided by financing activities | 4,900 | (158 | ) | 285,576 | |||||||
Effect of exchange rate changes on cash and cash equivalents | (1,975 | ) | (1,274 | ) | (1,070 | ) | |||||
Net change in cash and cash equivalents | $ | (77,803 | ) | $ | (83,808 | ) | $ | 265,718 | |||
Twelve Months Ended December 31, 2015 as Compared to the Twelve Months Ended December 31, 2014
Cash provided by operating activities was driven by sales of our application suite and costs incurred to deliver that service. The timing of our billings and collections relating to our sales and the timing of the payment of our liabilities have a significant impact on our cash flows. Cash flows from operations increased during the year ended December 31, 2015 as compared to 2014 primarily as a result of an increase in collections from customers and the timing of payments to vendors, partially offset by an increase in commissions paid.
Cash used in investing activities during the year ended December 31, 2015 was primarily related to the acquisition of Bronto and Monexa, and capital expenditures associated with our global expansion. In 2015, we paid $98.0 million, net of cash received, to acquire Bronto and $32.6 million, net of cash received. to acquire Monexa compared to 2014, when we paid $39.7 million, net of cash received, to acquire Venda and WMS. In 2015, capital expenditures increased by $26.6 million because we continued to expand our office space and purchase additional property and equipment to accommodate an increase in headcount. Additionally, we increased our datacenter capacity in 2015. In 2014, we initially invested $95.6 million into marketable securities. In 2015, our investment in market securities remained constant so overall cash used for marketable securities activity decreased by $89.0 million when compared to 2014.
Cash provided by / (used in) financing activities for the year ended December 31, 2015 changed from the same period in 2014 due to a $7.1 million increase in proceeds from employee stock option exercises, a $4.6 million decrease in payments to the former owners of businesses acquired, partially offset by a $7.0 million increase in RSUs acquired to settle employee withholding liabilities.
Twelve Months Ended December 31, 2014 as Compared to the Twelve Months Ended December 31, 2013
Cash provided by operating activities was driven by sales of our application suite and costs incurred to deliver that service. The timing of our billings and collections relating to our sales and the timing of the payment of our liabilities have a significant impact on our cash flows. Cash flows from operations increased during the year ended December 31, 2014 as compared to 2013 primarily as a result of an increase in collections from customers and the timing of payments to vendors, partially offset by an increase in commissions paid.
Cash used in investing activities during the year ended December 31, 2014 was related to the purchase and sale of marketable securities, acquiring companies and capital expenditures for property and equipment, consisting of the purchase of software licenses, computer equipment, leasehold improvements and furniture and fixtures as we develop and enhance our infrastructure. Cash used in investing increased due to our $91.8 million net investment into marketable securities in 2014, a $3.4 million increase in capital expenditures associated with our 2014 global expansion, partially offset by a $19.4 million decrease in business combination related cash payments, net of cash received. In 2014, we paid $39.7 million, net of cash received, to acquire Venda and WMS compared to 2013 when we paid $57.4 million, net of cash received, to acquire T-HR ("TribeHR"), OM ("OrderMotion") and WH ("Website Hosting Provider") and $747,000 in other business combination related payments.
The net cash used in financing activities during the year ended December 31, 2014 increased from 2013 due to $301.7 million in net proceeds received from the issuance of $310.0 million at par value of 0.25% convertible senior notes partially offset by the repurchase of $30.0 million of our common stock in June 2013, a $7.9 million decrease in proceeds received from employee stock option exercises and $5.9 million in payments to the former owners of businesses acquired in late 2012 and 2013.
We intend to use our cash for general corporate purposes, including potential future acquisitions or other transactions. Further, we expect to incur additional expenses in connection with our international expansion. We believe that our cash and cash equivalents are adequate to fund those potential or anticipated activities.
While we believe that our uncommitted current working capital and anticipated cash flows from operations will be adequate to meet our cash needs for daily operations and capital expenditures for at least the next 12 months, we may elect to raise additional capital through the sale of additional equity or debt securities, obtain a credit facility or sell certain assets. If additional funds are raised through the issuance of additional debt securities, these securities could have rights, preferences and privileges senior to holders of common stock or holders of the convertible notes, and terms of any debt could impose restrictions on our operations. The sale of additional equity or convertible debt securities could result in additional dilution to our stockholders and additional financing may not be available in amounts or on terms acceptable to us. If additional financing
36
becomes necessary and we are unable to obtain the additional funds, we may be required to reduce the scope of our planned product development and marketing efforts, potentially harming our business, financial condition and operating results.
Contractual Obligations
We generally do not enter into long-term minimum purchase commitments. Our principal commitments consist of our convertible senior notes, obligations under capital leases for equipment, notes payable used for purchase of equipment, operating leases primarily for office space, and other purchase obligations consisting of maintenance support contracts on leased or owned equipment and other general purchase obligations. The following table summarizes our commitments to settle contractual obligations in cash as of December 31, 2015, for the next five years and thereafter:
Total | Less than 1 year | 1 to 3 years | 3 to 5 years | More than 5 Years | |||||||||||||||
(dollars in thousands) | |||||||||||||||||||
Capital lease obligations | $ | 39 | $ | 36 | $ | 3 | $ | — | $ | — | |||||||||
Convertible 0.25% senior notes including interest | 311,873 | 775 | 311,098 | — | — | ||||||||||||||
Debt obligations - related party, including interest | 6,238 | 3,119 | 3,119 | — | — | ||||||||||||||
Total accrued contractual obligations | 318,150 | 3,930 | 314,220 | — | — | ||||||||||||||
Operating lease obligations | 132,085 | 19,027 | 48,384 | 36,190 | 28,484 | ||||||||||||||
Purchase obligations | 47,127 | 29,710 | 15,570 | 1,847 | — | ||||||||||||||
Total off-balance sheet contractual obligations | 179,212 | 48,737 | 63,954 | 38,037 | 28,484 | ||||||||||||||
Total contractual obligations | $ | 497,362 | $ | 52,667 | $ | 378,174 | $ | 38,037 | $ | 28,484 | |||||||||
Off-Balance Sheet Arrangements
During the years ended December 31, 2015, 2014 and 2013, we did not have any relationships with unconsolidated entities or financial partnerships, such as entities often referred to as structured finance or variable interest entities, which would have been established for the purpose of facilitating off balance sheet arrangements or other contractually narrow or limited purposes.
Recent Accounting Pronouncements
See Note 2 in Notes to our Consolidated Financial Statements "Significant Accounting Policies".
Item 7A. | Quantitative and Qualitative Disclosures about Market Risk |
Interest Rate Sensitivity
We had cash and cash equivalents of $290.0 million and marketable securities of $88.6 million at December 31, 2015. These amounts were held primarily in money market funds, commercial paper and U.S government securities.
Cash and cash equivalents are held for working capital purposes, marketable securities are held as short-term investments and restricted cash amounts are held as security against various lease obligations. Due to the short‑term nature of these investments, we believe that we do not have any material exposure to changes in the fair value of our investment portfolio as a result of changes in interest rates.
Market Risk
In June 2013, we issued at par value $310.0 million of 0.25% convertible senior notes due June 1, 2018 ("the Notes"). The Notes have a fixed annual interest rate of 0.25% and we, therefore, do not have economic interest rate exposure on the Notes. However, the fair value of the Notes is exposed to interest rate risk. Generally, the fair value of the Notes will increase as interest rates fall and decrease as interest rates rise. These Notes are also affected by volatility in our common stock price. As of December 31, 2015, the fair value of the Notes was $307.0 million.
Foreign Currency Risk
Our results of operations and cash flows are subject to fluctuations due to changes in foreign currency exchange rates, particularly changes in the British Pound Sterling, Canadian Dollar, Australian Dollar, Philippine Peso, Uruguayan Peso and the Czech Koruna. Our revenue is generally denominated in the local currency of the contracting party. The majority of our
37
invoicing relates to sales occurring in the United States and therefore is denominated in U.S. dollars. We have a significant percentage of sales denominated in foreign currencies including, but not limited to, the local currencies of Australia, the United Kingdom and Canada. Our expenses are incurred primarily in the United States, Canada, the Philippines, Australia and the United Kingdom, with a small portion of expenses incurred in other countries where our international sales and operations offices are located. Our results of operations and cash flows are, therefore, subject to fluctuations due to changes in foreign currency exchange rates. During the year ended December 31, 2015, the U.S. dollar increased against the foreign currencies that our invoicing and operational expenses are denominated in by approximately 9.4% when compared to the same period in the prior year. For the year ended December 31, 2015, the fluctuation in foreign currency rates positively affected our income by approximately $10.9 million.
During the year ended December 31, 2015, we continued a hedging program to limit the exposure of foreign currency risk resulting from the revaluation of foreign denominated assets and liabilities through the use of forward exchange contracts. See “Balance Sheet Hedging - Hedging of Foreign Currency Assets and Liabilities” in Note 6 under the heading “Notes to the Consolidated Financial Statements” of Part 1, Item 1, “Financial Statements” herein for further disclosures.
Fair Value of Financial Instruments
We do not have material exposure to market risk with respect to investments as our investments consist primarily of highly liquid investments with various maturity dates over the next 18 months. We do not use derivative financial instruments for speculative or trading purposes. However, this does not preclude our adoption of specific hedging strategies in the future.
38
Item 8. | Financial Statements and Supplementary Data |
Index to Consolidated Financial Statements
The following financial statements are filed as part of this Annual Report:
39
Report of Independent Registered Public Accounting Firm
The Board of Directors and Stockholders
NetSuite Inc.:
We have audited the accompanying consolidated balance sheets of NetSuite Inc. and subsidiaries as of December 31, 2015 and 2014, and the related consolidated statements of operations and comprehensive loss, total equity, and cash flows for each of the years in the three-year period ended December 31, 2015. In connection with our audits of the consolidated financial statements, we have also audited financial statement Schedule II, as set forth in Item 15(b). We also have audited NetSuite Inc.’s internal control over financial reporting as of December 31, 2015, based on criteria established in Internal Control - Integrated Framework (2013) issued by the Committee of Sponsoring Organizations of the Treadway Commission (COSO). NetSuite Inc.’s management is responsible for these consolidated financial statements, for maintaining effective internal control over financial reporting, and for its assessment of the effectiveness of internal control over financial reporting, included in the accompanying Report of Management on Internal Control Over Financial Reporting. Our responsibility is to express an opinion on these consolidated financial statements and financial statement schedule and an opinion on the Company’s internal control over financial reporting based on our audits.
We conducted our audits in accordance with the standards of the Public Company Accounting Oversight Board (United States). Those standards require that we plan and perform the audits to obtain reasonable assurance about whether the financial statements are free of material misstatement and whether effective internal control over financial reporting was maintained in all material respects. Our audits of the consolidated financial statements included examining, on a test basis, evidence supporting the amounts and disclosures in the financial statements, assessing the accounting principles used and significant estimates made by management, and evaluating the overall financial statement presentation. Our audit of internal control over financial reporting included obtaining an understanding of internal control over financial reporting, assessing the risk that a material weakness exists, and testing and evaluating the design and operating effectiveness of internal control based on the assessed risk. Our audits also included performing such other procedures as we considered necessary in the circumstances. We believe that our audits provide a reasonable basis for our opinions.
A company’s internal control over financial reporting is a process designed to provide reasonable assurance regarding the reliability of financial reporting and the preparation of financial statements for external purposes in accordance with generally accepted accounting principles. A company’s internal control over financial reporting includes those policies and procedures that (1) pertain to the maintenance of records that, in reasonable detail, accurately and fairly reflect the transactions and dispositions of the assets of the company; (2) provide reasonable assurance that transactions are recorded as necessary to permit preparation of financial statements in accordance with generally accepted accounting principles, and that receipts and expenditures of the company are being made only in accordance with authorizations of management and directors of the company; and (3) provide reasonable assurance regarding prevention or timely detection of unauthorized acquisition, use, or disposition of the company’s assets that could have a material effect on the financial statements.
Because of its inherent limitations, internal control over financial reporting may not prevent or detect misstatements. Also, projections of any evaluation of effectiveness to future periods are subject to the risk that controls may become inadequate because of changes in conditions, or that the degree of compliance with the policies or procedures may deteriorate.
In our opinion, the consolidated financial statements referred to above present fairly, in all material respects, the financial position of NetSuite Inc. and subsidiaries as of December 31, 2015 and 2014, and the results of their operations and their cash flows for each of the years in the three-year period ended December 31, 2015, in conformity with U.S. generally accepted accounting principles. Also in our opinion, NetSuite Inc. maintained, in all material respects, effective internal control over financial reporting as of December 31, 2015, based on criteria established in Internal Control - Integrated Framework (2013) issued by the Committee of Sponsoring Organizations of the Treadway Commission (COSO) .
The Company acquired Bronto Software, Inc. (Bronto) during 2015, and management excluded from its assessment of the effectiveness of the Company’s internal control over financial reporting as of December 31, 2015, Bronto’s internal control over financial reporting associated with total assets of $16.5 million and total revenue of $22.1 million included in the consolidated financial statements of the Company as of and for the year ended December 31, 2015. Our audit of internal control over financial reporting of the Company also excluded an evaluation of the internal control over financial reporting of Bronto.
/s/ KPMG LLP
Santa Clara, California
February 23, 2016
40
NetSuite Inc.
Consolidated Balance Sheets
(dollars in thousands)
December 31, | |||||||
2015 | 2014 | ||||||
Assets | |||||||
Current assets: | |||||||
Cash and cash equivalents | $ | 289,966 | $ | 367,769 | |||
Short-term marketable securities | 74,748 | 82,622 | |||||
Accounts receivable, net of allowances of $1,988 and $1,886 as of December 31, 2015 and December 31, 2014, respectively | 176,720 | 139,221 | |||||
Deferred commissions | 69,579 | 53,377 | |||||
Other current assets | 44,087 | 30,012 | |||||
Total current assets | 655,100 | 673,001 | |||||
Marketable securities, non-current | 13,875 | 9,143 | |||||
Property and equipment, net | 89,643 | 58,539 | |||||
Deferred commissions, non-current | 15,287 | 13,499 | |||||
Goodwill | 291,956 | 123,049 | |||||
Other intangible assets, net | 60,980 | 32,404 | |||||
Other assets | 14,135 | 12,604 | |||||
Total assets | $ | 1,140,976 | $ | 922,239 | |||
Liabilities and total equity | |||||||
Current liabilities: | |||||||
Accounts payable | $ | 3,545 | $ | 5,082 | |||
Deferred revenue | 404,986 | 300,884 | |||||
Accrued compensation | 55,586 | 41,081 | |||||
Accrued expenses | 37,901 | 30,975 | |||||
Other current liabilities (including note payable to related party of $2,901 and $2,774 as of December 31, 2015 and December 31, 2014, respectively) | 17,032 | 14,751 | |||||
Total current liabilities | 519,050 | 392,773 | |||||
Long-term liabilities: | |||||||
Convertible 0.25% senior notes, net | 277,955 | 265,710 | |||||
Deferred revenue, non-current | 22,743 | 13,622 | |||||
Other long-term liabilities (including note payable to related party of $3,027 and $5,928 as of December 31, 2015 and December 31, 2014, respectively) | 15,027 | 15,900 | |||||
Total long-term liabilities | 315,725 | 295,232 | |||||
Total liabilities | 834,775 | 688,005 | |||||
Commitments and contingencies (Notes 11 and 12) | |||||||
Total equity: | |||||||
Common stock, par value $0.01, 500,000,000 shares authorized; 79,802,618 and 77,031,827 shares issued and outstanding at December 31, 2015 and December 31, 2014, respectively | 798 | 770 | |||||
Additional paid-in capital | 992,362 | 788,583 | |||||
Accumulated other comprehensive loss | (13,009 | ) | (5,912 | ) | |||
Accumulated deficit | (673,950 | ) | (549,207 | ) | |||
Total equity | 306,201 | 234,234 | |||||
Total liabilities and total equity | $ | 1,140,976 | $ | 922,239 | |||
See accompanying Notes to Consolidated Financial Statements.
41
NetSuite Inc.
Consolidated Statements of Operations and Comprehensive Loss
(dollars and shares in thousands, except per share data)
Year ended December 31, | |||||||||||||||||||||
2015 | 2014 | 2013 | |||||||||||||||||||
Revenue: | |||||||||||||||||||||
Subscription and support | $ | 593,093 | $ | 447,782 | $ | 333,556 | |||||||||||||||
Professional services and other | 148,056 | 108,502 | 80,952 | ||||||||||||||||||
Total revenue | 741,149 | 556,284 | 414,508 | ||||||||||||||||||
Cost of revenue: | |||||||||||||||||||||
Subscription and support | 97,021 | 72,007 | 55,269 | ||||||||||||||||||
Professional services and other | 148,407 | 104,803 | 79,925 | ||||||||||||||||||
Total cost of revenue | 245,428 | 176,810 | 135,194 | ||||||||||||||||||
Gross profit | 495,721 | 379,474 | 279,314 | ||||||||||||||||||
Operating expenses: | |||||||||||||||||||||
Product development | 135,544 | 106,706 | 78,312 | ||||||||||||||||||
Sales and marketing | 388,741 | 290,961 | 210,079 | ||||||||||||||||||
General and administrative | 87,101 | 65,138 | 51,693 | ||||||||||||||||||
Total operating expenses | 611,386 | 462,805 | 340,084 | ||||||||||||||||||
Operating loss | (115,665 | ) | (83,331 | ) | (60,770 | ) | |||||||||||||||
Other income / (expense), net: | |||||||||||||||||||||
Interest income | 458 | 220 | 67 | ||||||||||||||||||
Interest expense | (14,674 | ) | (14,309 | ) | (8,424 | ) | |||||||||||||||
Other expense, net | (481 | ) | (451 | ) | (383 | ) | |||||||||||||||
Total other income / (expense), net | (14,697 | ) | (14,540 | ) | (8,740 | ) | |||||||||||||||
Loss before income taxes | (130,362 | ) | (97,871 | ) | (69,510 | ) | |||||||||||||||
Provision / (benefit) for income taxes | (5,619 | ) | 2,166 | 899 | |||||||||||||||||
Net loss | (124,743 | ) | (100,037 | ) | (70,409 | ) | |||||||||||||||
Net loss per common share, basic and diluted | $ | (1.59 | ) | $ | (1.31 | ) | $ | (0.95 | ) | ||||||||||||
Weighted average number of shares used in computing net loss per share | 78,521 | 76,174 | 74,085 | ||||||||||||||||||
Comprehensive loss: | |||||||||||||||||||||
Foreign currency translation loss, net of taxes | (6,914 | ) | (5,751 | ) | (1,136 | ) | |||||||||||||||
Unrealized loss on marketable securities | (81 | ) | (5 | ) | — | ||||||||||||||||
Accumulated pension liability | (102 | ) | 90 | (60 | ) | ||||||||||||||||
Comprehensive loss | $ | (131,840 | ) | $ | (105,703 | ) | $ | (71,605 | ) | ||||||||||||
See accompanying Notes to Consolidated Financial Statements.
42
NetSuite Inc. | ||||||||||||||||||||||||
Consolidated Statements of Total Equity | ||||||||||||||||||||||||
(dollars in thousands) | ||||||||||||||||||||||||
Common Stock | Accumulated other | |||||||||||||||||||||||
Shares | Amount | Additional paid-in capital | comprehensive loss | Accumulated deficit | Total equity | |||||||||||||||||||
BALANCES, January 1, 2013 | 72,675,265 | 727 | 535,853 | 950 | (378,761 | ) | 158,769 | |||||||||||||||||
Exercise of stock options for cash | 1,102,032 | 11 | 16,940 | 16,951 | ||||||||||||||||||||
Repurchase and vesting of restricted stock awards and units | 1,702,944 | 17 | (179 | ) | (162 | ) | ||||||||||||||||||
Excess tax benefit on stock-based compensation | 410 | 410 | ||||||||||||||||||||||
Capitalized stock-based compensation | 1,099 | 1,099 | ||||||||||||||||||||||
Stock-based compensation | 73,660 | 73,660 | ||||||||||||||||||||||
Convertible 0.25% senior notes issuance | 60,931 | 60,931 | ||||||||||||||||||||||
Repurchase and retirement of common stock | (348,837 | ) | (4 | ) | (29,997 | ) | (30,001 | ) | ||||||||||||||||
Comprehensive loss: | ||||||||||||||||||||||||
Accumulated pension liability | (60 | ) | (60 | ) | ||||||||||||||||||||
Foreign currency translation adjustment | (1,136 | ) | (1,136 | ) | ||||||||||||||||||||
Net loss | (70,409 | ) | (70,409 | ) | ||||||||||||||||||||
BALANCES, December 31, 2013 | 75,131,404 | 751 | 658,717 | (246 | ) | (449,170 | ) | 210,052 | ||||||||||||||||
Exercise of stock options for cash | 340,824 | 3 | 9,027 | 9,030 | ||||||||||||||||||||
Repurchase and vesting of restricted stock awards and units | 1,255,235 | 13 | (151 | ) | (138 | ) | ||||||||||||||||||
Excess tax benefit on stock-based compensation | 313 | 313 | ||||||||||||||||||||||
Capitalized stock-based compensation | 1,415 | 1,415 | ||||||||||||||||||||||
Stock-based compensation | 96,480 | 96,480 | ||||||||||||||||||||||
Shares issued to acquire Venda Inc. | 304,364 | 3 | 22,782 | 22,785 | ||||||||||||||||||||
Comprehensive loss: | ||||||||||||||||||||||||
Accumulated pension liability | 90 | 90 | ||||||||||||||||||||||
Unrealized loss on marketable securities | (5 | ) | (5 | ) | ||||||||||||||||||||
Foreign currency translation adjustment | (5,751 | ) | (5,751 | ) | ||||||||||||||||||||
Net loss | (100,037 | ) | (100,037 | ) | ||||||||||||||||||||
BALANCES, December 31, 2014 | 77,031,827 | 770 | 788,583 | (5,912 | ) | (549,207 | ) | 234,234 | ||||||||||||||||
Exercise of stock options for cash | 561,811 | 6 | 14,183 | 14,189 | ||||||||||||||||||||
Repurchase and vesting of restricted stock awards and units | 1,178,472 | 12 | (7,109 | ) | (7,097 | ) | ||||||||||||||||||
Excess tax benefit on stock-based compensation | 242 | 242 | ||||||||||||||||||||||
Capitalized stock-based compensation | 1,503 | 1,503 | ||||||||||||||||||||||
Stock-based compensation | 109,090 | 109,090 | ||||||||||||||||||||||
Shares issued to acquire Bronto, Inc. | 1,030,508 | 10 | 85,870 | 85,880 | ||||||||||||||||||||
Comprehensive loss: | ||||||||||||||||||||||||
Accumulated pension liability | (102 | ) | (102 | ) | ||||||||||||||||||||
Unrealized loss on marketable securities | (81 | ) | (81 | ) | ||||||||||||||||||||
Foreign currency translation adjustment | (6,914 | ) | (6,914 | ) | ||||||||||||||||||||
Net loss | (124,743 | ) | $ | (124,743 | ) | |||||||||||||||||||
BALANCES, December 31, 2015 | 79,802,618 | $ | 798 | $ | 992,362 | $ | (13,009 | ) | $ | (673,950 | ) | $ | 306,201 | |||||||||||
See accompanying Notes to Consolidated Financial Statements.
43
NetSuite Inc.
Consolidated Statements of Cash Flows
(dollars in thousands)
Year ended December 31, | |||||||||||
2015 | 2014 | 2013 | |||||||||
Cash flows from operating activities: | |||||||||||
Net loss | $ | (124,743 | ) | $ | (100,037 | ) | $ | (70,409 | ) | ||
Adjustments to reconcile net loss to net cash provided by operating activities: | |||||||||||
Depreciation and amortization | 30,353 | 20,115 | 15,668 | ||||||||
Amortization of other intangible assets | 17,862 | 9,993 | 6,749 | ||||||||
Amortization of debt discount and transaction costs | 13,539 | 12,910 | 7,316 | ||||||||
Provision for accounts receivable allowances | 2,293 | 1,446 | 1,041 | ||||||||
Stock-based compensation | 109,090 | 96,480 | 73,660 | ||||||||
Amortization of deferred commissions | 101,149 | 75,249 | 55,531 | ||||||||
Excess tax benefit on stock-based compensation | (242 | ) | (313 | ) | (410 | ) | |||||
Changes in operating assets and liabilities, net of acquired assets and assumed liabilities: | |||||||||||
Accounts receivable | (35,481 | ) | (50,811 | ) | (22,305 | ) | |||||
Deferred commissions | (119,145 | ) | (95,532 | ) | (70,380 | ) | |||||
Other current assets | (7,407 | ) | (4,932 | ) | (12,486 | ) | |||||
Other assets | 3,038 | (2,165 | ) | (2,329 | ) | ||||||
Accounts payable | (1,822 | ) | (2,321 | ) | 1,691 | ||||||
Accrued compensation | 10,367 | 15,403 | 6,173 | ||||||||
Deferred revenue | 109,382 | 89,668 | 63,510 | ||||||||
Other current liabilities | 4,285 | 11,624 | 8,771 | ||||||||
Other long-term liabilities | (12,111 | ) | (1,857 | ) | 444 | ||||||
Net cash provided by operating activities | 100,407 | 74,920 | 62,235 | ||||||||
Cash flows from investing activities: | |||||||||||
Purchases of property and equipment | (50,313 | ) | (23,732 | ) | (20,337 | ) | |||||
Capitalized internal use software | (3,004 | ) | (2,578 | ) | (2,056 | ) | |||||
Cash paid in business combinations, net of cash received | (130,560 | ) | (39,209 | ) | (58,630 | ) | |||||
Purchases of marketable securities | (132,155 | ) | (105,576 | ) | — | ||||||
Maturities of marketable securities | 130,193 | 10,000 | — | ||||||||
Sales of marketable securities | 4,704 | 3,799 | — | ||||||||
Net cash used in investing activities | (181,135 | ) | (157,296 | ) | (81,023 | ) | |||||
Cash flows from financing activities: | |||||||||||
Proceeds from issuance of convertible 0.25% senior notes | — | — | 310,000 | ||||||||
Payments of issuance costs on convertible 0.25% senior notes | — | — | (8,260 | ) | |||||||
Payments under capital leases | (190 | ) | (364 | ) | (744 | ) | |||||
Payments under capital leases and long-term debt - related party | (2,774 | ) | (3,054 | ) | (2,612 | ) | |||||
Payments to repurchase common stock | — | — | (30,000 | ) | |||||||
Excess tax benefit on stock-based compensation | 242 | 313 | 410 | ||||||||
Payments related to business combinations | (1,335 | ) | (5,945 | ) | — | ||||||
RSUs acquired to settle employee withholding liability | (7,098 | ) | (137 | ) | (162 | ) | |||||
Proceeds from issuance of common stock | 16,055 | 9,029 | 16,944 | ||||||||
Net cash (used in) / provided by financing activities | 4,900 | (158 | ) | 285,576 | |||||||
Effect of exchange rate changes on cash and cash equivalents | (1,975 | ) | (1,274 | ) | (1,070 | ) | |||||
Net change in cash and cash equivalents | (77,803 | ) | (83,808 | ) | 265,718 | ||||||
Cash and cash equivalents at beginning of period | 367,769 | 451,577 | 185,859 | ||||||||
Cash and cash equivalents at end of period | $ | 289,966 | $ | 367,769 | $ | 451,577 | |||||
Supplemental cash flow disclosure: | |||||||||||
Cash paid for interest to related parties | $ | 345 | $ | 464 | $ | 431 | |||||
Cash paid for interest to other parties | $ | 934 | $ | 565 | $ | 442 | |||||
Cash paid for income taxes, net of tax refunds | $ | 2,332 | $ | 1,320 | $ | 937 | |||||
Noncash financing and investing activities: | |||||||||||
Fixed assets acquired under related party agreement | $ | — | $ | — | $ | 11,355 | |||||
Common stock issued in connection with business combination | $ | 85,880 | $ | 22,785 | $ | — | |||||
See accompanying Notes to Consolidated Financial Statements
44
NetSuite Inc.
Notes to Consolidated Financial Statements
Note 1. Organization
NetSuite Inc. (the “Company”) provides cloud-based financials/Enterprise Resource Planning (“ERP”) and omnichannel commerce software suites. In addition, the Company offers a broad suite of applications, including financial management, Customer Relationship Management (“CRM”), ecommerce and retail management, Professional Services Automation (“PSA”) and Human Capital Management ("HCM") that enables companies to manage most of their core business operations in its single integrated suite. The Company’s "real-time dashboard" technology provides an easy-to-use view into up-to-date, role-specific business information. The Company also offers customer support and professional services related to implementing and supporting its suite of applications. The Company delivers its suite over the Internet as a subscription service using the software-as-a-service ("SaaS") model. The Company’s headquarters are located in San Mateo, California. The Company conducts its business worldwide, with international locations in Canada, Europe, Asia, Australia and Uruguay.
Note 2. Significant Accounting Policies
Basis of Presentation and Principles of Consolidation
The consolidated financial statements include the accounts of the Company and its wholly-owned subsidiaries. Intercompany balances and transactions have been eliminated.
Recent Accounting Pronouncements
In November 2015, the Financial Accounting Standards Board ("FASB") issued new accounting guidance: Balance Sheet Classification of Deferred Taxes. The guidance requires that deferred tax liabilities and assets be classified as noncurrent in a classified statement of financial position. The current requirement that deferred tax liabilities and assets of a tax-paying component of an entity be offset and presented as a single amount is not affected by the amendments in this update. The amendments may be applied either prospectively to all deferred tax liabilities and assets or retrospectively to all periods presented. The amendments are effective for financial statements issued for annual periods beginning after December 15, 2017, and interim periods within annual periods beginning after December 15, 2018. Earlier application is permitted for all entities as of the beginning of an interim or annual reporting period. In the fourth quarter of 2015, the Company elected to early adopt using the prospective method. Therefore, no prior periods were retrospectively adjusted. The adoption did not have a material impact on the Company's consolidated financial statements.
In September 2015, the FASB issued new accounting guidance: Business Combinations - Simplifying the Accounting for Measurement-Period Adjustments. The guidance requires the acquirer to recognize adjustments to provisional amounts identified during the measurement period in the reporting period in which the adjustment amounts are determined. The business combination guidance is effective for interim and annual periods beginning after December 15, 2015, with early adoption permitted, and is to be applied on a prospective basis. The Company has elected not to early adopt. The adoption of the business combination guidance is not expected to have a material impact on the Company's consolidated financial statements.
In April 2015, the FASB issued new accounting guidance: Simplifying the Presentation of Debt Issuance Costs. The guidance requires that debt issuance costs related to a recognized debt liability be presented in the balance sheet as a direct deduction from the carrying amount of that debt liability, consistent with debt discounts. The debt issuance costs guidance is effective for fiscal years beginning after December 15, 2015, and interim periods within those fiscal years. Early adoption is permitted. The Company has elected not to early adopt. The adoption of the debt guidance is not expected to have a material impact on the Company's consolidated financial statements.
In April 2015, the FASB issued new accounting guidance: Customer's Accounting for Fees Paid in a Cloud Computing Arrangement. This guidance is intended to help entities evaluate the accounting for fees paid by a customer in a cloud computing arrangement, primarily to determine whether the arrangement includes a sale or license of software. The new guidance is effective for annual periods, including interim periods within those annual periods, beginning after December 15, 2015. Early adoption is permitted. The Company has elected not to early adopt. The adoption of the guidance is not expected to have a material impact on the Company's consolidated financial statements
In May 2014, the FASB issued new accounting guidance related to revenue recognition. This new standard will replace most existing U.S. GAAP guidance on this topic. The new revenue recognition standard provides a unified model to determine when and how revenue is recognized. The core principle is that a company should recognize revenue to depict the transfer of promised goods or services to customers in an amount that reflects the consideration for which the entity expects to be entitled
45
NetSuite Inc.
Notes to Consolidated Financial Statements
in exchange for those goods or services. This guidance can be applied either retrospectively to each period presented or as a cumulative-effect adjustment as of the date of adoption. The FASB deferred the effective date for the new revenue reporting standard for entities reporting under U.S. GAAP for one year from the original effective date. In accordance with the deferral, ASU 2014-09 will become effective beginning after December 15, 2017 for public entities. Early application is permitted for annual reporting periods ending after December 15, 2016. The Company is evaluating the impact of adopting this new accounting standard on its financial statements and has not selected an adoption or a transition method.
Use of Estimates
The preparation of financial statements in conformity with GAAP requires management to make certain estimates and assumptions. These estimates and assumptions affect the reported amounts of assets and liabilities and disclosure of contingent assets and liabilities at the date of the financial statements, as well as reported amounts of revenue and expenses during the reporting period. Actual results could differ from those estimates.
Segments
The Company's chief operating decision maker is its Chief Executive Officer ("CEO"), who reviews financial information presented on a consolidated basis, accompanied by information about revenue by geographic region. Accordingly, the Company has determined that it has a single reportable segment, specifically, the provision of cloud-based business management application suites.
Revenue Recognition
The Company generates revenue from two sources: (1) subscription and support; and (2) professional services and other. Subscription and support revenue includes subscription fees from customers accessing its cloud-based application suite and support fees from customers purchasing support. Arrangements with customers do not provide the customer with the right to take possession of the software supporting the cloud-based application service at any time. Professional services and other revenue include fees from consultation services to support the business process mapping, configuration, data migration, integration and training. Amounts that have been invoiced are recorded in accounts receivable and in deferred revenue or revenue, depending on whether the revenue recognition criteria have been met.
For the most part, subscription and support agreements are entered into for 12 to 36 months. In aggregate, approximately 90% of the professional services component of the arrangements with customers is performed within 300 days of entering into a contract with the customer.
The Company commences revenue recognition when all of the following conditions are met:
• | There is persuasive evidence of an arrangement; | ||
• | The service is being provided to the customer; | ||
• | The collection of the fees is reasonably assured; and | ||
• | The amount of fees to be paid by the customer is fixed or determinable. | ||
In most instances, revenue from new customer acquisition is generated under sales agreements with multiple elements, comprised of subscription and support fees from customers accessing its cloud-based application suite and professional services associated with consultation services. The Company evaluates each element in a multiple-element arrangement to determine whether it represents a separate unit of accounting. An element constitutes a separate unit of accounting when the delivered item has standalone value and delivery of the undelivered element is probable and within the Company’s control. Subscription and support have standalone value because they are routinely sold separately by the Company. For the most part, professional services have standalone value because the Company has sold professional services separately and there are several third party vendors that routinely provide similar professional services to its customers on a standalone basis.
The Company allocates revenue to each element in an arrangement based on a selling price hierarchy. The selling price for a deliverable is based on its vendor-specific objective evidence (“VSOE”), if available, third-party evidence (“TPE”), if VSOE is not available, or estimated selling price (“ESP”), if neither VSOE nor TPE is available. As the Company has been unable to establish VSOE or TPE for the elements of its arrangements, the Company establishes the ESP for each element primarily by considering the weighted average of actual sales prices of professional services sold on a standalone basis and subscription and support including various add-on modules when sold together without professional services, and other factors such as gross margin objectives, pricing practices and growth strategy. The consideration allocated to subscription and support
46
NetSuite Inc.
Notes to Consolidated Financial Statements
is recognized as revenue over the contract period commencing when the subscription service is made available to the customer. The consideration allocated to professional services is recognized as revenue using the proportional performance method.
The total arrangement fee for a multiple element arrangement is allocated based on the relative ESP of each element. However, since the professional services are generally completed prior to completion of delivery of subscription and support services, the revenue recognized for professional services in a given reporting period does not include fees subject to delivery of subscription and support services. This results in the recognition of revenue for professional services that is generally no greater than the contractual fees for those professional services.
For single element sales agreements, subscription and support revenue is recognized ratably over the contract term beginning on the provisioning date of the contract. The Company recognizes professional services revenue using the proportional performance method for single element arrangements.
Sales and other taxes collected from customers to be remitted to government authorities are excluded from revenues.
Deferred Revenue
Deferred revenue consists of billings or payments received in advance of revenue recognition and is recognized as the revenue recognition criteria are met. The Company generally invoices its customers annually or in monthly or quarterly installments. Accordingly, the deferred revenue balance does not represent the total contract value of annual or multi-year, non-cancelable subscription agreements. Deferred revenue that will be recognized during the succeeding 12 month period is recorded as current deferred revenue, and the remaining portion is recorded as non-current deferred revenue.
Cost of Revenue
Cost of revenue primarily consists of costs related to hosting the Company's cloud-based application suite, providing customer support, data communications expenses, salaries and benefits of operations and support personnel, software license fees, costs associated with website development activities, allocated overhead, amortization expense associated with capitalized internal use software and acquired developed technology assets and property and equipment depreciation. Costs related to professional services are expensed as incurred.
Deferred Commissions
The Company capitalizes commission costs that are incremental and directly related to the acquisition of customer contracts. Commission costs are accrued and capitalized upon execution of the sales contract by the customer. Payments to partners and most sales personnel are made shortly after the receipt of the related customer payment. Payments to managers and above are made either partially or in full once sales contracts are executed. Deferred commissions are amortized over the term of the related non-cancelable customer contract and are recoverable through the related future revenue streams. The Company capitalized commission costs of $119.1 million, $95.5 million and $70.4 million during the years ended December 31, 2015, 2014 and 2013, respectively. Commission amortization expense was $101.1 million, $75.2 million and $55.5 million during the years ended December 31, 2015, 2014 and 2013, respectively.
Internal Use Software and Website Development Costs
The Company capitalizes certain development costs incurred in connection with its internal use software and website. These capitalized costs are primarily related to the integrated business management application suite that is hosted by the Company and accessed by its customers on a subscription basis. Costs incurred in the preliminary stages of development are expensed as incurred. Once an application has reached the development stage, internal and external costs, if direct, are capitalized until the software is substantially complete and ready for its intended use. Capitalization ceases upon completion of all substantial testing. The Company also capitalizes costs related to specific upgrades and enhancements when it is probable the expenditures will result in additional functionality. Capitalized costs are recorded as part of property and equipment. Maintenance and training costs are expensed as incurred. Internal use software is amortized on a straight line basis over its estimated useful life, generally three years. Management evaluates the useful lives of these assets on an annual basis and tests for impairment whenever events or changes in circumstances occur that could impact the recoverability of these assets. There were no impairments to internal use software during the years ended December 31, 2015, 2014 and 2013. The Company capitalized $4.5 million, $4.0 million and $3.2 million in internal use software during the years ended December 31, 2015, 2014 and 2013, respectively. Included in the December 31, 2015, 2014 and 2013 capitalized development costs are $1.5 million, $1.4 million and $1.1 million, respectively, in stock-based compensation costs. Amortization expense totaled $3.5 million, $2.7 million and $1.6 million during the years ended December 31, 2015, 2014 and 2013, respectively. The net book value of capitalized internal use software at December 31, 2015 and 2014 was $8.8 million and $7.8 million, respectively.
Income Taxes
47
NetSuite Inc.
Notes to Consolidated Financial Statements
The Company accounts for income taxes under the asset and liability approach. Deferred income taxes reflect the impact of temporary differences between assets and liabilities recognized for financial reporting purposes and amounts recognized for income tax reporting purposes, net operating loss carryforwards and other tax credits measured by applying currently enacted tax laws. Valuation allowances are provided when necessary to reduce deferred tax assets to an amount that is more likely than not to be realized.
Compliance with income tax regulations requires the Company to make decisions relating to the transfer pricing of revenue and expenses between each of its legal entities that are located in several countries. The Company's determinations include many decisions based on management's knowledge of the underlying assets of the business, the legal ownership of these assets, and the ultimate transactions conducted with customers and other third parties. The calculation of the Company's tax liabilities involves dealing with uncertainties in the application of complex tax regulations in multiple tax jurisdictions. The Company may be periodically reviewed by domestic and foreign tax authorities regarding the amount of taxes due. These reviews may include questions regarding the timing and amount of deductions and the allocation of income among various tax jurisdictions. In evaluating the exposure associated with various filing positions, the Company records estimated reserves when it is more likely than not that an uncertain tax position will not be sustained upon examination by a taxing authority. Such estimates are subject to change. See Note 15 for information regarding the impact of the Company's accounting for uncertainty in income taxes.
Cash and Cash Equivalents
The Company considers all highly liquid investments purchased with a remaining maturity of three months or less to be cash equivalents. Cash equivalents are comprised of investments in money market mutual funds and commercial paper. Cash and cash equivalents are recorded at cost, which approximates fair value.
Goodwill and Other Intangible Assets
The Company records goodwill when consideration paid in a purchase acquisition exceeds the fair value of the net tangible assets and the identified intangible assets acquired. Goodwill is not amortized, but rather is tested for impairment annually or more frequently if facts and circumstances warrant a review. The Company has determined that there is a single reporting unit for the purpose of goodwill impairment tests. For purposes of assessing the impairment of goodwill, the Company annually, on October 1st, estimates the fair value of the reporting unit and compares this amount to the carrying value of the reporting unit. If the Company determines that the carrying value of the reporting unit exceeds its fair value, an impairment charge is recognized in the amount by which the carrying amount of the asset exceeds its fair value. On October 1, 2015, the Company completed its annual impairment test of goodwill. Based upon that evaluation, the Company determined that its goodwill was not impaired.
Other intangible assets, consisting of developed technology, trade name and customer relationships, are stated at cost less accumulated amortization. All other intangible assets have been determined to have definite lives and are amortized on a straight-line basis over their estimated remaining economic lives, ranging from one to seven years. Amortization expense related to developed technology is included in cost of subscription and support revenue while amortization expense related to tradenames and customer relationships is included in sales and marketing expense.
Long-lived Assets
The Company continually monitors events and changes in circumstances that could indicate that carrying amounts of its long-lived assets, including property and equipment and intangible assets may not be recoverable. When such events or changes in circumstances occur, the Company assesses the recoverability of long-lived assets by determining whether the carrying value of such assets will be recovered through their undiscounted expected future cash flows. If the future undiscounted cash flows are less than the carrying amount of these assets, the Company recognizes an impairment loss based on the excess of the carrying amount over the fair value of the assets.
The Company did not recognize any impairment charges on its long-lived assets during the years ended 2015, 2014 and 2013.
Leases
The Company leases worldwide facilities and certain other equipment under non-cancelable lease agreements. The terms of certain lease agreements provide for rental payments on a graduated basis. The Company recognizes rent expense on a straight-line basis over the lease period and accrues for rent expense incurred but not paid.
Under certain leases, the Company also receives reimbursements for leasehold improvements. These reimbursements are lease incentives which are recognized as a liability and are amortized on a straight-line basis over the term of the lease as a
48
NetSuite Inc.
Notes to Consolidated Financial Statements
reduction of minimum rental expense. The leasehold improvements are included in property, plant and equipment and are amortized over the shorter of the estimated useful life of the improvements or the lease term.
Property and Equipment
Property and equipment are stated at cost less accumulated depreciation and amortization. Depreciation is computed on a straight-line basis over the estimated asset lives. The estimated useful lives by asset classification are generally as follows:
Asset classification | Estimated useful life in years | |
Office equipment | 3 | |
Furniture and fixtures | 5 | |
Computers | 3 | |
Software, perpetual license | 3 to 7 | |
Software, license with stated term | Term of the license | |
Upon retirement or disposition of property and equipment, the cost and related accumulated depreciation are removed from the accounts and any resulting gain or loss is recognized in other income.
Warranties and Indemnification
The Company's cloud-based application service is typically warranted to perform in a manner consistent with general industry standards that are reasonably applicable and materially in accordance with the Company's on-line help documentation under normal use and circumstances.
The Company includes service level commitments to its customers warranting certain levels of uptime reliability and performance and permitting those customers to receive credits in the event that the Company fails to meet those levels. To date, the Company has not incurred any material costs.
The Company has also agreed to indemnify its directors and executive officers for costs associated with any fees, expenses, judgments, fines and settlement amounts incurred by any of these persons in any action or proceeding to which any of those persons is, or is threatened to be, made a party by reason of the person's service as a director or officer, including any action by the Company, arising out of that person's services as the Company's director or officer or that person's services provided to any other company or enterprise at the Company's request. The Company maintains director and officer insurance coverage that may enable the Company to recover a portion of any future amounts paid.
The Company's arrangements include provisions indemnifying customers against liabilities if our products infringe a third-party's intellectual property rights. The Company has not incurred any costs as a result of such indemnifications and has not accrued any liabilities related to such obligations in the accompanying consolidated financial statements.
Concentration of Credit Risk and Significant Customers and Suppliers
Financial instruments potentially exposing the Company to concentration of credit risk consist primarily of cash and cash equivalents, marketable securities, restricted cash and trade accounts receivable. The Company maintains an allowance for doubtful accounts receivables balance. The allowance is based upon historical loss patterns, the number of days that billings are past due and an evaluation of the potential risk of loss associated with problem accounts. The Company generally charges off uncollectible accounts receivable balances when accounts are 120 days past-due based on the account's contractual terms. Credit risk arising from accounts receivable is mitigated due to the large number of customers comprising the Company's customer base and their dispersion across various industries. At December 31, 2015 and 2014, there were no customers that represented more than 10% of the net accounts receivable balance. There were no customers that individually exceeded 10% of the Company's revenue in any of the periods presented. At December 31, 2015 and 2014, long-lived assets located outside the United States totaled $21.4 million and $9.1 million, respectively.
Revenue by geographic region, based on the billing address of the customer, was as follows for the periods presented:
49
NetSuite Inc.
Notes to Consolidated Financial Statements
Year ended December 31, | |||||||||||
2015 | 2014 | 2013 | |||||||||
(dollars in thousands) | |||||||||||
United States | $ | 553,186 | $ | 414,172 | $ | 308,513 | |||||
International | 187,963 | 142,112 | 105,995 | ||||||||
Total revenue | $ | 741,149 | $ | 556,284 | $ | 414,508 | |||||
Percentage of revenue generated outside of the United States | 25 | % | 26 | % | 26 | % | |||||
No single country outside the United States represented more than 10% of revenue during the years ended December 31, 2015, 2014 or 2013.
Certain Significant Risks and Uncertainties
The Company participates in the dynamic high technology industry and believes that changes in any of the following areas could have a material adverse effect on the Company's future financial position, results of operations or cash flows; advances and trends in new technologies and industry standards; pressures resulting from new applications offered by competitors; changes in certain strategic or customer relationships; litigation or claims against the Company based on intellectual property, patent, product, regulatory or other factors; risk associated with changes in domestic and international economic or political conditions or regulations; availability of necessary product components; and the Company's ability to attract and retain employees necessary to support its growth.
Foreign Currency Translation
The U.S. dollar is the reporting currency for all periods presented. The financial information for entities outside the United States is measured in their functional currency which, depending on circumstances, may either be the local currency or the U.S. dollar. The Company translates its financial statements of consolidated entities whose functional currency is not the U.S. dollar into U.S. dollars. The Company translates its assets and liabilities at the exchange rate in effect as of the financial statement date and translates statement of operations accounts using the average exchange rate for the period. Exchange rate differences resulting from translation adjustments are accounted for as a component of accumulated other comprehensive income / (loss). Gains or losses, whether realized or unrealized, due to transactions in foreign currencies are reflected in the consolidated statements of operations under the line item other income / (expense). The Company recognized net foreign currency losses of $502,000, $437,000 and $343,000 during the years ended December 31, 2015, 2014 and 2013, respectively.
Advertising Expense
Advertising costs are expensed as incurred. For the years ended December 31, 2015, 2014 and 2013, advertising expense was $10.5 million, $12.8 million and $8.2 million, respectively.
Stock-Based Compensation
The Company uses the fair value method for recording stock-based compensation for new awards granted, modified, repurchased or canceled. The Company recognizes compensation costs for stock option grants, restricted awards and restricted stock unit awards on a straight-line basis over the requisite service period for the entire awards. The Company recognizes compensation expense related to performance share awards based on the accelerated method which recognizes a larger portion of the expense during the beginning of the vesting period than in the end of the vesting period.
Under the 2007 Equity Incentive Plan (the "2007 Plan"), the Company has granted selected executives and other key employees performance shares ("PS") and performance share units ("PSUs"), which are restricted stock units (“RSUs”). PS vesting is contingent upon meeting certain company-wide performance goals while PSUs vesting is contingent upon meeting certain company-wide performance goals and market-based performance goals. Unforfeited PS and PSUs generally will vest in three equal annual tranches over the service period. The PS and PSUs grant date fair value, which is also the total stock-based compensation expense associated with the performance based awards, is determined based on the value of the underlying shares on the grant date and is recognized over the vesting term. On a quarterly basis, management estimates the number of PS and PSUs that will be granted at the end of the performance period. The PS fair value is based on market value of shares on the grant date (the intrinsic value). The fair value of the market-based PSUs on the grant date (measurement date) is calculated using a Monte Carlo simulation model that estimates the distribution of the potential outcomes of the PSU grants based on simulated future stock prices of the peer group.
50
NetSuite Inc.
Notes to Consolidated Financial Statements
The Company accounts for compensation expense related to stock options granted to consultants and other non-employees based on the fair values estimated using the Black-Scholes model on the date of grant and re-measured at each reporting date over the performance period. The compensation expense is amortized using the straight-line method over the related service term.
The Company issues new shares of its common stock upon the exercise of stock options, the vesting of restricted stock, RSUs, PSs and PSUs and the purchase of stock under the employees stock purchase plan.
Qualified Operational Expense Reimbursements
At the Company's product development facility in the Czech Republic, the Company participates in a government subsidy program for employing local residents. Under the program, the Czech Republic government will reimburse the Company for certain operational expenses it incurs. While the Company became eligible to participate in this program in 2010, it did not record a subsidy credit in the financial statements until it was assured of collection in 2012. Effective January 2012, when the Company incurs reimbursable operating expenses, it records a reduction in operational expenses and a receivable from the Czech government. In the second quarter of 2015, the Company reached the initial program's reimbursement limit. The Company's operational expenses were reduced by approximately $562,000, $1.5 million and $2.5 million, for reimbursements of eligible operating expenses incurred during the years ended December 31, 2015, 2014 and 2013, respectively. The Company received approximately $1.2 million, $2.2 million and $2.0 million in payments from the Czech Republic government during the years ended December 31, 2015, 2014 and 2013, respectively. As of December 31, 2015, no reimbursements are due the Company. Currently, the Company is evaluating alternative subsidy employment plans offered by the Czech Republic and other countries.
Net Loss Per Common Share
Basic net loss per common share is computed by dividing net loss attributable to NetSuite Inc. common stockholders by the weighted-average number of common shares outstanding during the period. Diluted net loss per common share is computed by giving effect to all potentially dilutive common shares including options, restricted stock, restricted stock units, performance share units, performance shares, employee stock purchase plan shares and convertible debt shares. Basic and diluted net loss per common share was the same for all periods presented as the impact of all potentially dilutive securities outstanding was anti-dilutive.
Accumulated Other Comprehensive Loss
Accumulated other comprehensive income loss is comprised of foreign currency translation gains and losses, net of tax, unrealized losses on marketable securities and an accumulated pension liability for employees located in the Philippines. The foreign currency translation losses, net of taxes as of December 31, 2015 and 2014 were $12.6 million and $5.7 million, respectively. Unrealized loss on marketable securities was $86,000 and $5,000 as of December 31, 2015 and 2014, respectively. During the years ended December 31, 2015, 2014 and 2013, there were no realized gains/ (losses) on marketable securities. The unamortized defined benefit pension costs as of December 31, 2015 and 2014 were $(280,000) and $(178,000), respectively.
51
NetSuite Inc.
Notes to Consolidated Financial Statements
Note 3. Business Combinations
During 2015, the Company purchased all the outstanding equity of Monexa Services Inc. ("Monexa"), a private company that provides cloud-based invoicing and payment services, and Bronto Software, Inc. ("Bronto"), a private company that provides a cloud-based marketing platform for its customers to drive revenue through their email, mobile and social campaigns. In connection with these acquisitions, the Company incurred transaction costs totaling $6.7 million.
The following table summarizes the preliminary allocation of the consideration to the fair value of assets acquired and liabilities assumed as of the acquisition dates:
2015 Acquisitions | |||||||
Monexa | Bronto | ||||||
August 5, 2015 | June 8, 2015 | ||||||
(dollars in thousands) | |||||||
Cash | $ | 594 | $ | 1,667 | |||
Accounts receivable | 238 | 4,077 | |||||
Property and equipment | 231 | 4,009 | |||||
Deferred tax assets | 96 | 5,345 | |||||
Developed technology | 8,700 | 13,400 | |||||
Customer relationships | 4,200 | 13,100 | |||||
Customer relationships - backlog | — | 3,000 | |||||
Trademarks | 400 | 3,060 | |||||
Favorable lease | 270 | — | |||||
Goodwill | 18,602 | 157,058 | |||||
Deferred tax liabilities | — | (13,495 | ) | ||||
Taxes payable | (370 | ) | (2,758 | ) | |||
Other assets / liabilities, net | 159 | (4,357 | ) | ||||
Fair value of assets acquired and liabilities assumed | $ | 33,120 | $ | 184,106 | |||
Under the acquisition method of accounting, the Company allocated the purchase price to the identifiable assets and liabilities based on their estimated fair value at the date of acquisition. To determine the value of the intangible assets, the Company made various estimates and assumptions. For Monexa, the methodologies used in valuing the intangible assets include, but are not limited to, multiple period excess earnings method for customer relationships, relief of royalty for trademarks, and replacement cost and relief from royalty methods for developed technology. For Bronto, the methodologies used in valuing the intangible assets include, but are not limited to, the with-and-without excess earnings and multiple period excess earnings method for customer relationships, relief of royalty for trademarks and multiple period excess earnings method for developed technology. In both acquisitions, the excess of the purchase price over the total net identifiable assets has been recorded as goodwill which includes synergies expected from the expanded service capabilities and the value of the assembled workforce in accordance with generally accepted accounting principles. $7.3 million of the acquired Monexa goodwill is expected to be deductible for tax purposes. The Company did not record any in-process research and development intangible assets in connection with the acquisitions.
The Company will amortize certain intangible assets on a straight-line basis, except for customer relationship - backlog, which is amortized in proportion to the related revenue recognition, over the following periods:
52
NetSuite Inc.
Notes to Consolidated Financial Statements
Monexa | Bronto | ||||||||||||
Fair Value | Useful Life | Fair Value | Useful Life | ||||||||||
(dollars in thousands) | (in years) | (dollars in thousands) | (in years) | ||||||||||
Developed technology | $ | 8,700 | 5 | $ | 13,400 | 5 | |||||||
Customer relationships | 4,200 | 4 | 13,100 | 7 | |||||||||
Customer relationships - backlog | — | — | 3,000 | 1.5 | |||||||||
Trademarks | 400 | 2 | 3,060 | 3 | |||||||||
Favorable lease | 270 | 1.5 | — | — | |||||||||
Monexa Software
On August 5, 2015, the Company completed the purchase of all the outstanding equity of Monexa Services Inc. ("Monexa"), a private company that provides cloud-based invoicing and payment services for its customers. Monexa functionality will enhance the Company’s existing invoicing and payment solution. Beginning in the third quarter of 2015, Monexa assets, liabilities and operating results are reflected in the Company’s consolidated financial statements from the date of acquisition. On the closing date, the Company paid approximately $33.1 million in cash. Of the consideration paid, $5.7 million is being held in escrow for up to 15 months following the close of the transaction in the event of certain breaches of representations, warranties and potential tax obligations covered in the purchase agreement. In connection with the transaction, the Monexa Board of Directors accelerated the vesting of certain Monexa employee stock options that were exercised shortly before the closing date. Since Monexa accelerated the stock option vesting in contemplation of the business combination, the Company was required to record the $1.8 million in net proceeds received by Monexa employees as compensation cost in the general and administrative expense line of the Company's financial statements. Acquisition related transaction costs amounted to $4.0 million and are reflected as general and administrative expense in the statement of operations.
The initial accounting for Monexa intangible assets is incomplete because the Company is in the process of determining the fair value of these assets. The Company is also undertaking an analysis of certain tax matters associated with the Monexa acquisition which could result in an adjustment to the acquisition price allocation.
Comparative pro forma financial information for this acquisition has not been presented because Monexa historical financial results are not material to the Company's consolidated results of operations.
Bronto Software
On June 8, 2015, the Company completed the purchase of all the outstanding equity of Bronto Software, Inc. (“Bronto"), a private company that provides a cloud-based marketing platform for its customers to drive revenue through their email, mobile and social campaigns. Bronto functionality will enhance the Company’s existing email marketing solution and its existing omnichannel commerce platform. Beginning in the second quarter of 2015, Bronto assets, liabilities and operating results are reflected in the Company’s consolidated financial statements from the date of acquisition. The Company paid approximately $98.2 million in cash and issued 1,030,508 unregistered shares of the Company's common stock with a fair value of $85.9 million, inclusive of a discount from the quoted market price due to certain trading restrictions associated with the shares. Of the consideration paid, $39.6 million is being held in escrow for up to 18 months following the close of the transaction in the event of certain breaches of representations and warranties covered in the purchase agreement. Another $3.9 million is being held in escrow for up to two years as protection against tax contingencies and losses. Acquisition related transaction costs amounted to $5.3 million and are reflected as general and administrative expense in the statement of operations.
The fair value of the 1,030,508 unregistered shares of common stock issued as part of the consideration paid for Bronto ($85.9 million) was determined on the basis of the closing market price of the Company’s common stock on the acquisition date less a discount for lack of marketability due to the 6-month restriction of resale as a result of SEC Rule 144 for issuance of unregistered shares to a non-affiliate as such term is defined therein.
The initial accounting for Bronto accounts receivable, other customer related liabilities, vendor obligations and employee related liabilities is incomplete because the Company is in the process of determining the fair value of these assets and liabilities. The Company is also undertaking an analysis of certain tax matters associated with the Bronto acquisition which could result in an adjustment to the acquisition price allocation.
53
NetSuite Inc.
Notes to Consolidated Financial Statements
Bronto revenue included in the Company's consolidated financial statements for the year ended December 31, 2015 was $22.1 million. Bronto's operations have been integrated into the Company's operations so it is impractical to determine Bronto's results of operations on a standalone basis.
The financial information in the table below summarizes the combined results of operations of the Company and Bronto, on a pro forma basis, as though the companies had been combined as of January 1, 2014. The pro forma financial information for Bronto is presented for informational purposes only and is not indicative of the results of operations that would have been achieved if the acquisition had taken place on January 1, 2014 or of results that may occur in the future. The pro forma results include adjustments primarily related to amortization of developed technology, customer relationships and trademarks. The pro forma results also include a one-time adjustment to exclude $3.1 million in Bronto transaction costs.
Supplemental information on a pro forma basis, as if Bronto had been acquired on January 1, 2014, is presented as follows:
Twelve Months Ended December 31, | |||||||
2015 | 2014 | ||||||
(dollars in thousands) | |||||||
Pro forma total revenue | $ | 760,239 | $ | 593,452 | |||
Pro forma net loss | $ | (131,781 | ) | $ | (109,120 | ) | |
Pro forma loss per share - basic and diluted | $ | (1.67 | ) | $ | (1.41 | ) | |
2014 Acquisitions
During 2014, the Company purchased the assets of certain warehouse management solution provider ("WMS") to expand its manufacturing vertical and Venda Limited (“Venda") to further develop its ecommerce vertical. In connection with these acquisitions, the Company incurred transaction costs totaling $4.6 million.
The following table summarizes the allocation of the consideration to the fair value of assets acquired and liabilities assumed as of the acquisition date:
2014 Acquisitions | |||||||
WMS | Venda | ||||||
September 26, 2014 | July 17, 2014 | ||||||
(dollars in thousands) | |||||||
Accounts receivable | $ | — | $ | 3,763 | |||
Developed technology | 700 | 7,700 | |||||
Customer relationships | 300 | 12,300 | |||||
Trademarks | 20 | 2,700 | |||||
Goodwill | 14,752 | 27,228 | |||||
Accounts payable | — | (2,085 | ) | ||||
Deferred tax liabilities | — | (2,132 | ) | ||||
Tax related liabilities | — | (2,909 | ) | ||||
Other assets / (liabilities), net | (180 | ) | 1,873 | ||||
Total purchase price | $ | 15,592 | $ | 48,438 | |||
Under the acquisition method of accounting, the Company allocated the above purchase prices to the identifiable assets and liabilities based on their estimated fair value at the date of acquisition. To determine the value of the intangible assets, the Company made various estimates and assumptions. Methodologies used in valuing the intangible assets include, but are not limited to, the with-and-without excess earnings for customer relationships, relief of royalty for trademarks and multiple period excess earnings method for developed technology. The excess of the purchase price over the total net identifiable assets for each acquisition has been recorded as goodwill which includes synergies expected from the expanded service capabilities and the value of the assembled work force in accordance with generally accepted accounting principles. The Company did not record any in-process research and development intangible assets in connection with these acquisitions.
54
NetSuite Inc.
Notes to Consolidated Financial Statements
The Company will amortize the intangible assets on a straight-line basis over the following periods:
WMS | Venda | ||||||||||
Fair Value Amount | Useful Life | Fair Value Amount | Useful Life | ||||||||
(dollars in thousands) | (in years) | (dollars in thousands) | (in years) | ||||||||
Developed technology | $ | 700 | 5 | 7,700 | 5 | ||||||
Customer relationships | 300 | 4 | 12,300 | 7 | |||||||
Trademarks | — | — | 2,700 | 3 | |||||||
WMS
On September 26, 2014, the Company purchased certain WMS assets to expand its manufacturing vertical. The WMS assets, liabilities and operating results are reflected in the Company’s consolidated financial statements from the date of acquisition. On the closing date, the Company paid $15.6 million in cash of which, $2.4 million is being held in escrow for up to 18 months following the close of the transaction as indemnification against certain losses the Company may incur in the event of certain breaches of representations and warranties covered in the asset purchase agreement. Additionally, $350,000 of consideration is being held in escrow until certain WMS tax matters are resolved.
Venda
On July 17, 2014, the Company completed the purchase of all the outstanding equity of Venda, a private company that provides ecommerce solutions to its customers. Venda expands the Company’s European customer base and adds certain functionality to the Company's product suite. The Venda assets, liabilities and operating results are reflected in the Company’s consolidated financial statements from the date of acquisition. On the closing date, the Company paid $25.7 million in cash and issued 304,364 unregistered shares of the Company's common stock with a fair value of $22.8 million inclusive of a discount from the quoted market price due to certain trading restrictions associated with the shares. Of the cash consideration paid, $10.1 million is being held in escrow for up to two years following the close of the transaction as protection against tax contingencies and losses the Company may incur in the event of certain breaches of representations and warranties covered in the purchase agreement.
In the first quarter of 2015, the Company completed the valuation of intangible assets with definitive lives which resulted in $1.2 million being reallocated from goodwill to developed technology. Following this reallocation, the amount allocated to developed technology is $8.9 million. In the third quarter of 2015, the Company completed the initial accounting for Venda by recording a $1.0 million receivable from the former Venda owners related to a working capital adjustment and a $368,000 fair value adjustment to increase the Venda accounts receivable.
Comparative pro forma financial information for WMS and Venda acquisitions has not been presented because the WMS and Venda historical financial statements are not material to the Company's consolidated results of operations.
2013 Acquisitions
During 2013, the Company acquired TribeHR, an on-line human capital management software provider and, OrderMotion, an online ecommerce company and a website hosting provider company. In connections with these acquisitions, the Company incurred transaction costs totaling $3.0 million.
55
NetSuite Inc.
Notes to Consolidated Financial Statements
2013 Acquisitions | |||||||||||
TribeHR | OrderMotion | Website Hosting Provider | |||||||||
November 1, 2013 | May 3, 2013 | March 6, 2013 | |||||||||
(dollars in thousands) | |||||||||||
Cash | $ | — | $ | 1,069 | $ | 264 | |||||
Accounts receivable | — | 804 | — | ||||||||
Developed technology | 1,300 | 5,100 | 1,100 | ||||||||
Customer relationships | 1,000 | 3,000 | 2,100 | ||||||||
Trademarks | 600 | 400 | 200 | ||||||||
Goodwill | 21,543 | 18,176 | 9,721 | ||||||||
Other assets / (liabilities), net | 352 | (433 | ) | (75 | ) | ||||||
Deferred income tax liabilities | — | — | (1,322 | ) | |||||||
Total purchase price | $ | 24,795 | $ | 28,116 | $ | 11,988 | |||||
Under the acquisition method of accounting, the Company allocates the purchase price to the identifiable assets and liabilities based on their estimated fair value at the date of acquisition. To determine the value of the intangible assets, the Company makes various estimates and assumptions. Methodologies used in valuing the intangible assets include, but are not limited to, the expected costs to recreate the assets, present value of future payments, relief of royalty and multiple period excess earnings. The excess of the purchase price over the total identifiable assets has been recorded as goodwill which includes synergies expected from the expanded service capabilities and the value of the assembled work force in accordance with generally accepted accounting principles.
The Company will amortize the intangible assets on a straight-line basis over the following periods:
TribeHR | OrderMotion | Web Hosting Provider | ||||||||||||
Fair Value | Useful Life | Fair Value | Useful Life | Fair Value | Useful Life | |||||||||
(dollars in thousands) | (in years) | (dollars in thousands) | (in years) | (dollars in thousands) | (in years) | |||||||||
Developed technology | 1,300 | 5 | 5,100 | 4 | 1,100 | 3 | ||||||||
Customer relationships | 1,000 | 4 | 3,000 | 4 | 2,100 | 4 | ||||||||
Trademarks | 600 | 2 | 400 | 2 | 200 | 2 | ||||||||
TribeHR
On November 1, 2013, the Company completed the purchase all of the outstanding equity of TribeHR ("T-HR"), an on-line human capital management software provider. The T-HR product expands the Company's product suite and the T-HR workforce augments the Company's existing product development teams, which allows the Company to expand its business capabilities in human resource management. The assets, liabilities and operating results of T-HR are reflected in the Company’s consolidated financial statements from the date of acquisition. On the closing date, the Company paid $24.8 million in cash of which, $2.5 million was being held in escrow for up to 12 months following the close of the transaction as indemnification against certain losses the Company may incur in the event of certain breaches of representations and warranties covered in the purchase agreement.
During the fourth quarter of 2013, the Company recorded $1.3 million in operating expenses related to transaction costs associated with this business combination.
OrderMotion
On May 3, 2013, the Company completed the purchase all of the outstanding equity of OrderMotion ("OM"). OM provides online ecommerce Order Management Services that performs the back-end process for ecommerce web stores. The OM product augments the Company's existing product offering, which allows the Company to expand its business capabilities in ecommerce technology and services. The assets, liabilities and operating results of OM are reflected in the Company’s consolidated financial statements from the date of acquisition. On the closing date, the Company paid the former owners $23.5 million in cash. Additional consideration of $3.5 million in cash is being withheld up to 15 months following the close of the transaction as indemnification against certain losses the Company may incur in the event of certain breaches of representations and warranties covered in the purchase agreement. The Company also withheld $1.1 million as indemnification against losses the Company may incur from certain tax related matters of OM. This consideration is restricted until the Company determines
56
NetSuite Inc.
Notes to Consolidated Financial Statements
that the matters have been properly settled. During the second quarter of 2013, the Company recorded $311,000 in employee termination costs and $1.1 million in operating expenses related to transaction costs associated with this business combination.
As of December 31, 2013, the Company's OM purchase consideration obligations totaled $3.9 million. During the year ended December 31, 2014, the Company paid the former OM owners $3.3 million in cash. As of December 31, 2015, the Company's remaining OM purchase consideration obligation is $655,000.
Website Hosting Provider
On March 6, 2013, the Company completed the purchase of all the outstanding equity of a website hosting provider company ("WH") that specializes in ecommerce technology and services. The WH workforce augments the Company's existing product development teams, which allows the Company to expand its business capabilities in ecommerce technology and services. The assets, liabilities and operating results of WH are reflected in the Company’s consolidated financial statements from the date of acquisition. On the closing date, the Company paid $10.2 million in cash. Additional consideration of $1.8 million in cash is being withheld for various periods up to 24 months following the close of the transaction as indemnification against certain losses the Company may incur in the event of certain breaches of representations and warranties covered in the purchase agreement. During the first quarter of 2013, the Company recorded $560,000 in operating expenses related to transaction costs associated with this business combination.
During the year ended December 31, 2014, the Company paid the former owners $1.0 million of the withheld consideration and reduced the remaining obligation by approximately $200,000 for various adjustments. In 2015, the Company paid the former owners $600,000 to settle the remaining consideration obligation.
Note 4. Cash and Cash Equivalents
Cash equivalents are comprised of investments in money market mutual funds and commercial paper. Cash and cash equivalents are recorded at cost, which approximates fair value.
December 31, | ||||||||
2015 | 2014 | |||||||
(dollars in thousands) | ||||||||
Cash | $ | 262,876 | $ | 206,947 | ||||
Money market mutual funds | 16,092 | 152,673 | ||||||
Commercial paper | 10,998 | 8,149 | ||||||
Total cash and cash equivalents | $ | 289,966 | $ | 367,769 | ||||
The Company maintains cash balances at several banks. Accounts located in the United States are insured by the Federal Deposit Insurance Corporation ("FDIC") up to $250,000. Certain operating cash accounts may exceed the FDIC limits.
Note 5. Financial Instruments
The Company invests primarily in money market funds, commercial paper, highly liquid debt instruments of the U.S. government and its agencies, U.S. municipal obligations, and U.S. and foreign corporate debt securities. All highly liquid investments with maturities of 90 days or less from date of purchase are classified as cash equivalents and all highly liquid investments with maturities of greater than 90 days but less than a year from date of purchase are classified as short-term marketable securities. Highly liquid investments with maturities of greater than a year from the balance sheet date are classified as marketable securities, non-current. Short-term marketable securities and marketable securities, non-current are also classified as available-for-sale. The Company intends to hold marketable securities until maturity; however, it may sell these securities at any time for use in current operations or for other purposes, such as consideration for acquisition. Consequently, the Company may or may not hold securities with stated maturities greater than twelve months until maturity.
The Company carries its fixed income investments at fair value and unrealized gains and losses on these investments, net of taxes, are included in accumulated other comprehensive loss, a component of total equity. Realized gains or losses are included in other income / (expense), net section of the consolidated statement of operations and comprehensive loss. When a determination has been made that an other-than-temporary decline in fair value has occurred, the amount of the decline that is related to a credit loss is realized and is included in the other income / (expense), net section of the consolidated statement of operations and comprehensive loss.
57
Marketable securities consist of the following investments:
December 31, 2015 | |||||||||||||||
Amortized Cost | Unrealized Gains | Unrealized Losses | Fair Value | ||||||||||||
Cash equivalents: | (in thousands) | ||||||||||||||
Money market funds | $ | 16,092 | $ | — | $ | — | $ | 16,092 | |||||||
Commercial paper | 10,998 | — | — | 10,998 | |||||||||||
Marketable securities: | |||||||||||||||
Commercial paper | 33,170 | — | — | 33,170 | |||||||||||
Corporate notes and obligations | 12,402 | — | (13 | ) | 12,389 | ||||||||||
U.S. agency bonds | 11,410 | — | (25 | ) | 11,385 | ||||||||||
U.S. treasury securities | 31,727 | — | (48 | ) | 31,679 | ||||||||||
Total | $ | 115,799 | $ | — | $ | (86 | ) | $ | 115,713 | ||||||
December 31, 2014 | |||||||||||||||
Amortized Cost | Unrealized Gains | Unrealized Losses | Fair Value | ||||||||||||
Cash equivalents: | (in thousands) | ||||||||||||||
Money market funds | $ | 152,673 | $ | — | $ | — | $ | 152,673 | |||||||
Commercial paper | 8,149 | — | — | 8,149 | |||||||||||
Marketable securities: | |||||||||||||||
Commercial paper | 70,737 | 8 | — | 70,745 | |||||||||||
Corporate notes and obligations | 11,886 | — | (9 | ) | 11,877 | ||||||||||
U.S. treasury securities | 9,147 | — | (4 | ) | 9,143 | ||||||||||
Total | $ | 252,592 | $ | 8 | $ | (13 | ) | $ | 252,587 | ||||||
The Company does not believe any of the unrealized losses represent an other-than-temporary impairment based on its evaluation of available evidence as of December 31, 2015. The Company expects to receive the full principal and interest on all of these marketable securities.
December 31, 2015 | ||||
Fair Value | ||||
Due within one year | $ | 101,838 | ||
Due within two years | 13,875 | |||
Total | $ | 115,713 | ||
Fair Value Measurements
The Company measures certain financial assets at fair value on a recurring basis based on a fair value hierarchy that requires the Company to maximize the use of observable inputs and minimize the use of unobservable inputs when measuring fair value. A financial instrument’s categorization within the fair value hierarchy is based upon the lowest level of input that is significant to the fair value measurement. The three levels of inputs that may be used to measure fair value are:
• | Level 1 - Quoted prices in active markets for identical assets or liabilities. |
• | Level 2 - Observable inputs other than Level 1 prices such as quoted prices for similar assets or liabilities; quoted prices in markets with insufficient volume or infrequent transactions (less active markets); or model-derived valuations in which all significant inputs are observable or can be derived principally from or corroborated by observable market data for substantially the full term of the assets or liabilities. |
• | Level 3 - Unobservable inputs to the valuation methodology that are significant to the measurement of fair value of assets or liabilities. |
58
Level 1 Measurements
The Company's cash equivalents held in money market funds and available-for-sale United States Treasury securities are measured at fair value using level 1 inputs.
Level 2 Measurements
The Company's available-for-sale corporate debt securities and commercial paper are measured at fair value using level 2 inputs. The Company obtains the fair values of its level 2 available-for-sale securities from a professional pricing service.
The Company’s foreign currency forward contracts are measured at fair value using foreign currency rates quoted by banks or foreign currency dealers and other public data sources. Such instruments are classified as Level 2 and are included in other current assets and liabilities.
The fair value of these financial assets and liabilities was determined using the following inputs as of December 31, 2015 and 2014:
December 31, 2015 | December 31, 2014 | ||||||||||||||||||||||||||||||
Fair value measurements at reporting date using | Fair value measurements at reporting date using | ||||||||||||||||||||||||||||||
Level 1 | Level 2 | Level 3 | Total | Level 1 | Level 2 | Level 3 | Total | ||||||||||||||||||||||||
(in thousands) | (in thousands) | ||||||||||||||||||||||||||||||
Assets: | |||||||||||||||||||||||||||||||
Cash and cash equivalents | |||||||||||||||||||||||||||||||
Cash | $ | 262,876 | $ | — | $ | — | $ | 262,876 | $ | 206,947 | $ | — | $ | — | $ | 206,947 | |||||||||||||||
Money market funds | 16,092 | — | — | 16,092 | 152,673 | — | — | 152,673 | |||||||||||||||||||||||
Commercial paper | — | 10,998 | — | 10,998 | — | 8,149 | — | 8,149 | |||||||||||||||||||||||
Marketable securities | |||||||||||||||||||||||||||||||
Commercial paper | — | 33,170 | — | 33,170 | — | 70,745 | — | 70,745 | |||||||||||||||||||||||
Corporate notes and obligations | — | 12,389 | — | 12,389 | — | 11,877 | — | 11,877 | |||||||||||||||||||||||
U.S. agency bonds | — | 11,385 | — | 11,385 | — | — | — | — | |||||||||||||||||||||||
U.S. treasury securities | 31,679 | — | — | 31,679 | 9,143 | — | — | 9,143 | |||||||||||||||||||||||
Foreign exchange contracts | — | 384 | — | 384 | — | 1,231 | — | 1,231 | |||||||||||||||||||||||
Total | $ | 310,647 | $ | 68,326 | $ | — | $ | 378,973 | $ | 368,763 | $ | 92,002 | $ | — | $ | 460,765 | |||||||||||||||
Liabilities: | |||||||||||||||||||||||||||||||
Foreign exchange contracts | $ | — | $ | — | $ | — | $ | — | $ | — | $ | 1 | $ | — | $ | 1 | |||||||||||||||
Total | $ | — | $ | — | $ | — | $ | — | $ | — | $ | 1 | $ | — | $ | 1 | |||||||||||||||
Note 6. Hedging Activity
Balance Sheet Hedging - Hedging of Foreign Currency Assets and Liabilities
During the year ended December 31, 2015, the Company hedged certain of its nonfunctional currency denominated assets and liabilities to reduce the risk that earnings would be adversely affected by changes in exchange rates. The notional amount of derivative instruments acquired during the period was $355.4 million. The Company accounts for derivative instruments as other current assets and liabilities on the balance sheet and measures them at fair value with changes in the fair value recorded as other income / (expense). These derivative instruments do not subject the Company to material balance sheet risk due to exchange rate movements because gains and losses on these derivatives are intended to offset gains and losses on the assets and liabilities being economically hedged.
59
As of year-end, the Company had the following outstanding foreign exchange forward contracts:
December 31, 2015 | December 31, 2014 | ||||||||||||||
Notional Value Sold | Notional Value Purchased | Notional Value Sold | Notional Value Purchased | ||||||||||||
(US dollars in thousands) | |||||||||||||||
Australian dollar | $ | 17,148 | $ | 6,953 | $ | 16,004 | $ | 7,494 | |||||||
British pound | 16,959 | 9,183 | 16,939 | 7,284 | |||||||||||
Euro | 13,364 | 2,245 | 2,344 | 547 | |||||||||||
Philippine peso | 9,560 | 9,560 | 7,540 | 5,020 | |||||||||||
Czech crown | 6,621 | 6,320 | 6,510 | 4,710 | |||||||||||
Canadian dollar | 5,488 | 4,034 | 796 | 1,267 | |||||||||||
Japanese yen | 4,435 | — | 3,355 | — | |||||||||||
New Zealand dollar | 505 | — | 258 | — | |||||||||||
Mexican peso | 387 | 252 | 268 | 110 | |||||||||||
Total | $ | 74,467 | $ | 38,547 | $ | 54,014 | $ | 26,432 | |||||||
The fair value of the derivative instruments reported on the Company’s Consolidated Balance Sheet were as follows:
Asset Derivatives | Liability Derivatives | ||||||||||||||||||
Balance Sheet Location | December 31, 2015 | December 31, 2014 | Balance Sheet Location | December 31, 2015 | December 31, 2014 | ||||||||||||||
Derivatives and forward contracts | Fair Value | Fair Value | Fair Value | Fair Value | |||||||||||||||
(US dollars in thousands) | |||||||||||||||||||
Foreign exchange contracts | Other current assets | $ | 384 | $ | 1,231 | Other current liabilities | $ | — | $ | 1 | |||||||||
Total | $ | 384 | $ | 1,231 | $ | — | $ | 1 | |||||||||||
The effect of derivative instruments on the Statement of Comprehensive Loss was as follows for the periods presented:
Location of net gain (loss) recognized in income on derivatives | Amount of net gain (loss) recognized in income on derivatives during the | |||||||||||||
Twelve Months Ended December 31, | ||||||||||||||
Derivatives and forward contracts | 2015 | 2014 | 2013 | |||||||||||
(US dollars in thousands) | ||||||||||||||
Foreign exchange contracts | Other income/ (expense), net | $ | 889 | $ | 1,446 | $ | 1,095 | |||||||
Total | $ | 889 | $ | 1,446 | $ | 1,095 | ||||||||
The Company has entered into all of its foreign exchange contracts with a single counterparty. During the periods such contracts are open, the Company is subject to a potential maximum amount of loss due to credit risk equal to the gross fair value of the derivative instruments if the counterparty to the instruments failed completely to perform according to the terms of the contracts. Generally, we have the right of offset for gains earned and losses incurred under these agreements. Our agreements with the counterparty do not require either party to provide collateral to mitigate the credit risk of the agreements.
Note 7. Property and Equipment
As of year end, property and equipment consisted of:
60
December 31, | ||||||||
2015 | 2014 | |||||||
(dollars in thousands) | ||||||||
Computer equipment | $ | 102,889 | $ | 68,630 | ||||
Purchased software | 31,125 | 30,039 | ||||||
Internally developed software | 20,553 | 16,046 | ||||||
Leasehold improvements | 26,896 | 14,942 | ||||||
Furniture, fixtures and office equipment | 15,674 | 9,292 | ||||||
Total property and equipment | 197,137 | 138,949 | ||||||
Accumulated depreciation and amortization | (107,494 | ) | (80,410 | ) | ||||
Property and equipment, net | $ | 89,643 | $ | 58,539 | ||||
Depreciation and amortization expense was $30.4 million, $20.1 million and $15.7 million for the years ended December 31, 2015, 2014 and 2013, respectively.
Note 8. Goodwill and Other Intangible Assets
The change in the carrying amount of goodwill for the years ended December 31, 2015 and 2014 was as follows:
(dollars in thousands) | ||||
Balance as of January 1, 2014 | $ | 84,478 | ||
Adjustments to prior year business combinations | (248 | ) | ||
Goodwill acquired: | ||||
Venda business combination July 2014 | 27,228 | |||
WMS business combination September 2014 | 14,752 | |||
Foreign exchange adjustment | (3,161 | ) | ||
Balance as of December 31, 2014 | 123,049 | |||
Adjustments to prior year business combinations | (2,376 | ) | ||
Goodwill acquired: | ||||
Bronto business combination June 2015 | 157,058 | |||
Monexa business combination August 2015 | 18,602 | |||
Foreign exchange adjustment | (4,377 | ) | ||
Balance as of December 31, 2015 | $ | 291,956 | ||
The Company does not have a history of goodwill impairments.
61
The carrying amount of other intangible assets was as follows:
Gross carrying amount | Accumulated amortization | Net carrying amount | |||||||||||
December 31, 2015 | |||||||||||||
(dollars in thousands) | |||||||||||||
Developed technology | $ | 50,223 | $ | (21,797 | ) | $ | 28,426 | ||||||
Trade name | 8,644 | (4,529 | ) | 4,115 | |||||||||
Customer relationships | 52,782 | (24,555 | ) | 28,227 | |||||||||
Non-competition agreements | 822 | (822 | ) | — | |||||||||
Favorable lease | 255 | (43 | ) | 212 | |||||||||
Total | $ | 112,726 | $ | (51,746 | ) | $ | 60,980 | ||||||
December 31, 2014 | |||||||||||||
(dollars in thousands) | |||||||||||||
Developed technology | $ | 27,432 | $ | (15,073 | ) | $ | 12,359 | ||||||
Trade name | 5,305 | (2,696 | ) | 2,609 | |||||||||
Customer relationships | 32,959 | (15,622 | ) | 17,337 | |||||||||
Non-competition agreements | 962 | (863 | ) | 99 | |||||||||
Total | $ | 66,658 | $ | (34,254 | ) | $ | 32,404 | ||||||
The total amortization expense for other intangible assets was $17.9 million, $10.0 million and $6.7 million for the years ended December 31, 2015, 2014 and 2013, respectively.
Future amortization of intangible assets recorded as of December 31, 2015 is expected to be as follows:
Fiscal year ending December 31: | (dollars in thousands) | |||
2016 | $ | 17,473 | ||
2017 | 13,645 | |||
2018 | 11,295 | |||
2019 | 9,409 | |||
2020 | 5,627 | |||
Thereafter | 3,531 | |||
Total | $ | 60,980 | ||
Note 9. Accrued Compensation
Accrued compensation as of December 31, 2015 and 2014 consists of:
December 31, | ||||||||
2015 | 2014 | |||||||
(dollars in thousands) | ||||||||
Sales commission | $ | 24,622 | $ | 19,675 | ||||
Employee bonus | 12,451 | 12,453 | ||||||
Employee benefits, payroll taxes and other | 18,513 | 8,953 | ||||||
Total accrued compensation | $ | 55,586 | $ | 41,081 | ||||
Note 10. Long-term Debt
0.25% Convertible Senior Notes
In June 2013, the Company issued at par value $310.0 million of 0.25% convertible senior notes due June 1, 2018 (the “Notes”). Interest is payable semi-annually in arrears on December 1 and June 1 of each year, commencing December 1, 2013.
62
The Notes are governed by an indenture dated as of June 4, 2013, between the Company, as issuer, and Wells Fargo Bank, National Association, as trustee. The Notes do not contain any financial covenants or any restrictions on the payment of dividends, the incurrence of senior debt or other indebtedness, or the issuance or repurchase of securities by the Company. The Notes are unsecured and rank senior in right of payment to the Company's future indebtedness that is expressly subordinated in right of payment to the Notes, rank equal in right of payment to the Company's existing and future unsecured indebtedness that is not so subordinated. The Notes are effectively subordinated in right of payment to any of the Company's secured indebtedness to the extent of the value of the assets securing such indebtedness and are structurally subordinated to all existing and future indebtedness, liabilities incurred by our subsidiaries including trade payables, and preferred stock of the Company.
Upon conversion, the Company may choose to pay or deliver, as the case may be, either cash, shares of the Company's common stock or a combination of cash and shares of the Company's common stock. If converted, holders will receive, at the Company's election, cash and/or shares of the Company's common stock for the principal amount of the Notes and any amounts in excess of the principal amounts. The Company intends to settle the principal amount of the Notes with cash if converted.
The initial conversion rate is 8.6133 shares of the Company's common stock per $1,000 principal amount of Notes, subject to anti-dilution adjustments. The initial conversion price is approximately $116.10 per share of the Company's common stock and represents a conversion premium of approximately 35% based on the last reported sale price of the Company's common stock of $86.00 on May 29, 2013, the date the Notes offering was priced. The conversion rate is subject to adjustment from time to time upon the occurrence of certain events, including, but not limited to, the issuance of stock dividends and payment of cash dividends. Holders of the Notes will not receive any cash payment representing accrued and unpaid interest upon conversion of a Note unless the conversion date occurs after a regular record date related to the Notes and prior to the related interest payment date. At any time prior to the close of business on the business day immediately preceding March 1, 2018, holders may convert their Notes at their option only under the following circumstances:
● | during any calendar quarter commencing after the calendar quarter ending on September 30, 2013 (and only during such calendar quarter), if the last reported sale price of the common stock for at least 20 trading days (whether or not consecutive) during a period of 30 consecutive trading days ending on the last trading day of the immediately preceding calendar quarter is greater than or equal to 130% of the conversion price on each applicable trading day; | ||
● | during the five business day period after any five consecutive trading day period (the “measurement period”) in which the trading price per $1,000 principal amount of Notes for each trading day of the measurement period was less than 98% of the product of the last reported sale price of the Company's common stock and the conversion rate on each such trading day; or | ||
● | upon the occurrence of certain corporate transactions described in the indenture governing the Notes. | ||
On and after March 1, 2018 until the close of business on the business day immediately preceding the maturity date, holders may convert their Notes at any time, regardless of the foregoing circumstances. If a make-whole fundamental change (as defined in the Indenture governing the Notes) occurs when the Company's stock price is between $86.00 and $275.00 per share and a holder elects to convert its Notes in connection with such make-whole fundamental change, such holder may be entitled to an increase in the conversion rate as provided for in the Indenture governing the Notes.
As of December 31, 2015, circumstances that would give rise to a conversion option for the holders of Notes do not exist.
Holders of the Notes have the right to require the Company to purchase with cash all or a portion of the Notes upon the occurrence of any event that constitutes a fundamental change (as defined in the Indenture governing the Notes) at a purchase price equal to 100% of the principal amount of the Notes plus accrued and unpaid interest.
In accounting for the issuance of the Notes, the Company separated the Notes into liability and equity components. The carrying amount of the liability component was calculated by measuring the fair value of a similar liability that does not have an associated convertible feature. The carrying amount of the equity component representing the conversion option was determined by deducting the fair value of the liability component from the par value of the Notes as a whole.
63
The excess of the principal amount of the liability component over its carrying amount (“debt discount”) is amortized to interest expense using the effective interest method over the term of the Note. The equity component is not remeasured as long as it continues to meet the conditions for equity classification.
In accounting for the $8.4 million in transaction costs related to the Note issuance, the Company allocated the total amount incurred to the liability and equity components based on their relative values. The $6.7 million in transaction costs attributable to the liability component included in other assets are being amortized to interest expense over the term of the Notes, and the $1.7 million in transaction costs attributable to the equity component were netted with the equity component in additional paid-in capital. Debt issuance costs, net of amortization, were $3.4 million as of December 31, 2015, and are included in other assets.
The Notes consisted of the following as of December 31, 2015:
(in thousands) | ||||
Equity component (1) | $ | 60,931 | ||
Liability component : | ||||
Principal | 310,000 | |||
Less: debt discount, net | (32,045 | ) | ||
Net carrying amount | $ | 277,955 | ||
Fair value - level 2 | $ | 307,024 | ||
(1) Included in the consolidated balance sheets within additional paid-in capital, net of the $1.7 million in equity issuance costs.
The Notes are carried at face value less any unamortized debt discount and also require disclosure of an estimate of fair value. The Company considers the fair value of the Notes at each balance sheet date to be a level 2 measurement because it is determined based on a recent quoted market price or dealer quote for the Notes. The Notes quoted market price or dealer quote is based on the trading price of the Company's common stock and market activity that is less than an active exchange.
As of December 31, 2015, the remaining life of the Notes is approximately 2.50 years.
The following table sets forth total interest expense recognized related to the Notes during the twelve months ended December 31, 2015, 2014 and 2013:
December 31, | |||||||||||
2015 | 2014 | 2013 | |||||||||
(in thousands) | |||||||||||
Contractual interest expense | $ | 775 | $ | 775 | $ | 446 | |||||
Amortization of debt issuance costs | 1,294 | 1,237 | 696 | ||||||||
Amortization of debt discount | 12,245 | 11,673 | 6,620 | ||||||||
Total | $ | 14,314 | $ | 13,685 | $ | 7,762 | |||||
Effective interest rate | 5.4% | ||||||||||
In connection with issuing at par value $310.0 million of 0.25% convertible senior notes due June 1, 2018, our Board of Directors approved the use of $30.0 million of the net proceeds to repurchase 348,837 shares of our common stock for $30.0 million, or $86.00 per share. The Company has since retired these shares.
Related Party Debt
On October 31, 2007, the Company entered into a perpetual software license agreement with Oracle USA, Inc. (“Oracle USA”), a related party, to license Oracle database and application server software, along with technical support. This license agreement had a forty-two month term that allowed the Company to download an unlimited number of perpetual licenses and was financed pursuant to notes issued to Oracle USA, Inc. at a rate of 6.20% per annum.
In May 2010, the Company entered into an amendment to the perpetual software license agreement with Oracle USA. The amendment provides for a 37-month extension of unlimited licenses to the October 2007 license agreement from Oracle
64
and was financed pursuant to notes issued to Oracle USA, Inc. at a rate of 2.12% per annum. On February 28, 2013, the Company entered into the third amendment to the perpetual software license agreement with Oracle USA ("Amendment"). The Amendment provides for a 48-month extension to the May 2010 second amendment to the Oracle unlimited license agreement. The Amendment provides that the Company will pay a one-time fee of $13.1 million to extend the term for unlimited licenses from May 31, 2014 to May 31, 2018. The Amendment also provides for technical support services. The Company paid $2.4 million for the support services from February 28, 2013 to February 27, 2014. The Company renewed the support service agreement for $4.3 million in February 2014, 2015, and 2016. Further, the Company renewed the support services for the two subsequent annual periods at the same rate. The support services to be provided to the Company by Oracle automatically renew unless the Company provides written notice of cancellation at least 60 days prior to the support renewal date. The Company financed the license fees due under the Amendment pursuant to a note issued to Oracle Credit Corporation. The note bears interest at a rate of 2.0% per annum with payments scheduled over the term of the amendment. The Company discounted the note at a rate of 4.5% because it approximates the interest rate the Company would obtain on the open market. The $12.4 million discounted note value was recorded as an asset addition to property and equipment that will be depreciated over seven years.
Future debt payments under notes payable as of December 31, 2015 are as follows:
(in thousands) | ||||
Years ending: | ||||
2016 | $ | 3,119 | ||
2017 | 3,119 | |||
Future debt payments | 6,238 | |||
Amount representing interest | 310 | |||
Present value of future debt payments | $ | 5,928 | ||
The current and long-term portions of the notes payable, recorded in other current liabilities and other long-term liabilities, respectively, are as follows for the periods indicated:
December 31, | ||||||||
2015 | 2014 | |||||||
(dollars in thousands) | ||||||||
Current portion | $ | 2,901 | $ | 2,774 | ||||
Long-term portion | 3,027 | 5,928 | ||||||
Total long-term debt | $ | 5,928 | $ | 8,702 | ||||
The maximum amount outstanding under the notes was $8.8 million and $11.8 million during the years ended December 31, 2015 and 2014, respectively.
The following table details payments to Oracle USA and Oracle Credit Corporation for support services and license fees related to the following years:
Twelve Months Ended December 31, | |||||||||||
2015 | 2014 | 2013 | |||||||||
(dollars in thousands) | |||||||||||
License fee | $ | 2,774 | $ | 3,054 | $ | 2,612 | |||||
Support | 4,300 | 4,300 | 2,380 | ||||||||
Interest | 345 | 464 | 431 | ||||||||
Total paid | $ | 7,419 | $ | 7,818 | $ | 5,423 | |||||
Note 11. Lease Commitments
65
The Company leases computer equipment and purchased software from various parties under capital lease agreements that expire through December 2017. The total outstanding balance financed under capital leases was $39,000 and $238,000 at December 31, 2015 and 2014, respectively. Accumulated amortization on the leased assets was $2.7 million and $2.4 million at December 31, 2015 and 2014, respectively. Amortization of assets recorded under the capital leases is included in depreciation expense. The current and long-term portions of the capital leases have been recorded in other current liabilities and other long-term liabilities, respectively, on the consolidated balance sheets.
The current and long-term portions of capital lease were as follows:
December 31, | ||||||||
2015 | 2014 | |||||||
(dollars in thousands) | ||||||||
Current portion | $ | 36 | $ | 195 | ||||
Long-term portion | 3 | 43 | ||||||
Total debt related to capital leases | $ | 39 | $ | 238 | ||||
The Company also has several non-cancelable operating leases, primarily for its facilities, that expire through 2025. Certain of these leases contain renewal options for periods ranging from two to five years and require the Company to pay executory costs such as maintenance, taxes, and insurance. The Company leases office space in the U.S. and throughout the world with various expiration dates through 2025. Minimum rent payments under operating leases are recognized on a straight-line basis over the term of the lease including any periods of free rent and rent concessions.
Future minimum lease payments under non-cancelable operating leases (with initial or remaining lease terms in excess of one year) and the future minimum capital lease payments as of December 31, 2015 are as follows:
Capital leases | Operating leases | Total | ||||||||||
(dollars in thousands) | ||||||||||||
Years ending: | ||||||||||||
2016 | $ | 36 | $ | 19,027 | $ | 19,063 | ||||||
2017 | 3 | 24,140 | 24,143 | |||||||||
2018 | — | 24,244 | 24,244 | |||||||||
2019 | — | 20,615 | 20,615 | |||||||||
2020 | — | 15,575 | 15,575 | |||||||||
Thereafter | — | 28,484 | 28,484 | |||||||||
Future minimum lease payments | 39 | $ | 132,085 | $ | 132,124 | |||||||
Amount representing interest | — | |||||||||||
Present value of future minimum lease payments | $ | 39 | ||||||||||
Rental expenses for operating leases were $20.4 million, $15.4 million and $11.1 million for the years ended December 31, 2015, 2014 and 2013, respectively. Sublease income, which is recorded as reduction on of rental expense, was $448,000 and $321,000 for the years ended December 31, 2015 and 2014, respectively and negligible for 2013.
Note 12. Commitments and Contingencies
Legal Proceedings
The Company is involved in various legal proceedings and receives claims from time to time, arising from the normal course of business activities. In the Company’s opinion, resolution of these matters is not expected to have a material adverse impact on its consolidated results of operations, cash flows or our financial position.
Note 13. Stock-based Compensation
Stock-based Plans
The Company maintains the 2007 Plan for the purpose of granting incentive stock options, nonstatutory stock options, RSUs, PSs, stock appreciation rights and PSUs to its employees and directors. Additionally, the Company has an additional plan, the 1999 Stock Plan ("the 1999 Plan"), with options outstanding from which it will not grant any additional awards.
66
The 2007 Plan, adopted by the Company's Board of Directors in June 2007 and effective in December 2007, reserved shares of common stock for issuance under the plan. As of December 31, 2015, 6,169,789 shares remained available for future grants under the 2007 Plan. Options cancelled under the 1999 Plan are added to the shares available for issuance under the 2007 Plan when those cancellations occur. The 2007 Plan also provides for annual increases in the number of shares available for issuance on the first day of each fiscal year equal to the lower of a) 9,000,000 shares of the Company's common stock; b) 3.5% of the Company's aggregate common stock outstanding plus common stock issuable pursuant to outstanding awards under the Company's equity plans; or c) such other amount as the Board of Directors may determine.
The exercise price for options granted under the 1999 Plan and the 2007 Plan is the fair market value of an underlying share of common stock on the date of grant. If an optionee, at the time the option is granted, owns stock totaling more than 10% of the total combined voting rights of all classes of stock of the Company (a "10% Owner"), the exercise price for such options will not be less than 110% of the fair value of an underlying share of common stock on the date of grant. Options generally vest over a four year period and have a term of 10 years from the date of grant. Options granted under the 2007 Plan to 10% Owners have a maximum term of 5 years.
Amounts recognized in the financial statements related to the 2007 Plan are as follows:
December 31, | ||||||||||||
2015 | 2014 | 2013 | ||||||||||
(dollars in thousands) | ||||||||||||
Total cost of stock-based plan during the year | $ | 110,593 | $ | 97,895 | $ | 74,759 | ||||||
Capitalized stock-based compensation | (1,503 | ) | (1,415 | ) | (1,099 | ) | ||||||
Previously capitalized stock-based compensation amortized during the year | 1,140 | 860 | 505 | |||||||||
Stock-based compensation expense | $ | 110,230 | $ | 97,340 | $ | 74,165 | ||||||
Foreign income tax associated with stock-based compensation | $ | 278 | $ | 310 | $ | 249 | ||||||
The Company issues new shares of common stock upon the exercise of stock options, the granting of restricted stock, the vesting of RSUs, PSs and PSUs, and the granting of shares through the employee stock purchase plan ("ESPP").
During the first quarter of 2015, the Company granted 91,929 performance shares (“ PS 2015”), with a fair value of $92.58 per share, to selected executives and other key employees. The PS vesting is contingent upon the Company meeting certain company-wide revenue performance goals (performance-based) in 2015 and 2017. The Company's Board of Directors set the performance metrics in the first quarter of 2015. These shares are subject to term vesting conditions. The PS fair value and the related stock-based compensation expense are determined based on the value of the underlying shares on the date of grant and are recognized over the vesting term. During the interim financial periods, management estimates the probable number of PS 2015 that will be granted until the achievement of the performance goals are known at December 31, 2015 and 2017, respectively. The Company also awarded an equal number of PS for 2016 and 2017 for which the performance metrics have not yet been set by the Company's Board of Directors. As such, there is no accounting for these awards until the period during which the performance metrics are set.
During the third quarter of 2014, the Company granted 559,456 PS to selected executives. This PS grant is subject to the Company's performance in 2015, 2016 and 2017. The PS vesting is contingent upon the Company meeting certain company-wide revenue and non-GAAP operating margin performance goals (performance-based) in 2015, 2016 and 2017. The Company's Board of Directors set the performance metrics in the third quarter of 2014 for the entire performance period. The related stock-based compensation expense is determined based on the value of the underlying shares on the date of grant and is recognized over the vesting term. During the interim financial periods, management estimates the probable number of PS that will be vested until the achievement of the performance goals is known.
During the fourth quarter of 2013, the Company granted 83,946 performance shares units (“2013 PSU"), with a fair value of $94.13 per share, to selected executives and other key employees. The 2013 PSU vesting is contingent upon the Company meeting certain company-wide revenue performance goals (performance-based) in the beginning of 2014 through 2015. The Company's Board of Directors set the performance metrics on the grant date in December 2013. These shares are subject to term vesting conditions. The PS fair value and the related stock-based compensation expense are determined based on the value of the underlying shares on the date of grant and are recognized over the vesting term. During the interim financial periods, management estimates the probable number of 2013 PSUs that will be granted until the achievement of the performance goals are known at December 31, 2015.
67
During the first quarter of 2012, the Company granted 341,750 PS, with a fair value of $50.38 per share, to selected executives and other key employees. These PS grants were equally divided into two tranches: shares that are subject to the Company's performance in 2012 and 2014 ("PS 2014"). The PS vesting for each tranche is contingent upon the Company meeting certain company-wide revenue and non-GAAP operating margin performance goals (performance-based) in 2012 and 2014, respectively, which were set by the Board of Dirctors at the time of grant. Additionally, in the first quarter of 2012, the Company also awarded these employees 170,875 PS for 2013 ("PS 2013") and an additional 170,875 PS award for 2014 ("PS 2014ii"). The BOD set the performance metrics for the PS 2014ii award and the PS 2013 award in first quarters of 2014 and 2013, respectively.
The PS are subject to term vesting conditions. The PS fair value and the related stock-based compensation expense are determined based on the value of the underlying shares on the date of grant and is recognized over the vesting term. During the interim financial periods, management estimates the probable number of PS that will be awarded until the achievement of the performance goals is known which is typically in the first quarter of the following year.
For the PS 2015 awards, the Company achieved 123% of its company-wide performance goals, resulting the Company awarding an additional 9,404 shares to select executives and key employees. The PS 2015 grants vest 1/3 per year with the initial vesting event in February 2016.
For the 2013 PSUs awards, the Company achieved 86% of its 2015 company-wide performance goals, resulting in the Company reducing the awards to select executives and key employees by 11,355 shares. The 2013 PSU grants vest 1/3 per year with the initial vesting event in February 2016.
For the PS 2014 award, the Company achieved 200% of its company-wide performance goals resulting in the Company awarding an additional 154,750 shares to select executives and key employees. The PS 2014 grants vest 1/3 per year with the initial vesting event in February 2015.
For the PS 2014ii, the Company achieved 126% of its company-wide performance goals resulting in the Company awarding an additional 31,183 shares to select executives and key employees. The PS 2014ii grants vest 1/3 per year with the initial vesting event in February 2015.
For the PS tranche granted for 2013, the Company achieved 137% of its company-wide performance goals resulting in the Company awarding an additional 72,542 shares to select executives and key employees. The 2013 PS grants vest 1/3 per year with the initial vesting event in February 2014.
As of December 31, 2015 and 2014, all outstanding stock-based payment awards qualified for classification as equity.
Stock Options
A summary of the Company's stock option activity during the year ended December 31, 2015 was as follows:
Shares | Weighted-average exercise price per share | Weighted-average remaining contractual term (in years) | Aggregate intrinsic value | |||||||
(dollars and shares in thousands, except per share amounts) | ||||||||||
Outstanding at January 1, 2015 | 2,111 | $55.30 | ||||||||
Granted | 429 | 94.32 | ||||||||
Exercised | (562) | 25.25 | ||||||||
Cancelled and forfeited | (130) | 93.51 | ||||||||
Outstanding at December 31, 2015 | 1,848 | 70.80 | 6.93 | $ | 37,782 | |||||
Vested and expected to vest | 1,763 | 69.69 | 6.84 | 37,655 | ||||||
Exercisable at December 31, 2015 | 1,088 | 56.03 | 5.83 | 35,735 | ||||||
The total intrinsic value of the options exercised was $37.5 million, $25.4 million and $75.9 million during the years ended December 31, 2015, 2014 and 2013, respectively.
68
As of December 31, 2015, there was $23.0 million of total unrecognized compensation cost, net of estimated forfeitures, related to stock option grants that are expected to be recognized over a weighted-average period of 2.4 years.
The Company uses the Black-Scholes pricing model to determine the fair value of stock options. The fair value of each option grant is estimated on the date of the grant. The weighted-average grant date fair value of options granted and the range of assumptions using the model are as follows for the periods presented:
Year ended December 31, | ||||||
2015 | 2014 | 2013 | ||||
Weighted-average fair value of options granted | $34.54 | $36.09 | $35.44 | |||
Expected term | 4.6 years | 4.3 years | 6.1 years | |||
Expected volatility | 42% | 44% | 46% | |||
Risk-free interest rate | 1.51% | 1.33% | 1.16% | |||
Dividend yield | none | none | none | |||
The assumptions are based on the following for each of the years presented:
Expected Term. Prior to first quarter of 2014, the Company estimated the expected term consistent with the simplified method identified by the SEC. The Company elected to use the simplified method due to a lack of term length data since the Company completed its initial public offering in December 2007 and its stock options meet the criteria of the “plain-vanilla” options as defined by the SEC. The simplified method calculates the expected term as the average of the vesting and contractual terms of the award.
Effective the first quarter of 2014, the Company changed its methodology for estimating the expected term assumption used to determine employee stock option grant fair value. The Company changed from the simplified method to a historical data method because the Company believes it has sufficient data to estimate the stock option exercise period based on historical stock option activity and historical employee termination data.
Volatility. The expected volatility being used is based on the Company's volatility over the historical period equivalent to the expected term.
Risk Free Interest Rate. The risk free interest rate is based on the U.S. Treasury's zero coupon issues with remaining terms similar to the expected term on the options.
Dividend Yield. The Company has never declared or paid any cash dividends and does not plan to pay cash dividends in the foreseeable future, and, therefore, used an expected dividend yield of zero in the valuation model.
Forfeitures. The Company estimates forfeitures at the time of grant and revises those estimates in subsequent periods if actual forfeitures differ from those estimates. The Company uses historical data to estimate pre-vesting forfeitures and records stock-based compensation expense only for those awards that are expected to vest. All stock option awards are amortized on a straight-line basis over the requisite service periods of the awards, which are generally the vesting periods. If the Company's actual forfeiture rate is materially different from its estimate, the stock-based compensation expense could be significantly different from what the Company has recorded in the current period.
Restricted Stock Units, Restricted Stock, Performance Share and Performance Share Units
A summary of the Company's RSU, RS, PS and PSU activity during the year ended December 31, 2015 is as follows:
Shares | Weighted-average grant date fair value per share | Aggregate intrinsic value | ||||||
(dollars and shares in thousands, except per share amounts) | ||||||||
Nonvested at January 1, 2015 | 2,969 | $80.59 | ||||||
Granted | 1,563 | 92.73 | ||||||
Vested | (1,249) | 73.67 | ||||||
Cancelled and forfeited | (266) | 89.18 | ||||||
Nonvested at December 31, 2015 | 3,017 | $90.95 | $ | 253,954 | ||||
69
For the restricted stock units, restricted stock, performance shares and performance share units that vested during the years ended December 31, 2015, 2014 and 2013, the total intrinsic value was $118.2 million, $122.2 million and $145.3 million, respectively.
In accordance with the Bronto acquisition agreement, in the third quarter of 2015, the Company granted $15.0 million in restricted stock units to certain former employees of Bronto that were hired by the Company, and will grant another $10.0 million in restricted stock units on the one year anniversary of the close date to certain employees of the Company that are working on the Bronto business. The restricted stock units vest over four years in accordance with the terms of the Company's equity compensation plan. The fair value of the equity grants will be recognized as stock-based compensation expense in the Company's statement of operations over the four year vesting period.
Compensation expense for RSUs, restricted stock, PS and PSUs is determined based on the value of the underlying shares on the date of grant. The typical RSUs, restricted stock, PS and PSU fair value is based on market value of shares on the grant date (the intrinsic value). As of December 31, 2015, there were $173.9 million of total unrecognized compensation costs, net of estimated forfeitures, related to RSUs, restricted stock, PSs and PSUs that is expected to be recognized over a weighted-average period of 2.8 years.
Reserved for Future Issuance
The Company has reserved the following shares of authorized but unissued common stock for future issuance:
December 31, 2015 | ||
(shares in thousands) | ||
Options outstanding | 1,848 | |
RSUs, PSs, PSUs and restricted stock awards outstanding | 3,017 | |
Shares available for future grants | 6,170 | |
Total | 11,037 | |
Employee Stock Purchase Plan
In March 2015, the Company's Board of Directors adopted an employee stock purchase plan, and reserved 3,500,000 shares of the Company’s common stock for issuance. Under the ESPP, employees may purchase the Company’s common stock through accumulated payroll deductions. Stock purchase rights are granted to eligible employees during a six month offering period with a purchase dates at the end of each offering period. The offering periods generally commence each May 1 and November 1. Shares are purchased through employees’ payroll deductions, up to a maximum of 15% of employees’ compensation, at purchase prices equal to 85% of the lesser of the fair market value of the Company’s common stock at either the date of the employee’s entrance to the offering period or the purchase date. No participant may purchase more than $25,000 worth of common stock in one calendar year. The ESPP's initial purchase period began in November 2015 so no shares had been purchased or distributed as of December 31, 2015.
The Company uses the Black-Scholes pricing model to determine the fair value of ESPP grants. The fair value of each grant is estimated on the date of the grant. The weighted-average grant date fair value of shares granted and the range of assumptions using the model are as follows for the period presented:
Year ended December 31, | ||
2015 | ||
Weighted-average fair value per share of grants | $84.94 | |
Expected term | 0.5 years | |
Expected volatility | 29% | |
Risk-free interest rate | 0.34% | |
Dividend yield | none | |
The assumptions are based on the following for each of the years presented:
Expected Term. The estimated life for the ESPP grants is estimated based on an actual analysis of expected life. The estimated life for shares issued pursuant to our ESPP is based on the six month term;
Volatility. The expected volatility being used is based on the Company's volatility over the historical period equivalent to the expected term.
70
Risk Free Interest Rate. The risk free interest rate is based on the U.S. Treasury's zero coupon issues with remaining terms similar to the expected term on the options.
Dividend Yield. The Company has never declared or paid any cash dividends and does not plan to pay cash dividends in the foreseeable future, and, therefore, used an expected dividend yield of zero in the valuation model.
Forfeitures. The Company estimates forfeitures at the time of grant and revises those estimates in subsequent periods if actual forfeitures differ from those estimates. The Company uses historical data to estimate pre-vesting forfeitures and records stock-based compensation expense only for those awards that are expected to vest. All stock-based payments are amortized on a straight-line basis over the six month contribution period. If the Company's actual forfeiture rate is materially different from its estimate, the stock-based compensation expense could be significantly different from what the Company has recorded in the current period.
As of December 31, 2015, there was $1.2 million of total unrecognized compensation cost, net of estimated forfeitures, related to ESPP grants that are expected to be recognized over a weighted-average period of 0.3 years.
Note 14. Other Employee Benefits Plans
The Company has a defined contribution retirement plan ("the Plan") that covers substantially all domestic employees of the Company. The Plan allows employees to contribute gross salary through payroll deductions up to the legally mandated limit based on their jurisdiction. During the years ended December 31, 2015 and 2014, the maximum annual employer contribution match was $6,000 and $4,000, respectively. The Company also contributes to various retirement plans for its employees outside the United States. The Company contributed $8.9 million, $5.3 million and $3.9 million to its various retirement plans for the years ended December 31, 2015, 2014 and 2013, respectively.
The Company recorded a total of $300,000 in 2015, $97,000 in 2014 and $188,000 in 2013 in service and interest costs and actuarial losses relating to its statutory pension benefit obligation for its employees in Manila, Philippines. Included in long-term liabilities is the total unfunded projected benefit obligation for this plan which is approximately $842,000 and $574,000 as of December 31, 2015 and 2014, respectively. During fiscal years 2015, 2014 and 2013, the Company recorded $185,000, $186,000 and $126,000 respectively, in periodic benefit costs for this plan with a corresponding decrease in accumulated other comprehensive income.
Note 15. Income Taxes
The components of income (loss) before income taxes attributable to domestic and foreign operations are as follows:
Year ended December 31, | ||||||||||||
2015 | 2014 | 2013 | ||||||||||
(dollars in thousands) | ||||||||||||
Income / (loss) before income taxes is as follows: | ||||||||||||
Domestic | $ | (131,015 | ) | $ | (100,608 | ) | $ | (76,715 | ) | |||
Foreign | 653 | 2,737 | 7,205 | |||||||||
Total | $ | (130,362 | ) | $ | (97,871 | ) | $ | (69,510 | ) | |||
Foreign income has decreased year over year as a result of the Company’s acquisition of foreign subsidiaries that generate losses. Due to the Company’s foreign mix of earnings, the Company’s net tax expense does not directly correlate to the overall foreign earnings.
The federal, state and foreign income tax provisions (benefit) for the years ended December 31, 2015, 2014 and 2013 are summarized as follows:
71
Year ended December 31, | ||||||||||||
2015 | 2014 | 2013 | ||||||||||
(dollars in thousands) | ||||||||||||
Current taxes: | ||||||||||||
Federal | $ | — | $ | — | $ | — | ||||||
State | 130 | 6 | (29 | ) | ||||||||
Foreign | 2,646 | 3,089 | 1,236 | |||||||||
Total current taxes | $ | 2,776 | $ | 3,095 | $ | 1,207 | ||||||
Deferred taxes: | ||||||||||||
Federal | $ | (7,074 | ) | $ | 240 | $ | (974 | ) | ||||
State | (756 | ) | (36 | ) | (70 | ) | ||||||
Foreign | (565 | ) | (1,133 | ) | 736 | |||||||
Total deferred taxes | (8,395 | ) | (929 | ) | (308 | ) | ||||||
Total | $ | (5,619 | ) | $ | 2,166 | $ | 899 | |||||
During the quarter ended June 30, 2015, the Company recorded approximately $8.3 million of additional net deferred tax liabilities related to the Bronto acquisition. These additional deferred tax liabilities create a new source of taxable income, thereby requiring us to release a portion of our deferred tax asset valuation allowance with a related reduction in income tax expense of approximately $8.3 million for 2015.
During the quarter ended March 31, 2013, the Company recorded approximately $1.1 million of additional net deferred tax liabilities related to the WH acquisition. These additional deferred tax liabilities create a new source of taxable income, thereby requiring us to release a portion of our deferred tax asset valuation allowance with a related reduction in income tax expense of approximately $1.1 million for 2013.
A reconciliation of the statutory U.S. federal income tax rate to the Company's effective income tax rate is as follows:
Year ended December 31, | |||||||||
2015 | 2014 | 2013 | |||||||
Federal statutory income tax rate | 35.0 | % | 35.0 | % | 35.0 | % | |||
State tax, net of federal benefit | 0.2 | % | 1.8 | % | (0.1 | )% | |||
Foreign rate differential | (1.7 | )% | (2.3 | )% | (2.3 | )% | |||
Share-based compensation | (7.3 | )% | (8.4 | )% | (8.7 | )% | |||
Meals and entertainment | (0.3 | )% | (0.3 | )% | (0.3 | )% | |||
Other permanent differences | (1.6 | )% | (2.3 | )% | (2.1 | )% | |||
Valuation allowance | (20.0 | )% | (25.7 | )% | (22.8 | )% | |||
Effective income tax rate | 4.3 | % | (2.2 | )% | (1.3 | )% | |||
72
Significant components of the Company's deferred tax assets are as follows:
December 31, | ||||||||
2015 | 2014 | |||||||
(dollars in thousands) | ||||||||
Deferred tax assets: | ||||||||
Deferred revenue | $ | 5,128 | $ | 5,146 | ||||
Other reserves and accruals | 15,258 | 12,878 | ||||||
Share-based compensation | 23,468 | 20,675 | ||||||
Federal operating loss carryforwards | 137,878 | 112,949 | ||||||
State and foreign net operating loss carryforwards | 13,015 | 14,809 | ||||||
Research and development credits | 3,814 | 3,840 | ||||||
Deferred tax assets | 198,561 | 170,297 | ||||||
Deferred tax liabilities: | ||||||||
Property and equipment | $ | (1,105 | ) | $ | (797 | ) | ||
Convertible debt | (11,822 | ) | (16,348 | ) | ||||
Acquired intangible assets | (9,974 | ) | (4,598 | ) | ||||
Goodwill | (1,195 | ) | (670 | ) | ||||
Deferred tax liabilities | (24,096 | ) | (22,413 | ) | ||||
Net deferred tax assets, before valuation allowance | 174,465 | 147,884 | ||||||
Valuation allowance | (175,076 | ) | (148,682 | ) | ||||
Net deferred tax liabilities | $ | (611 | ) | $ | (798 | ) | ||
ASC 740, Income Taxes, provides for the recognition of deferred tax assets if realization of such assets is more likely than not. In assessing the need for a valuation allowance in 2015, the Company considered all available evidence both positive and negative, including historical levels of income, legislative developments, expectations and risks associated with estimates of future taxable income, and prudent and feasible tax planning strategies.
As a result of this analysis for the year ended December 31, 2015, the Company has determined that it is more likely than not that it will not realize the benefits of its deferred tax assets in the U.S. and Japan due to continuing losses and therefore has recorded a valuation allowance to reduce the carrying value of these deferred tax assets to zero. The additional deferred tax assets relate to operations in foreign jurisdictions where the Company has determined that it is more likely than not that the deferred tax assets will be realized.
As of December 31, 2015, the Company had approximately $865.0 million of consolidated federal net operating loss carryforwards and $328.4 million of California net operating loss carryforwards available to offset future taxable income, respectively. The federal net operating loss carryforwards expire in varying amounts between 2018 and 2035. The California net operating loss carryforwards expire in varying amounts between 2016 and 2035. The Company also had approximately $205.1 million of gross other state net operating loss carryforwards available to offset future taxable income which will expire in varying amounts between 2016 and 2035. In addition, there were $11.0 million of gross non-U.S. net operating loss carryforwards as of December 31, 2015, $5.8 million of which expire between 2017 and 2022 with the remaining carryforwards having an indefinite life.
The net operating losses include approximately $140.6 million relating to the tax benefit of stock option exercises that, when realized, will be recorded as a credit to additional paid-in capital. During 2015, the Company recorded approximately $242,000 of tax benefits related to stock-based compensation that were credited to stockholder's equity during the year.
The Company also had approximately $5.2 million of federal and $2.6 million of California research and development tax credit carryforwards at the end of 2015. The federal credits expire in varying amounts between 2019 and 2028. The California research credits do not expire. The foreign and other state research and development tax credit carryforwards are not material at the end of 2015.
The Company's ability to utilize the net operating loss and tax credit carryforwards in the future may be subject to substantial restrictions in the event of past or future ownership changes as defined in Section 382 of the Internal Revenue Code
73
and similar state tax laws. Such annual limitations could result in the expiration of the net operating loss and tax credit carryforwards before utilization.
The Company has not provided for U.S. income or foreign withholding taxes on its undistributed earnings from its non-U.S. operations as of December 31, 2015 because the Company intends to indefinitely reinvest such earnings offshore. The undistributed earnings are approximately $5.7 million. The residual tax liability if such earnings were remitted may be reduced by foreign tax credits or other tax adjustments. However, we estimate that liability to be approximately $2.0 million.
ASC 740 requires the Company to recognize the financial statement effects of a tax position when it is more likely than not, based on the technical merits, that the position will be sustained upon examination.
The following table summarizes the activity related to unrecognized tax benefits for the periods presented:
Years ended December 31, | ||||||||||||
2015 | 2014 | 2013 | ||||||||||
(dollars in thousands) | ||||||||||||
Beginning balance - unrecognized tax benefits, gross | $ | 15,460 | $ | 3,653 | $ | 3,388 | ||||||
(Decrease) / Increases- related to prior year positions | (11,192 | ) | 8,552 | 300 | ||||||||
(Decrease) / Increases- current year tax positions | 91 | 3,374 | — | |||||||||
(Decrease) / Increases- due to lapses | (242 | ) | (119 | ) | (31 | ) | ||||||
Other | (36 | ) | — | (4 | ) | |||||||
Ending balance- unrecognized tax benefits, gross | $ | 4,081 | $ | 15,460 | $ | 3,653 | ||||||
The state unrecognized tax benefits included in these amounts are reported gross instead of net of federal benefit.
The Company had gross unrecognized tax benefits of $4.1 million, $15.5 million and $3.7 million at December 31, 2015, 2014 and 2013 respectively. At December 31, 2015, 2014 and 2013, there were an estimated $114,000, $190,000 and $337,000, respectively of unrecognized tax benefit that if recognized would affect the annual effective tax rate. The change in unrecognized tax benefits in 2015 is primarily related to net operating losses that will never be used based on the outcome of California state litigation not involving the Company related to allowable apportionment methods used in calculating net operating losses, combined with a nominal change due to the expiration of certain statute of limitations and the net accrual for uncertain tax positions based upon the annual analysis. The change in unrecognized tax benefits in 2014 was primarily related to net operating losses that were not yet utilized to offset taxable income combined with a nominal change due to the expiration of certain statute of limitations and the net accrual for uncertain tax positions based upon the annual analysis. The change in 2013 was primarily due to the expiration of certain statute of limitations and the net accrual for uncertain tax positions based upon the annual analysis.
The Company does not anticipate material changes in the total amount of its unrecognized tax benefits within 12 months of the reporting date.
The Company accrues interest and penalties related to unrecognized tax benefits within the provision for income taxes. As of December 31, 2015, the Company had $9,000 of accrued interest and penalties recorded on the balance sheet related to unrecognized tax benefits, and $43,000 as of December 31, 2014.
The Company files federal, state and foreign income tax returns in jurisdictions with varying statutes of limitations. Due to its net operating loss carryforwards, the Company's income tax returns generally remain subject to examination by federal and most state tax authorities. In most of our significant foreign jurisdictions, the 2009 through 2014 tax years remain subject to examination by their respective tax authorities. One of the Company’s Canadian subsidiaries is currently under examination. We do not anticipate any material adjustments to the financial statements as a result of this audit.
Note 16. Net Loss Per Common Share
Basic net loss per common share is computed by dividing net loss by the weighted-average number of shares of common stock outstanding during the period. Diluted net loss per share of common stock is computed by giving effect to all potential dilutive shares of common stock, including options, restricted stock units ("RSUs"), performance share units ("PSUs"), performance shares ("PS"), employee stock purchase plan shares and convertible debt shares. Basic and diluted net
74
loss per share of common stock were the same for all periods presented as the impact of all potentially dilutive securities outstanding was anti-dilutive.
The following table presents the calculation of the numerator and denominator used in the basic and diluted net loss per common share:
December 31, | ||||||||||||
2015 | 2014 | 2013 | ||||||||||
(dollars and shares in thousands, except per share amounts) | ||||||||||||
Numerator: | ||||||||||||
Net loss attributable to NetSuite Inc. common stockholders | $ | (124,743 | ) | $ | (100,037 | ) | $ | (70,409 | ) | |||
Denominator: | ||||||||||||
Weighted-average number of common shares outstanding used in computing basic and diluted net loss per common share | 78,521 | 76,174 | 74,085 | |||||||||
Net loss per common share, basic and diluted | $ | (1.59 | ) | $ | (1.31 | ) | $ | (0.95 | ) | |||
The Company’s unvested RSUs, PSUs and PS do not contain non-forfeitable rights to dividends and dividend equivalents. As such, unvested RSUs, PSUs and PS are not participating securities and the Company is not required to use the two-class method to calculate diluted earnings per share in periods when the Company has net income.
The following table presents the weighted average potential shares that are excluded from the computation of diluted net loss per common share for the periods presented because including them would have had an anti-dilutive effect:
December 31, | |||||||||
2015 | 2014 | 2013 | |||||||
(shares in thousands) | |||||||||
Options to purchase shares of common stock | 2,130 | 2,102 | 2,196 | ||||||
Unvested RSUs, PSs, PSUs, restricted stock awards and ESPP shares | 2,957 | 2,743 | 3,020 | ||||||
Total | 5,087 | 4,845 | 5,216 | ||||||
The effect of the Notes is reflected in diluted earnings per share by application of the treasury stock method as the Company intends to settle the principal amount of the Notes in cash upon conversion. During the year ended December 31, 2015, the Company's weighted average common stock price was below the Notes conversion price for the periods during which the Notes were outstanding.
Note 17. Related Party Transactions
The Company has entered into various software license agreements with Oracle USA, Inc., an affiliate of Oracle Corporation. Lawrence J. Ellison, who beneficially owns a significant portion of the Company’s common stock, is the Chief Technology Officer, an Executive Chairman of the Board of Oracle and a principal stockholder of Oracle Corporation. In October 2007, the Company entered into a perpetual license for the use of Oracle database and application server software on a certain number of individual computers, along with technical support. This software license and support agreement has been amended with the latest amendment occurring in February 2013. See Note 10 to the financial statements for the terms of this agreement.
Commencing in 2004, the Company entered into a verbal agreement with Oracle Racing, Inc. ("Oracle Racing"), a sailboat racing syndicate. Lawrence J. Ellison, is the primary source of funding for Oracle Racing. Under the terms of the agreement, the Company agreed to supply certain of its cloud-based application services to Oracle Racing in exchange for logo placement on the sailboats. In November 2011, the Company renewed its subscription and professional services agreement with Oracle Racing for an additional 40 months. According to the terms of the agreement, the Company will provide services to Oracle Racing through the end of the American Cup racing season in exchange for logo placement and other advertising services. The estimated value of the Company's services over the term of the agreement is $342,000. Oracle Racing values its service to be approximately $400,000 over the term of the agreement. Based on the pricing for similar licenses to unaffiliated third parties, the Company calculated the fair market value of the services provided to Oracle Racing to be approximately $67,000 and $62,000 for 2013 and 2012, respectively. The Company did not obtain an independent valuation of the logo
75
placement rights received from Oracle Racing. Based on an estimate received from Oracle Racing, the Company determined the value of the logo placement on the sailboat to be approximately $33,000 during 2013 and 2012. The incremental cost to the Company of providing cloud-based services and the incremental cost to Oracle Racing of providing logo placement rights on the sailboat was nominal. For accounting purposes, total revenue and total costs related to the Oracle Racing agreement will be equal and will be recognized as revenue and expense, respectively, at historical cost. In connection with the license agreements discussed above, the Company recognized $19,000 and $15,000, respectively, in revenue for the years ended December 31, 2014 and 2013, respectively. During 2015, the Company received no payments from Oracle Racing and recognized $107,000 in revenue.
During the third quarter of 2015, the Company entered into a $875,000 sponsorship renewal agreement with Oracle Racing, Inc. The Company will recognize revenue related to this agreement based on the pricing for similar licenses to unaffiliated third parties.
The Company has entered into various software license agreements with Oracle Corporation. Lawrence J. Ellison, who beneficially owns a significant portion of the Company’s common stock, is the Chief Technology Officer, an Executive Chairman of the Board of Oracle and a principal stockholder of Oracle Corporation. The Company paid Oracle Corporation $3,000 and $90,000 during the years ended December 31, 2015 and 2014, respectively, for services it received. The Company received no payments from Oracle Corporation during the year ended December 31, 2015 and recognized no revenue during the period. However, during the year ended December 31, 2014, the Company received payments totaling $124,000 from Oracle Corporation for services it performed. The Company recognized $127,000 and $93,000 in revenue for the years ended December, 31, 2014 and 2013, respectively. As of December 31, 2015, the Company had no accounts receivable from Oracle Corporation.
In January 2011, the Company’s Chief Technology Officer and Chairman of the Board, purchased property from an entity affiliated with Lawrence J. Ellison, a principal stockholder, (“seller”) for $8.0 million. The seller financed the transaction with a nine year loan. The Company analyzed the transaction and determined that the fair value of the property approximated the fair value of the loan. Consequently, the Company determined there is no compensation expense or a related capital contribution associated with this transaction.
In addition to the companies affiliated with Lawrence J. Ellison, the Company enters into sales and purchases agreements with various companies that have a relationship with the Company's executive officers or members of the Company's Board of Directors. The relationships are typically an equity investment by the executive officer or board member in the customer / vendor company or the Company's executive officer or board member is a member of the customer / vendor company's board of directors. The Company has renewed the license agreements and sold additional services to these customers or purchased services from these vendors at various points in time. As of December 31, 2015, the Company had $532,000 in accounts receivable from other related parties not affiliated with Mr. Ellison.
Below is a summary of transactions between the Company and related parties other than Mr. Ellison during the years ended December 31,:
2015 | 2014 | 2013 | ||||||||||
(dollars in thousands) | ||||||||||||
Revenue earned from related party | $ | 2,838 | $ | 3,264 | $ | 2,311 | ||||||
Fees NetSuite paid for services | $ | 916 | $ | 918 | $ | 937 | ||||||
The Company's President and Chief Operating Officer, Jim McGeever, is a member of the Cornerstone on Demand board of directors. During the second quarter of 2015, the Company entered into a $185,000 consulting agreement for the Company to provide services to Cornerstone on Demand. During the third quarter of 2015, the Company entered into a $245,000 agreement for Cornerstone on Demand to provide services to the Company. Further, during the fourth quarter of 2015, the Company entered into a $449,000 agreement for the Company to provide services to Cornerstone on Demand.
A member of the Company's Board of Directors, Deborah Farrington, is a Founder and General Partner in StarVest Partners. StarVest Partners is an investor in Veracode. During 2015, the Company entered into a $148,000 agreement for the Company to provide services to Veracode.
The Company's Chief Financial Officer, Ronald Gill, is a member of the Hubspot board of directors. During the third quarter of 2015, the Company entered into a $207,000 agreement for the Company to provide services to Hubspot.
76
The Company's President and Chief Operating Officer, Jim McGeever, is a member of the Twilio Inc. board of directors. During the second quarter of 2015, the Company entered into a $238,000 agreement for the Company to provide services to Twilio Inc.
A member of the Company’s Board of Directors, Catherine Kinney, is a member of the MetLife board of directors. During the second quarter of 2015, the Company and MetLife renewed a $139,000 agreement for the Company to provide services to MetLife.
A member of the Company’s Board of Directors, Kevin Thompson, is the President and Chief Executive Officer of SolarWinds. During the first quarter of 2015, the Company and SolarWinds renewed a $3.0 million multiple year agreement for the Company to provide services to SolarWinds.
A member of the Company's Board of Directors, William Beane III, is the General Manager of the Oakland Athletics. During the first quarter of 2015, the Company entered into a $495,000 amendment to the agreement with the Oakland Athletics to purchase in-stadium sponsorship.
A member of the Company's Board of Directors, Steven Gomo, is a member of the SanDisk board of directors. During the first quarter of 2015, the Company entered into a $209,000 agreement for the Company to provide services to SanDisk.
Item 9. | Changes in and Disagreements With Accountants on Accounting and Financial Disclosure |
Not applicable.
Item 9A. | Controls and Procedures |
Management's Report on Internal Control over Financial Reporting and Attestation Report of the Registered Accounting Firm
Our management is responsible for establishing and maintaining adequate internal control over financial reporting (as defined in Rules 13a-15(f) and 15d-15(f) under the Exchange Act) to provide reasonable assurance regarding the reliability of our financial reporting and the preparation of financial statements for external purposes in accordance with U.S. generally accepted accounting principles.
Management assessed the effectiveness of our internal control over financial reporting, as of December 31, 2015, the end of our fiscal year. Management based its assessment on criteria established in Internal Control—Integrated Framework (2013) issued by the
Committee of Sponsoring Organizations of the Treadway Commission ("COSO"). Management's assessment included evaluation of elements such as the design and operating effectiveness of key financial reporting controls, process documentation, accounting policies, and our overall control environment.
Based on this assessment, management has concluded that our internal control over financial reporting was effective as of the end of the fiscal year to provide reasonable assurance regarding the reliability of financial reporting and the preparation of financial statements for external reporting purposes in accordance with U.S. generally accepted accounting principles. We reviewed the results of management's assessment with the Audit Committee of our Board of Directors.
In accordance with guidance issued by the Securities and Exchange Commission, companies are permitted to exclude acquisitions from their final assessment of internal control over financial reporting for the first fiscal year in which the acquisition occurred. Our management’s evaluation of internal control over financial reporting excluded the internal control activities of Bronto Software, Inc. (Bronto”), a company which we acquired from the former stockholders of Bronto during the year ended December 31, 2015, as discussed in Note 3, “Business Combination,” to the Consolidated Financial Statements. During the year ended December 31, 2015, Bronto contributed approximately $22.1 million of revenue to the Company's total consolidated revenue. As of December 31, 2015, our total assets included $16.5 million which were specifically attributable to Bronto. We have included the financial results of Bronto in the consolidated financial statements from the date of acquisition.
The attestation report concerning the effectiveness of our internal control over financial reporting as of December 31, 2015, issued by KPMG LLP, Independent Registered Public Accounting Firm, appears in Part II, Item 8 of this Annual Report on Form 10-K.
Evaluation of Disclosure Controls and Procedures
An evaluation was performed by management, with the participation of our Chief Executive Officer ("CEO") and our Chief Financial Officer ("CFO"), of the effectiveness of our disclosure controls and procedures as of December 31, 2015 (as defined in Rules 13a-15(e) and 15d—15(e) under the Securities Exchange Act of 1934, as amended (the "Exchange Act"). Disclosure controls and procedures are controls and procedures that are designed to ensure that information required to be disclosed in our reports filed or submitted under the Exchange Act is recorded, processed, summarized and reported within the time periods specified in the SEC's rules and forms. Based on that evaluation, our CEO and CFO have concluded that our disclosure controls and procedures were effective as of December 31, 2015 to provide reasonable assurance that information required to be disclosed by us in reports that we file or submit under the Exchange Act is recorded, processed, summarized, and reported within the time periods specified in Securities and Exchange Committee rules and forms, and is accumulated and communicated to management, including our CEO and CFO, as appropriate to allow timely decisions regarding required disclosure.
Changes in Internal Control over Financial Reporting
There were no changes in our internal controls during our most recent fiscal quarter that have materially affected, or are reasonably likely to materially affect, our internal control over financial reporting.
Inherent Limitations of Internal Controls
Our management, including our CEO and CFO, does not expect that our disclosure controls and procedures or our internal controls will prevent all error and all fraud. A control system, no matter how well conceived and operated, can provide only reasonable, not absolute, assurance that the objectives of the control system are met. Because of the inherent limitations in all control systems, no evaluation of controls can provide absolute assurance that all control issues and instances of fraud, if any, within the company have been detected. These inherent limitations include the realities that judgments in decision-making can be faulty, and that breakdowns can occur because of a simple error or mistake. Additionally, controls can be circumvented by the individual acts of some persons, by collusion of two or more people, or by management override of the control. The design of any system of controls also is based in part upon certain assumptions about the likelihood of future events, and there can be no assurance that any design will succeed in achieving its stated goals under all potential future conditions. Over time, controls may become inadequate because of changes in conditions, or the degree of compliance with the policies or procedures may deteriorate. Because of the inherent limitations in a cost-effective control system, misstatements due to error or fraud may occur and not be detected.
Item 9B. | Other Information |
None.
77
PART III
Item 10. | Directors, Executive Officers and Corporate Governance. |
The information required by this item is incorporated by reference to NetSuite's Proxy Statement for its 2016 Annual Meeting of Stockholders to be filed with the SEC within 120 days after the end of the fiscal year ended December 31, 2015.
The information required by this item concerning our executive officers is set forth under the heading "Executive Officers of the Registrant" in Part I, Item 1 of this Annual Report on Form 10-K.
Item 11. | Executive Compensation. |
The information required by this item is incorporated by reference to NetSuite's Proxy Statement for its 2016 Annual Meeting of Stockholders to be filed with the SEC within 120 days after the end of the fiscal year ended December 31, 2015.
Item 12. | Security Ownership of Certain Beneficial Owners and Management and Related Stockholder Matters. |
The information required by this item is incorporated by reference to NetSuite's Proxy Statement for its 2016 Annual Meeting of Stockholders to be filed with the SEC within 120 days after the end of the fiscal year ended December 31, 2015.
Item 13. | Certain Relationships, and Related Transactions, and Director Independence. |
The information required by this item is incorporated by reference to NetSuite's Proxy Statement for its 2016 Annual Meeting of Stockholders to be filed with the SEC within 120 days after the end of the fiscal year ended December 31, 2015.
Item 14. | Principal Accounting Fees and Services. |
The information required by this item is incorporated by reference to NetSuite's Proxy Statement for its 2016 Annual Meeting of Stockholders to be filed with the SEC within 120 days after the end of the fiscal year ended December 31, 2015.
78
PART IV
Item 15. | Exhibits and Financial Statement Schedules. |
(a) Financial Statements
The financial statements filed as part of this report are listed on the Index to Consolidated Financial Statements in Item 8.
(b) Financial Statement Schedules
The following financial statement schedule is filed as a part of this Annual Report:
Schedule II—Valuation and Qualifying Accounts
Schedule II
Valuation and Qualifying Accounts
Additions | |||||||||||||||||||
Beginning balance | Charged to operations | Charged to deferred revenues | Write-offs | Ending balance | |||||||||||||||
(dollars in thousands) | |||||||||||||||||||
Trade receivables allowance | |||||||||||||||||||
Year ended December 31, 2015 | $ | 1,886 | $ | 2,293 | $ | 4,874 | $ | (7,065 | ) | $ | 1,988 | ||||||||
Year ended December 31, 2014 | 833 | 1,446 | 4,196 | (4,589 | ) | 1,886 | |||||||||||||
Year ended December 31, 2013 | $ | 701 | $ | 1,041 | $ | 1,902 | $ | (2,811 | ) | $ | 833 | ||||||||
All other schedules are omitted because they are not required or the required information is shown in the financial statements or notes thereto.
(c) Exhibits
We have filed, or incorporated into the Report by reference, the exhibits listed on the accompanying Index to Exhibits immediately following the signature page of this Form 10-K.
79
SIGNATURES
Pursuant to the requirements of Section 13 or 15(d) of the Securities Exchange Act of 1934, the Registrant has duly caused this report to be signed on its behalf by the undersigned, thereunto duly authorized, in the City of San Mateo, State of California, on February 23, 2016
NETSUITE INC. | ||
By: | /S/ Zachary Nelson | |
Zachary Nelson | ||
Chief Executive Officer | ||
POWER OF ATTORNEY AND SIGNATURES
KNOW ALL PERSONS BY THESE PRESENT, that the individuals whose signatures appear below constitute and appoint Zachary Nelson, Ronald Gill and Douglas P. Solomon, and each of them, his or her true and lawful attorneys-in-fact and agents with full power of substitution, for him or her and in his or her name, place and stead, in any and all capacities, to sign any and all amendments (including post-effective amendments) to this report and to file the same, with all exhibits thereto and all documents in connection therewith, with the Securities and Exchange Commission, granting unto said attorneys-in-fact and agents, and each of them, full power and authority to do and perform each and every act and thing requisite and necessary to be done in connection therewith, as fully to all intents and purposes as he or she might or could do in person, hereby ratifying and confirming all that said attorneys-in-fact and agents or any of them, or his or her or their substitute or substitutes, may lawfully do or cause to be done by virtue hereof.
Pursuant to the requirements of the Securities Exchange Act of 1934, this report has been signed below by the following persons on behalf of the Registrant and in the capacities and on the dates indicated.
Signature | Title | Date | ||
/S/ Zachary Nelson | Director and Chief Executive Officer (Principal Executive Officer) | February 23, 2016 | ||
Zachary Nelson | ||||
/S/ Ronald Gill | Chief Financial Officer (Principal Financial and Accounting Officer) | February 23, 2016 | ||
Ronald Gill | ||||
/S/ James McGeever | Director | February 23, 2016 | ||
James McGeever | ||||
/S/ William L. Beane III | Director | February 23, 2016 | ||
William L. Beane III | ||||
/S/ Deborah Farrington | Director | February 23, 2016 | ||
Deborah A. Farrington | ||||
/S/ Evan Goldberg | Director | February 23, 2016 | ||
Evan M. Goldberg | ||||
/S/ Steve Gomo | Director | February 23, 2016 | ||
Steven Gomo | ||||
/S/ Kevin Thompson | Director | February 23, 2016 | ||
Kevin Thompson | ||||
/S/ Catherine R. Kinney | Director | February 23, 2016 | ||
Catherine R. Kinney | ||||
/S/ Edward Zander | Director | February 23, 2016 | ||
Edward J. Zander | ||||
80
Exhibit Index
The following exhibits are incorporated by reference or filed herewith.
Exhibit number | Description | |
2.1 | Agreement and Plan of Merger, by and between the Registrant, Broadway Merger Sub I, Inc., Broadway Merger Sub II, LLC, Bronto Software, Inc., and Joseph Colopy, as Securityholder Representative, dated April 22, 2015 (incorporated by reference to Exhibit 2.1 of Registrant’s Form 8-K filed on April 23, 2015). | |
3.1 | Amended and Restated Certificate of Incorporation of the Registrant (incorporated by reference to Exhibit 3.2 of Registrant's Form S-1 Registration No. 333-144257). | |
3.2 | Amended and Restated Bylaws of the Registrant (incorporated by reference to Exhibit 3.14 of Registrant's Current Report on Form 8-K filed on March 21, 2014). | |
4.1 | Form of Common Stock Certificate of the Registrant (incorporated by reference to Exhibit 4.1 of Registrant's Form S-1 Registration No. 333-144257). | |
4.2 | Amended and Restated Investor Rights Agreement by and among the Registrant and certain stockholders dated March 31, 2005, and amendments thereto (incorporated by reference to Exhibit 4.2 of Registrant's Form S-1 Registration No. 333-144257). | |
4.3 | Limited Liability Company Operating Agreement of NetSuite Restricted Holdings LLC (incorporated by reference to Exhibit 4.4 of Registrant's Form S-1 Registration No. 333-144257). | |
4.4 | Board Resolutions Approving Corporate Opportunity Waiver (incorporated by reference to Exhibit 4.5 of Registrant's Form S-1 Registration No. 333-144257). | |
4.5 | Indenture between the Registrant and Wells Fargo Bank, National Association, as Trustee dated June 4, 2013 (incorporated by reference to Exhibit 4.1 of Registrant’s Current Report on Form 8-K filed on June 10, 2013). | |
4.6 | Form of 0.25% Convertible Senior Notes due 2018 (incorporated by reference to Exhibit 4.2 of Registrant’s Current Report on Form 8-K filed on June 10, 2013). | |
10.1+ | Form of Indemnification Agreement between the Registrant and each of its directors and executive officers (incorporated by reference to Exhibit 10.1 of Registrant's Form S-1 Registration No. 333-144257). | |
10.2+ | 1999 Stock Plan and forms of agreements thereunder (incorporated by reference to Exhibit 10.2 of Registrant's Form S-1 Registration No. 333-144257). | |
10.3+ | 2007 Equity Incentive Plan and forms of agreements thereunder (incorporated by reference to Exhibit 10.1 of Registrant's Quarterly Report on Form 10-Q filed on August 13, 2008 and Exhibits 10.1 to 10.3 of Registrant's Quarterly Report on Form 10-Q filed on May 7, 2012). | |
10.4+ | 2008 Executive Bonus Plan (incorporated by reference to Exhibit 10.1 of Registrant's Current Report on Form 8-K filed on May 1, 2008). | |
10.5+ | 2015 Employee Stock Purchase Plan (incorporated by reference to Exhibit 4.1 of Registrant’s Registration Statement on Form S-8 filed on October 15, 2015). | |
81
10.6+ | OpenAir, Inc. 2008 Restricted Stock Unit Plan and forms of agreement thereunder (incorporated by reference to Exhibits 10.5 and 10.6 of Registrant's Quarterly Report on Form 10-Q filed on August 13, 2008). | |
10.7+ | Offer Letter Agreement by and between the Registrant and Zachary Nelson effective July 1, 2007 (incorporated by reference to Exhibit 10.6 of Registrant's Form S-1 Registration No. 333-144257). | |
10.8+ | Offer Letter Agreement by and between the Registrant and Evan M. Goldberg effective July 1, 2007 (incorporated by reference to Exhibit 10.7 of Registrant's Form S-1 Registration No. 333-144257). | |
10.9+ | Offer Letter Agreement by and between the Registrant and James McGeever effective March 2, 2011. | |
10.10+ | Letter Agreement by and between Marc Huffman and Registrant effective May 1, 2014 (incorporated by reference to Exhibit 10.1 of Registrant's Quarterly Report on Form 10-Q filed on May 6, 2014). | |
10.11 | Office Lease Agreement by and between the Registrant and EOP-Peninsula Office Park, L.L.C. dated August 2, 2005 (incorporated by reference to Exhibit 10.12 of Registrant's Form S-1 Registration No. 333-144257). | |
10.12 | First Amendment to the Office Lease Agreement by and between the Registrant and EOP-Peninsula Office Park, L.L.C. dated April 24, 2008 (incorporated by reference to Exhibit 10.2 of Registrant's Current Report on Form 8-K filed on April 28, 2008). | |
10.13 | Second Amendment to the Office Lease Agreement by and between the Registrant and EOP- Peninsula Office Park, L.L.C. dated October 8, 2010 (incorporated by reference to Exhibit 10.1 of Registrant's Current Report on Form 8-K filed on December 15, 2011). | |
10.14 | Third Amendment to the Office Lease Agreement by and between the Registrant and EOP- Peninsula Office Park, L.L.C. dated December 9, 2011 (incorporated by reference to Exhibit 10.2 of Registrant's Current Report on Form 8-K filed on December 15, 2011). | |
10.15 | Fourth Amendment to the Office Lease Agreement by and between the Registrant and EOP- Peninsula Office Park, L.L.C. dated February 1, 2013 (incorporated by reference to Exhibit 10.1 of Registrant's Current Report on Form 8-K filed on February 5, 2013). | |
10.16 | Eighth Amendment to the Office Lease Agreement by and between the Registrant and Hudson Peninsula Office Park, LLC dated May 8, 2015 (incorporated by reference to Exhibit 10.1 of Registrant’s Current Report on Form 8-K filed on May 13, 2015). | |
10.17 | Distribution Agreement by and between the Registrant and NetSuite KK dated March 8, 2006 (incorporated by reference to Exhibit 10.14 of Registrant's Form S-1 Registration No. 333-144257). | |
10.18 | Software License Agreement by and between the Registrant and Oracle USA, Inc. dated May 11, 2007 (incorporated by reference to Exhibit 10.19 of Registrant's Form S-1 Registration No. 333-144257). | |
10.19+ | Severance and Change of Control Agreement by and between the Registrant and Zachary Nelson effective December 24, 2008. (incorporated by reference to Exhibit 10.18 of Registrant's Annual Report on Form 10-K filed on March 13, 2009) | |
10.20+ | Severance and Change of Control Agreement by and between the Registrant and Evan M. Goldberg effective December 24, 2008. (incorporated by reference to Exhibit 10.19 of Registrant's Annual Report on Form 10-K filed on March 13, 2009) | |
82
10.21+ | Severance and Change of Control Agreement by and between the Registrant and James McGeever effective December 24, 2008. (incorporated by reference to Exhibit 10.20 of Registrant's Annual Report on Form 10-K filed on March 13, 2009) | |
10.22+ | Severance and Change of Control Agreement by and between the Registrant and Douglas P. Solomon effective December 24, 2008. (incorporated by reference to Exhibit 10.23 of Registrant's Annual Report on Form 10-K filed on March 13, 2009) | |
10.23+ | Severance and Change of Control Agreement by and between Marc Huffman and Registrant effective May 1, 2014 (incorporated by reference to Exhibit 10.2 of Registrant's Quarterly Report on Form 10-Q filed on May 6, 2014). | |
10.24 | Ordering Document by and between the Registrant and Oracle USA, Inc. dated October 31, 2007 and as amended (incorporated by reference to Exhibit 10.21 of Registrant's Annual Report on Form 10-K filed on March 3, 2011). | |
10.25 | Ordering Document by and between the Registrant and Oracle America, Inc. dated May 10, 2011 (incorporated by reference to Exhibit 10.1 of Registrant's Current Report on Form 8-K filed on May 13, 2011). | |
10.26 | Amendment Three to the Ordering Document between the Registrant and Oracle America, Inc. dated February 28, 2013 (incorporated by reference to Exhibit 10.1 of Registrant's Current Report on Form 8-K filed on March 6, 2013). | |
10.27 | Amended and Restated Master Services Agreement between the Registrant and SAVVIS Communications Corporation dated May 14, 2010 thereunder (incorporated by reference to Exhibit 10.1 of Registrant's Form 8-K filed on May 21, 2010). | |
21.1 | Subsidiaries of the Registrant. | |
23.1 | Consent of KPMG LLP, Independent Registered Public Accounting Firm. | |
31.1 | Certification of the Chief Executive Officer pursuant to Section 302 of the Sarbanes-Oxley Act. | |
31.2 | Certification of the Chief Financial Officer pursuant to Section 302 of the Sarbanes-Oxley Act. | |
32.1 | Certification of the Chief Executive Officer and the Chief Financial Officer pursuant to Section 906 of the Sarbanes-Oxley Act. | |
101.INS** | XBRL Instance Document | |
101.SCH** | XBRL Taxonomy Extension Schema Document | |
101.CAL** | XBRL Taxonomy Extension Calculation Linkbase Document | |
101.DEF** | XBRL Taxonomy Extension Definition Linkbase Document | |
101.LAB** | XBRL Taxonomy Extension Label Linkbase Document | |
101.PRE** | XBRL Taxonomy Extension Presentation Linkbase Document | |
** | The information in these XBRL documents is unaudited. | |
83
The certification attached as Exhibit 32.1 that accompanies this Annual Report on Form 10-K is not deemed filed with the Securities and Exchange Commission and is not to be incorporated by reference into any filing of NetSuite Inc. under the Securities Act of 1933 or the Securities Exchange Act of 1934, whether made before or after the date of this Annual Report on Form 10-K, irrespective of any general incorporation language contained in such filing.
+ | Indicates management contract or compensatory plan or arrangement. |
84