Attached files
| file | filename |
|---|---|
| 8-K - FORM 8-K - LEXINGTON REALTY TRUST | v432504_8k.htm |
| EX-99.2 - EXHIBIT 99.2 - LEXINGTON REALTY TRUST | v432504_ex99-2.htm |
| EX-99.1 - EXHIBIT 99.1 - LEXINGTON REALTY TRUST | v432504_ex99-1.htm |
Exhibit 99.3

INVESTOR PRESENTATION FEBRUARY 2016 LEXINGTON REALTY TRUST

Disclosure This presentation contains certain forward - looking statements within the meaning of Section 27 A of the Securities Act of 1933 , as amended, and Section 21 E of the Securities Exchange Act of 1934 , as amended, which involve known and unknown risks, uncertainties or other factors not under Lexington Realty Trust’s (“Lexington” or “LXP”) control which may cause actual results, performance or achievements of Lexington to be materially different from the results, performance, or other expectations implied by these forward - looking statements . These factors include, but are not limited to, those factors and risks detailed in Lexington’s filings with the Securities and Exchange Commission . Except as required by law, Lexington undertakes no obligation to ( 1 ) publicly release the results of any revisions to those forward - looking statements which may be made to reflect events or circumstances after the occurrence of unanticipated events or ( 2 ) update or supplement forward - looking statements that become untrue because of subsequent events . Accordingly, there is no assurance that Lexington’s expectations will be realized . 2

Company Overview LEXINGTON REALTY TRUST (NYSE: LXP) Long History Portfolio Snapshot Experienced Team Franchise founded in 1973 Public since 1993 Consistent dividend paying company for 22 years Investment grade credit ratings by S&P, Moody’s and Fitch $5.0 billion company (gross book value) 215 properties, including land, across 42.3 million square feet in 40 U.S. states Approximately 97% leased Pay quarterly annualized dividend of $0.68 per common share Seasoned executive management averaging 19 years with LXP Consistently improving portfolio quality Prudent managers of capital Experienced portfolio and asset management teams focused on enhancing operating results As of 12/31/2015. 3

Investment Features Focused Single - Tenant, Net - Lease Strategy Diversified Portfolio Attractive Growth Prospects Active Portfolio Management Consistent Operating Performance Flexible Balance Sheet Strong Dividend with Conservative Payout Ratio 4
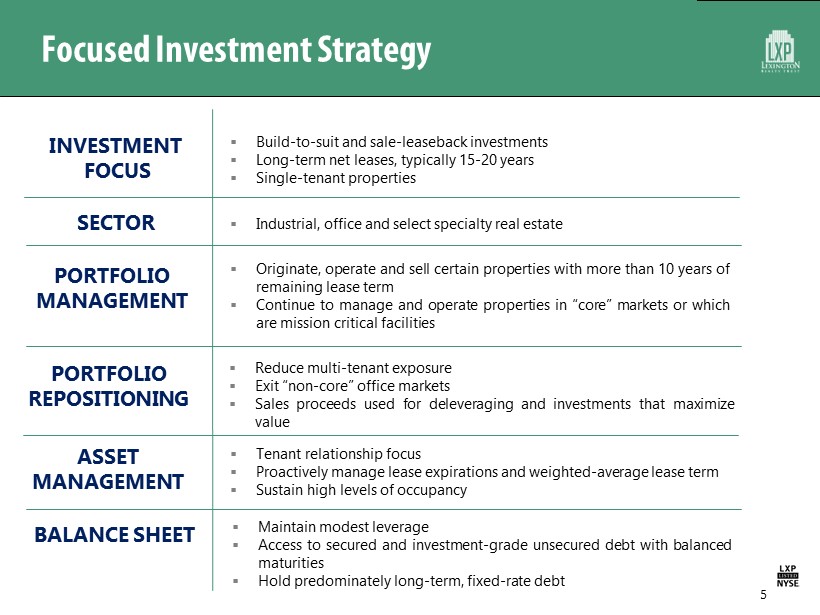
Focused Investment Strategy 5 INVESTMENT FOCUS ▪ Build - to - suit and sale - leaseback investments ▪ Long - term net leases, typically 15 - 20 years ▪ Single - tenant properties SECTOR ▪ Industrial, o ffice and select specialty r eal estate PORTFOLIO MANAGEMENT ▪ Originate , operate and sell certain properties with more than 10 years of remaining lease term ▪ Continue to manage and operate properties in “core” markets or which are mission critical facilities ASSET MANAGEMENT PORTFOLIO REPOSITIONING ▪ Reduce multi - tenant exposure ▪ Exit “non - core” office markets ▪ Sales proceeds used for deleveraging and investments that maximize value ▪ Tenant relationship focus ▪ Proactively manage lease expirations and weighted - average lease term ▪ Sustain high levels of occupancy BALANCE SHEET ▪ Maintain modest leverage ▪ Access to secured and investment - grade unsecured debt with balanced maturities ▪ Hold predominately long - term, fixed - rate debt

Investment Strategy Opportunities 6 Build - to - Suit Projects ▪ Ability to originate a transaction for a yield premium ▪ Less competition in market provides more opportunities with attractive pricing ▪ Potential to make favorable returns with less risk by managing exit strategy Sale Leasebacks ▪ Ability to secure a long - term lease with existing tenant ▪ Real estate strategically essential to tenant — could lead to lower tenant default risk ▪ Favorable returns compared to corporate bonds of similar credit risk Net - Lease Properties ▪ Sustained, predictable cash flows ▪ Low inflation risk due to tenant operating expense obligations ▪ High levels of occupancy and lower turnover ▪ Less cap - ex requirements ▪ Long - term leases with rent bumps Long - Term Leases ▪ Total rent payable tends to exceed purchase price ▪ Likelihood of change in tenant needs ▪ Market rents can grow faster than lease escalations ▪ Wide window to optimize exit strategy and maximize returns Advantages

7 Through its focused strategy, Lexington continues to show meaningful progress towards creating a best - in - class net - lease REIT. Portfolio Metrics 2013 (1) 2015 (2) Status Office Exposure (3) 61.3% 50.1% i Multi - Tenant Exposure (3) 7.9% 3.0% i % of Revenue from Long - Term Leases (4) 30.1% 40.8% h Average Lease Duration (years) (5) 11.2 12.6 h Unencumbered Asset Base $2.6 Billion $3.3 Billion h Weighted - Avg . Debt Maturity (years) 7.0 7.2 h Weighted - Avg . Interest Rate 4.71% 4.01% i (1) As of 12/31/13. (2) As of 12/31/15. (3 ) As a percentage of GAAP rent for the respective year ended for consolidated properties owned as of such year end. (4) Leases with remaining term of 10 years or longer. (5) Cash basis for consolidated properties owned as of each respective year end. Not adjusted to reflect NY land leases through the first purchase option date. Portfolio Transformation Continues…
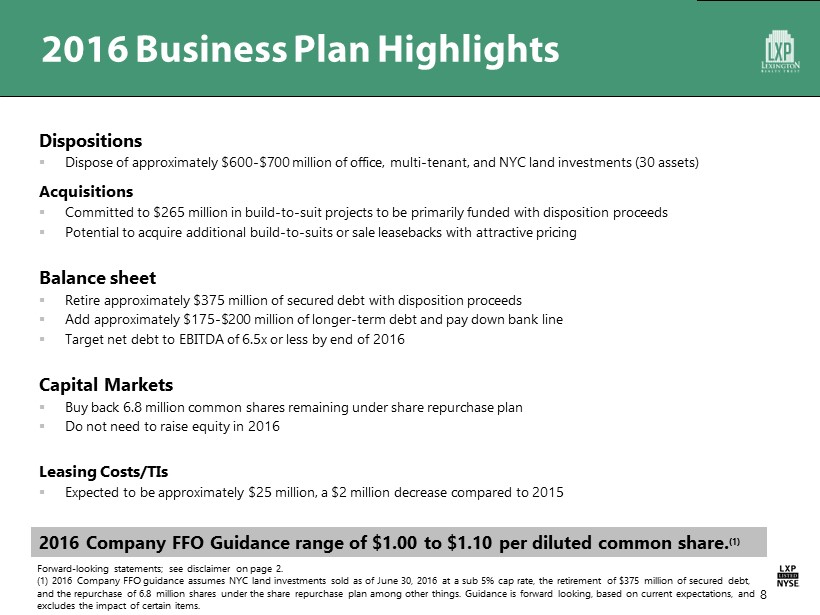
2016 Business Plan Highlights Dispositions ▪ Dispose of approximately $600 - $700 million of office, multi - tenant, and NYC land investments (30 assets) Acquisitions ▪ Committed to $265 million in build - to - suit projects to be primarily funded with disposition proceeds ▪ Potential to acquire additional build - to - suits or sale leasebacks with attractive pricing Balance sheet ▪ Retire approximately $375 million of secured debt with disposition proceeds ▪ Add approximately $175 - $200 million of longer - term debt and pay down bank line ▪ Target net debt to EBITDA of 6.5x or less by end of 2016 Capital Markets ▪ Buy back 6.8 million common shares remaining under share repurchase plan ▪ Do not need to raise equity in 2016 Leasing Costs/TIs ▪ Expected to be approximately $25 million, a $2 million decrease compared to 2015 2016 Company FFO Guidance range of $1.00 to $1.10 per diluted common share. (1) Forward - looking statements; see disclaimer on page 2. (1) 2016 Company FFO guidance assumes NYC land investments sold as of June 30, 2016 at a sub 5% cap rate, the retirement of $ 375 million of secured debt, and the repurchase of 6.8 million shares under the share repurchase plan among other things. Guidance is forward looking, bas ed on current expectations, and excludes the impact of certain items. 8

25.6 12.8 2.3 1.4 0.2 Square Footage (Millions) Industrial Office Multi-Tenant Retail/ Specialty Land/ Infrastructure Well Diversified by Geography/Property Type 9 24 5 7 1 2 2 2 3 3 1 2 3 4 2 3 7 14 13 13 2 2 8 5 9 4 6 15 5 9 10 2 2 8 1 2 1 1 5 2 States with rental revenue greater than $10 million on an annualized GAAP basis. Note: All information as of 12/31/15. Numbers indicated in the individual states represent number of properties owned in each st ate. 96 67 30 12 10 Office Industrial Retail Multi-Tenant Land/Infrastructure Number of Properties 5

Revenue Sources by Property Type 10 3.4% 61.3% 24.6% 7.9% 2.8% 16.0% 50.1% 27.9% 3.0% 3.0% Land/Infrastructure Office Industrial Multi-Tenant Retail/Specialty 2013 (1) 2015 (2) Lexington continues to improve and diversify its revenue sources. (1) GAAP revenue as of 12/31/13. (2) GAAP revenue as of 12/31/15.

Strong Tenant Diversification Top 10 Tenants (1) Revenue by Credit Rating (2) (1) Based on cash rent for the year ended 12/31/15, for consolidated properties owned as of 12/31/15. (2) Based on GAAP rent for the year ended 12/31/15, for consolidated properties owned as of 12/31/15 . (3) Total shown may differ from detailed amounts due to rounding. (4) Credit ratings are based upon either tenant, guarantor or parent entity. 14.9% Non - IG 50.6% Unrated 34.5% Investment Grade 11 Top 10 Tenants/Lease Guarantor Primary Lease Term Expiration Year # of Leases % of Base Rent (3) S&P Moody's FedEx Corporation / Federal Express Corporation 19/21/28 3 3.8% BBB Baa1 Metalsa Structural Products, Inc./ Dana Holding Corporation/ Dana Limited 21/25/26 7 3.1% BB+ Ba3 United States of America 16/18/27/30 4 2.4% AA+ Aaa Nissan North America, Inc. 23/27 2 2.4% A - A3 Swiss RE America Holding Corporation / Westport Insurance Corp. 18/19 2 2.2% A Aa3 Xerox Corporation 2023 1 2.1% BBB Baa2 Michelin North America, Inc. 16/19/20 3 2.1% - - T - Mobile USA, Inc./T - Mobile West Corporation 19/20 5 2.1% - Ba3 SM Ascott LLC 2112 1 1.7% - - Industrial Terminals Mgmt , LLC/Maritime Holdings (Delaware) LLC 2038 1 1.6% - - % of Top10 Tenants 23.4% Strong, brand name tenants with more than half of top 10 tenants investment - grade rated. Credit Rating (4)

Execution: Strong Acquisition Activity (1) Includes 100% of joint venture acquisitions ($39.5 million in 2013, $57.5 million in 2012 and $15.3 million in 2011) and excl ude s the acquisition of NLS on 9/1/2012. $128.2 $247.0 $590.4 $212.3 $483.0 8.8% 8.4% 5.9% 7.6% 7.4% 0.0% 1.0% 2.0% 3.0% 4.0% 5.0% 6.0% 7.0% 8.0% 9.0% 10.0% $0.0 $100.0 $200.0 $300.0 $400.0 $500.0 $600.0 $700.0 2011 2012 2013 2014 2015 Property Acquisition Volume and Cap Rate (1) 12 Lexington has been able to maintain strong acquisition activity with attractive pricing.
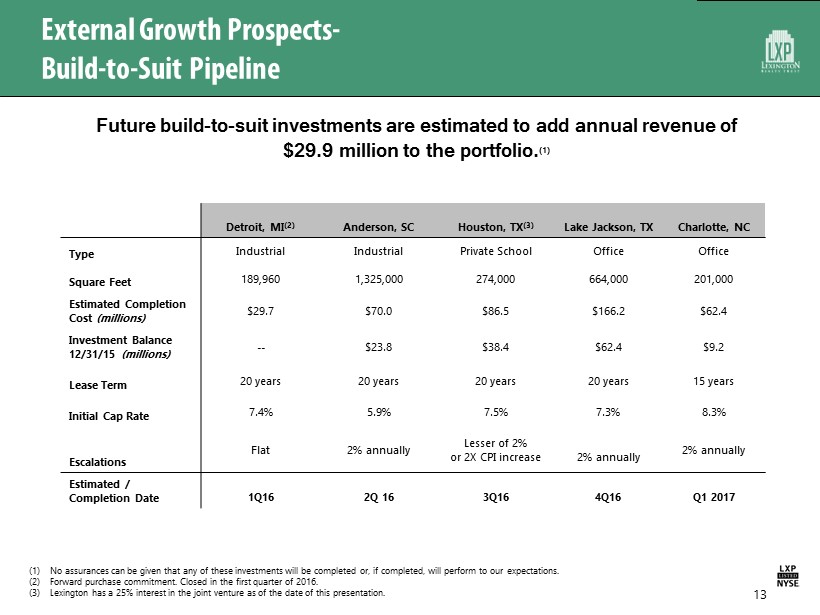
External Growth Prospects - Build - to - Suit Pipeline (1) No assurances can be given that any of these investments will be completed or, if completed, will perform to our expectation s. (2) Forward purchase commitment. Closed in the first quarter of 2016. (3) Lexington has a 25% interest in the joint venture as of the date of this presentation. Detroit, MI (2) Anderson, SC Houston, TX (3) Lake Jackson, TX Charlotte, NC Type Industrial Industrial Private School Office Office Square Feet 189,960 1,325,000 274,000 664,000 201,000 Estimated Completion Cost (millions) $29.7 $70.0 $86.5 $166.2 $62.4 Investment Balance 12/31/15 (millions) -- $23.8 $38.4 $62.4 $9.2 Lease Term 20 years 20 years 20 years 20 years 15 years Initial Cap Rate 7.4% 5.9% 7.5% 7.3% 8.3% Escalations Flat 2% annually Lesser of 2% or 2X CPI increase 2% annually 2% annually Estimated / Completion Date 1Q16 2Q 16 3Q16 4Q16 Q1 2017 13 Future build - to - suit investments are estimated to add annual revenue of $29.9 million to the portfolio. (1)

▪ Acquired in Q4 1015 for approx. $152 million ▪ Attractive cash cap rate of 7.1% and GAAP cap rate of 8.6 % ▪ 456,400 sq. foot state - of - the - art industrial facility located in Washington State ▪ Lease payments backed by strong credit tenant — ConAgra Foods, Inc. ▪ Obtained $110 million 10 - year mortgage financing at a 4% fixed rate ▪ Long - term lease of 20 years ▪ 2016 cash - on - cash return of approximately 15% ▪ Attractive long - term internal rate of returns (IRR): 14 Investment Hold (years ) Exit Cap Rate IRR 10 7.0% 20.3% 10 8.0% 18.3% 10 9.0% 16.4% 10 10.0% 14.6% Build - to - Suit Investment Rationale: Preferred Freezer Note: Initial cash cap rate, IRR, and cash - on - cash return are measures of operating performance used to evaluate the individual performance of an investment. These measures are not presented or intended to be viewed as liquidity or performance measures that present a numerical measu re of Lexington’s historical or future financial performance, financial position or cash flows. Expectations may not be realized.
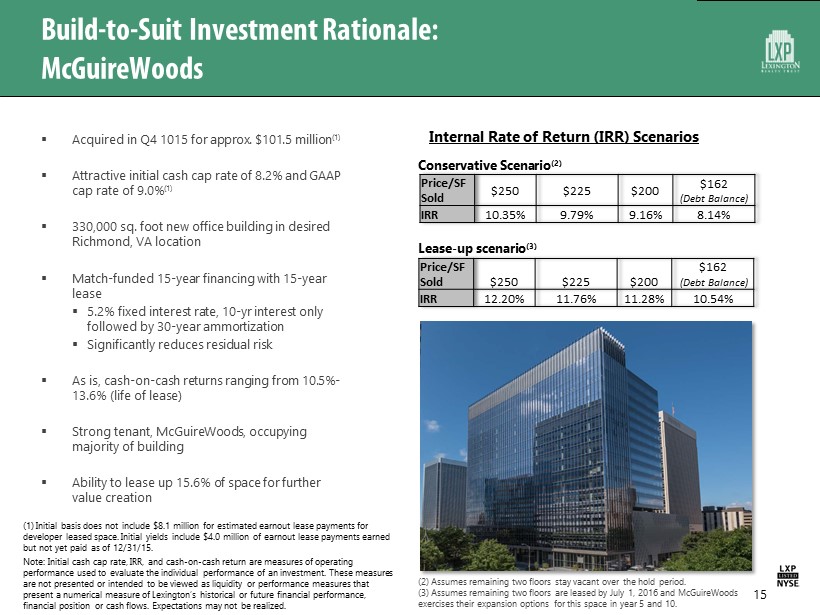
Build - to - Suit Investment Rationale: McGuireWoods 15 ▪ Acquired in Q4 1015 for approx. $101.5 million (1) ▪ Attractive initial cash cap rate of 8.2% and GAAP cap rate of 9.0% (1) ▪ 330,000 sq. foot new office building in desired Richmond, VA location ▪ Match - funded 15 - year financing with 15 - year lease ▪ 5.2% fixed interest rate, 10 - yr interest only followed by 30 - year ammortization ▪ Significantly reduces residual risk ▪ As is, cash - on - cash returns ranging from 10.5% - 13.6% (life of lease) ▪ Strong tenant, McGuireWoods , occupying majority of building ▪ Ability to lease up 15.6% of space for further value creation Internal Rate of Return (IRR) Scenarios Price/SF Sold $ 250 $ 225 $200 $162 ( Debt Balance) IRR 10.35% 9.79% 9.16% 8.14% Price/SF Sold $ 250 $ 225 $200 $ 162 (Debt Balance) IRR 12.20% 11.76% 11.28% 10.54% Conservative Scenario (2) Lease - up scenario (3) (2) Assumes remaining two floors stay vacant over the hold period. (3) Assumes remaining two floors are leased by July 1, 2016 and McGuireWoods exercises their expansion options for this space in year 5 and 10. Note: Initial cash cap rate, IRR, and cash - on - cash return are measures of operating performance used to evaluate the individual performance of an investment. These measures are not presented or intended to be viewed as liquidity or performance measures that present a numerical measure of Lexington’s historical or future financial performance, financial position or cash flows. Expectations may not be realized. (1) Initial basis does not include $8.1 million for estimated earnout lease payments for developer leased space. Initial yields include $4.0 million of earnout lease payments earned but not yet paid as of 12/31/15.
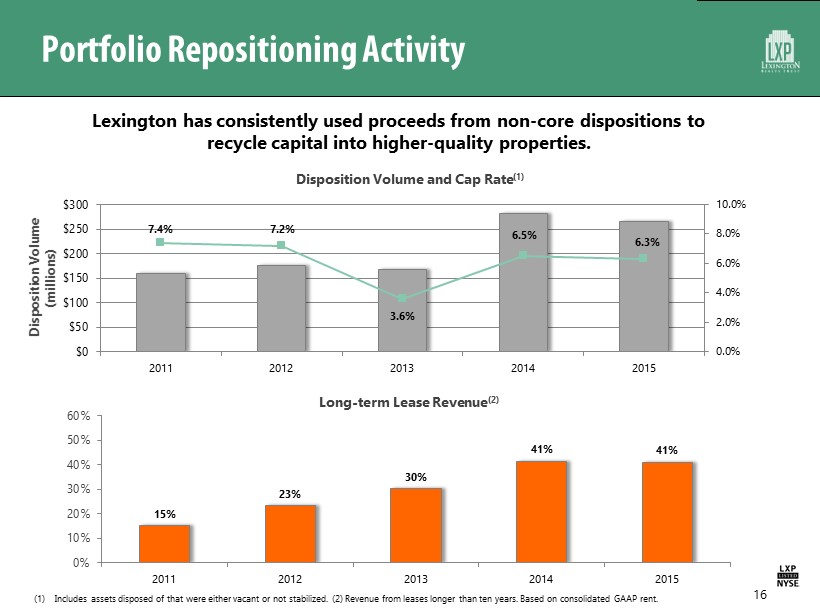
Portfolio Repositioning Activity 16 Disposition Volume and Cap Rate (1) Lexington has consistently used proceeds from non - core dispositions to recycle capital into higher - quality properties. 7.4% 7.2% 6.5% 3.6% 6.3% 0.0% 2.0% 4.0% 6.0% 8.0% 10.0% $0 $50 $100 $150 $200 $250 $300 2011 2012 2013 2014 2015 Disposition Volume (millions) (1) Includes assets disposed of that were either vacant or not stabilized. (2) Revenue from leases longer than ten years. Based o n c onsolidated GAAP rent. Long - term Lease Revenue (2) 15% 23% 30% 41% 41% 0% 10% 20% 30% 40% 50% 60% 2011 2012 2013 2014 2015

Asset Repositioning Case Study: Sea Harbor Center 17 ▪ Vacated in 2008 ▪ Conversion to multi - tenant ▪ Lexington invested $39 million ▪ Occupancy raised to 99.7% (1) ▪ Sold for $64.7 million in June 2015 Sea Harbor Center Orlando, Florida $(0.4) $(0.8) $(0.8) $(0.6) $2.7 $(2.0) $(1.0) $- $1.0 $2.0 $3.0 2010 2011 2012 2013 2014 Millions Net Operating Income 0.0% 0.0% 74.5% 86.9% 99.7% 0.0% 20.0% 40.0% 60.0% 80.0% 100.0% 2010 2011 2012 2013 2014 Occupancy (1) At closing in June 2015. Note: Net operating income (NOI) is a measure of operating performance used to evaluate the individual performance of an inve stm ent. This measure is not presented or intended to be viewed as a liquidity or performance measure that presents a numerical measure of Lexington’s historical or future financi al performance, financial position or cash flows.
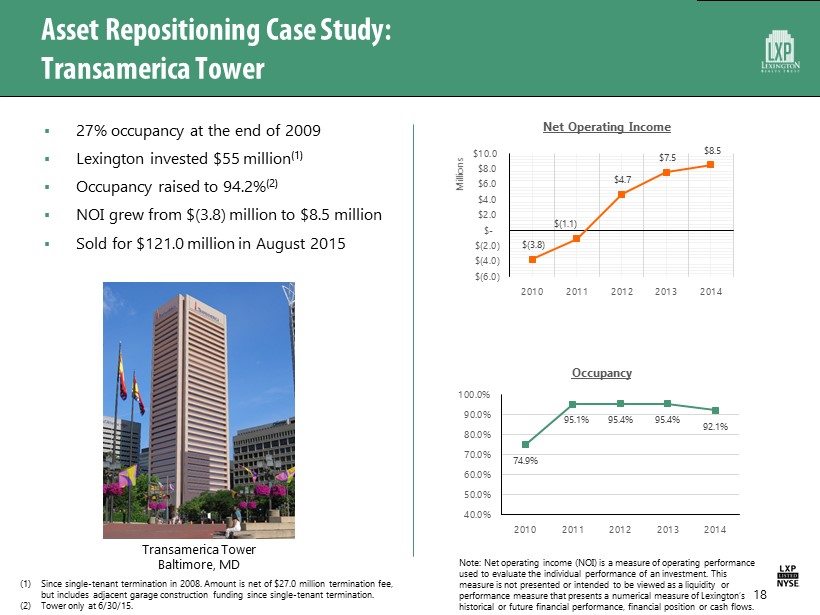
Asset Repositioning Case Study: Transamerica Tower ▪ 27% occupancy at the end of 2009 ▪ Lexington invested $55 million (1) ▪ Occupancy raised to 94.2% (2) ▪ NOI grew from $(3.8) million to $8.5 million ▪ Sold for $121.0 million in August 2015 $(3.8) $(1.1) $4.7 $7.5 $8.5 $(6.0) $(4.0) $(2.0) $- $2.0 $4.0 $6.0 $8.0 $10.0 2010 2011 2012 2013 2014 Millions Net Operating Income 74.9% 95.1% 95.4% 95.4% 92.1% 40.0% 50.0% 60.0% 70.0% 80.0% 90.0% 100.0% 2010 2011 2012 2013 2014 Occupancy Transamerica Tower Baltimore, MD 18 (1) Since single - tenant termination in 2008. Amount is net of $27.0 million termination fee, but includes adjacent garage construction funding since single - tenant termination. (2) Tower only at 6/30/15. Note: Net operating income (NOI) is a measure of operating performance used to evaluate the individual performance of an investment. This measure is not presented or intended to be viewed as a liquidity or performance measure that presents a numerical measure of Lexington’s historical or future financial performance, financial position or cash flows.
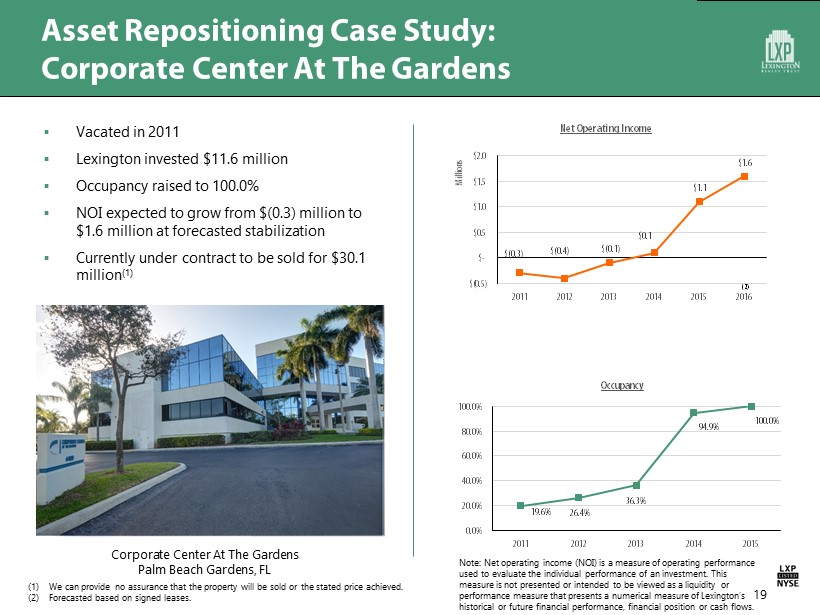
Asset Repositioning Case Study: Corporate Center At The Gardens ▪ Vacated in 2011 ▪ Lexington invested $11.6 million ▪ Occupancy raised to 100.0% ▪ NOI expected to grow from $(0.3) million to $1.6 million at forecasted stabilization ▪ Currently under contract to be sold for $30.1 million (1) $(0.3) $(0.4) $(0.1) $0.1 $1.1 $1.6 $(0.5) $- $0.5 $1.0 $1.5 $2.0 2011 2012 2013 2014 2015 2016 Millions Net Operating Income 19.6% 26.4% 36.3% 94.9% 100.0% 0.0% 20.0% 40.0% 60.0% 80.0% 100.0% 2011 2012 2013 2014 2015 Occupancy Corporate Center At The Gardens Palm Beach Gardens, FL 19 (1) We can provide no assurance that the property will be sold or the stated price achieved. (2) Forecasted based on signed leases. (2) Note: Net operating income (NOI) is a measure of operating performance used to evaluate the individual performance of an investment. This measure is not presented or intended to be viewed as a liquidity or performance measure that presents a numerical measure of Lexington’s historical or future financial performance, financial position or cash flows.

Managing Lease Expirations Balanced rollover with meaningful progress addressing expirations. (1) 0% 10% 2016 2017 2018 2019 2020 2021 2022 2023 2024 2025 Lease Expiration Schedule (By Percentage of GAAP Rent) (2) Q4 2015 Q4 2014 (1) Based on consolidated GAAP rent for the year ended 12/31/15, excluding parking operations. (2) As a percentage of consolidated GAAP rent for the year ended 12/31/15 and 12/31/14, excluding parking operations. 20 26.4% 23.0% 25.0% 25.6% 5% 15% 25% Through 2019 2020-2024 2025-2029 Post 2029 Lease Rollover Distribution(1)

21 64.5% 19.6% 15.9% Annual increases Flat Other scheduled increases 6.9 11.2 12.1 12.6 4.0 6.0 8.0 10.0 12.0 14.0 2012 2013 2014 2015 (1) Cash basis for consolidated properties. As of 12/31/15. (2) Based on consolidated cash rent for the year ended 12/31/15 for single - tenant leases . Excludes parking operations and $7.8 million in step - down lease. (3) Based on GAAP rent for the year ended 12/31/2015. Weighted - Average Lease Term (1) (In Years) Scheduled Rental Increases (2) Stable and Predictable Cash Flows 59.2% 40.8% Leases Under 10 Years Remaining Leases Over 10 Years Remaining Lease Type (3) Approximately 66% of office revenue is derived from long - term leases or leases executed after January 1, 2009.

22 93.4% 95.9% 97.3% 97.6% 96.4% 96.8% 85.0% 90.0% 95.0% 100.0% - 2,000 4,000 6,000 8,000 2010 2011 2012 2013 2014 2015 Leasing Volume SF in 000s Strong Operational Performance Historical Occupancy and Leasing Volume LXP continues to maintain high occupancy through its proactive leasing efforts.
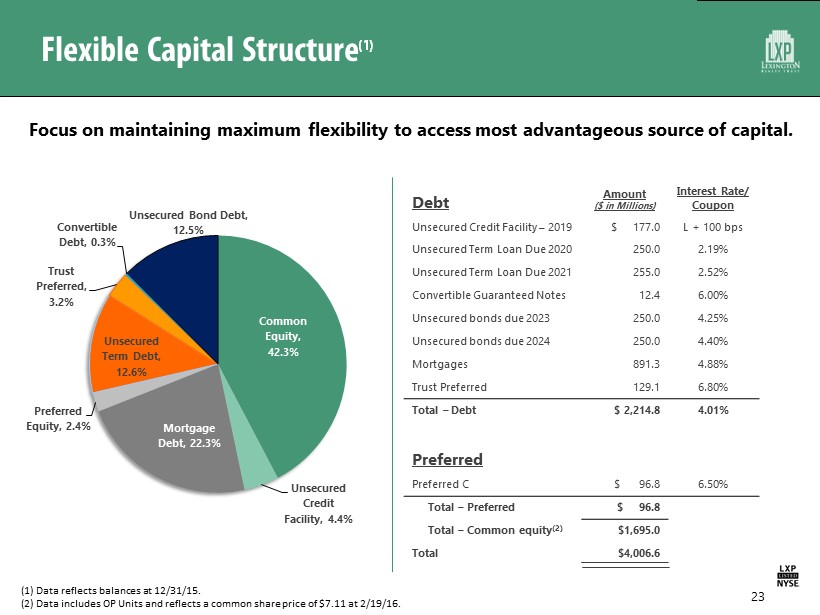
Flexible Capital Structure (1) 23 (1) Data reflects balances at 12/31/15. (2) Data includes OP Units and reflects a common share price of $7.11 at 2/19/16. Debt Amount ($ in Millions) Interest Rate/ Coupon Unsecured Credit Facility – 2019 $ 177.0 L + 100 bps Unsecured Term Loan Due 2020 250.0 2.19% Unsecured Term Loan Due 2021 255.0 2.52% Convertible Guaranteed Notes 12.4 6.00% Unsecured bonds due 2023 250.0 4.25% Unsecured bonds due 2024 250.0 4.40% Mortgages 891.3 4.88% Trust Preferred 129.1 6.80% Total – Debt $ 2,214.8 4.01% Preferred Preferred C $ 96.8 6.50% Total – Preferred $ 96.8 Total – Common equity (2) $1,695.0 Total $4,006.6 Common Equity , 42.3% Unsecured Credit Facility , 4.4% Mortgage Debt , 22.3% Preferred Equity , 2.4% Unsecured Term Debt , 12.6% Trust Preferred , 3.2% Convertible Debt , 0.3% Unsecured Bond Debt , 12.5% Focus on maintaining maximum flexibility to access most advantageous source of capital.

Balance Sheet Strategy 24 Lexington will focus on extending maturities, unencumbering assets, maintaining its investment - grade ratings and selectively utilizing secured financing. LXP Debt Maturity Profile ($000’s ) (1) (1) As of 12/31/2015. Percentage denotes weighted - average interest rate . 5.8% 5.6% 6.0% 5.7% 6.2% 6.1% 4.1% 6.0% 1.3% 2.2% 2.5% 4.3% 4.4% $- $50,000 $100,000 $150,000 $200,000 $250,000 $300,000 2016 2017 2018 2019 2020 2021 2022 2023 2024 2025 Actual Mortgage Balloon Debt Corporate Debt
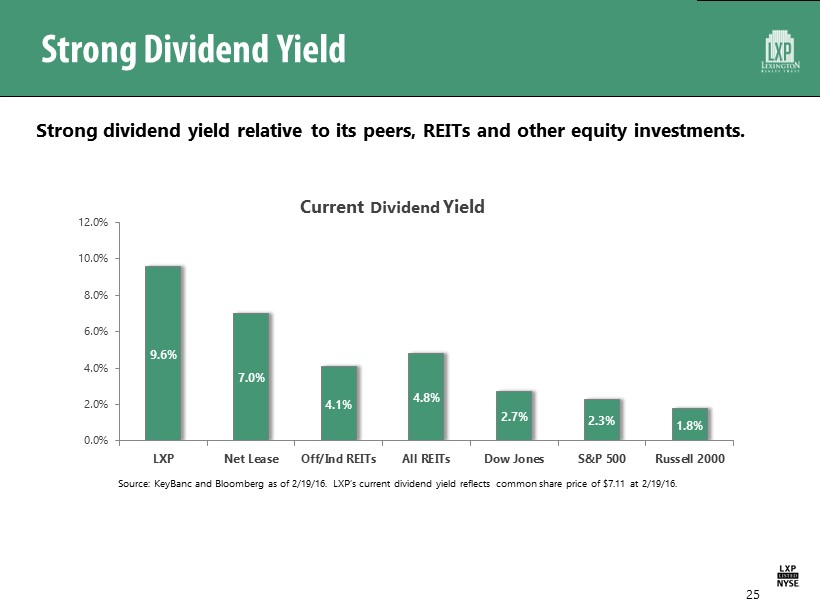
Strong Dividend Yield Strong dividend yield relative to its peers, REITs and other equity investments. Current Dividend Yield 25 Source: KeyBanc and Bloomberg as of 2/19/16. LXP’s current dividend yield reflects common share price of $7.11 at 2/19/16. 9.6% 7.0% 4.1% 4.8% 2.7% 2.3% 1.8% 0.0% 2.0% 4.0% 6.0% 8.0% 10.0% 12.0% LXP Net Lease Off/Ind REITs All REITs Dow Jones S&P 500 Russell 2000

Conservative Payout Ratio LXP believes its low payout ratio relative to its peers could improve growth prospects over time. 26 (1) Source: KeyBanc as of 2/19/16. 2016 Estimated FFO Payout Ratio (1) 63.6% 62.3% 52.6% 74.4% 0% 10% 20% 30% 40% 50% 60% 70% 80% LXP Industrial REITs Office REITs Net-Lease REITs 2016 Estimated AFFO Multiples (1) 8.7x 19.1x 18.2x 11.8x 0.0 5.0 10.0 15.0 20.0 25.0 LXP Industrial REITs Office REITs Net-Lease REITs

Investment Features ▪ Focused Single - Tenant, Net - Lease Strategy ▪ Diversified Portfolio ▪ Attractive Growth Prospects ▪ Active Portfolio Management ▪ Consistent Operating Performance ▪ Flexible Balance Sheet ▪ Strong Dividend with Conservative Payout Ratio 27
LEXINGTON REALTY TRUST A real estate investment trust specializing in single - tenant commercial properties.