Attached files
| file | filename |
|---|---|
| EX-99.1 - EX-99.1 - Matson, Inc. | a16-4912_1ex99d1.htm |
| 8-K - 8-K - Matson, Inc. | a16-4912_18k.htm |
Exhibit 99.2
Fourth Quarter and Full Year 2015 Earnings Conference Call
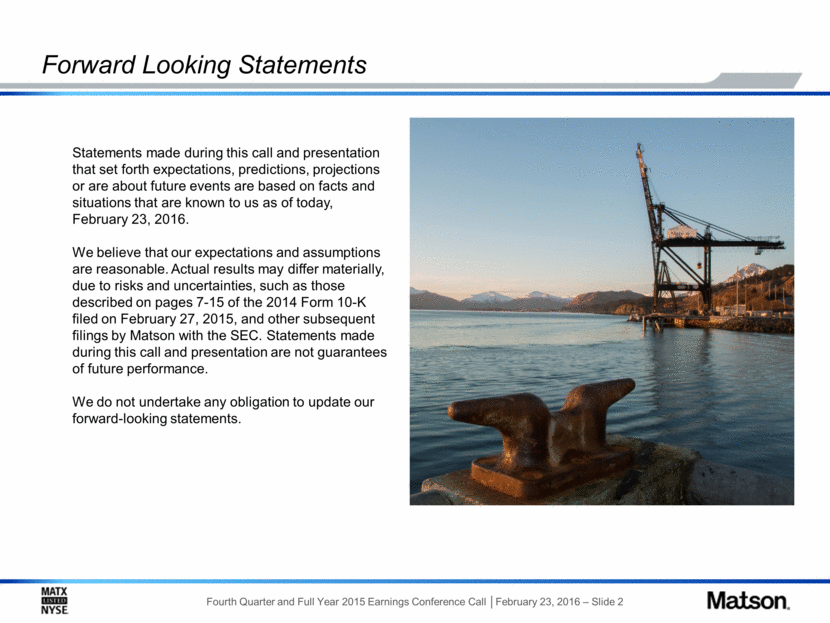
Forward Looking Statements Statements made during this call and presentation that set forth expectations, predictions, projections or are about future events are based on facts and situations that are known to us as of today, February 23, 2016. We believe that our expectations and assumptions are reasonable. Actual results may differ materially, due to risks and uncertainties, such as those described on pages 7-15 of the 2014 Form 10-K filed on February 27, 2015, and other subsequent filings by Matson with the SEC. Statements made during this call and presentation are not guarantees of future performance. We do not undertake any obligation to update our forward-looking statements.
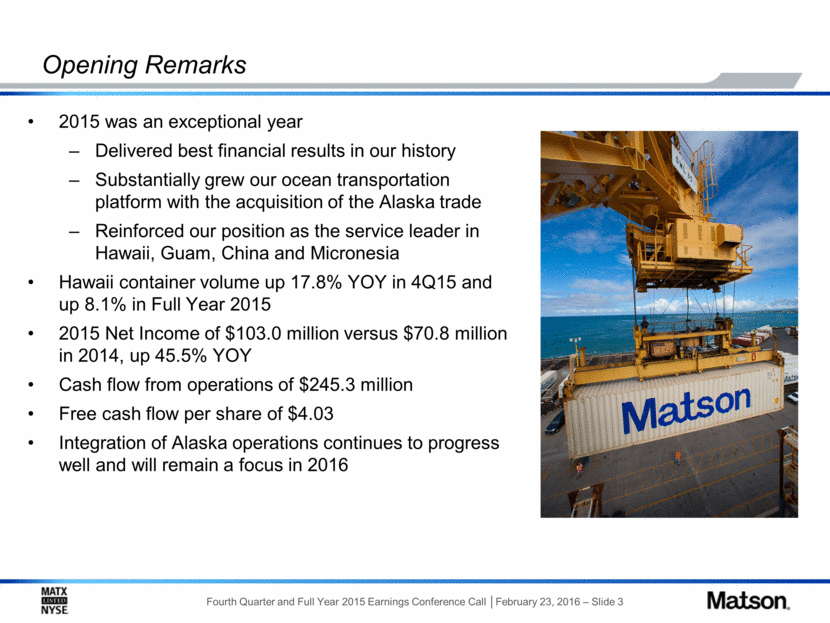
2015 was an exceptional year Delivered best financial results in our history Substantially grew our ocean transportation platform with the acquisition of the Alaska trade Reinforced our position as the service leader in Hawaii, Guam, China and Micronesia Hawaii container volume up 17.8% YOY in 4Q15 and up 8.1% in Full Year 2015 2015 Net Income of $103.0 million versus $70.8 million in 2014, up 45.5% YOY Cash flow from operations of $245.3 million Free cash flow per share of $4.03 Integration of Alaska operations continues to progress well and will remain a focus in 2016 Opening Remarks
EBITDA, EPS – 4Q 2015 4Q15 Net Income of $26.6 million versus 4Q14 Net Income of $27.8 million 4Q15 Net Income would have been $30.3 million excluding Acquisition related SG&A Impact of Acquisition related SG&A in excess of incremental run-rate target $82.5 $0.68 $6.1 $0.08 See the Addendum for a reconciliation of GAAP to non-GAAP for Financial Metrics
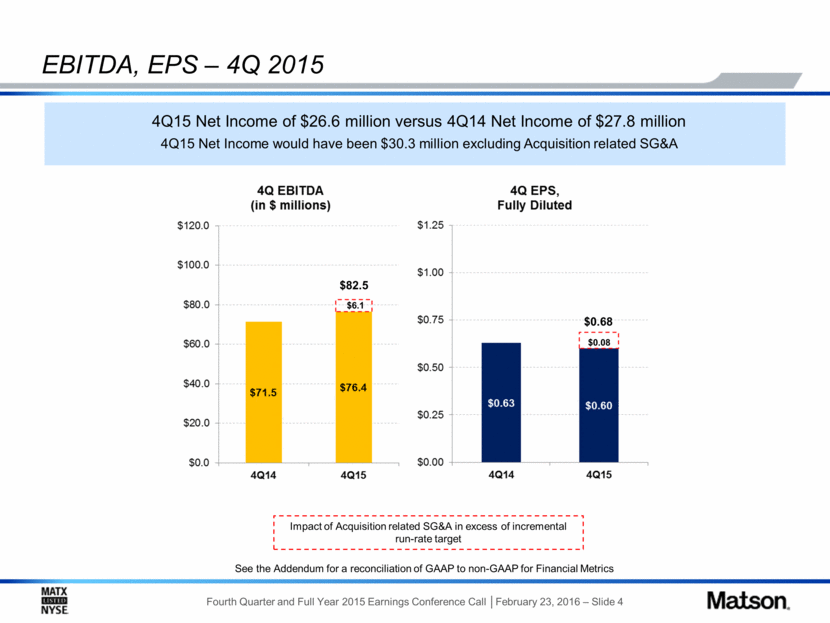
EBITDA, EPS , ROIC – Full Year 2015 2015 Net Income of $103.0 million versus 2014 Net Income of $70.8 million 2015 Net Income would have been $128.9 million excluding Acquisition related SG&A and Molasses Settlement $345.0 $2.93 $13.3 $29.6 $0.18 $0.41 Impact of Acquisition related SG&A in excess of incremental run-rate target Impact of costs related to Molasses Settlement See the Addendum for a reconciliation of GAAP to non-GAAP for Financial Metrics
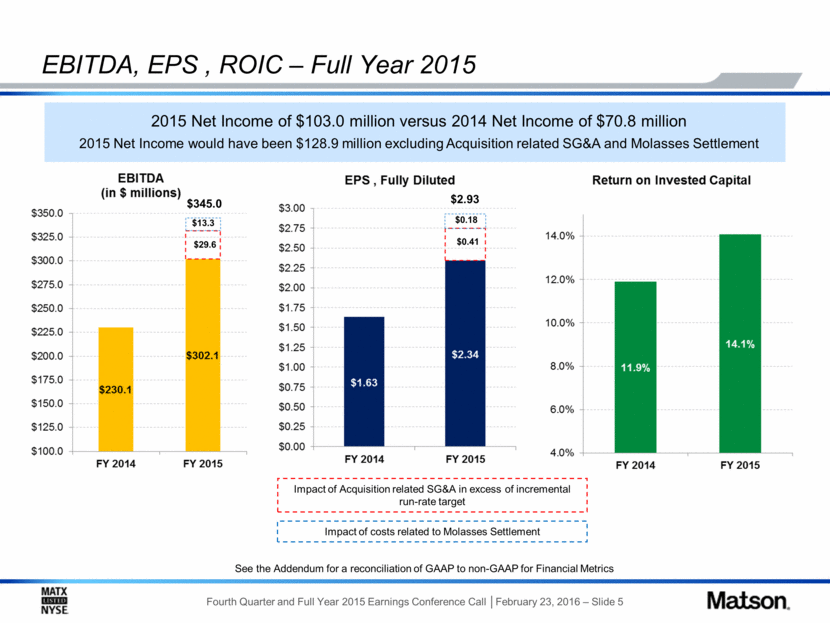
Hawaii Service Fourth Quarter Performance Modest westbound market growth 4Q15 volume up 17.8% YOY Deployed additional vessels in response to a competitor’s service reconfiguration 11 ships deployed for majority of 4Q15 2016 Outlook Modest market growth expected Hawaii economy remains healthy Expect continued progress of the construction cycle in urban Honolulu Expect moderate volume growth in 2016 Higher volume expected in 1H16 Expect volume growth to be challenged in 2H16
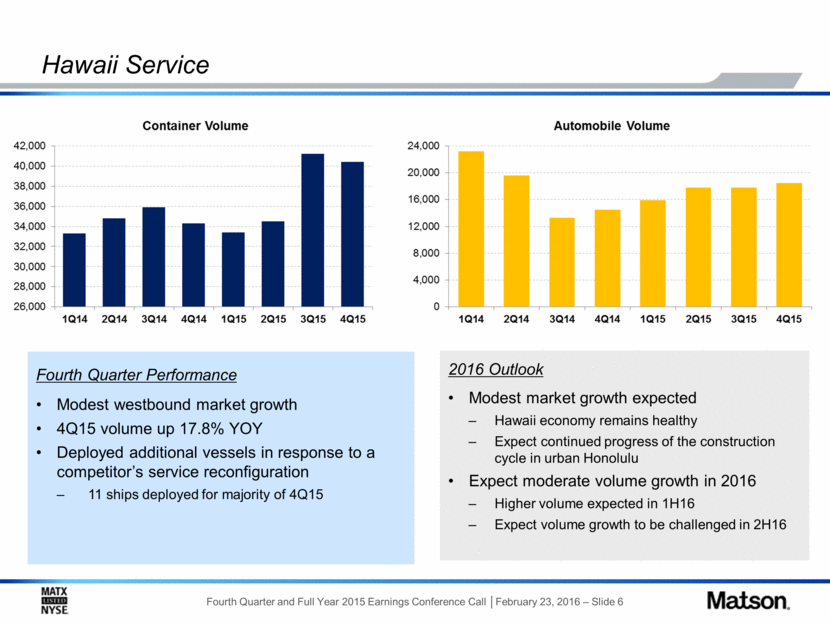
Hawaii Economic Indicators Indicator (% Change YOY) 2014 2015 2016F 2017F Real Gross Domestic Product 1.6 3.4 3.1 2.1 Visitor Arrivals 2.3 4.2 1.5 0.9 Construction Jobs 3.5 5.5 5.8 5.0 Unemployment Rate (%) 4.4 3.8 3.1 2.9 Residential Building Permits (9.8) 52.4 12.0 5.9 Non-Residential Building Permits 28.8 (0.9) 8.8 6.9 Sources: UHERO: University of Hawaii Economic Research Organization; ANNUAL HAWAII FORECAST, December 11, 2015, http://www.uhero.hawaii.edu Construction cycle continues to progress Permitting and job creation picked up considerably in 2015 Beginning to see increased activity on the Neighbor Islands Visitor industry strong in 2015, expect modest growth in arrivals for 2016 Healthy labor market with low unemployment
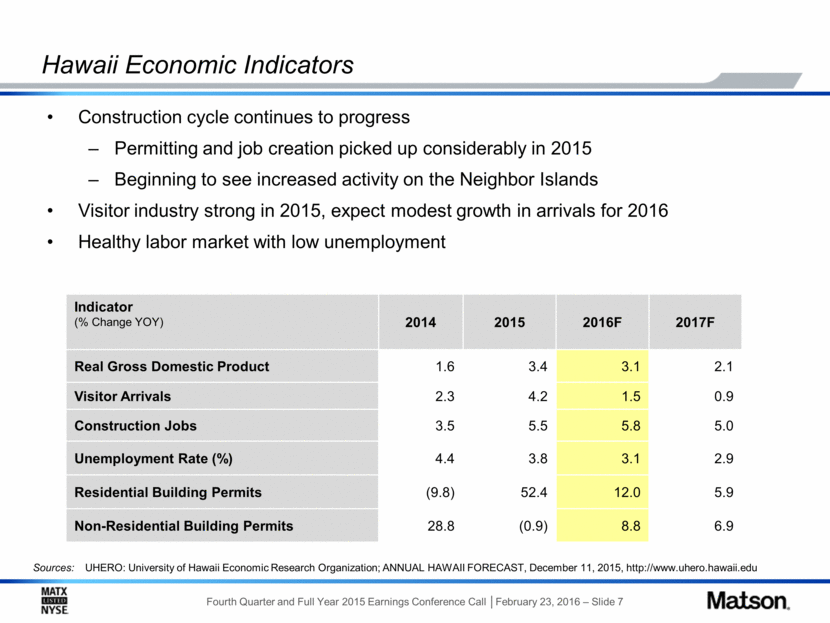
On October 1, 2015, construction commenced on Matson’s two 3,600 TEU “Aloha Class” vessels at Philly Shipyard Expected delivery dates: 3Q18 and 1Q19 Expected progress payments: 2016 $67.2 million, 2017 $159.1 million, 2018 $154.1 million, 2019 $8.4 million Expected benefits of new vessels Significantly lowers cost per TEU in Hawaii fleet Carry higher freight volumes with fewer vessels deployed Approximately 30% lower fuel consumption per TEU using conventional fuel oils Lower crewing, maintenance & repair, and dry-docking costs Currently evaluating ordering two additional new vessels to complete renewal of Hawaii fleet Hawaii Fleet Renewal Fleet Update First steel cut for Aloha Class vessels
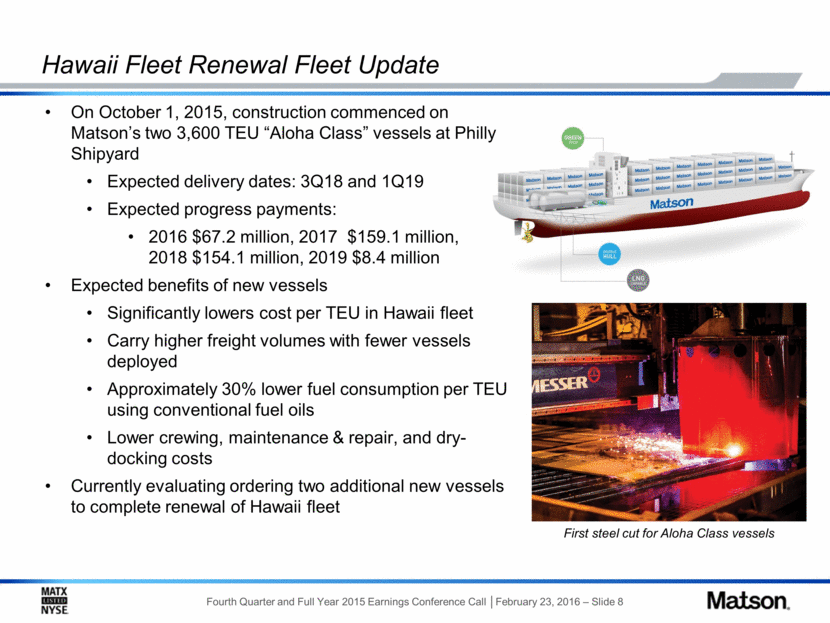
China Expedited Service (CLX) Source: Shanghai Shipping Exchange Fourth Quarter Performance International ocean freight rates, as represented by the SCFI, fell to historic lows As expected, 4Q15 volume was modestly lower One fewer sailing and absence of extraordinarily high demand experienced during the USWC labor disruption in 4Q14 Market softness 2016 Outlook Market overcapacity expected to continue Expect Matson’s expedited service to continue to realize a sizeable premium and maintain high vessel utilization Expect average freight rates significantly lower than 2015
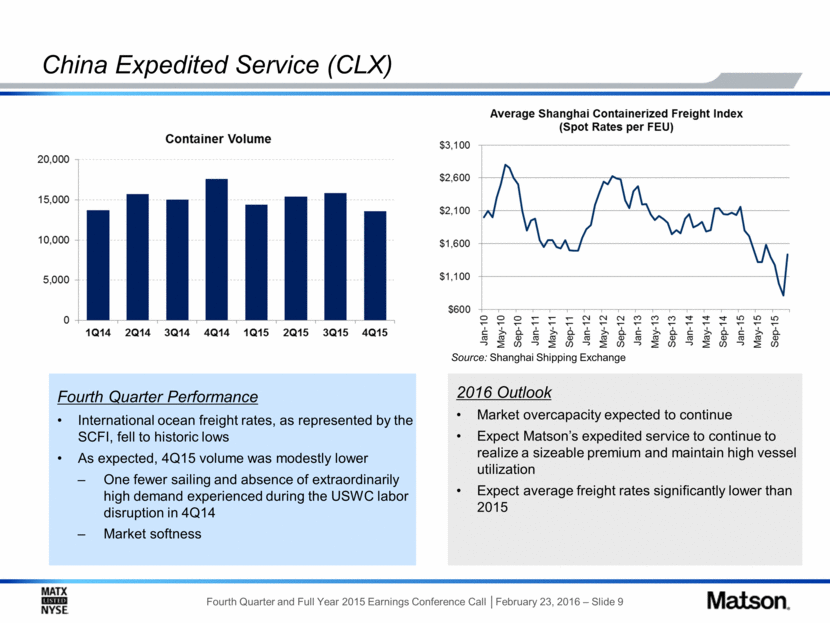
Guam Service 2016 Outlook Stable economic activity Competitor’s service launched at the beginning of January Competitive volume losses expected Fourth Quarter Performance Economic activity was steady Achieved modest volume growth The expected launch of competitor’s bi-weekly U.S. flagged containership service to Guam was delayed until early 2016
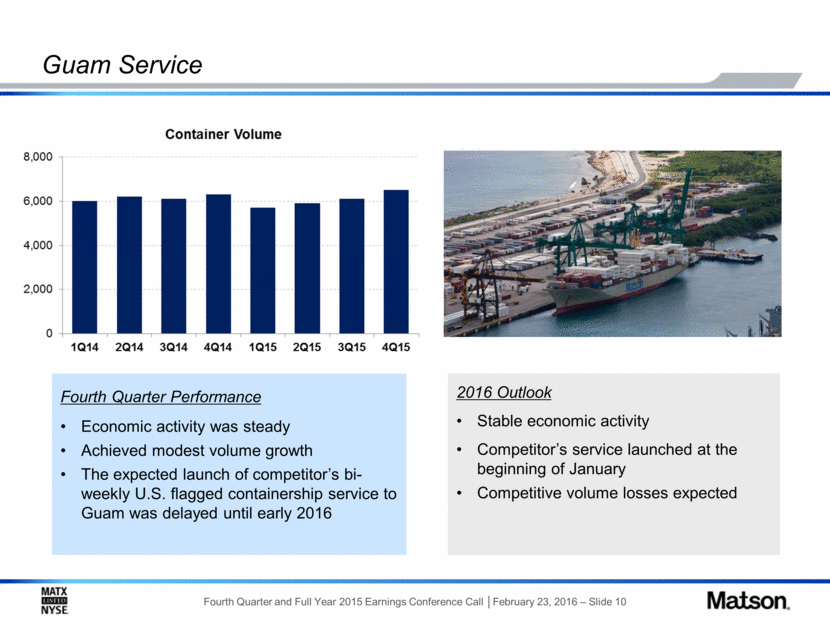
Alaska Service 2016 Outlook Economic headwinds expected Sustained low oil prices, lower state capital budget and spending State jobs and Anchorage population forecast to decline by 0.7 percent Annual container volume expected to be modestly lower than the 67,300 containers carried by Horizon and Matson in 2015 Fourth Quarter Performance As expected, 4Q15 volume was lower YOY compared to Horizon’s volume in 4Q14 One fewer sailing Lower slack season barge volume Muted economic activity Volume included in Matson’s results post-closing of Alaska Acquisition on May 29, 2015 Volume included in Horizon’s results
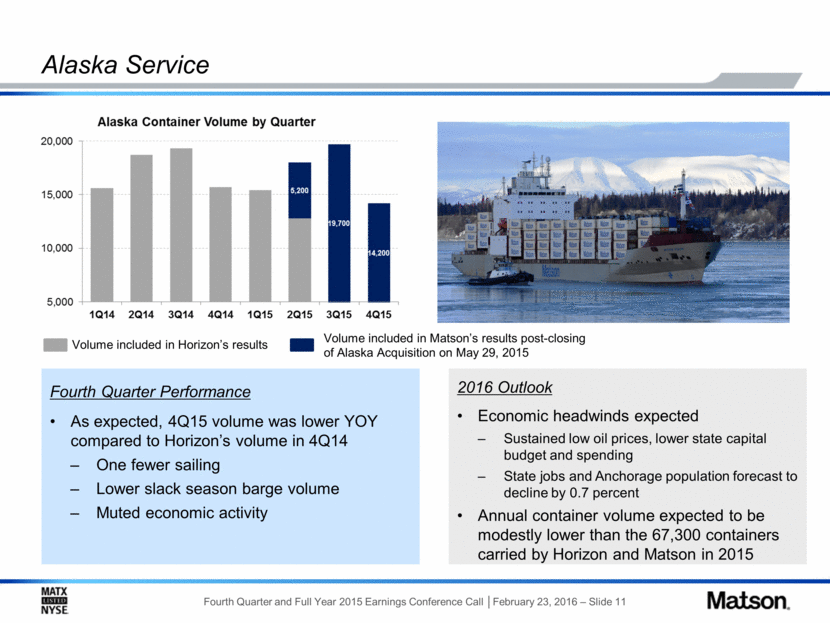
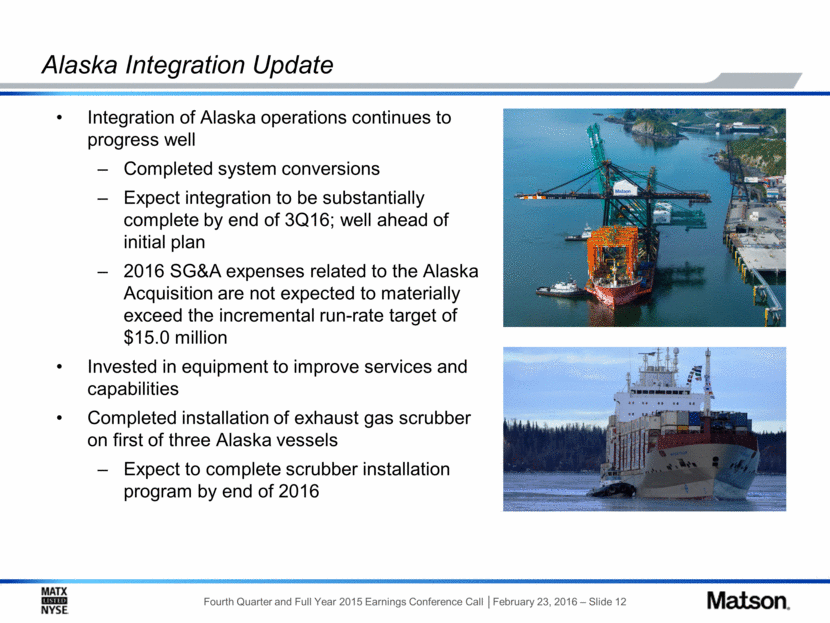
Integration of Alaska operations continues to progress well Completed system conversions Expect integration to be substantially complete by end of 3Q16; well ahead of initial plan 2016 SG&A expenses related to the Alaska Acquisition are not expected to materially exceed the incremental run-rate target of $15.0 million Invested in equipment to improve services and capabilities Completed installation of exhaust gas scrubber on first of three Alaska vessels Expect to complete scrubber installation program by end of 2016 Alaska Integration Update
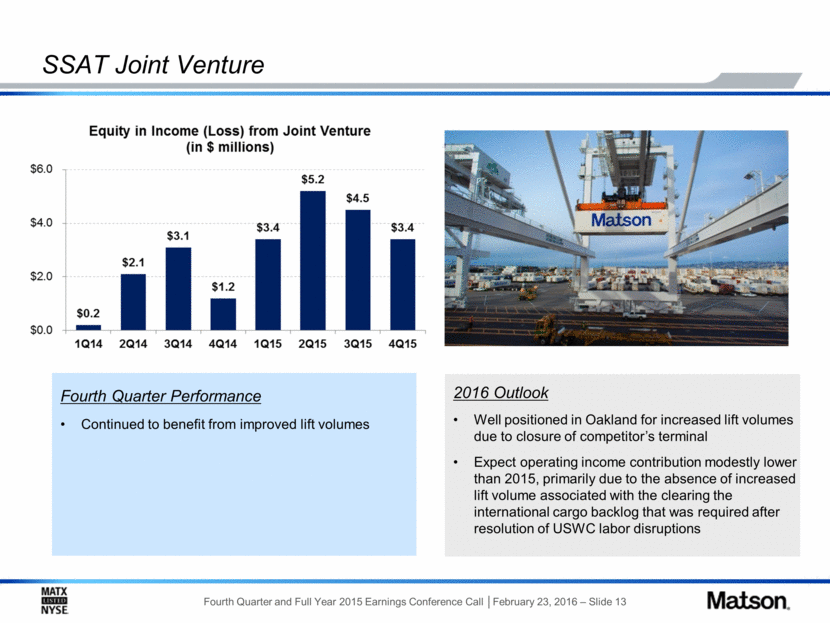
SSAT Joint Venture Fourth Quarter Performance Continued to benefit from improved lift volumes 2016 Outlook Well positioned in Oakland for increased lift volumes due to closure of competitor’s terminal Expect operating income contribution modestly lower than 2015, primarily due to the absence of increased lift volume associated with the clearing the international cargo backlog that was required after resolution of USWC labor disruptions
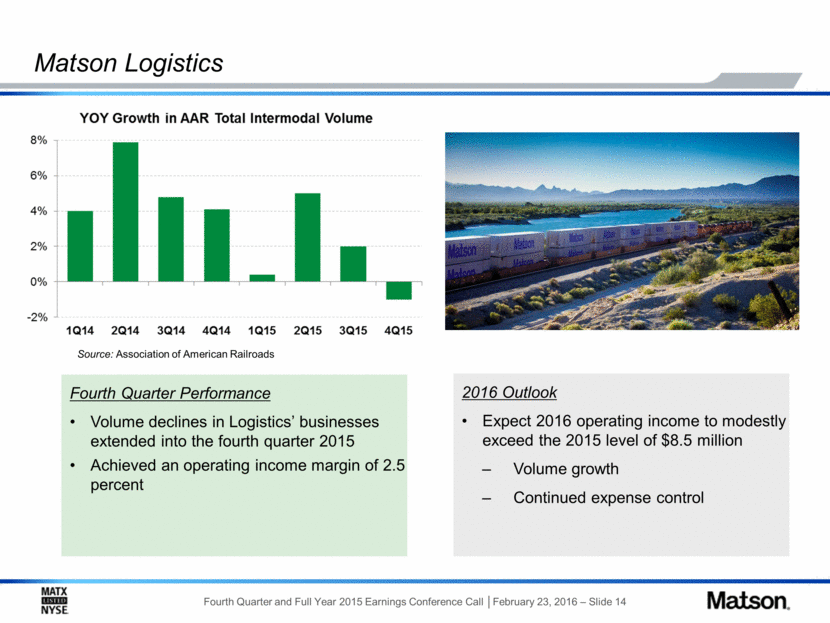
Matson Logistics Fourth Quarter Performance Volume declines in Logistics’ businesses extended into the fourth quarter 2015 Achieved an operating income margin of 2.5 percent Source: Association of American Railroads 2016 Outlook Expect 2016 operating income to modestly exceed the 2015 level of $8.5 million Volume growth Continued expense control
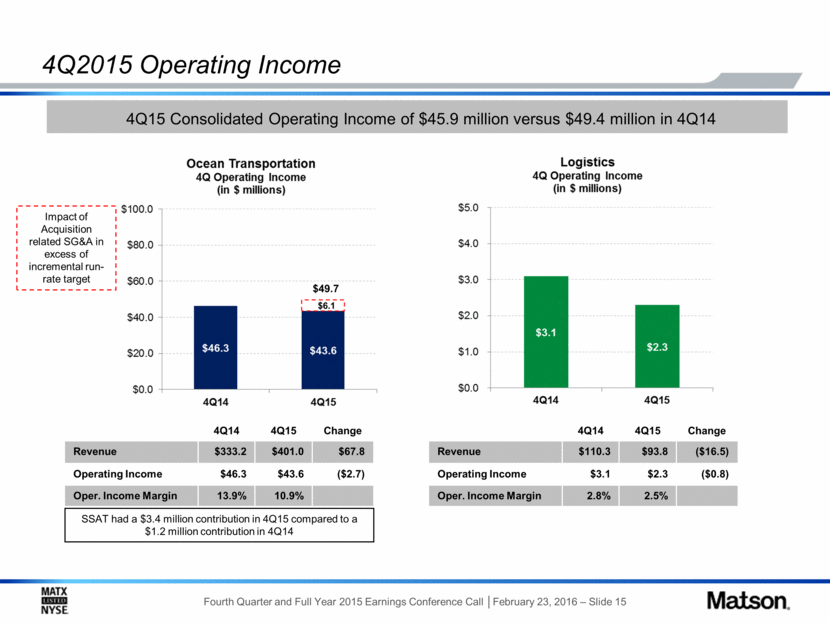
4Q2015 Operating Income SSAT had a $3.4 million contribution in 4Q15 compared to a $1.2 million contribution in 4Q14 4Q14 4Q15 Change Revenue $333.2 $401.0 $67.8 Operating Income $46.3 $43.6 ($2.7) Oper. Income Margin 13.9% 10.9% 4Q14 4Q15 Change Revenue $110.3 $93.8 ($16.5) Operating Income $3.1 $2.3 ($0.8) Oper. Income Margin 2.8% 2.5% 4Q15 Consolidated Operating Income of $45.9 million versus $49.4 million in 4Q14 $49.7 Impact of Acquisition related SG&A in excess of incremental run-rate target $6.1
Full Year 2015 Operating Income SSAT had a $16.5 million contribution in 2015 compared to a $6.6 million contribution in 2014 2014 2015 Change Revenue $1,278.4 $1,498.0 $219.6 Operating Income $131.1 $187.8 $56.7 Oper. Income Margin 10.3% 12.5% 2014 2015 Change Revenue $435.8 $386.9 ($48.9) Operating Income $8.9 $8.5 ($0.4) Oper. Income Margin 2.0% 2.2% 2015 Consolidated Operating Income of $196.3 million versus $140.0 million in 2014 Impact of Acquisition related SG&A in excess of incremental run-rate target Impact of costs related to Molasses Settlement $230.7 $13.3 $29.6
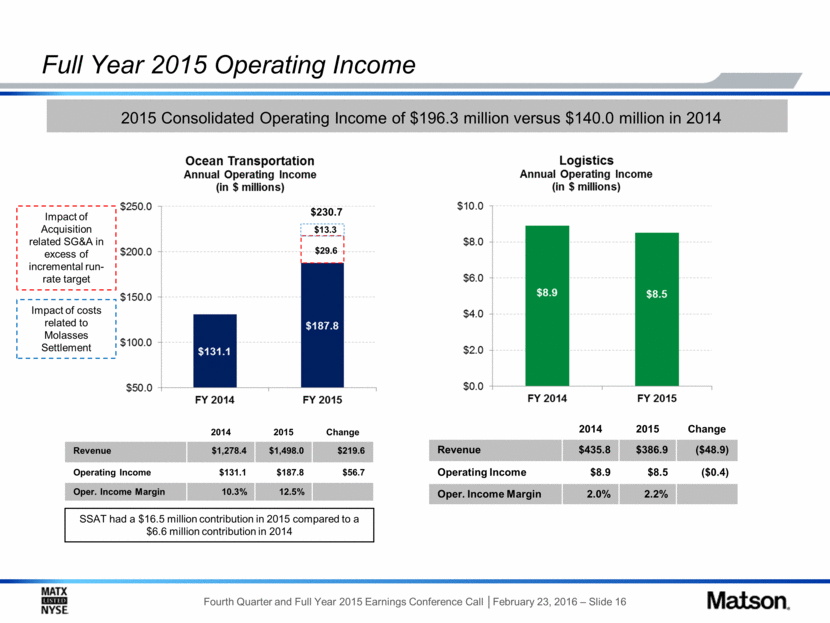
Condensed Balance Sheet Assets (in $ millions) 12/31/15 12/31/14 Cash and cash equivalents $ 25.5 $ 293.4 Other current assets 252.4 226.1 Total current assets 277.9 519.5 Investment in terminal joint venture 66.4 64.4 Property and equipment, net 860.3 691.2 Capital Construction Fund – cash on deposit - 27.5 Intangible assets, net 139.1 2.5 Goodwill 241.6 27.4 Other long-term assets 84.5 69.3 Total assets $1,669.8 $1,401.8 Liabilities & Shareholders’ Equity (in $ millions) 12/31/15 12/31/14 Current portion of debt $ 22.0 $ 21.6 Other current liabilities 275.6 201.9 Total current liabilities 297.6 223.5 Long-term debt 407.9 352.0 Deferred income taxes 310.5 308.4 Other long-term liabilities 203.2 154.1 Total long term liabilities 921.6 814.5 Shareholders’ equity 450.6 363.8 Total liabilities and shareholders’ equity $1,669.8 $1,401.8 Liquidity and Debt Levels Total debt of $429.9 million, Net debt of $404.4 million Net debt to LTM EBITDA of 1.3x On October 1, 2015 issued $75 million of 30-year senior unsecured notes at 3.92% See the Addendum for a reconciliation of GAAP to non-GAAP for Financial Metrics
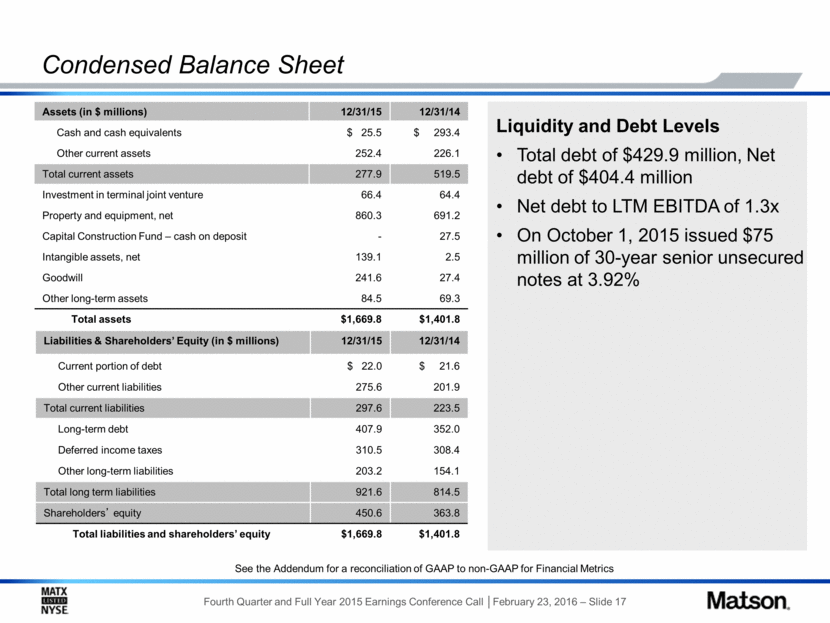
2015 Cash Generation and Uses of Cash Includes $27.5 million net CCF withdrawal; does not include $3.7 million in other uses of cash Based on total cash consideration (including common shares, warrants, repaid debt, accrued interest and breakage fees)
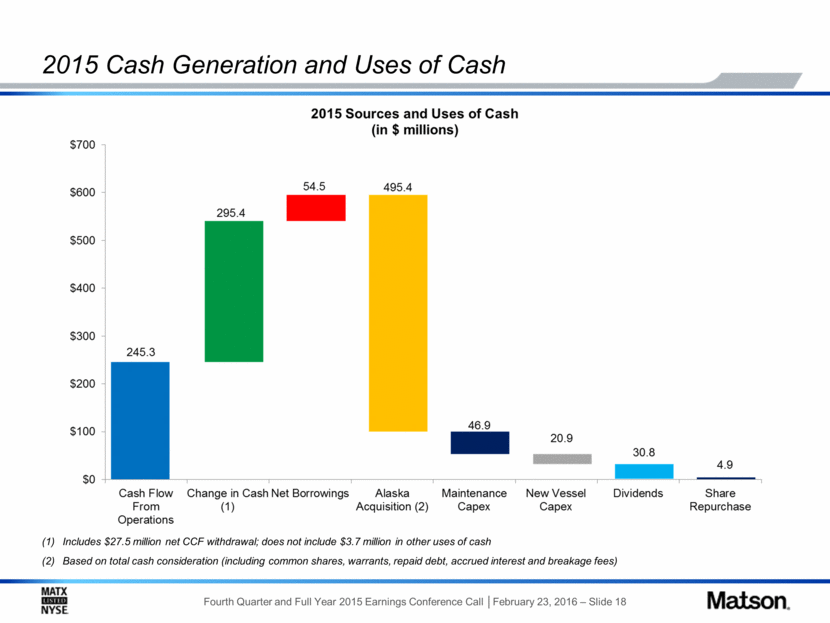
On November 4, announced Board authorization of share repurchase program for up to 3.0 million common shares over three years Since inception of repurchase program and as of February 22, 2016, Matson had repurchased a total 460,500 shares of common stock at an average price of $40.90 per share Matson continues to: View share repurchases as an important capital efficiency tool Expect a steady, measured pace for share repurchases Focus remains on cash flow generation and long-term shareholder value Share Repurchase Program
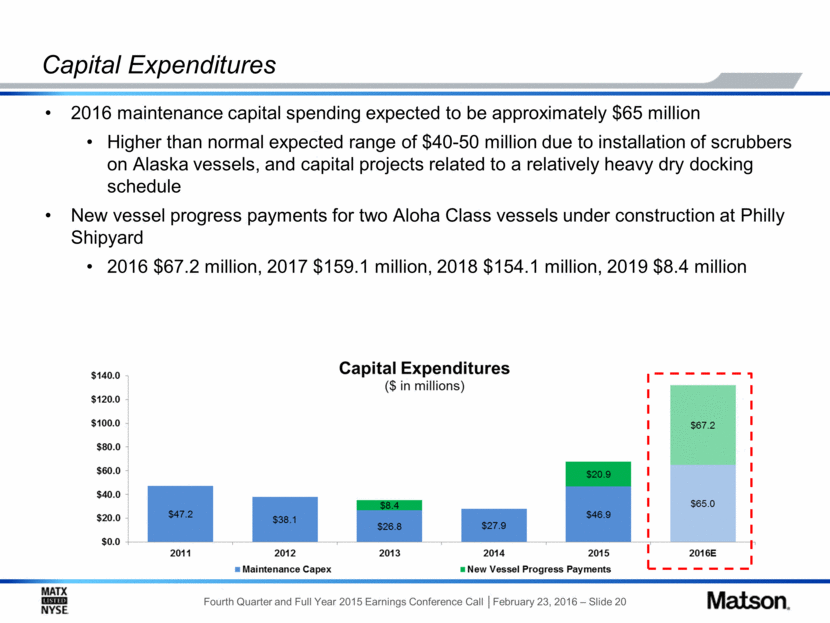
2016 maintenance capital spending expected to be approximately $65 million Higher than normal expected range of $40-50 million due to installation of scrubbers on Alaska vessels, and capital projects related to a relatively heavy dry docking schedule New vessel progress payments for two Aloha Class vessels under construction at Philly Shipyard 2016 $67.2 million, 2017 $159.1 million, 2018 $154.1 million, 2019 $8.4 million Capital Expenditures
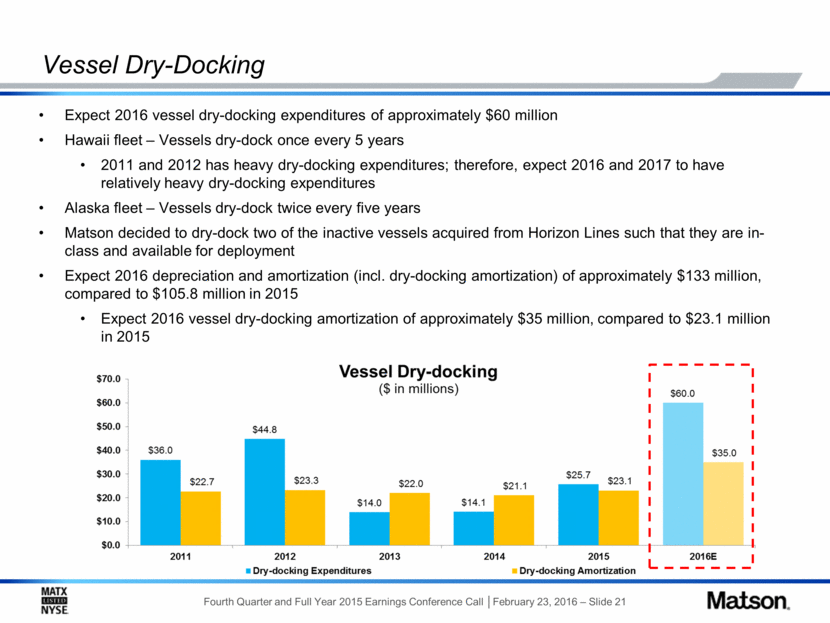
Expect 2016 vessel dry-docking expenditures of approximately $60 million Hawaii fleet – Vessels dry-dock once every 5 years 2011 and 2012 has heavy dry-docking expenditures; therefore, expect 2016 and 2017 to have relatively heavy dry-docking expenditures Alaska fleet – Vessels dry-dock twice every five years Matson decided to dry-dock two of the inactive vessels acquired from Horizon Lines such that they are in-class and available for deployment Expect 2016 depreciation and amortization (incl. dry-docking amortization) of approximately $133 million, compared to $105.8 million in 2015 Expect 2016 vessel dry-docking amortization of approximately $35 million, compared to $23.1 million in 2015 Vessel Dry-Docking
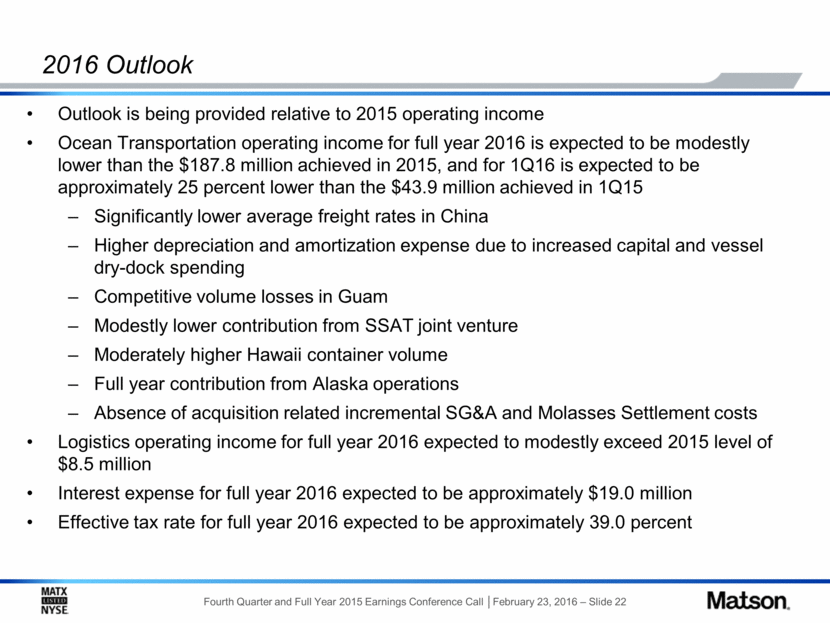
Outlook is being provided relative to 2015 operating income Ocean Transportation operating income for full year 2016 is expected to be modestly lower than the $187.8 million achieved in 2015, and for 1Q16 is expected to be approximately 25 percent lower than the $43.9 million achieved in 1Q15 Significantly lower average freight rates in China Higher depreciation and amortization expense due to increased capital and vessel dry-dock spending Competitive volume losses in Guam Modestly lower contribution from SSAT joint venture Moderately higher Hawaii container volume Full year contribution from Alaska operations Absence of acquisition related incremental SG&A and Molasses Settlement costs Logistics operating income for full year 2016 expected to modestly exceed 2015 level of $8.5 million Interest expense for full year 2016 expected to be approximately $19.0 million Effective tax rate for full year 2016 expected to be approximately 39.0 percent 2016 Outlook
Summary Remarks Hawaii Expect to benefit from continued market growth and a stronger market position Alaska Integration progressing well Low energy prices create near-term economic headwinds China International market continues to be chronically oversupplied with freight rates near historic lows Expect Matson’s highly differentiated service to continue achieving a substantial premium to international ocean freight rates Guam U.S. Marine relocation provides a longer-term positive container volume trend Expect to lose some volume to competitor that entered trade in January 2016 Overall, we continue to expect strong cash flow generation to support: Debt pay down Fleet and equipment investments Return of capital via quarterly dividend and share repurchase program
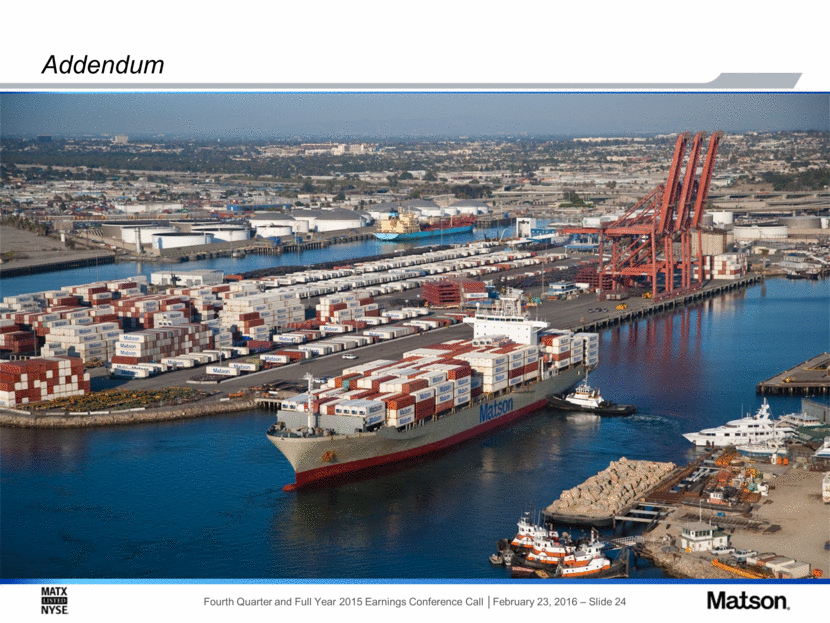
Addendum
Addendum – Use of Non-GAAP Measures Matson reports financial results in accordance with U.S. generally accepted accounting principles (“GAAP”). The Company also considers other non-GAAP measures to evaluate performance, make day-to-day operating decisions, help investors understand our ability to incur and service debt and to make capital expenditures, and to understand period-over-period operating results separate and apart from items that may, or could, have a disproportional positive or negative impact on results in any particular period. These non-GAAP measures include, but are not limited to, Earnings Before Interest, Depreciation and Amortization (“EBITDA”), Return on Invested Capital (“ROIC”), and Net Debt/EBITDA.
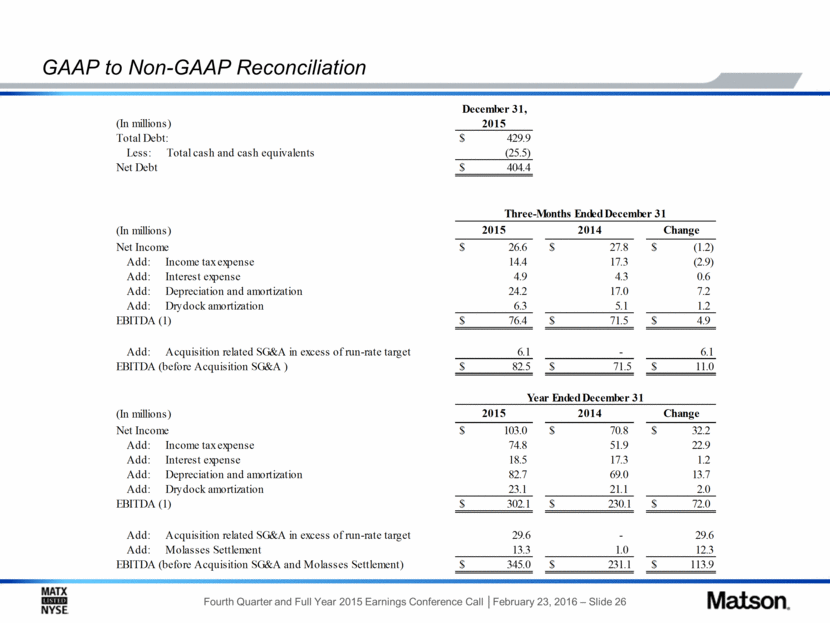
GAAP to Non-GAAP Reconciliation (In millions) Total Debt: $ 429.9 Less: Total cash and cash equivalents (25.5) Net Debt $ 404.4 (In millions) Net Income $ 26.6 $ 27.8 $ (1.2) Add: Income tax expense 14.4 17.3 (2.9) Add: Interest expense 4.9 4.3 0.6 Add: Depreciation and amortization 24.2 17.0 7.2 Add: Drydock amortization 6.3 5.1 1.2 EBITDA (1) $ 76.4 $ 71.5 $ 4.9 Add: Acquisition related SG&A in excess of run-rate target 6.1 - 6.1 EBITDA (before Acquisition SG&A ) $ 82.5 $ 71.5 $ 11.0 (In millions) Net Income $ 103.0 $ 70.8 $ 32.2 Add: Income tax expense 74.8 51.9 22.9 Add: Interest expense 18.5 17.3 1.2 Add: Depreciation and amortization 82.7 69.0 13.7 Add: Drydock amortization 23.1 21.1 2.0 EBITDA (1) $ 302.1 $ 230.1 $ 72.0 Add: Acquisition related SG&A in excess of run-rate target 29.6 - 29.6 Add: Molasses Settlement 13.3 1.0 12.3 EBITDA (before Acquisition SG&A and Molasses Settlement) $ 345.0 $ 231.1 $ 113.9 2015 2015 2014 December 31, 2015 Three-Months Ended December 31 Year Ended December 31 Change Change 2014
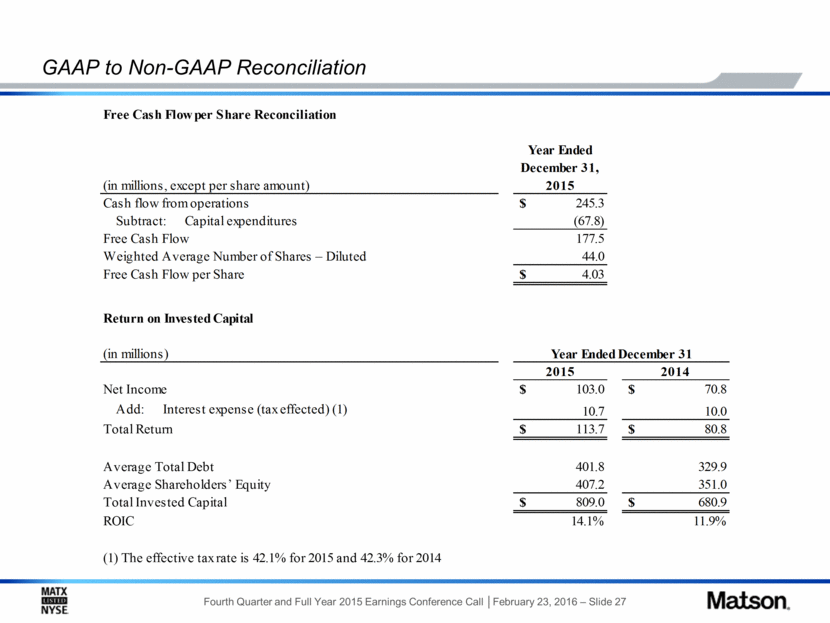
GAAP to Non-GAAP Reconciliation (in millions, except per share amount) Cash flow from operations $ 245.3 Subtract: Capital expenditures (67.8) Free Cash Flow 177.5 Weighted Average Number of Shares – Diluted 44.0 Free Cash Flow per Share $ 4.03 Return on Invested Capital (in millions) Net Income $ 103.0 $ 70.8 Add: Interest expense (tax effected) (1) 10.7 10.0 Total Return $ 113.7 $ 80.8 Average Total Debt 401.8 329.9 Average Shareholders’ Equity 407.2 351.0 Total Invested Capital $ 809.0 $ 680.9 ROIC 14.1% 11.9% (1) The effective tax rate is 42.1% for 2015 and 42.3% for 2014 2015 Free Cash Flow per Share Reconciliation Year Ended December 31, 2015 Year Ended December 31 2014
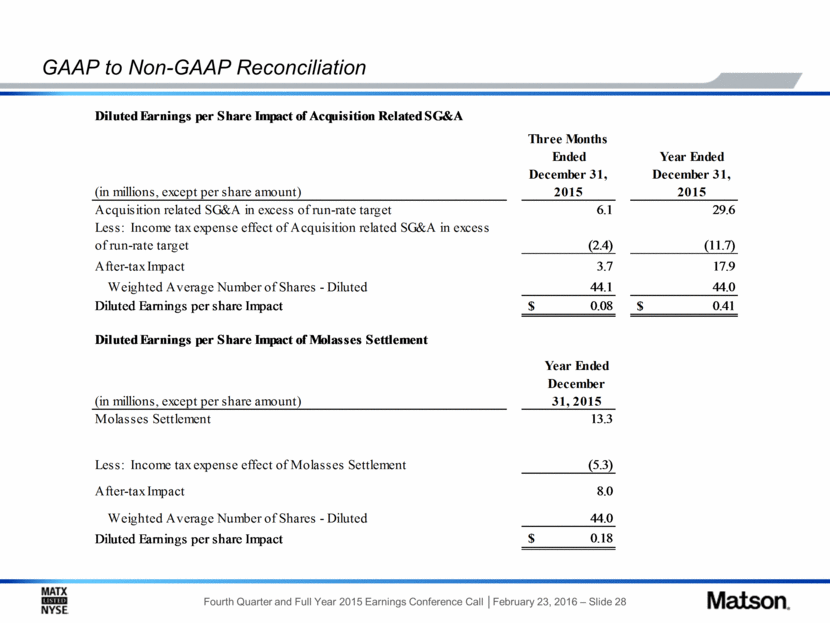
GAAP to Non-GAAP Reconciliation (in millions, except per share amount) Year Ended December 31, 2015 Acquisition related SG&A in excess of run-rate target 6.1 29.6 Less: Income tax expense effect of Acquisition related SG&A in excess of run-rate target (2.4) (11.7) After-tax Impact 3.7 17.9 Weighted Average Number of Shares - Diluted 44.1 44.0 Diluted Earnings per share Impact $ 0.08 $ 0.41 (in millions, except per share amount) Year Ended December 31, 2015 Molasses Settlement 13.3 Less: Income tax expense effect of Molasses Settlement (5.3) After-tax Impact 8.0 Weighted Average Number of Shares - Diluted 44.0 Diluted Earnings per share Impact $ 0.18 Three Months Ended December 31, 2015 Diluted Earnings per Share Impact of Acquisition Related SG&A Diluted Earnings per Share Impact of Molasses Settlement
