Attached files
| file | filename |
|---|---|
| 8-K - FORM 8-K 02/23/2016 - KITE REALTY GROUP TRUST | form8k_02232016.htm |
INVESTOR UPDATE February 2016 Chapel Hill (Dallas, TX) Livingston Center (Livingston, NJ)
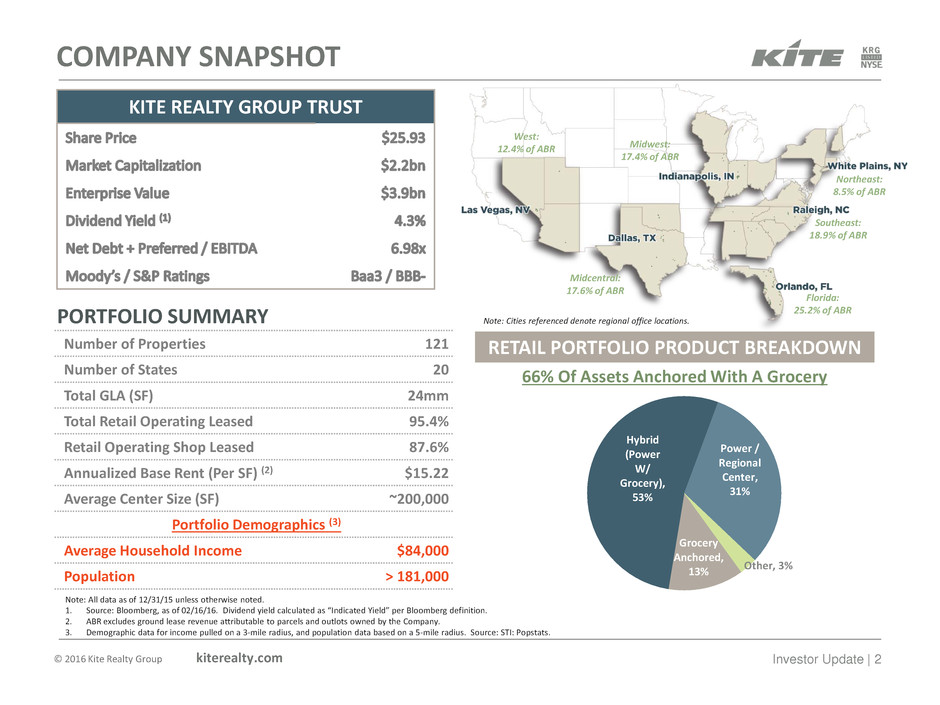
© 2016 Kite Realty Group kiterealty.com Investor Update | 2 COMPANY SNAPSHOT KITE REALTY GROUP TRUST Note: All data as of 12/31/15 unless otherwise noted. 1. Source: Bloomberg, as of 02/16/16. Dividend yield calculated as “Indicated Yield” per Bloomberg definition. 2. ABR excludes ground lease revenue attributable to parcels and outlots owned by the Company. 3. Demographic data for income pulled on a 3-mile radius, and population data based on a 5-mile radius. Source: STI: Popstats. Note: Cities referenced denote regional office locations. Number of Properties 121 Number of States 20 Total GLA (SF) 24mm Total Retail Operating Leased 95.4% Retail Operating Shop Leased 87.6% Annualized Base Rent (Per SF) (2) $15.22 Average Center Size (SF) ~200,000 Portfolio Demographics (3) Average Household Income $84,000 Population > 181,000 PORTFOLIO SUMMARY RETAIL PORTFOLIO PRODUCT BREAKDOWN 66% Of Assets Anchored With A Grocery Grocery Anchored, 13% Hybrid (Power W/ Grocery), 53% Power / Regional Center, 31% Other, 3% Northeast: 8.5% of ABR Southeast: 18.9% of ABR Florida: 25.2% of ABR Midwest: 17.4% of ABR Midcentral: 17.6% of ABR West: 12.4% of ABR
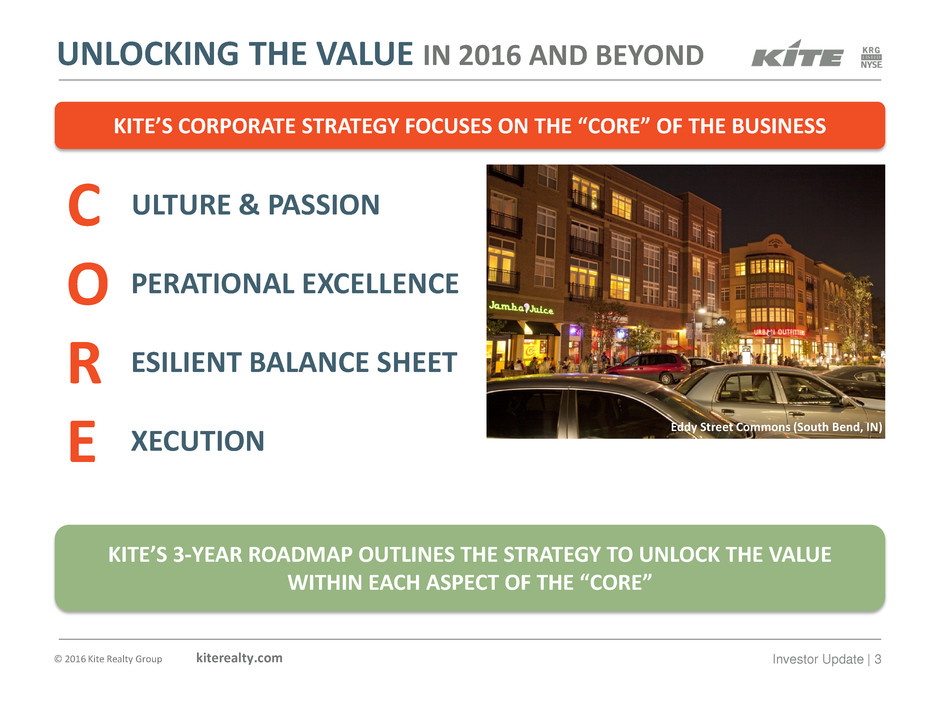
© 2016 Kite Realty Group kiterealty.com Investor Update | 3 UNLOCKING THE VALUE IN 2016 AND BEYOND KITE’S CORPORATE STRATEGY FOCUSES ON THE “CORE” OF THE BUSINESS C ULTURE & PASSION O PERATIONAL EXCELLENCE R ESILIENT BALANCE SHEET E XECUTION KITE’S 3-YEAR ROADMAP OUTLINES THE STRATEGY TO UNLOCK THE VALUE WITHIN EACH ASPECT OF THE “CORE” Eddy Street Commons (South Bend, IN)
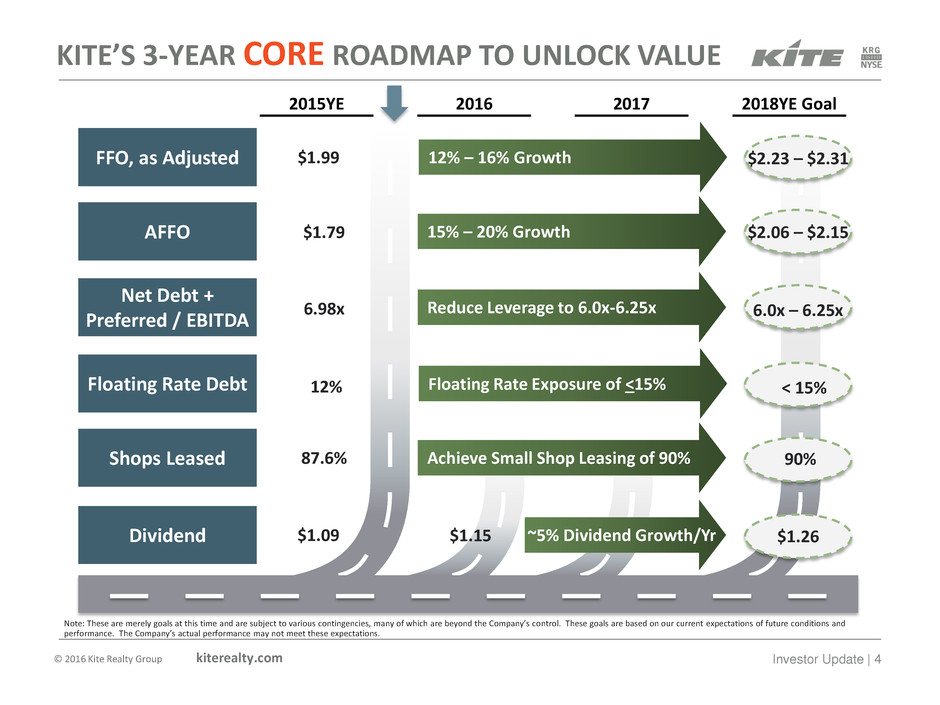
© 2016 Kite Realty Group kiterealty.com Investor Update | 4 KITE’S 3-YEAR CORE ROADMAP TO UNLOCK VALUE FFO, as Adjusted AFFO Net Debt + Preferred / EBITDA Floating Rate Debt Shops Leased Dividend 2017 2018YE Goal 2015YE 2016 $1.99 6.98x 12% 87.6% $1.79 12% – 16% Growth 15% – 20% Growth ~5% Dividend Growth/Yr $1.09 Achieve Small Shop Leasing of 90% Floating Rate Exposure of <15% Reduce Leverage to 6.0x-6.25x 6.0x – 6.25x < 15% 90% $2.23 – $2.31 $1.26 $2.06 – $2.15 $1.15 Note: These are merely goals at this time and are subject to various contingencies, many of which are beyond the Company’s control. These goals are based on our current expectations of future conditions and performance. The Company’s actual performance may not meet these expectations.

CULTURE & PASSION
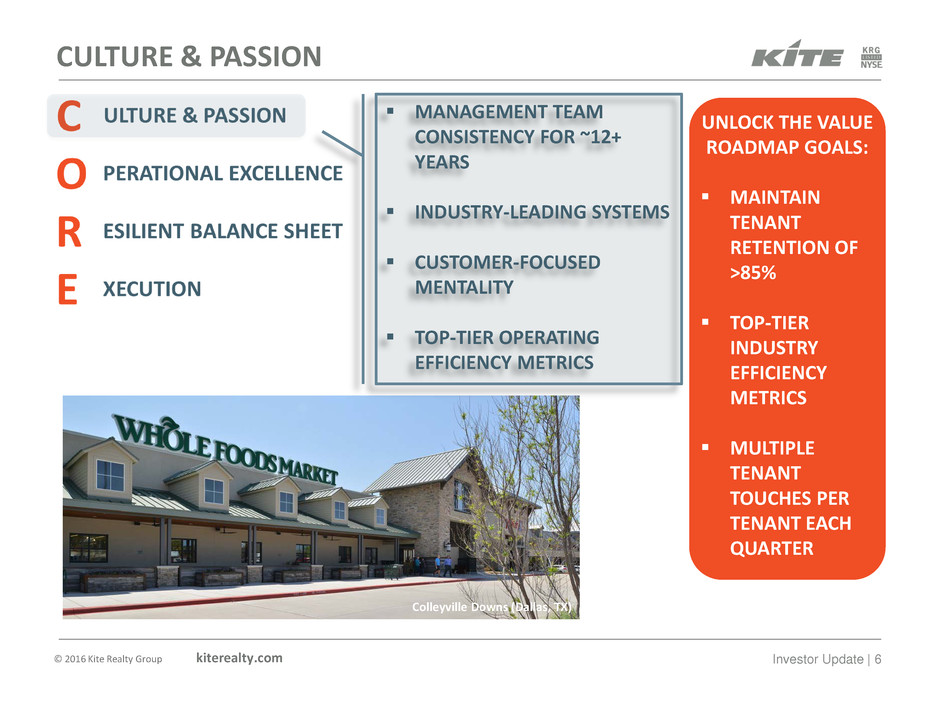
© 2016 Kite Realty Group kiterealty.com Investor Update | 6 MANAGEMENT TEAM CONSISTENCY FOR ~12+ YEARS INDUSTRY-LEADING SYSTEMS CUSTOMER-FOCUSED MENTALITY TOP-TIER OPERATING EFFICIENCY METRICS CULTURE & PASSION UNLOCK THE VALUE ROADMAP GOALS: MAINTAIN TENANT RETENTION OF >85% TOP-TIER INDUSTRY EFFICIENCY METRICS MULTIPLE TENANT TOUCHES PER TENANT EACH QUARTER Colleyville Downs (Dallas, TX)
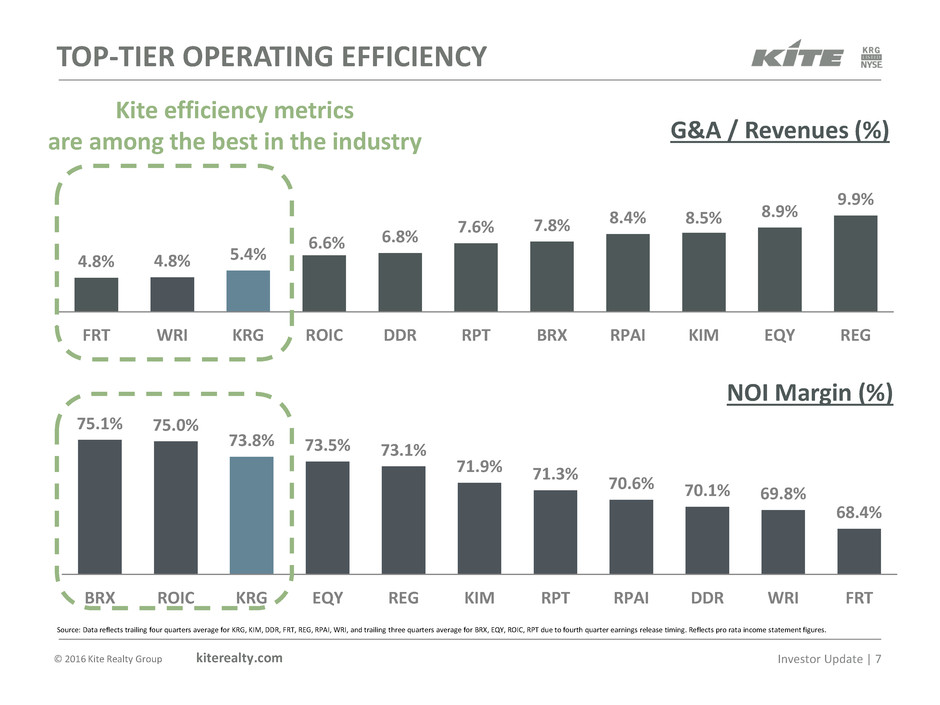
© 2016 Kite Realty Group kiterealty.com Investor Update | 7 TOP-TIER OPERATING EFFICIENCY 4.8% 4.8% 5.4% 6.6% 6.8% 7.6% 7.8% 8.4% 8.5% 8.9% 9.9% FRT WRI KRG ROIC DDR RPT BRX RPAI KIM EQY REG G&A / Revenues (%) 75.1% 75.0% 73.8% 73.5% 73.1% 71.9% 71.3% 70.6% 70.1% 69.8% 68.4% BRX ROIC KRG EQY REG KIM RPT RPAI DDR WRI FRT NOI Margin (%) Kite efficiency metrics are among the best in the industry Source: Data reflects trailing four quarters average for KRG, KIM, DDR, FRT, REG, RPAI, WRI, and trailing three quarters average for BRX, EQY, ROIC, RPT due to fourth quarter earnings release timing. Reflects pro rata income statement figures.
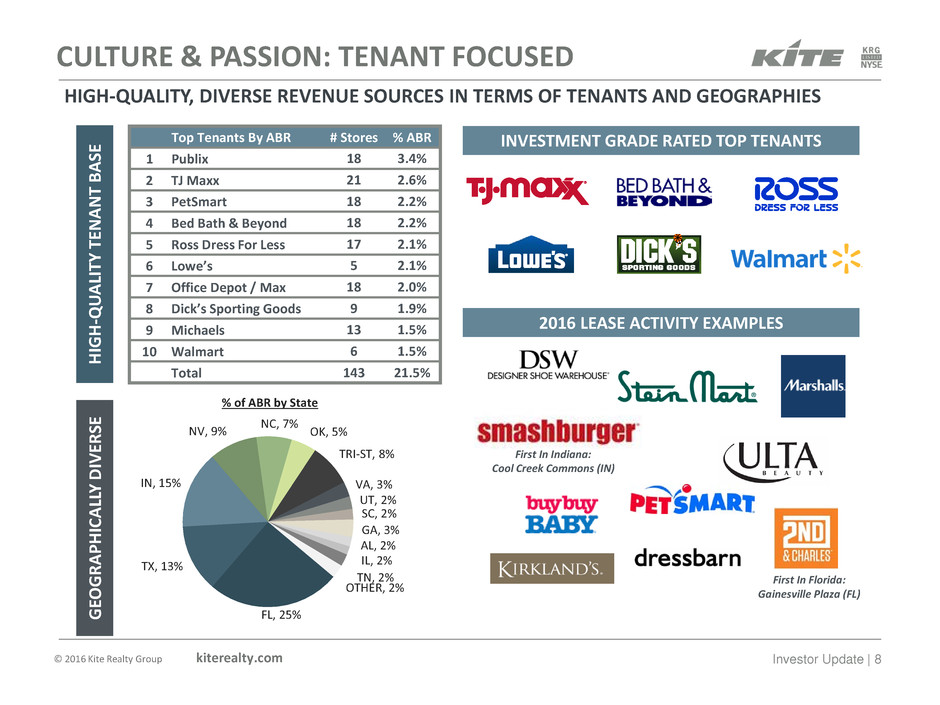
© 2016 Kite Realty Group kiterealty.com Investor Update | 8 CULTURE & PASSION: TENANT FOCUSED Top Tenants By ABR # Stores % ABR 1 Publix 18 3.4% 2 TJ Maxx 21 2.6% 3 PetSmart 18 2.2% 4 Bed Bath & Beyond 18 2.2% 5 Ross Dress For Less 17 2.1% 6 Lowe’s 5 2.1% 7 Office Depot / Max 18 2.0% 8 Dick’s Sporting Goods 9 1.9% 9 Michaels 13 1.5% 10 Walmart 6 1.5% Total 143 21.5% H IG H -Q U A LI TY T EN A N T B A SE INVESTMENT GRADE RATED TOP TENANTS FL, 25% TX, 13% IN, 15% NV, 9% NC, 7% OK, 5% TRI-ST, 8% VA, 3% UT, 2% SC, 2% GA, 3% AL, 2% IL, 2% TN, 2% OTHER, 2% G EO G R A PH IC A LL Y D IV ER SE 2016 LEASE ACTIVITY EXAMPLES First In Indiana: Cool Creek Commons (IN) First In Florida: Gainesville Plaza (FL) HIGH-QUALITY, DIVERSE REVENUE SOURCES IN TERMS OF TENANTS AND GEOGRAPHIES % of ABR by State

OPERATIONAL EXCELLENCE
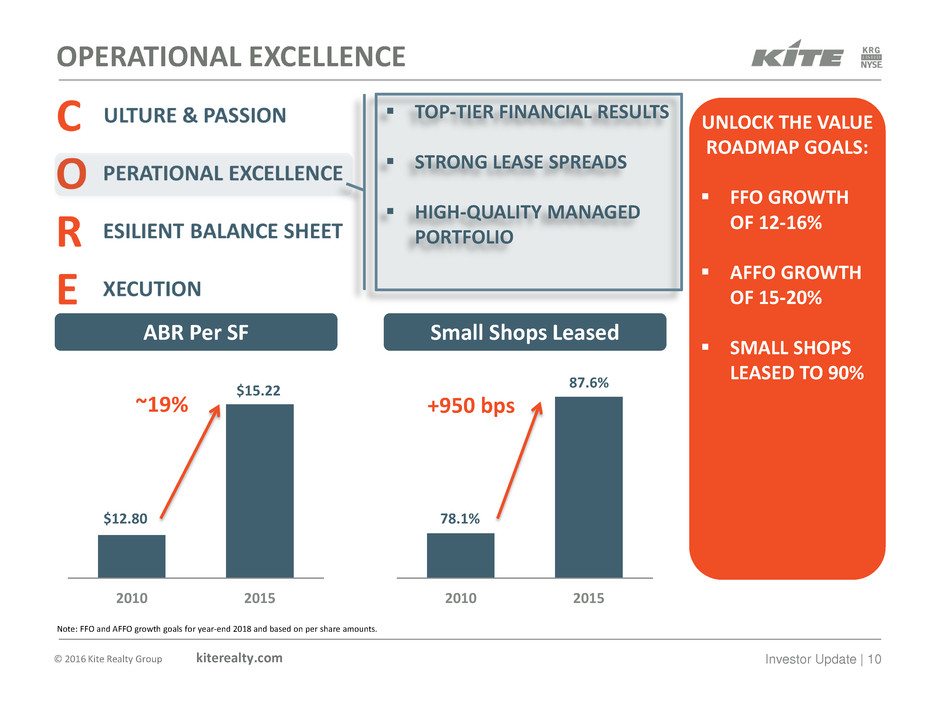
© 2016 Kite Realty Group kiterealty.com Investor Update | 10 TOP-TIER FINANCIAL RESULTS STRONG LEASE SPREADS HIGH-QUALITY MANAGED PORTFOLIO OPERATIONAL EXCELLENCE 2010 2015 ABR Per SF UNLOCK THE VALUE ROADMAP GOALS: FFO GROWTH OF 12-16% AFFO GROWTH OF 15-20% SMALL SHOPS LEASED TO 90% $12.80 $15.22 ~19% 2010 2015 Small Shops Leased 78.1% 87.6% +950 bps Note: FFO and AFFO growth goals for year-end 2018 and based on per share amounts.
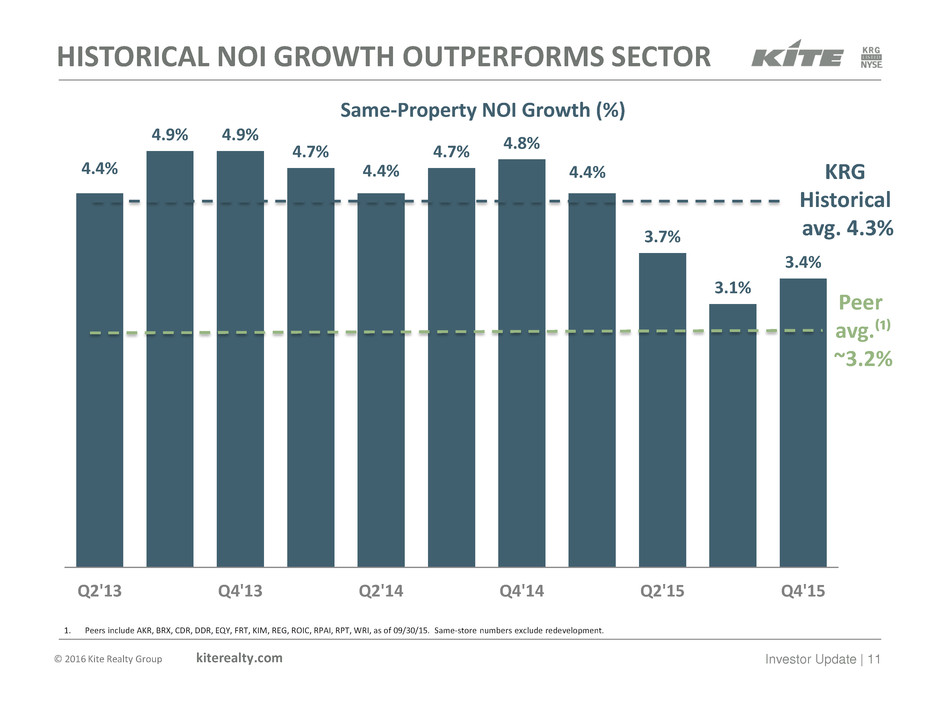
© 2016 Kite Realty Group kiterealty.com Investor Update | 11 HISTORICAL NOI GROWTH OUTPERFORMS SECTOR 4.4% 4.9% 4.9% 4.7% 4.4% 4.7% 4.8% 4.4% 3.7% 3.1% 3.4% Q2'13 Q4'13 Q2'14 Q4'14 Q2'15 Q4'15 Same-Property NOI Growth (%) KRG Historical avg. 4.3% Peer avg.⁽¹⁾ ~3.2% 1. Peers include AKR, BRX, CDR, DDR, EQY, FRT, KIM, REG, ROIC, RPAI, RPT, WRI, as of 09/30/15. Same-store numbers exclude redevelopment.
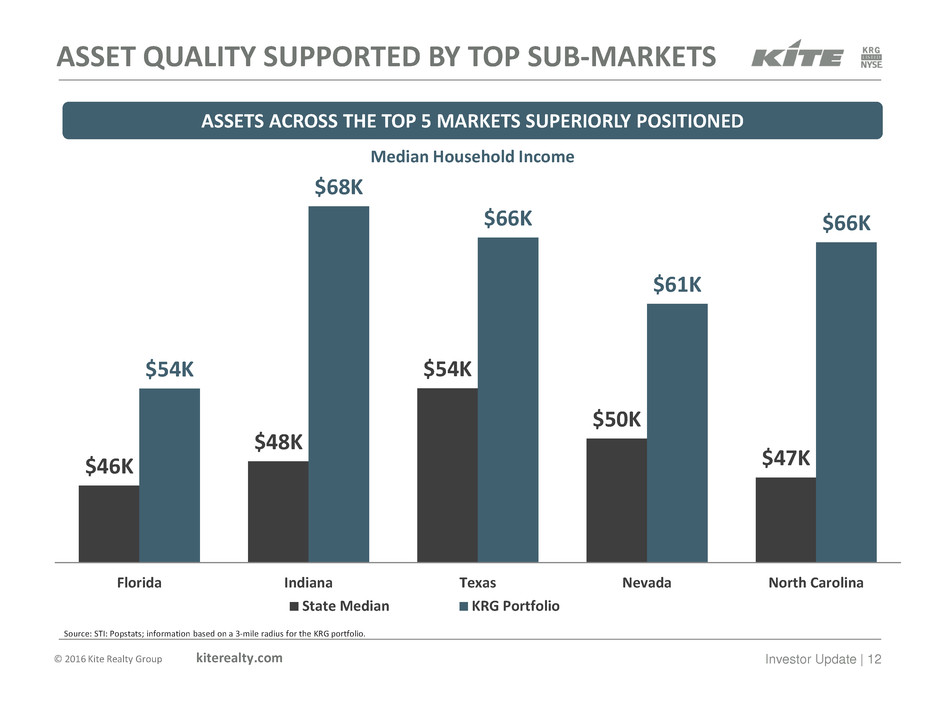
© 2016 Kite Realty Group kiterealty.com Investor Update | 12 ASSET QUALITY SUPPORTED BY TOP SUB-MARKETS ASSETS ACROSS THE TOP 5 MARKETS SUPERIORLY POSITIONED $46K $48K $54K $50K $47K $54K $68K $66K $61K $66K Florida Indiana Texas Nevada North Carolina State Median KRG Portfolio Median Household Income Source: STI: Popstats; information based on a 3-mile radius for the KRG portfolio.

RESILIENT BALANCE SHEET
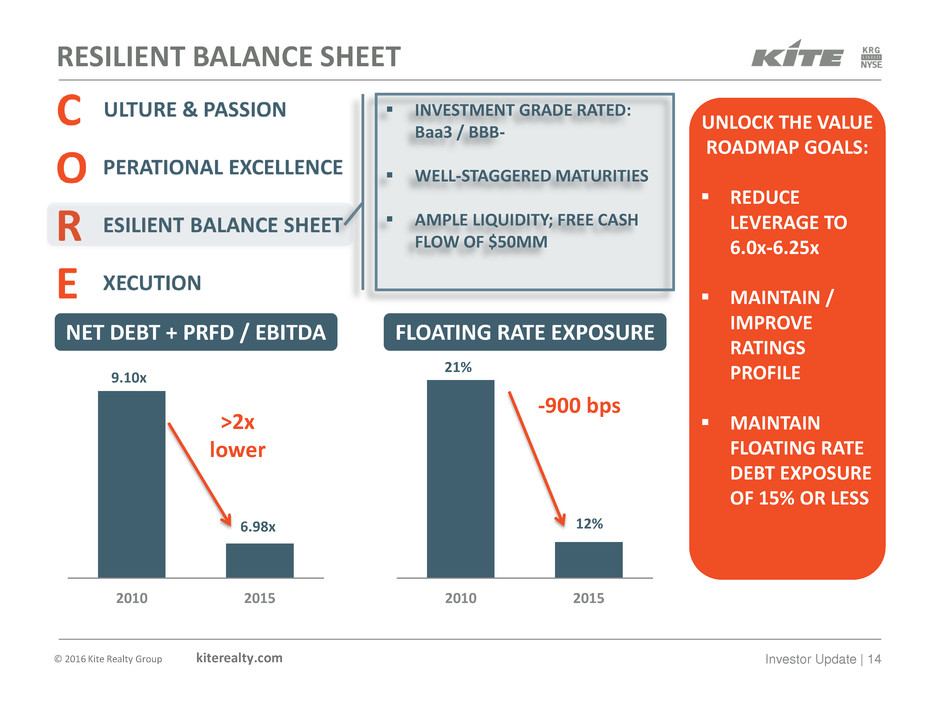
© 2016 Kite Realty Group kiterealty.com Investor Update | 14 INVESTMENT GRADE RATED: Baa3 / BBB- WELL-STAGGERED MATURITIES AMPLE LIQUIDITY; FREE CASH FLOW OF $50MM RESILIENT BALANCE SHEET UNLOCK THE VALUE ROADMAP GOALS: REDUCE LEVERAGE TO 6.0x-6.25x MAINTAIN / IMPROVE RATINGS PROFILE MAINTAIN FLOATING RATE DEBT EXPOSURE OF 15% OR LESS 2010 2015 NET DEBT + PRFD / EBITDA 9.10x 6.98x >2x lower 2010 2015 FLOATING RATE EXPOSURE -900 bps 21% 12%
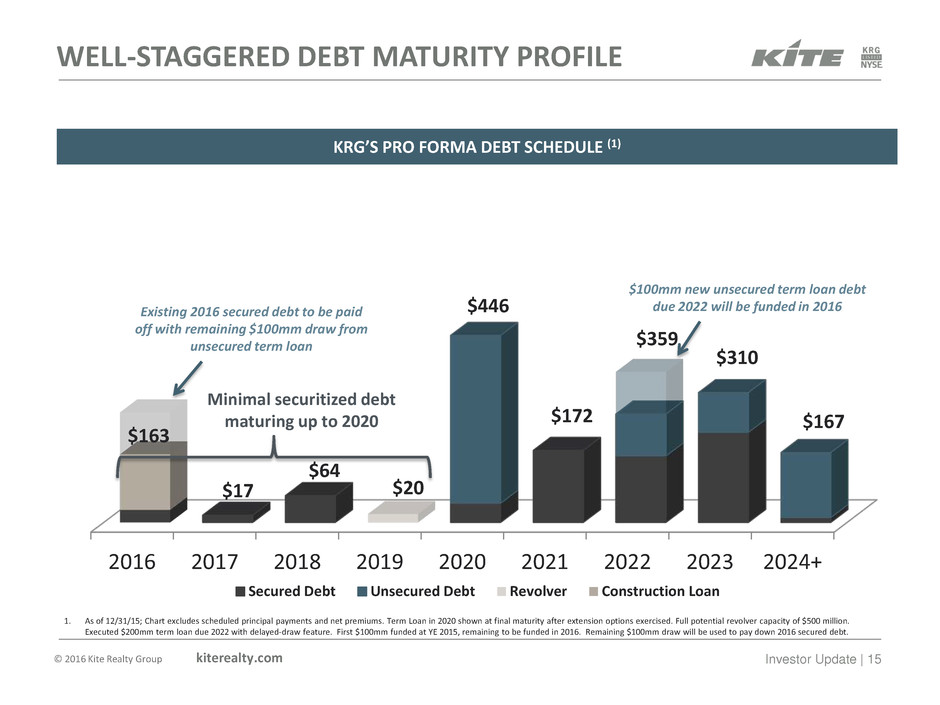
© 2016 Kite Realty Group kiterealty.com Investor Update | 15 2016 2017 2018 2019 2020 2021 2022 2023 2024+ $163 $17 $64 $20 $446 $172 $359 $310 $167 Secured Debt Unsecured Debt Revolver Construction Loan $100mm new unsecured term loan debt due 2022 will be funded in 2016 Existing 2016 secured debt to be paid off with remaining $100mm draw from unsecured term loan WELL-STAGGERED DEBT MATURITY PROFILE 1. As of 12/31/15; Chart excludes scheduled principal payments and net premiums. Term Loan in 2020 shown at final maturity after extension options exercised. Full potential revolver capacity of $500 million. Executed $200mm term loan due 2022 with delayed-draw feature. First $100mm funded at YE 2015, remaining to be funded in 2016. Remaining $100mm draw will be used to pay down 2016 secured debt. KRG’S PRO FORMA DEBT SCHEDULE (1) Minimal securitized debt maturing up to 2020
EXECUTION
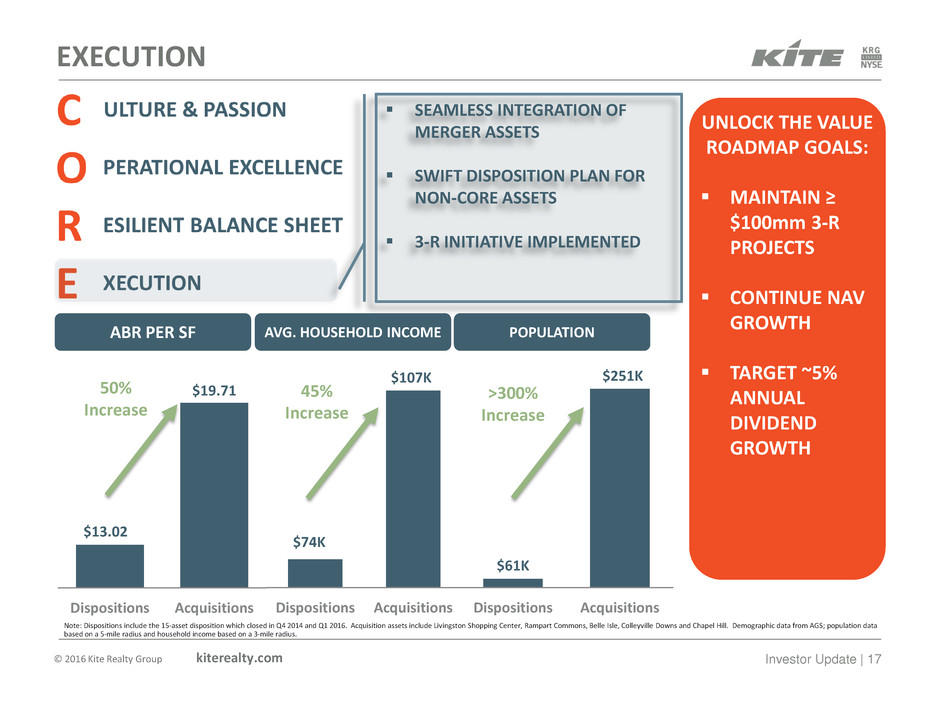
© 2016 Kite Realty Group kiterealty.com Investor Update | 17 SEAMLESS INTEGRATION OF MERGER ASSETS SWIFT DISPOSITION PLAN FOR NON-CORE ASSETS 3-R INITIATIVE IMPLEMENTED EXECUTION ABR PER SF AVG. HOUSEHOLD INCOME POPULATION UNLOCK THE VALUE ROADMAP GOALS: MAINTAIN ≥ $100mm 3-R PROJECTS CONTINUE NAV GROWTH TARGET ~5% ANNUAL DIVIDEND GROWTH Dispositions Acquisitions Dispositions AcquisitionsDispositions Acquisitions $13.02 $19.71 $74K $107K $61K $251K 50% Increase 45% Increase >300% Increase Note: Dispositions include the 15-asset disposition which closed in Q4 2014 and Q1 2016. Acquisition assets include Livingston Shopping Center, Rampart Commons, Belle Isle, Colleyville Downs and Chapel Hill. Demographic data from AGS; population data based on a 5-mile radius and household income based on a 3-mile radius.

© 2016 Kite Realty Group kiterealty.com Investor Update | 18 THE 3-R INITIATIVE DRIVES NAV AND FFO GROWTH THE 3 RS: REDEVELOPMENT, REPOSITION, REPURPOSE The $130-145mm in redevelopment estimated to commence over the next 18 months can be broken down into the 3 categories: redevelopment, repositioning and repurposing Redevelopment ~55% Repurpose ~15% Reposition ~30% E.g. City Center and Portofino Traditional redevelopment, involving substantial improvements E.g. Castleton Crossing and Centennial Center Optimizing tenant mix, modest asset enhancements E.g. The Corner in Indianapolis Transforming function / use of the asset to drive NOI growth Redevelopment Pipeline Composition
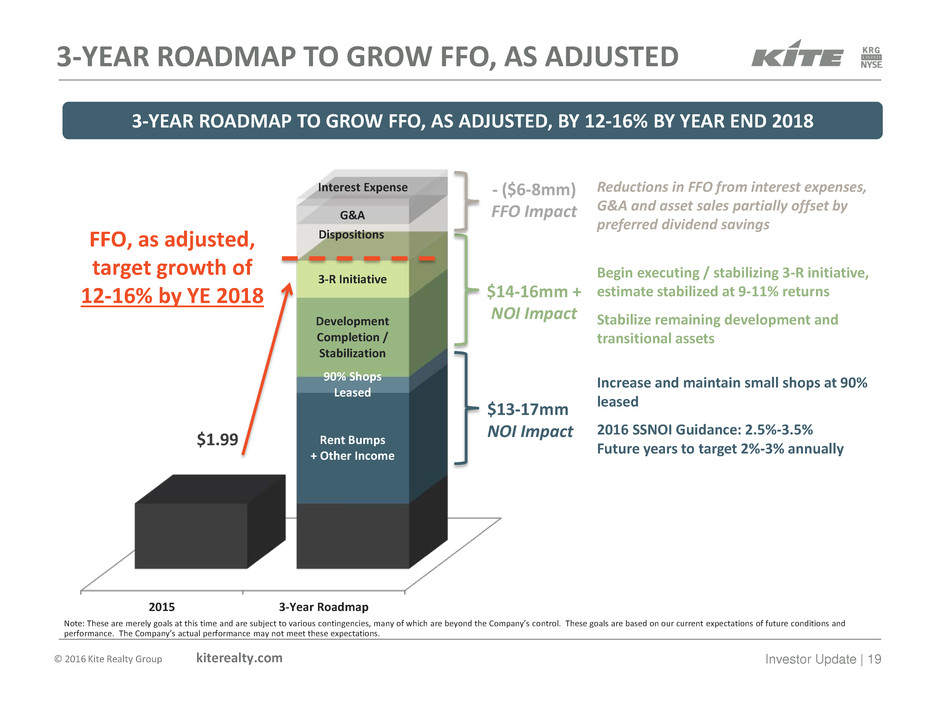
© 2016 Kite Realty Group kiterealty.com Investor Update | 19 2015 3-Year Roadmap Rent Bumps + Other Income 90% Shops Leased Development Completion / Stabilization 3-R Initiative Dispositions G&A Interest Expense $1.99 FFO, as adjusted, target growth of 12-16% by YE 2018 3-YEAR ROADMAP TO GROW FFO, AS ADJUSTED 3-YEAR ROADMAP TO GROW FFO, AS ADJUSTED, BY 12-16% BY YEAR END 2018 2016 SSNOI Guidance: 2.5%-3.5% Future years to target 2%-3% annually Increase and maintain small shops at 90% leased Stabilize remaining development and transitional assets Begin executing / stabilizing 3-R initiative, estimate stabilized at 9-11% returns $13-17mm NOI Impact $14-16mm + NOI Impact Reductions in FFO from interest expenses, G&A and asset sales partially offset by preferred dividend savings Note: These are merely goals at this time and are subject to various contingencies, many of which are beyond the Company’s control. These goals are based on our current expectations of future conditions and performance. The Company’s actual performance may not meet these expectations. - ($6-8mm) FFO Impact
© 2016 Kite Realty Group kiterealty.com Investor Update | 20 This presentation, together with other statements and information publicly disseminated by us, contains certain forward- looking statements within the meaning of Section 27A of the Securities Act of 1933 and Section 21E of the Securities Exchange Act of 1934. Such statements are based on assumptions and expectations that may not be realized and are inherently subject to risks, uncertainties and other factors, many of which cannot be predicted with accuracy and some of which might not even be anticipated. Future events and actual results, performance, transactions or achievements, financial or otherwise, may differ materially from the results, performance, transactions or achievements, financial or otherwise, expressed or implied by the forward-looking statements. Risks, uncertainties and other factors that might cause such differences, some of which could be material, include but are not limited to: national and local economic, business, real estate and other market conditions, particularly in light of low growth in the U.S. economy as well as uncertainty added to the economic forecast due to the sharp drop in oil and energy prices in late 2014; financing risks, including the availability of and costs associated with sources of liquidity; our ability to refinance, or extend the maturity dates of, our indebtedness; the level and volatility of interest rates; the financial stability of tenants, including their ability to pay rent and the risk of tenant bankruptcies; the competitive environment in which we operate; acquisition, disposition, development and joint venture risks; property ownership and management risks; our ability to maintain our status as a real estate investment trust for federal income tax purposes; potential environmental and other liabilities; impairment in the value of real estate property we own; risks related to the geographical concentration of our properties in Florida, Indiana, and Texas; insurance costs and coverage; other factors affecting the real estate industry generally; and other uncertainties and factors identified in this presentation and, from time to time, in reports we file with the SEC or in other documents that we publicly disseminate, including, in particular, the section titled “Risk Factors” in our most recent Annual Report on Form 10-K. The Company undertakes no obligation to publicly update or revise these forward-looking statements, whether as a result of new information, future events or otherwise. FORWARD-LOOKING STATEMENTS
