Attached files
| file | filename |
|---|---|
| EX-99.2 - EXHIBIT 99.2 - Forest City Realty Trust, Inc. | fcrtex992erq4-2015.htm |
| 8-K - 8-K - Forest City Realty Trust, Inc. | a8kforsupppackq4-2015.htm |
Exhibit 99.1

Supplemental Package
For the Quarter Ended December 31, 2015
Forest City Realty Trust, Inc. and Subsidiaries - Supplemental Package
Fourth Quarter 2015
Index
Corporate Description | |
Selected Financial Information | |
Consolidated Balance Sheets | |
Consolidated Statements of Operations | |
Net Asset Value Components | |
Supplemental Operating Information | |
Occupancy Data | |
Retail Sales Data | |
Leasing Summary | |
Comparable Net Operating Income (NOI) | |
NOI Detail | |
NOI by Product Type | |
NOI by Core Market | |
Reconciliation of NOI to Earnings (Loss) Before Income Taxes | |
Segment Operating Results | |
Reconciliation of Net Earnings (Loss) to FFO | |
Reconciliation of FFO to Operating FFO | |
Reconciliation of Net Earnings (Loss) to EBITDA | |
Operating FFO Bridges | |
Retail and Office Lease Expirations | |
Retail and Office Significant Tenants | |
Historical Trends | |
Development Pipeline | |
Military Housing | |
Supplemental Financial Information | |
Common Stock Data/Financial Covenants | |
Nonrecourse Debt Maturities Table | |
Summary of FFO by Segment | |
Property Listing | |
This supplemental package, together with other statements and information publicly disseminated by us, contains “forward-looking statements” within the meaning of Section 27A of the Securities Act of 1933, as amended, and Section 21E of the Securities Exchange Act of 1934, as amended. Such statements reflect management’s current views with respect to financial results related to future events and are based on assumptions and expectations that may not be realized and are inherently subject to risks and uncertainties, many of which cannot be predicted with accuracy and some of which might not even be anticipated. Future events and actual results, financial or otherwise, may differ, perhaps materially, from the results discussed in the forward-looking statements. Risk factors discussed in Item 1A of our Form 10-K for the year ended December 31, 2015 and other factors that might cause differences, some of which could be material, include, but are not limited to, our ability to qualify or to remain qualified as a REIT, our ability to satisfy REIT distribution requirements, the impact of issuing equity, debt or both, and selling assets to satisfy our future distributions required as a REIT or to fund capital expenditures, future growth and expansion initiatives, the impact of the amount and timing of any future distributions, the impact from complying with REIT qualification requirements limiting our flexibility or causing us to forego otherwise attractive opportunities beyond rental real estate operations, the impact of complying with the REIT requirements related to hedging, our lack of experience operating as a REIT, legislative, administrative, regulatory or other actions affecting REITs, including positions taken by the Internal Revenue Service, the possibility that our Board of Directors will unilaterally revoke our REIT election, the possibility that the anticipated benefits of qualifying as a REIT will not be realized, or will not be realized within the expected time period, the impact of current lending and capital market conditions on our liquidity, our ability to finance or refinance projects or repay our debt, the impact of the slow economic recovery on the ownership, development and management of our commercial real estate portfolio, general real estate investment and development risks, using modular construction as a new construction methodology and owning a factory to produce modular units, litigation risks, vacancies in our properties, risks associated with developing and managing properties in partnership with others, competition, our ability to renew leases or re-lease spaces as leases expire, illiquidity of real estate investments, bankruptcy or defaults of tenants, anchor store consolidations or closings, the impact of terrorist acts and other armed conflicts, our substantial debt leverage and the ability to obtain and service debt, the impact of restrictions imposed by our credit facility and senior debt, exposure to hedging agreements, the level and volatility of interest rates, the continued availability of tax-exempt government financing, our ability to receive payment on the notes receivable issued by Onexim in connection with their purchase of our interests in the Barclays Center and the Nets, the impact of credit rating downgrades, effects of uninsured or underinsured losses, effects of a downgrade or failure of our insurance carriers, environmental liabilities, competing interest of our directors and executive officers, the ability to recruit and retain key personnel, risks associated with the sale of tax credits, downturns in the housing market, the ability to maintain effective internal controls, compliance with governmental regulations, increased legislative and regulatory scrutiny of the financial services industry, changes in federal, state or local tax laws, volatility in the market price of our publicly traded securities, inflation risks, cybersecurity risks, cyber incidents, conflicts of interest, and risks related to our organizational structure including operating through our Operating Partnership and our UPREIT structure, as well as other risks listed from time to time in the company’s SEC filings, including but not limited to, the company’s annual and quarterly reports. We have no obligation to revise or update any forward-looking statements, other than as imposed by law, as a result of future events or new information. Readers are cautioned not to place undue reliance on such forward-looking statements.
1
Forest City Realty Trust, Inc. and Subsidiaries
Supplemental Financial and Operating Information
Corporate Description
We principally engage in the ownership, development, management and acquisition of commercial and residential real estate and land throughout the United States. We have approximately $10.0 billion of consolidated assets in 24 states and the District of Columbia at December 31, 2015. Our core markets include Boston, Chicago, Dallas, Denver, Los Angeles, Philadelphia and the greater metropolitan areas of New York City, San Francisco and Washington D.C. We have regional offices in Boston, Dallas, Denver, Los Angeles, New York City, San Francisco, Washington, D.C. and our corporate headquarters in Cleveland, Ohio.
REIT Conversion
On January 13, 2015, the board of directors of Forest City Enterprises, Inc., our predecessor, approved a plan to pursue conversion to REIT status. On May 29, 2015, Forest City Enterprises, Inc. formed Forest City Realty Trust, Inc. (with its subsidiaries, the “Company”) as a Maryland corporation and wholly-owned subsidiary of Forest City Enterprises, Inc. On October 20, 2015, the shareholders of Forest City Enterprises, Inc. approved and adopted the merger agreement that implemented the restructuring of Forest City Enterprises, Inc. into a holding company so as to facilitate its conversion to a REIT.
Pursuant to the merger agreement, effective as of 11:59 pm, Eastern Time, on December 31, 2015 (the “Effective Time”), (i) a wholly-owned subsidiary of the Company merged with and into Forest City Enterprises, Inc., with Forest City Enterprises, Inc. as the surviving corporation, (ii) each outstanding share of Forest City Enterprises, Inc. Class A common stock, par value $.33 1/3 per share, and Class B common stock, par value $.33 1/3 per share, automatically converted into one share of Forest City Realty Trust, Inc. Class A common stock, $.01 par value per share, and Class B common stock, $.01 par value per share, respectively, (iii) Forest City Enterprises, Inc. became a wholly-owned subsidiary of the Company and (iv) the Company became the publicly-traded New York Stock Exchange-listed parent company that succeeded to and continued to operate substantially all of the existing businesses of Forest City Enterprises, Inc. and its subsidiaries. In addition, each share of Class A common stock of Forest City Enterprises, Inc. held in treasury at December 31, 2015 ceased to be outstanding at the Effective Time of the Merger, and a corresponding adjustment was recorded to Class A common stock and additional paid-in capital. Immediately following the merger, Forest City Enterprises, Inc. converted into a Delaware limited partnership named “Forest City Enterprises, L.P.” (the “Operating Partnership”).
In this supplemental package, unless otherwise specifically stated or the context otherwise, all references to “the Company,” “Forest City,” “we,” “our,” “us” and similar terms refer to Forest City Enterprises, Inc. and its consolidated subsidiaries prior to the Effective Time and Forest City Realty Trust, Inc. and its consolidated subsidiaries, including the Operating Partnership, as of the Effective Time and thereafter.
Company Operations
As of January 1, 2016, we believe that we are organized in a manner that enables us to qualify, and intend to operate in a manner that will allow us to continue to qualify, as a real estate investment trust (“REIT”) for federal income tax purposes. As such, we intend to elect REIT status for our taxable year ending December 31, 2016, upon filing the 2016 Form 1120-REIT with the Internal Revenue Service on or before September 15, 2017.
We hold substantially all of our assets, and conduct substantially all of our business, through the Operating Partnership. We are the sole general partner of the Operating Partnership and, as of December 31, 2015, following the conversion of Forest City Enterprises, Inc. into the Operating Partnership, we directly or indirectly own all of the limited partnership interests in the Operating Partnership.
We hold and operate certain of our assets through one or more taxable REIT subsidiaries (“TRSs”). A TRS is a subsidiary of a REIT that is subject to applicable corporate income tax. Our use of TRSs enables us to continue to engage in certain businesses while complying with REIT qualification requirements and also allows us to retain income generated by these businesses for reinvestment without the requirement of distributing those earnings. The non-REIT qualified businesses that we hold through TRSs primarily include our investments in our Land Development Group, Barclays Center arena and the Brooklyn Nets (the “Nets”), a member of the National Basketball Association (“NBA”) (subsequently sold in January 2016), B2 BKLYN, an apartment building under construction in Brooklyn, New York, military housing operations (subsequently sold in February 2016), and Pacific Park Brooklyn project. In the future, we may elect to reorganize and transfer certain assets or operations from our TRSs to other subsidiaries, including qualified REIT subsidiaries.
2
Forest City Realty Trust, Inc. and Subsidiaries
Supplemental Financial and Operating Information
We operate through five reportable operating segments. The Commercial Group, Residential Group and Land Development Group (collectively, the “Real Estate Groups”) represent four reportable operating segments:
• | Commercial Group owns, develops, acquires and operates regional malls, specialty/urban retail centers, office and life science buildings and mixed-use projects. Additionally, it operated Barclays Center, a sports and entertainment arena located in Brooklyn, New York, which is reported as a separate operating segment (“Arena”). The Arena, which was disposed of during January 2016, is classified as held for sale and reported in discontinued operations for all periods presented. |
• | Residential Group owns, develops, acquires and operates residential rental properties, including upscale and middle-market apartments, adaptive re-use developments, for-sale condominium projects and subsidized senior housing. Additionally, it owns interests in entities that develop and manage military family housing, which was disposed of during February 2016. |
• | Land Development Group acquires and sells both land and developed lots to residential, commercial and industrial customers at our Stapleton project in Denver, Colorado. |
Corporate Activities is the other reportable operating segment, which includes our equity method investment in the Nets, which was disposed of during January 2016. The Nets is classified as held for sale and is reported in discontinued operations for all periods presented.
Supplemental Financial and Operating Information
We recommend this supplemental package be read in conjunction with our Form 10-K for the year ended December 31, 2015. This supplemental package contains information prepared in accordance with generally accepted accounting principles (“GAAP”) under the full consolidation accounting method and information prepared under the pro-rata consolidation method, a non-GAAP measure. We present certain financial amounts under the pro-rata consolidation method because we believe this information is useful to financial statement users as this method reflects the manner in which we operate our business. We believe the non-GAAP financial and operating information presented under the pro-rata consolidation method, net operating income (“NOI”), comparable NOI, Funds From Operations (“FFO”), Operating FFO, Earnings Before Interest, Taxes, Depreciation and Amortization (“EBITDA”) and Adjusted EBITDA are necessary to understand our business and operating results, along with net earnings and other GAAP measures. Our financial statement users can use these non-GAAP measures as supplementary information to evaluate our business. Our non-GAAP measures are not intended to be performance measures that should be regarded as alternatives to, or more meaningful than, our GAAP measures.
Consolidation Methods
In line with industry practice, we have a number of investments in which our economic ownership is less than 100% as a means of procuring opportunities and sharing risk. Under GAAP, the full consolidation method is used to report assets and liabilities at 100% if deemed to be under our control or if we are deemed to be the primary beneficiary of the variable interest entity (“VIE”), even if our ownership is not 100%. Under the pro-rata consolidation method, we generally present our investments proportionate to our economic share of ownership. We provide reconciliations from the full consolidation method to the pro-rata consolidation method throughout this supplemental package.
FFO
The majority of our peers in the publicly traded real estate industry are REITs and report operations using FFO as defined by the National Association of Real Estate Investment Trusts (“NAREIT”). Although we did not operate as a REIT for the periods presented in this supplemental package, we believe it is important to publish this measure to allow for easier comparison of our performance to our peers. The major difference between us and our REIT peers is that we were a taxable entity and any taxable income we generated could result in payment of federal or state income taxes. Our REIT peers typically do not pay federal or state income taxes on their qualified REIT investments, but distribute a significant portion of their taxable income to shareholders. Due to our effective tax management policies, we have not historically been a significant payer of income taxes. This has allowed us to retain our internally generated cash flows but has also resulted in large non-cash expenses for deferred taxes as required by GAAP.
FFO is defined by NAREIT as net earnings excluding the following items at our proportionate share: i) gain (loss) on full or partial disposition of rental properties, divisions and other investments (net of tax); ii) non-cash charges for real estate depreciation and amortization; iii) impairment of depreciable real estate (net of tax); and iv) cumulative or retrospective effect of change in accounting principle (net of tax).
In connection with our conversion to REIT status, we were required to reverse our net deferred tax liabilities related to our subsidiaries that will be held as qualified REIT investments of $588,607,000 during the three months ended December 31, 2015, which we have excluded from our December 31, 2015 FFO calculation.
3
Forest City Realty Trust, Inc. and Subsidiaries
Supplemental Financial and Operating Information
Operating FFO
In addition to reporting FFO, we report Operating FFO as an additional measure of our operating performance. We believe it is appropriate to adjust FFO for significant items driven by transactional activity and factors relating to the financial and real estate markets, rather than factors specific to the on-going operating performance of our properties. We use Operating FFO as an indicator of continuing operating results in planning and executing our business strategy. Operating FFO should not be considered to be an alternative to net earnings computed under GAAP as an indicator of our operating performance and may not be directly comparable to similarly-titled measures reported by other companies.
We define Operating FFO as FFO adjusted to exclude: i) impairment of non-depreciable real estate; ii) write-offs of abandoned development projects and demolition costs; iii) income recognized on state and federal historic and other tax credits; iv) gains or losses from extinguishment of debt; v) change in fair market value of nondesignated hedges; vi) gains or losses on change in control of interests; vii) the adjustment to recognize rental revenues and rental expense using the straight-line method; viii) participation payments to ground lessors on refinancing of our properties; ix) other transactional items; x) the Nets pre-tax FFO; and xi) income taxes on FFO.
EBITDA
EBITDA, a non-GAAP measure, is defined as net earnings excluding the following items at our proportionate share: i) non-cash charges for depreciation and amortization; ii) interest expense; iii) amortization of mortgage procurement costs; and iv) income taxes. EBITDA may not be directly comparable to similarly-titled measures reported by other companies.
Adjusted EBITDA
We define Adjusted EBITDA as EBITDA adjusted to exclude: i) impairment of real estate; ii) gains or losses from extinguishment of debt; iii) gain (loss) on full or partial disposition of rental properties, development projects and other investments; iv) gains or losses on change in control of interests; v) other transactional items; and vi) the Nets pre-tax EBITDA. We believe EBITDA, Adjusted EBITDA and net debt to Adjusted EBITDA provide additional information in evaluating our credit and ability to service our debt obligations. Adjusted EBITDA may not be directly comparable to similarly-titled measures reported by other companies.
NOI
NOI, a non-GAAP measure, reflects our share of the core operations of our rental real estate portfolio, prior to any financing activity. NOI is defined as revenues less operating expenses of consolidated and unconsolidated subsidiaries within our Commercial Group and our Residential Group, except for revenues and cost of sales associated with sales of land held in these segments. The activities of the Land Development Group and Corporate Activities do not involve the operations of our rental property portfolio and therefore are not included in NOI.
Our historical NOI was calculated based on an entire company perspective rather than focusing on the core operations of our rental real estate portfolio. It included amounts associated with the Land Development Group and Corporate Activities, all of which are now excluded to arrive at our rental real estate portfolio property NOI measure. In addition, we evaluated revenue and expense items in the Commercial and Residential segments and determined straight-line rent adjustments should be included in NOI (previously excluded) and land sales less cost of land sales, interest and other income and write-offs of abandoned development projects should be excluded (previously included). We believe the NOI calculation provides a financial measure that better reflects the ongoing operating performance of our rental property portfolio and aligns our NOI reporting closer to that of our peers. Prior periods were adjusted for comparability purposes.
We believe NOI provides important information about our core operations and, along with earnings, is necessary to understand our business and operating results. NOI may not be directly comparable to similarly-titled measures reported by other companies.
Comparable NOI
We use comparable NOI as a metric to evaluate the performance of our multi-family, office and retail properties. This measure provides a same-store comparison of operating results of all stabilized properties that are open and operating in all periods presented. Non-capitalizable development costs and unallocated management and service company overhead are not directly attributable to an operating property and are considered non-comparable NOI. In addition, certain income and expense items at the property level, such as lease termination income, real estate tax assessments or rebates and NOI impacts of changes in ownership percentages, are excluded from comparable NOI and are considered non-comparable NOI. Retained operating properties considered non-comparable are disclosed in the Segment Operating Results of this supplemental package. Other properties and activities such as Arena, subsidized senior housing, military housing, straight-line rent adjustments and participation payments as a result of refinancing transactions are not evaluated on a comparable basis and the NOI from these properties and activities is considered non-comparable NOI.
4
Forest City Realty Trust, Inc. and Subsidiaries
Supplemental Financial and Operating Information
Comparable NOI is an operating statistic defined as NOI from stabilized properties operated in all periods presented, net of noncontrolling interests. Comparable NOI is useful because it measures the performance of the same properties on a period-to-period basis and is used to assess operating performance and resource allocation of the operating properties. While property dispositions, acquisitions or other factors impact net earnings in the short term, we believe comparable NOI presents a more consistent view of the overall performance of our operating portfolio from period to period. A reconciliation of NOI to earnings (loss) before income taxes, the most comparable financial measure calculated in accordance with GAAP, a reconciliation of NOI to earnings (loss) before income taxes for each operating segment and a reconciliation from NOI to comparable NOI are included in this supplemental package.
Supplemental Operating Information
The operating information contained in this document includes: occupancy data, retail sales data, leasing summaries, comparable NOI, NOI by product type and core market, reconciliation of NOI to earnings (loss) before income taxes, segment operating results discussion, reconciliation of net earnings (loss) to FFO, reconciliation of FFO to Operating FFO, reconciliation of net earnings (loss) to EBITDA, Operating FFO bridges, retail and office lease expirations, retail and office significant tenants, historical trends and our development pipeline. We believe this information gives interested parties a better understanding and more information about our operating performance. The term “comparable,” which is used throughout this document, is generally defined as including stabilized properties open and operated in both the three months and years ended December 31, 2015 and 2014. We believe occupancy data, retail sales data, leasing spreads on retail and office properties, and other rental rate information on multi-family properties represent meaningful operating statistics about us.
5
Forest City Realty Trust, Inc. and Subsidiaries
Supplemental Financial and Operating Information
Corporate Headquarters
Forest City Realty Trust, Inc.
Terminal Tower
50 Public Square, Suite 1100
Cleveland, Ohio 44113
Annual Report on Form 10-K
A copy of the Annual Report on Form 10-K as filed with the Securities and Exchange Commission (“SEC”) for the year ended December 31, 2015, can be found on our website under SEC Filings or may be obtained without charge upon written request to:
Jeffrey B. Linton
Senior Vice President - Corporate Communication
JeffLinton@forestcity.net
Website
www.forestcity.net
The information contained on this website is not incorporated herein by reference and does not constitute a part of this supplemental package.
Investor Relations
Michael E. Lonsway
Senior Vice President - Planning
MikeLonsway@forestcity.net
Investor Presentations
Please note we periodically post updated investor presentations on the Investors page of our website at www.forestcity.net. It is possible the periodic updates may include information deemed to be material. Therefore, we encourage investors, the media, and other interested parties to review the Investors page of our website at www.forestcity.net for the most recent investor presentation.
Transfer Agent and Registrar
Wells Fargo
Shareowner Services
P.O. Box 64854
St. Paul, MN 55164-9440
(800) 468-9716
www.shareowneronline.com
NYSE Listings
FCEA - Class A Common Stock ($.01 par value)
FCEB - Class B Common Stock ($.01 par value)
Dividend Reinvestment and Stock Purchase Plan
We offer our shareholders the opportunity to purchase additional shares of common stock through the Forest City Realty Trust, Inc. Dividend Reinvestment and Stock Purchase Plan (the “Plan”). You may obtain a copy of the Plan prospectus and an enrollment card by contacting Wells Fargo Shareowner Services at (800) 468-9716 or by visiting www.shareowneronline.com.
6
Forest City Realty Trust, Inc. and Subsidiaries
Selected Financial Information
Consolidated Balance Sheet – December 31, 2015 (Unaudited)
Full Consolidation (GAAP) | Less Noncontrolling Interest | Plus Unconsolidated Investments at Pro-Rata | Pro-Rata Consolidation (Non-GAAP) | |||||||||
(in thousands) | ||||||||||||
Assets | ||||||||||||
Real Estate | ||||||||||||
Completed rental properties | ||||||||||||
Residential | $ | 2,657,399 | $ | 413,832 | $ | 989,971 | $ | 3,233,538 | ||||
Commercial | ||||||||||||
Retail centers | 1,385,662 | — | 1,685,051 | 3,070,713 | ||||||||
Office buildings | 3,640,468 | 110,389 | 97,431 | 3,627,510 | ||||||||
Corporate and other equipment | 10,542 | — | — | 10,542 | ||||||||
Total completed rental properties | 7,694,071 | 524,221 | 2,772,453 | 9,942,303 | ||||||||
Projects under construction | ||||||||||||
Residential | 545,574 | 302,782 | 129,117 | 371,909 | ||||||||
Commercial | ||||||||||||
Retail centers | — | — | — | — | ||||||||
Office buildings | 84,253 | — | 70,988 | 155,241 | ||||||||
Total projects under construction | 629,827 | 302,782 | 200,105 | 527,150 | ||||||||
Projects under development | ||||||||||||
Operating properties | 36,152 | — | 5,275 | 41,427 | ||||||||
Residential | 109,616 | — | 245,608 | 355,224 | ||||||||
Commercial | ||||||||||||
Retail centers | 23,777 | — | 3,941 | 27,718 | ||||||||
Office buildings | 90,246 | 8,876 | 3,276 | 84,646 | ||||||||
Total projects under development | 259,791 | 8,876 | 258,100 | 509,015 | ||||||||
Total projects under construction and development | 889,618 | 311,658 | 458,205 | 1,036,165 | ||||||||
Land inventory | 69,318 | 5,191 | 8,796 | 72,923 | ||||||||
Total Real Estate | 8,653,007 | 841,070 | 3,239,454 | 11,051,391 | ||||||||
Less accumulated depreciation | (1,624,920 | ) | (71,249 | ) | (656,127 | ) | (2,209,798 | ) | ||||
Real Estate, net | 7,028,087 | 769,821 | 2,583,327 | 8,841,593 | ||||||||
Cash and equivalents | 265,677 | 15,705 | 59,977 | 309,949 | ||||||||
Restricted cash | 161,891 | 7,482 | 119,165 | 273,574 | ||||||||
Notes and accounts receivable, net | 376,147 | 18,337 | 65,307 | 423,117 | ||||||||
Investments in and advances to unconsolidated entities | 678,872 | (105,382 | ) | (658,763 | ) | 125,491 | ||||||
Lease and mortgage procurement costs, net | 143,672 | 11,432 | 81,554 | 213,794 | ||||||||
Prepaid expenses and other deferred costs, net | 111,619 | 9,040 | 16,621 | 119,200 | ||||||||
Intangible assets, net | 198,672 | 14,572 | 16,509 | 200,609 | ||||||||
Deferred income taxes, net | 83,645 | — | — | 83,645 | ||||||||
Assets held for sale | 944,727 | 583,840 | — | 360,887 | ||||||||
Total Assets | $ | 9,993,009 | $ | 1,324,847 | $ | 2,283,697 | $ | 10,951,859 | ||||
7
Forest City Realty Trust, Inc. and Subsidiaries
Selected Financial Information
Consolidated Balance Sheet – December 31, 2015 (Unaudited)
Full Consolidation (GAAP) | Less Noncontrolling Interest | Plus Unconsolidated Investments at Pro-Rata | Pro-Rata Consolidation (Non-GAAP) | |||||||||
(in thousands) | ||||||||||||
Liabilities and Equity | ||||||||||||
Liabilities | ||||||||||||
Mortgage debt and notes payable, nonrecourse | ||||||||||||
Completed rental properties | ||||||||||||
Residential | $ | 1,452,790 | $ | 254,578 | $ | 690,321 | $ | 1,888,533 | ||||
Commercial | ||||||||||||
Retail centers | 631,901 | — | 1,238,611 | 1,870,512 | ||||||||
Office buildings | 1,798,622 | 42,990 | 76,264 | 1,831,896 | ||||||||
Total completed rental properties | 3,883,313 | 297,568 | 2,005,196 | 5,590,941 | ||||||||
Projects under construction | ||||||||||||
Residential | 59,113 | 44,324 | 20,175 | 34,964 | ||||||||
Commercial | ||||||||||||
Retail centers | — | — | — | — | ||||||||
Office buildings | 28,167 | — | 47,913 | 76,080 | ||||||||
Total projects under construction | 87,280 | 44,324 | 68,088 | 111,044 | ||||||||
Projects under development | ||||||||||||
Operating properties | — | — | — | — | ||||||||
Residential | 32,857 | — | 152,815 | 185,672 | ||||||||
Commercial | ||||||||||||
Retail centers | — | — | — | — | ||||||||
Office buildings | — | — | — | — | ||||||||
Total projects under development | 32,857 | — | 152,815 | 185,672 | ||||||||
Total projects under construction and development | 120,137 | 44,324 | 220,903 | 296,716 | ||||||||
Land inventory | — | — | 8,580 | 8,580 | ||||||||
Total mortgage debt and notes payable, nonrecourse | 4,003,450 | 341,892 | 2,234,679 | 5,896,237 | ||||||||
Revolving credit facility | — | — | — | — | ||||||||
Convertible senior debt | 271,006 | — | — | 271,006 | ||||||||
Construction payables | 166,811 | 63,303 | 39,259 | 142,767 | ||||||||
Operating accounts payable and accrued expenses | 622,327 | 23,975 | 154,372 | 752,724 | ||||||||
Accrued derivative liability | 73,679 | — | 6,839 | 80,518 | ||||||||
Total Accounts payable, accrued expenses and other liabilities | 862,817 | 87,278 | 200,470 | 976,009 | ||||||||
Cash distributions and losses in excess of investments in unconsolidated entities | 150,255 | (19,859 | ) | (151,452 | ) | 18,662 | ||||||
Liabilities held for sale | 570,947 | 398,334 | — | 172,613 | ||||||||
Total Liabilities | 5,858,475 | 807,645 | 2,283,697 | 7,334,527 | ||||||||
Redeemable Noncontrolling Interest | 159,978 | 159,978 | — | — | ||||||||
Equity | ||||||||||||
Shareholders’ Equity | ||||||||||||
Shareholders’ equity before accumulated other comprehensive loss | 3,586,237 | — | — | 3,586,237 | ||||||||
Accumulated other comprehensive loss | (67,905 | ) | — | — | (67,905 | ) | ||||||
Total Shareholders’ Equity | 3,518,332 | — | — | 3,518,332 | ||||||||
Noncontrolling interest | 456,224 | 357,224 | — | 99,000 | ||||||||
Total Equity | 3,974,556 | 357,224 | — | 3,617,332 | ||||||||
Total Liabilities and Equity | $ | 9,993,009 | $ | 1,324,847 | $ | 2,283,697 | $ | 10,951,859 | ||||
8
Forest City Realty Trust, Inc. and Subsidiaries
Selected Financial Information
Consolidated Balance Sheet – December 31, 2014 (Unaudited)
Full Consolidation (GAAP) | Less Noncontrolling Interest | Plus Unconsolidated Investments at Pro-Rata | Pro-Rata Consolidation (Non-GAAP) | |||||||||
(in thousands) | ||||||||||||
Assets | ||||||||||||
Real Estate | ||||||||||||
Completed rental properties | ||||||||||||
Residential | $ | 2,470,813 | $ | 370,855 | $ | 1,060,830 | $ | 3,160,788 | ||||
Commercial | ||||||||||||
Retail centers | 1,747,127 | — | 1,654,140 | 3,401,267 | ||||||||
Office buildings | 2,584,854 | 107,656 | 262,524 | 2,739,722 | ||||||||
Corporate and other equipment | 10,738 | — | — | 10,738 | ||||||||
Total completed rental properties | 6,813,532 | 478,511 | 2,977,494 | 9,312,515 | ||||||||
Projects under construction | ||||||||||||
Residential | 176,148 | 96,567 | 9,262 | 88,843 | ||||||||
Commercial | ||||||||||||
Retail centers | — | — | — | — | ||||||||
Office buildings | 8,940 | — | 42,923 | 51,863 | ||||||||
Total projects under construction | 185,088 | 96,567 | 52,185 | 140,706 | ||||||||
Projects under development | ||||||||||||
Operating properties | 29,187 | — | 12,589 | 41,776 | ||||||||
Residential | 139,923 | 22,769 | 214,084 | 331,238 | ||||||||
Commercial | ||||||||||||
Retail centers | 33,807 | — | 4,014 | 37,821 | ||||||||
Office buildings | 89,952 | 8,791 | 3,180 | 84,341 | ||||||||
Total projects under development | 292,869 | 31,560 | 233,867 | 495,176 | ||||||||
Total projects under construction and development | 477,957 | 128,127 | 286,052 | 635,882 | ||||||||
Land inventory | 97,469 | 5,351 | 8,537 | 100,655 | ||||||||
Total Real Estate | 7,388,958 | 611,989 | 3,272,083 | 10,049,052 | ||||||||
Less accumulated depreciation | (1,480,611 | ) | (59,001 | ) | (680,584 | ) | (2,102,194 | ) | ||||
Real Estate, net | 5,908,347 | 552,988 | 2,591,499 | 7,946,858 | ||||||||
Cash and equivalents | 290,668 | 17,437 | 79,716 | 352,947 | ||||||||
Restricted cash | 251,443 | 20,528 | 125,680 | 356,595 | ||||||||
Notes and accounts receivable, net | 408,517 | 19,158 | 59,786 | 449,145 | ||||||||
Investments in and advances to unconsolidated entities | 620,466 | (94,212 | ) | (605,009 | ) | 109,669 | ||||||
Lease and mortgage procurement costs, net | 154,039 | 11,480 | 81,617 | 224,176 | ||||||||
Prepaid expenses and other deferred costs, net | 102,112 | 7,326 | 14,702 | 109,488 | ||||||||
Intangible assets, net | 123,778 | 17,554 | 16,436 | 122,660 | ||||||||
Assets held for sale | 955,570 | 579,282 | — | 376,288 | ||||||||
Total Assets | $ | 8,814,940 | $ | 1,131,541 | $ | 2,364,427 | $ | 10,047,826 | ||||
9
Forest City Realty Trust, Inc. and Subsidiaries
Selected Financial Information
Consolidated Balance Sheet – December 31, 2014 (Unaudited)
Full Consolidation (GAAP) | Less Noncontrolling Interest | Plus Unconsolidated Investments at Pro-Rata | Pro-Rata Consolidation (Non-GAAP) | |||||||||
(in thousands) | ||||||||||||
Liabilities and Equity | ||||||||||||
Liabilities | ||||||||||||
Mortgage debt and notes payable, nonrecourse | ||||||||||||
Completed rental properties | ||||||||||||
Residential | $ | 1,376,329 | $ | 202,112 | $ | 740,668 | $ | 1,914,885 | ||||
Commercial | ||||||||||||
Retail centers | 638,310 | — | 1,252,645 | 1,890,955 | ||||||||
Office buildings | 1,652,685 | 72,277 | 247,424 | 1,827,832 | ||||||||
Total completed rental properties | 3,667,324 | 274,389 | 2,240,737 | 5,633,672 | ||||||||
Projects under construction | ||||||||||||
Residential | 61,905 | 4,266 | 1,293 | 58,932 | ||||||||
Commercial | ||||||||||||
Retail centers | — | — | — | — | ||||||||
Office buildings | 29,422 | — | 23,370 | 52,792 | ||||||||
Total projects under construction | 91,327 | 4,266 | 24,663 | 111,724 | ||||||||
Projects under development | ||||||||||||
Operating properties | — | — | — | — | ||||||||
Residential | 32,267 | — | 97,467 | 129,734 | ||||||||
Commercial | ||||||||||||
Retail centers | — | — | — | — | ||||||||
Office buildings | — | — | — | — | ||||||||
Total projects under development | 32,267 | — | 97,467 | 129,734 | ||||||||
Total projects under construction and development | 123,594 | 4,266 | 122,130 | 241,458 | ||||||||
Land inventory | — | — | 8,580 | 8,580 | ||||||||
Total mortgage debt and notes payable, nonrecourse | 3,790,918 | 278,655 | 2,371,447 | 5,883,710 | ||||||||
Revolving credit facility | — | — | — | — | ||||||||
Convertible senior debt | 700,000 | — | — | 700,000 | ||||||||
Construction payables | 110,108 | 26,866 | 34,557 | 117,799 | ||||||||
Operating accounts payable and accrued expenses | 561,689 | 23,245 | 162,154 | 700,598 | ||||||||
Accrued derivative liability | 102,362 | — | 7,755 | 110,117 | ||||||||
Total Accounts payable, accrued expenses and other liabilities | 774,159 | 50,111 | 204,466 | 928,514 | ||||||||
Cash distributions and losses in excess of investments in unconsolidated entities | 211,493 | (21,775 | ) | (211,486 | ) | 21,782 | ||||||
Deferred income taxes, net | 482,474 | — | — | 482,474 | ||||||||
Liabilities held for sale | 520,135 | 358,398 | — | 161,737 | ||||||||
Total Liabilities | 6,479,179 | 665,389 | 2,364,427 | 8,178,217 | ||||||||
Redeemable Noncontrolling Interest | 183,038 | 183,038 | — | — | ||||||||
Equity | ||||||||||||
Shareholders’ Equity | ||||||||||||
Shareholders’ equity before accumulated other comprehensive loss | 1,776,793 | — | — | 1,776,793 | ||||||||
Accumulated other comprehensive loss | (58,846 | ) | — | — | (58,846 | ) | ||||||
Total Shareholders’ Equity | 1,717,947 | — | — | 1,717,947 | ||||||||
Noncontrolling interest | 434,776 | 283,114 | — | 151,662 | ||||||||
Total Equity | 2,152,723 | 283,114 | — | 1,869,609 | ||||||||
Total Liabilities and Equity | $ | 8,814,940 | $ | 1,131,541 | $ | 2,364,427 | $ | 10,047,826 | ||||
10
Forest City Realty Trust, Inc. and Subsidiaries
Selected Financial Information
Consolidated Statement of Operations – Three Months Ended December 31, 2015 (Unaudited)
Full Consolidation (GAAP) | Less Noncontrolling Interest | Plus Unconsolidated Investments at Pro-Rata | Plus Discontinued Operations | Pro-Rata Consolidation (Non-GAAP) | |||||||||||
(in thousands) | |||||||||||||||
Revenues | |||||||||||||||
Rental | $ | 167,916 | $ | 12,275 | $ | 57,588 | $ | — | $ | 213,229 | |||||
Tenant recoveries | 32,588 | 1,573 | 15,145 | — | 46,160 | ||||||||||
Service and management fees | 13,869 | 60 | 1,498 | — | 15,307 | ||||||||||
Parking and other | 18,732 | 780 | 4,893 | — | 22,845 | ||||||||||
Arena | — | — | — | 30,423 | 30,423 | ||||||||||
Land sales | 31,580 | 2,302 | 297 | — | 29,575 | ||||||||||
Subsidized Senior Housing | — | — | 12,230 | — | 12,230 | ||||||||||
Military Housing | 8,145 | — | 1,413 | — | 9,558 | ||||||||||
Total revenues | 272,830 | 16,990 | 93,064 | 30,423 | 379,327 | ||||||||||
Expenses | |||||||||||||||
Property operating and management | 100,748 | 5,092 | 25,011 | — | 120,667 | ||||||||||
Real estate taxes | 24,315 | 2,074 | 7,002 | — | 29,243 | ||||||||||
Ground rent | 1,972 | 80 | 3,351 | — | 5,243 | ||||||||||
Arena operating | — | — | — | 21,903 | 21,903 | ||||||||||
Cost of land sales | 15,697 | 695 | — | — | 15,002 | ||||||||||
Subsidized Senior Housing operating | — | — | 7,580 | — | 7,580 | ||||||||||
Military Housing operating | 1,841 | — | 719 | — | 2,560 | ||||||||||
Corporate general and administrative | 12,479 | — | — | — | 12,479 | ||||||||||
REIT conversion and reorganization costs | 22,627 | — | — | — | 22,627 | ||||||||||
179,679 | 7,941 | 43,663 | 21,903 | 237,304 | |||||||||||
Depreciation and amortization | 72,546 | 4,374 | 22,792 | 4,862 | 95,826 | ||||||||||
Write-offs of abandoned development projects | 3,756 | 116 | — | — | 3,640 | ||||||||||
Impairment of real estate | 25,971 | — | 12,460 | — | 38,431 | ||||||||||
Total expenses | 281,952 | 12,431 | 78,915 | 26,765 | 375,201 | ||||||||||
Operating income (loss) | (9,122 | ) | 4,559 | 14,149 | 3,658 | 4,126 | |||||||||
Interest and other income | 9,762 | 670 | 722 | — | 9,814 | ||||||||||
Net loss on change in control of interests | (1,405 | ) | — | — | — | (1,405 | ) | ||||||||
Interest expense | (37,481 | ) | (2,383 | ) | (22,079 | ) | (4,917 | ) | (62,094 | ) | |||||
Amortization of mortgage procurement costs | (1,793 | ) | (80 | ) | (802 | ) | (226 | ) | (2,741 | ) | |||||
Loss on extinguishment of debt | (3,133 | ) | — | — | — | (3,133 | ) | ||||||||
Earnings (loss) before income taxes | (43,172 | ) | 2,766 | (8,010 | ) | (1,485 | ) | (55,433 | ) | ||||||
Income tax expense (benefit) | |||||||||||||||
Current | (9,631 | ) | — | — | 919 | (8,712 | ) | ||||||||
Deferred | (595,886 | ) | — | — | (2,398 | ) | (598,284 | ) | |||||||
(605,517 | ) | — | — | (1,479 | ) | (606,996 | ) | ||||||||
Earnings (loss) from unconsolidated entities, gross of tax | (8,488 | ) | 46 | 8,010 | (2,325 | ) | (2,849 | ) | |||||||
Earnings (loss) from continuing operations | 553,857 | 2,812 | — | (2,331 | ) | 548,714 | |||||||||
Discontinued operations, net of tax | |||||||||||||||
Operating loss from rental properties | (3,058 | ) | (2,150 | ) | — | 908 | — | ||||||||
Equity in earnings (loss) | (1,423 | ) | — | — | 1,423 | — | |||||||||
(4,481 | ) | (2,150 | ) | — | 2,331 | — | |||||||||
Net earnings | 549,376 | 662 | — | — | 548,714 | ||||||||||
Noncontrolling interests | |||||||||||||||
Earnings from continuing operations attributable to noncontrolling interests, gross of tax | (2,812 | ) | (2,812 | ) | — | — | — | ||||||||
Loss from discontinued operations attributable to noncontrolling interests | 2,150 | 2,150 | — | — | — | ||||||||||
(662 | ) | (662 | ) | — | — | — | |||||||||
Net earnings attributable to Forest City Realty Trust, Inc. | $ | 548,714 | $ | — | $ | — | $ | — | $ | 548,714 | |||||
11
Forest City Realty Trust, Inc. and Subsidiaries
Selected Financial Information
Consolidated Statement of Operations – Year Ended December 31, 2015 (Unaudited)
Full Consolidation (GAAP) | Less Noncontrolling Interest | Plus Unconsolidated Investments at Pro-Rata | Plus Discontinued Operations | Pro-Rata Consolidation (Non-GAAP) | |||||||||||
(in thousands) | |||||||||||||||
Revenues | |||||||||||||||
Rental | $ | 625,725 | $ | 46,623 | $ | 242,863 | $ | — | $ | 821,965 | |||||
Tenant recoveries | 133,829 | 7,354 | 66,211 | — | 192,686 | ||||||||||
Service and management fees | 45,263 | 207 | 6,646 | — | 51,702 | ||||||||||
Parking and other | 62,376 | 2,799 | 18,758 | — | 78,335 | ||||||||||
Arena | — | — | — | 74,598 | 74,598 | ||||||||||
Land sales | 79,169 | 6,998 | 1,780 | — | 73,951 | ||||||||||
Subsidized Senior Housing | — | — | 48,411 | — | 48,411 | ||||||||||
Military Housing | 31,869 | 1,655 | 5,614 | — | 35,828 | ||||||||||
Total revenues | 978,231 | 65,636 | 390,283 | 74,598 | 1,377,476 | ||||||||||
Expenses | |||||||||||||||
Property operating and management | 386,688 | 17,985 | 99,741 | — | 468,444 | ||||||||||
Real estate taxes | 91,274 | 7,035 | 31,376 | — | 115,615 | ||||||||||
Ground rent | 11,348 | 328 | 12,014 | — | 23,034 | ||||||||||
Arena operating | — | — | — | 52,655 | 52,655 | ||||||||||
Cost of land sales | 31,413 | 2,069 | — | — | 29,344 | ||||||||||
Subsidized Senior Housing operating | — | — | 30,570 | — | 30,570 | ||||||||||
Military Housing operating | 8,130 | 923 | 2,739 | — | 9,946 | ||||||||||
Corporate general and administrative | 48,374 | — | — | — | 48,374 | ||||||||||
REIT conversion and reorganization costs | 48,125 | — | — | — | 48,125 | ||||||||||
625,352 | 28,340 | 176,440 | 52,655 | 826,107 | |||||||||||
Depreciation and amortization | 252,925 | 16,069 | 85,345 | 20,104 | 342,305 | ||||||||||
Write-offs of abandoned development projects | 9,534 | 116 | 10,191 | — | 19,609 | ||||||||||
Impairment of real estate | 451,434 | — | 13,844 | — | 465,278 | ||||||||||
Total expenses | 1,339,245 | 44,525 | 285,820 | 72,759 | 1,653,299 | ||||||||||
Operating income (loss) | (361,014 | ) | 21,111 | 104,463 | 1,839 | (275,823 | ) | ||||||||
Interest and other income | 37,739 | 2,105 | 1,779 | — | 37,413 | ||||||||||
Net gain on disposition of full or partial interests in rental properties | 1,746 | — | 20,293 | — | 22,039 | ||||||||||
Net gain on change in control of interests | 486,279 | — | — | — | 486,279 | ||||||||||
Interest expense | (157,166 | ) | (9,158 | ) | (97,430 | ) | (18,861 | ) | (264,299 | ) | |||||
Amortization of mortgage procurement costs | (7,549 | ) | (285 | ) | (3,110 | ) | (226 | ) | (10,600 | ) | |||||
Loss on extinguishment of debt | (65,086 | ) | (719 | ) | (736 | ) | — | (65,103 | ) | ||||||
Earnings (loss) before income taxes | (65,051 | ) | 13,054 | 25,259 | (17,248 | ) | (70,094 | ) | |||||||
Income tax expense (benefit) | |||||||||||||||
Current | 7,187 | — | — | (5,849 | ) | 1,338 | |||||||||
Deferred | (588,286 | ) | — | — | (16,649 | ) | (604,935 | ) | |||||||
(581,099 | ) | — | — | (22,498 | ) | (603,597 | ) | ||||||||
Earnings (loss) from unconsolidated entities, gross of tax | 28,762 | 204 | (25,259 | ) | (40,760 | ) | (37,461 | ) | |||||||
Earnings (loss) from continuing operations | 544,810 | 13,258 | — | (35,510 | ) | 496,042 | |||||||||
Discontinued operations, net of tax | |||||||||||||||
Operating loss from rental properties | (27,520 | ) | (16,962 | ) | — | 10,558 | — | ||||||||
Equity in earnings (loss) | (24,952 | ) | — | — | 24,952 | — | |||||||||
(52,472 | ) | (16,962 | ) | — | 35,510 | — | |||||||||
Net earnings (loss) | 492,338 | (3,704 | ) | — | — | 496,042 | |||||||||
Noncontrolling interests | |||||||||||||||
Earnings from continuing operations attributable to noncontrolling interests, gross of tax | (13,258 | ) | (13,258 | ) | — | — | — | ||||||||
Loss from discontinued operations attributable to noncontrolling interests | 16,962 | 16,962 | — | — | — | ||||||||||
3,704 | 3,704 | — | — | — | |||||||||||
Net earnings attributable to Forest City Realty Trust, Inc. | $ | 496,042 | $ | — | $ | — | $ | — | $ | 496,042 | |||||
12
Forest City Realty Trust, Inc. and Subsidiaries
Selected Financial Information
Consolidated Statement of Operations – Three Months Ended December 31, 2014 (Unaudited)
Full Consolidation (GAAP) | Less Noncontrolling Interest | Plus Unconsolidated Investments at Pro-Rata | Plus Discontinued Operations | Pro-Rata Consolidation (Non-GAAP) | |||||||||||
(in thousands) | |||||||||||||||
Revenues | |||||||||||||||
Rental | $ | 135,947 | $ | 5,098 | $ | 74,568 | $ | — | $ | 205,417 | |||||
Tenant recoveries | 28,889 | 1,784 | 16,017 | — | 43,122 | ||||||||||
Service and management fees | 14,469 | 228 | 2,049 | — | 16,290 | ||||||||||
Parking and other | 15,493 | (442 | ) | 5,590 | — | 21,525 | |||||||||
Arena | — | — | — | 17,497 | 17,497 | ||||||||||
Land sales | 17,735 | 1,574 | 149 | — | 16,310 | ||||||||||
Subsidized Senior Housing | — | — | 12,005 | — | 12,005 | ||||||||||
Military Housing | 7,875 | — | 1,384 | — | 9,259 | ||||||||||
Total revenues | 220,408 | 8,242 | 111,762 | 17,497 | 341,425 | ||||||||||
Expenses | |||||||||||||||
Property operating and management | 101,044 | 4,494 | 26,903 | — | 123,453 | ||||||||||
Real estate taxes | 19,192 | 971 | 9,015 | — | 27,236 | ||||||||||
Ground rent | 2,922 | 88 | 3,656 | — | 6,490 | ||||||||||
Arena operating | — | — | — | 11,690 | 11,690 | ||||||||||
Cost of land sales | 6,376 | 404 | — | — | 5,972 | ||||||||||
Subsidized Senior Housing operating | — | — | 7,880 | — | 7,880 | ||||||||||
Military Housing operating | 1,265 | — | 770 | — | 2,035 | ||||||||||
Corporate general and administrative | 10,036 | — | — | — | 10,036 | ||||||||||
REIT conversion and reorganization costs | 5,697 | — | — | — | 5,697 | ||||||||||
146,532 | 5,957 | 48,224 | 11,690 | 200,489 | |||||||||||
Depreciation and amortization | 52,328 | 1,600 | 24,419 | 4,985 | 80,132 | ||||||||||
Write-offs of abandoned development projects and demolition costs | 266 | — | — | — | 266 | ||||||||||
Impairment of real estate | 146,300 | 261 | 3,124 | — | 149,163 | ||||||||||
Total expenses | 345,426 | 7,818 | 75,767 | 16,675 | 430,050 | ||||||||||
Operating income (loss) | (125,018 | ) | 424 | 35,995 | 822 | (88,625 | ) | ||||||||
Interest and other income | 8,806 | 2,180 | 590 | — | 7,216 | ||||||||||
Net loss on disposition of partial interest in development project | (708 | ) | — | — | — | (708 | ) | ||||||||
Net gain on disposition of full or partial interests in rental properties | 30,894 | — | 2,346 | — | 33,240 | ||||||||||
Net gain on change in control of interests | 227,901 | — | — | — | 227,901 | ||||||||||
Interest expense | (45,360 | ) | (1,494 | ) | (28,432 | ) | (4,834 | ) | (77,132 | ) | |||||
Amortization of mortgage procurement costs | (2,066 | ) | (74 | ) | (820 | ) | (165 | ) | (2,977 | ) | |||||
Loss on extinguishment of debt | (252 | ) | (11 | ) | (3,759 | ) | — | (4,000 | ) | ||||||
Earnings (loss) before income taxes | 94,197 | 1,025 | 5,920 | (4,177 | ) | 94,915 | |||||||||
Income tax expense (benefit) | |||||||||||||||
Current | (2,625 | ) | — | — | (81 | ) | (2,706 | ) | |||||||
Deferred | 30,746 | — | — | (1,855 | ) | 28,891 | |||||||||
28,121 | — | — | (1,936 | ) | 26,185 | ||||||||||
Earnings (loss) from unconsolidated entities, gross of tax | 7,185 | (16 | ) | (5,920 | ) | (820 | ) | 461 | |||||||
Earnings (loss) from continuing operations | 73,261 | 1,009 | — | (3,061 | ) | 69,191 | |||||||||
Discontinued operations, net of tax | |||||||||||||||
Operating loss from rental properties | (6,264 | ) | (3,706 | ) | — | 2,558 | — | ||||||||
Equity in earnings (loss) | (503 | ) | — | — | 503 | — | |||||||||
(6,767 | ) | (3,706 | ) | — | 3,061 | — | |||||||||
Net earnings (loss) | 66,494 | (2,697 | ) | — | — | 69,191 | |||||||||
Noncontrolling interests | |||||||||||||||
Earnings from continuing operations attributable to noncontrolling interests, gross of tax | (1,009 | ) | (1,009 | ) | — | — | — | ||||||||
Loss from discontinued operations attributable to noncontrolling interests | 3,706 | 3,706 | — | — | — | ||||||||||
2,697 | 2,697 | — | — | — | |||||||||||
Net earnings attributable to Forest City Realty Trust, Inc. | $ | 69,191 | $ | — | $ | — | $ | — | $ | 69,191 | |||||
13
Forest City Realty Trust, Inc. and Subsidiaries
Selected Financial Information
Consolidated Statement of Operations – Year Ended December 31, 2014 (Unaudited)
Full Consolidation (GAAP) | Less Noncontrolling Interest | Plus Unconsolidated Investments at Pro-Rata | Plus Discontinued Operations | Pro-Rata Consolidation (Non-GAAP) | |||||||||||
(in thousands) | |||||||||||||||
Revenues | |||||||||||||||
Rental | $ | 526,966 | $ | 16,189 | $ | 284,597 | $ | 4,015 | $ | 799,389 | |||||
Tenant recoveries | 118,035 | 7,018 | 71,547 | 1,377 | 183,941 | ||||||||||
Service and management fees | 50,522 | 323 | 7,456 | — | 57,655 | ||||||||||
Parking and other | 53,765 | 358 | 22,232 | 36 | 75,675 | ||||||||||
Arena | — | — | — | 64,045 | 64,045 | ||||||||||
Land sales | 68,102 | 6,548 | 2,837 | 1,601 | 65,992 | ||||||||||
Subsidized Senior Housing | — | — | 47,077 | — | 47,077 | ||||||||||
Military Housing | 31,967 | 1,358 | 5,605 | — | 36,214 | ||||||||||
Total revenues | 849,357 | 31,794 | 441,351 | 71,074 | 1,329,988 | ||||||||||
Expenses | |||||||||||||||
Property operating and management | 384,119 | 10,612 | 110,130 | 2,539 | 486,176 | ||||||||||
Real estate taxes | 78,637 | 3,375 | 36,871 | (667 | ) | 111,466 | |||||||||
Ground rent | 9,387 | 358 | 13,686 | — | 22,715 | ||||||||||
Arena operating | — | — | — | 42,284 | 42,284 | ||||||||||
Cost of land sales | 23,457 | 1,928 | 990 | 1,142 | 23,661 | ||||||||||
Subsidized Senior Housing operating | — | — | 30,822 | — | 30,822 | ||||||||||
Military Housing operating | 11,481 | 1,311 | 3,071 | — | 13,241 | ||||||||||
Corporate general and administrative | 45,419 | — | — | — | 45,419 | ||||||||||
REIT conversion and reorganization costs | 5,697 | — | — | — | 5,697 | ||||||||||
558,197 | 17,584 | 195,570 | 45,298 | 781,481 | |||||||||||
Depreciation and amortization | 196,167 | 4,828 | 88,923 | 20,948 | 301,210 | ||||||||||
Write-offs of abandoned development projects and demolition costs | 1,655 | — | — | — | 1,655 | ||||||||||
Impairment of real estate | 277,095 | 261 | 3,124 | — | 279,958 | ||||||||||
Total expenses | 1,033,114 | 22,673 | 287,617 | 66,246 | 1,364,304 | ||||||||||
Operating income (loss) | (183,757 | ) | 9,121 | 153,734 | 4,828 | (34,316 | ) | ||||||||
Interest and other income | 42,780 | 3,681 | 883 | — | 39,982 | ||||||||||
Net loss on disposition of partial interest in development project | (20,298 | ) | (3,379 | ) | — | — | (16,919 | ) | |||||||
Net gain on disposition of full or partial interests in rental properties | 30,281 | 27 | 52,421 | 28,042 | 110,717 | ||||||||||
Net gain on change in control of interests | 230,660 | — | — | — | 230,660 | ||||||||||
Interest expense | (194,176 | ) | (5,649 | ) | (110,195 | ) | (24,647 | ) | (323,369 | ) | |||||
Amortization of mortgage procurement costs | (7,797 | ) | (211 | ) | (3,217 | ) | (286 | ) | (11,089 | ) | |||||
Loss on extinguishment of debt | (1,179 | ) | (48 | ) | (3,743 | ) | (448 | ) | (5,322 | ) | |||||
Earnings (loss) before income taxes | (103,486 | ) | 3,542 | 89,883 | 7,489 | (9,656 | ) | ||||||||
Income tax expense (benefit) | |||||||||||||||
Current | 12,515 | — | — | (2,554 | ) | 9,961 | |||||||||
Deferred | (21,670 | ) | — | — | 6,595 | (15,075 | ) | ||||||||
(9,155 | ) | — | — | 4,041 | (5,114 | ) | |||||||||
Earnings (loss) from unconsolidated entities, gross of tax | 90,089 | 78 | (89,883 | ) | (3,181 | ) | (3,053 | ) | |||||||
Earnings (loss) from continuing operations | (4,242 | ) | 3,620 | — | 267 | (7,595 | ) | ||||||||
Discontinued operations, net of tax | |||||||||||||||
Operating loss from rental properties | (29,686 | ) | (17,103 | ) | — | 12,583 | — | ||||||||
Gain on disposition of rental properties | 14,856 | 58 | — | (14,798 | ) | — | |||||||||
Equity in earnings (loss) | (1,948 | ) | — | — | 1,948 | — | |||||||||
(16,778 | ) | (17,045 | ) | — | (267 | ) | — | ||||||||
Net loss | (21,020 | ) | (13,425 | ) | — | — | (7,595 | ) | |||||||
Noncontrolling interests | |||||||||||||||
Earnings from continuing operations attributable to noncontrolling interests, gross of tax | (3,620 | ) | (3,620 | ) | — | — | — | ||||||||
Loss from discontinued operations attributable to noncontrolling interests | 17,045 | 17,045 | — | — | — | ||||||||||
13,425 | 13,425 | — | — | — | |||||||||||
Net loss attributable to Forest City Realty Trust, Inc. | $ | (7,595 | ) | $ | — | $ | — | $ | — | $ | (7,595 | ) | |||
14
Forest City Realty Trust, Inc. and Subsidiaries
Selected Financial Information
Net Asset Value Components – December 31, 2015
The following represents components of our business relevant to calculate Net Asset Value (“NAV”), a non-GAAP measure. There is no directly comparable GAAP financial measure to NAV. We consider NAV to be a useful supplemental measure which assists both management and investors to estimate the fair value of our Company. The calculation of NAV involves significant estimates and can be calculated using various methods. Each individual investor must determine the specific methodology, assumptions and estimates to use to arrive at an estimated NAV of the Company.
The components of NAV do not consider the potential changes in rental and fee income streams or development platform. The components include non-GAAP financial measures, such as NOI and information related to our rental properties business prepared using the pro-rata consolidation method. Although these measures are not presented in accordance with GAAP, investors can use these non-GAAP measures as supplementary information to evaluate our business. The non-GAAP measures presented are not intended to be performance measures that should be regarded as alternatives to, or more meaningful than, our GAAP measures.
Net Asset Value Components - December 31, 2015 | |||||||||||||||||||
Completed Rental Properties | |||||||||||||||||||
Q4 2015 | Net Stabilized | Stabilized | Annualized | Nonrecourse | |||||||||||||||
(Dollars in millions at pro-rata) | NOI (1) | Adjustments (2) | NOI | Stabilized NOI (3) | Debt (4) | ||||||||||||||
Commercial Real Estate | A | B | =A+B | ||||||||||||||||
Retail | |||||||||||||||||||
Regional Malls | $ | 33.5 | $ | (3.2 | ) | $ | 30.3 | $ | 121.2 | $ | (1,184.7 | ) | |||||||
Specialty Retail Centers | 14.1 | 0.6 | 14.7 | 58.8 | (516.4 | ) | |||||||||||||
Subtotal Retail | $ | 47.6 | $ | (2.6 | ) | $ | 45.0 | $ | 180.0 | $ | (1,701.1 | ) | |||||||
Office | |||||||||||||||||||
Life Science | $ | 22.3 | $ | 0.4 | $ | 22.7 | $ | 90.8 | $ | (604.2 | ) | ||||||||
New York | 35.1 | 1.2 | 36.3 | 145.2 | (1,068.0 | ) | |||||||||||||
Central Business District | 4.5 | (0.2 | ) | 4.3 | 17.2 | (57.3 | ) | ||||||||||||
Suburban/Other | 3.8 | — | 3.8 | 15.2 | (102.4 | ) | |||||||||||||
Subtotal Office | $ | 65.7 | $ | 1.4 | $ | 67.1 | $ | 268.4 | $ | (1,831.9 | ) | ||||||||
Arena | $ | 8.5 | $ | (8.5 | ) | $ | — | $ | — | $ | — | ||||||||
Residential Real Estate | |||||||||||||||||||
Apartments, Core Markets | $ | 31.0 | $ | 3.0 | $ | 34.0 | $ | 136.0 | $ | (1,372.3 | ) | ||||||||
Apartments, Non-Core Markets (5) | 10.2 | 0.9 | 11.1 | 44.4 | (348.5 | ) | |||||||||||||
Subsidized Senior Housing | 4.7 | (0.3 | ) | 4.4 | 17.8 | (139.2 | ) | ||||||||||||
Military Housing | 7.0 | (2.7 | ) | 4.3 | 17.0 | (28.5 | ) | ||||||||||||
Subtotal Residential | $ | 52.9 | $ | 0.9 | $ | 53.8 | $ | 215.2 | $ | (1,888.5 | ) | ||||||||
Subtotal | $ | 174.7 | $ | (8.8 | ) | $ | 165.9 | $ | 663.6 | $ | (5,421.5 | ) | |||||||
Other | (12.3 | ) | 3.5 | (8.8 | ) | (35.0 | ) | — | |||||||||||
Grand Total | $ | 162.4 | $ | (5.3 | ) | $ | 157.1 | $ | 628.6 | $ | (5,421.5 | ) | |||||||
Development Pipeline | Book Value (4) | ||||||||||||||||||
Projects under construction | $ | 527.2 | $ | (111.0 | ) | ||||||||||||||
Projects under development | $ | 509.0 | $ | (185.7 | ) | ||||||||||||||
Land inventory | $ | 72.9 | $ | (8.6 | ) | ||||||||||||||
Other Tangible Assets | |||||||||||||||||||
Cash and equivalents | $ | 309.9 | |||||||||||||||||
Restricted cash | $ | 273.6 | |||||||||||||||||
Notes and accounts receivable, net (6) | $ | 423.1 | |||||||||||||||||
Net investments and advances to unconsolidated entities | $ | 106.8 | |||||||||||||||||
Prepaid expenses and other deferred costs, net | $ | 119.2 | |||||||||||||||||
Net proceeds from assets held for sale and Westchester's Ridge Hill (7) | $ | 506.7 | |||||||||||||||||
Recourse Debt and Other Liabilities | |||||||||||||||||||
Revolving credit facility | $ | — | |||||||||||||||||
Convertible senior debt | $ | (271.0 | ) | ||||||||||||||||
Less: convertible debt | $ | 271.0 | |||||||||||||||||
Construction payables | $ | (142.8 | ) | ||||||||||||||||
Operating accounts payable and accrued expenses (8) | $ | (752.7 | ) | ||||||||||||||||
Share Data (in millions) | |||||||||||||||||||
Diluted weighted average number of shares for the three months ended December 31, 2015 | 273.6 | ||||||||||||||||||
15
Forest City Realty Trust, Inc. and Subsidiaries
Selected Financial Information
Net Asset Value Components – December 31, 2015 (continued)
(1) | Q4 2015 NOI is reconciled to NOI at full consolidation by Product Group for the three months ended December 31, 2015 in the Supplemental Operating Information section of this supplemental package. |
(2) | The net stabilized adjustments column represents net adjustments assumed to arrive at an estimated annualized stabilized NOI for properties currently in initial lease-up periods, net of the removal of partial period NOI for recently sold properties. The following properties are currently in their initial lease-up periods: |
Cost at 100% | Cost at Pro-Rata Share | Lease Commitment % as of | |||||
Property | February 16, 2016 | ||||||
(in millions) | |||||||
Apartments: | |||||||
Winchester Lofts (Non-Core Market) | $ | 62.8 | $ | 62.8 | 92% | ||
Aster Town Center North (Core Market) | $ | 23.4 | $ | 21.1 | 43% | ||
a) | NOI for the apartments in the above table is reflected at 5% of the pro-rata cost. This assumption does not reflect our anticipated NOI, but rather is used in order to establish a hypothetical basis for an estimated valuation of leased-up properties. |
b) | On January 29, 2016, through our investment in Nets Sports and Entertainment, LLC sold our 55% ownership interest in the Arena and 20% ownership interest in the Nets, collectively (the “Disposal Group”), to Onexim Sports and Entertainment Holdings USA, Inc. As a result, we removed partial period NOI for the Arena. |
In addition, we include stabilization adjustments to the Q4 2015 NOI as follows:
c) | On January 29, 2016, we closed on the creation of a joint venture with QIC, in which QIC acquired 51% of our equity ownership of Westchester’s Ridge Hill. Due to the ongoing lease up at Westchester’s Ridge Hill (Regional Mall), we have included a stabilization adjustment to the Q4 2015 NOI to arrive at our 2016 estimate of annualized stabilized NOI following the disposition of our partial interest. |
d) | Due to quarterly fluctuations in our regional malls, primarily due to seasonality, we have included a stabilization adjustment of $1.5 million to reduce Q4 2015 NOI. |
e) | Due to a temporary decline in occupancy at 88 Sidney Street (Life Science), we have included a stabilization adjustment to the Q4 2015 NOI to arrive at our estimate of stabilized NOI. |
f) | Due to planned renovations at Ballston Quarter (Regional Mall), we have included a stabilization adjustment to the Q4 2015 NOI to arrive at our estimate of stabilized NOI. |
g) | Due to quarterly fluctuations of NOI as a result of distribution restrictions from our limited-distribution subsidized senior housing properties, we have included a stabilization adjustment to the Q4 2015 NOI to arrive at our estimate of stabilized NOI. Our updated estimate of stabilized NOI is based on the 2015 annual NOI of $17.8 million. |
h) | At the conclusion of the initial development period at each of our military housing communities, we estimate the ongoing property and asset management fees, net of operating expenses, to be $17.0 million. |
i) | Other excludes participation payments of $1.0 million and certain variable development and operating overhead. |
The net stabilized adjustments are not comparable to any GAAP measure and therefore do not have a reconciliation to the nearest comparable GAAP measure.
(3) | Pro-rata annualized stabilized NOI is calculated by taking the Q4 2015 stabilized NOI times a multiple of four. |
(4) | Amounts are derived from the respective pro-rata balance sheet line item as of December 31, 2015 and are reconciled to their GAAP equivalents in the Selected Financial Information section of this supplemental package. Due to the disposition of our partial interest in Westchester’s Ridge Hill to QIC, we have removed nonrecourse debt of $169.4 million attributable to this property. Assets and liabilities held for sale for the Disposal Group are excluded from each pro-rata balance sheet line item. |
(5) | Includes NOI of $0.4 million ($1.6 million annualized) and nonrecourse debt of $10.4 million related to 3 consolidated properties included in a master purchase and sale agreement for the sale of 47 (44 unconsolidated investments, included in “Subsidized Senior Housing” and 3 consolidated properties, included in “Apartments, Non-Core Markets”) federally assisted housing apartment communities. |
(6) | Includes $159.7 million of straight-line rent receivable (net of $10.8 million of allowance for doubtful accounts). |
16
Forest City Realty Trust, Inc. and Subsidiaries
Selected Financial Information
Net Asset Value Components – December 31, 2015 (continued)
(7) | Subsequent to December 31, 2015, we sold our ownership interest in the Arena, the Nets and a development opportunity, comprised of land at 625 Fulton Avenue, in Brooklyn, New York. These represent assets and liabilities held for sale on our consolidated balance sheet. Net proceeds from assets held for sale and the partial disposition in Westchester’s Ridge Hill to QIC are as follows: |
Net Proceeds | Note Receivable Maturity Date | |||
(in millions) | ||||
Arena: | ||||
Net Cash Proceeds | $ | 54.0 | ||
Note Receivable | 92.6 | January 29, 2019 | ||
146.6 | ||||
625 Fulton Avenue - Land: | ||||
Net Cash Proceeds | 94.0 | |||
Note Receivable | 58.0 | April 12, 2016 | ||
152.0 | ||||
Nets - Note Receivable | 125.1 | January 29, 2021 | ||
Westchester’s Ridge Hill - Net Cash Proceeds | 83.0 | |||
$ | 506.7 | |||
(8) | Includes $60.4 million of straight-line rent payable. |
Net Asset Value Components - Stabilized NOI - Q3 2015 vs. Q4 2015
The following represents the quarterly change in stabilized NOI used to estimate NAV, as a result of recent property openings, acquisitions or sales, as well as other portfolio changes. GAAP reconciliations for beginning period can be found in prior supplemental packages furnished with the SEC and are available on our website at www.forestcity.net.
Net Asset Value Components - Stabilized NOI | |||||||||||||||||||||||
Stabilized Adjustments | |||||||||||||||||||||||
Q3 2015 | Property | Property | Property | Portfolio | Q4 2015 | ||||||||||||||||||
(Dollars in millions at pro-rata) | Stabilized NOI | Openings | Acquisitions | Sales | NOI Changes | Stabilized NOI | |||||||||||||||||
Commercial Real Estate | |||||||||||||||||||||||
Retail | |||||||||||||||||||||||
Regional Malls | $ | 35.1 | $ | — | $ | — | $ | (5.6 | ) | $ | 0.8 | $ | 30.3 | ||||||||||
Specialty Retail Centers | 14.3 | — | — | — | 0.4 | 14.7 | |||||||||||||||||
Subtotal Retail | $ | 49.4 | $ | — | $ | — | $ | (5.6 | ) | $ | 1.2 | $ | 45.0 | ||||||||||
Office | |||||||||||||||||||||||
Life Science | $ | 23.1 | $ | — | $ | — | $ | — | $ | (0.4 | ) | $ | 22.7 | ||||||||||
New York | 35.4 | — | — | — | 0.9 | 36.3 | |||||||||||||||||
Central Business District | 4.0 | — | — | — | 0.3 | 4.3 | |||||||||||||||||
Suburban/Other | 3.6 | — | — | — | 0.2 | 3.8 | |||||||||||||||||
Subtotal Office | $ | 66.1 | $ | — | $ | — | $ | — | $ | 1.0 | $ | 67.1 | |||||||||||
Arena | $ | 7.6 | $ | — | $ | — | $ | (7.6 | ) | $ | — | $ | — | ||||||||||
Residential Real Estate | |||||||||||||||||||||||
Apartments, Core Markets | $ | 33.9 | $ | 0.3 | $ | — | $ | — | $ | (0.2 | ) | $ | 34.0 | ||||||||||
Apartments, Non-Core Markets | 11.6 | — | — | — | (0.5 | ) | 11.1 | ||||||||||||||||
Subsidized Senior Housing | 4.1 | — | — | — | 0.3 | 4.4 | |||||||||||||||||
Military Housing | 4.3 | — | — | — | — | 4.3 | |||||||||||||||||
Subtotal Residential | $ | 53.9 | $ | 0.3 | $ | — | $ | — | $ | (0.4 | ) | $ | 53.8 | ||||||||||
Subtotal | $ | 177.0 | $ | 0.3 | $ | — | $ | (13.2 | ) | $ | 1.8 | $ | 165.9 | ||||||||||
Other | (8.8 | ) | — | — | — | — | (8.8 | ) | |||||||||||||||
Grand Total | $ | 168.2 | $ | 0.3 | $ | — | $ | (13.2 | ) | $ | 1.8 | $ | 157.1 | ||||||||||
17
(THIS PAGE INTENTIONALLY LEFT BLANK)
18
Forest City Realty Trust, Inc. and Subsidiaries
Supplemental Operating Information
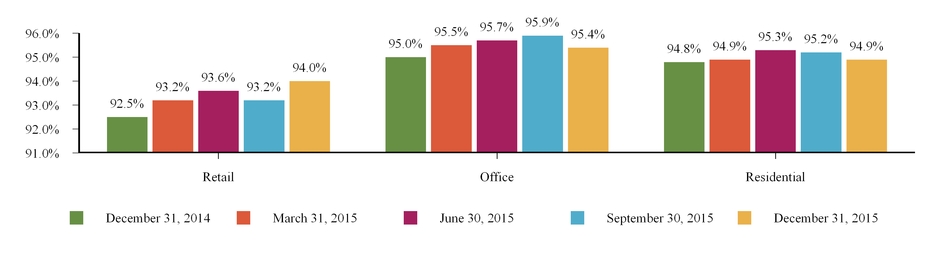
Occupancy Data
Retail and office occupancy data represents leased occupancy at the end of the quarter. Leased occupancy percentage is calculated by dividing the sum of the total tenant occupied space under the lease and vacant space under lease by gross leasable area (“GLA”). Occupancy data includes leases with original terms of one year or less.
Leased Occupancy | ||
As of December 31, | ||
Retail | 2015 | 2014 |
Comparable | 94.0% | 92.5% |
Total | 93.7% | 92.3% |
Office | ||
Comparable | 95.4% | 94.9% |
Total | 94.4% | 94.4% |
Residential occupancy data represents economic occupancy, which is calculated by dividing the period-to-date gross potential rent less vacancy by gross potential rent. Residential occupancy data excludes military and limited-distribution subsidized senior housing units.
Economic Occupancy | ||
Years Ended December 31, | ||
Residential | 2015 | 2014 |
Comparable | 94.9% | 94.9% |
Total | 93.7% | 92.2% |
The graph below provides comparable leased and economic occupancy data as reported in previous quarters. Prior period amounts may differ from above since the properties qualifying as comparable change from period to period.
Comparable Occupancy Percentage Trend
19
Forest City Realty Trust, Inc. and Subsidiaries
Supplemental Operating Information
Retail Sales Data
The following provides retail sales data for small shop inline tenants at our regional malls. We believe this data allows investors to better understand the productivity of our small shop inline tenants.
The graph below represents regional mall sales for tenants that were open and operating for the duration of each rolling 12-month period presented. Those tenants that have begun and/or ceased operations in the rolling 12-month periods shown are not included.
FCE Regional Mall Sales per Square Foot (1)
Rolling 12-month basis for periods presented
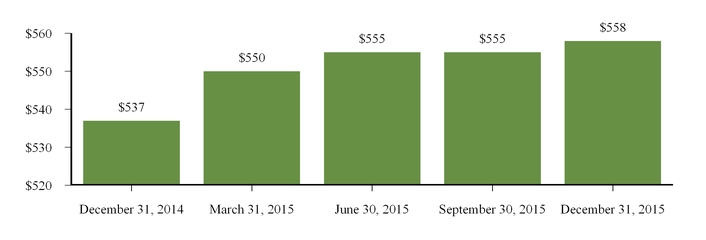
(1) | All sales data is derived from schedules provided by our tenants and is not subject to the same internal control and verification procedures applied to other data supplied in this supplemental package. |
20
Forest City Realty Trust, Inc. and Subsidiaries
Supplemental Operating Information
Leasing Summary
Retail Centers
The following tables represent those new leases and GLA signed and rent per square foot (“SF”) on the same space in which there was a former tenant and existing tenant renewals.
Regional Malls
Quarter | Number of Leases Signed | GLA Signed | Contractual Rent Per SF (1) | Expired Rent Per SF (1) | Cash Basis % Change over Prior Rent | ||||||||||||
Q1 2015 | 34 | 169,951 | $ | 46.51 | $ | 36.92 | 26.0 | % | |||||||||
Q2 2015 | 21 | 48,967 | $ | 63.79 | $ | 49.62 | 28.6 | % | |||||||||
Q3 2015 | 38 | 174,228 | $ | 46.82 | $ | 37.55 | 24.7 | % | |||||||||
Q4 2015 | 23 | 81,251 | $ | 51.34 | $ | 39.91 | 28.6 | % | |||||||||
Total | 116 | 474,397 | $ | 49.23 | $ | 38.98 | 26.3 | % | |||||||||
Specialty Retail Centers
Quarter | Number of Leases Signed | GLA Signed | Contractual Rent Per SF (1) | Expired Rent Per SF (1) | Cash Basis % Change over Prior Rent | ||||||||||||
Q1 2015 | 11 | 40,421 | $ | 34.55 | $ | 35.41 | (2.4 | )% | |||||||||
Q2 2015 | 7 | 42,562 | $ | 31.74 | $ | 29.95 | 6.0 | % | |||||||||
Q3 2015 | 3 | 45,814 | $ | 36.81 | $ | 33.78 | 9.0 | % | |||||||||
Q4 2015 | 2 | 2,334 | $ | 39.61 | $ | 27.51 | 44.0 | % | |||||||||
Total | 23 | 131,131 | $ | 34.52 | $ | 32.92 | 4.9 | % | |||||||||
Office Buildings
The following table represents those new leases and GLA signed on the same space in which there was a former tenant and existing tenant renewals along with all other new leases signed within the rolling 12-month period.
Same-Space Leases | Other New Leases | ||||||||||||||||||||||
Quarter | Number of Leases Signed | GLA Signed | Contractual Rent Per SF (1) | Expired Rent Per SF (1) | Cash Basis % Change over Prior Rent | Number of Leases Signed | GLA Signed | Contractual Rent Per SF (1) | Total GLA Signed | ||||||||||||||
Q1 2015 | 18 | 75,460 | $ | 22.49 | $ | 21.40 | 5.1 | % | 2 | 8,196 | $ | 21.94 | 83,656 | ||||||||||
Q2 2015 | 24 | 223,312 | $ | 33.34 | $ | 31.82 | 4.8 | % | 4 | 4,696 | $ | 20.89 | 228,008 | ||||||||||
Q3 2015 | 12 | 168,622 | $ | 69.08 | $ | 68.50 | 0.8 | % | 2 | 5,582 | $ | 17.18 | 174,204 | ||||||||||
Q4 2015 | 25 | 156,299 | $ | 19.90 | $ | 19.85 | 0.3 | % | 5 | 6,023 | $ | 17.28 | 162,322 | ||||||||||
Total | 79 | 623,693 | $ | 38.32 | $ | 37.48 | 2.2 | % | 13 | 24,497 | $ | 19.51 | 648,190 | ||||||||||
(1) | Retail and Office contractual rent per square foot includes base rent and fixed additional charges for common area maintenance and real estate taxes as of rental commencement. Retail contractual rent per square foot also includes fixed additional marketing/promotional charges. For all expiring leases, contractual rent per square foot includes any applicable escalations. |
21
Forest City Realty Trust, Inc. and Subsidiaries
Supplemental Operating Information
Apartment Communities
The following tables present leasing information of our apartment communities. Prior period amounts may differ from data as reported in previous quarters since the properties that qualify as comparable change from period to period.
Quarterly Comparison
Monthly Average Residential Rental Rates (2) | Economic Residential Occupancy | |||||||||||||||||
Comparable Apartment | Leasable Units | Three Months Ended December 31, | Three Months Ended December 31, | |||||||||||||||
Communities (1) | at Pro-Rata % (3) | 2015 | 2014 | % Change | 2015 | 2014 | % Change | |||||||||||
Core Markets | 8,170 | $ | 1,931 | $ | 1,859 | 3.9 | % | 95.1 | % | 95.5 | % | (0.4 | )% | |||||
Non-Core Markets | 7,529 | $ | 921 | $ | 890 | 3.5 | % | 91.4 | % | 94.0 | % | (2.6 | )% | |||||
Total Comparable Apartments | 15,699 | $ | 1,446 | $ | 1,394 | 3.7 | % | 94.0 | % | 95.1 | % | (1.1 | )% | |||||
Year-to-Date Comparison
Monthly Average Residential Rental Rates (2) | Economic Residential Occupancy | |||||||||||||||||
Comparable Apartment | Leasable Units | Years Ended December 31, | Years Ended December 31, | |||||||||||||||
Communities (1) | at Pro-Rata % (3) | 2015 | 2014 | % Change | 2015 | 2014 | % Change | |||||||||||
Core Markets | 7,967 | $ | 1,912 | $ | 1,852 | 3.2 | % | 95.5 | % | 95.5 | % | — | ||||||
Non-Core Markets | 7,401 | $ | 897 | $ | 873 | 2.7 | % | 93.4 | % | 93.4 | % | — | ||||||
Total Comparable Apartments | 15,368 | $ | 1,423 | $ | 1,380 | 3.1 | % | 94.9 | % | 94.9 | % | — | ||||||
Sequential Comparison
Monthly Average Residential Rental Rates (2) | Economic Residential Occupancy | |||||||||||||||||
Three Months Ended | Three Months Ended | |||||||||||||||||
Comparable Apartment | Leasable Units | December 31, | September 30, | December 31, | September 30, | |||||||||||||
Communities (1) | at Pro-Rata % (3) | 2015 | 2015 | % Change | 2015 | 2015 | % Change | |||||||||||
Core Markets | 8,924 | $ | 1,958 | $ | 1,935 | 1.2 | % | 94.7 | % | 95.6 | % | (0.9 | )% | |||||
Non-Core Markets | 8,549 | $ | 932 | $ | 928 | 0.4 | % | 91.9 | % | 93.9 | % | (2.0 | )% | |||||
Total Comparable Apartments | 17,473 | $ | 1,456 | $ | 1,443 | 0.9 | % | 93.9 | % | 95.0 | % | (1.1 | )% | |||||
(1) | Includes stabilized apartment communities completely opened and operated in the periods presented. These apartment communities include units leased at affordable apartment rates which provide a discount from average market rental rates. For the three months ended December 31, 2015, 17.1% of leasable units in core markets and 4.2% of leasable units in non-core markets were affordable housing units. Excludes all military and limited-distribution subsidized senior housing units. |
(2) | Represents gross potential rent less concessions. |
(3) | Leasable units at pro-rata represent our share of comparable leasable units at the apartment community. |
22
(THIS PAGE INTENTIONALLY LEFT BLANK)
23
Forest City Realty Trust, Inc. and Subsidiaries
Supplemental Operating Information
Comparable NOI - Pro-Rata
Three Months Ended | Year Ended | ||||
December 31, 2015 | December 31, 2015 | ||||
Retail | 4.2 | % | 5.1 | % | |
Office | 7.6 | % | 4.9 | % | |
Apartments | 5.6 | % | 4.7 | % | |
Total | 5.9 | % | 4.9 | % | |
The tables below provide the percentage change of Comparable NOI as reported in previous quarters. GAAP reconciliations for previous periods can be found in prior supplemental packages furnished with the SEC and are available on our website at www.forestcity.net.
Quarterly Historical Trends | Annual Historical Trends | |||||||||||||||||||||||||
Three Months Ended | Year Ended | Year Ended | 11 Months Ended | |||||||||||||||||||||||
December 31, 2015 | September 30, 2015 | June 30, 2015 | March 31, 2015 | December 31, 2014 | December 31, 2015 | December 31, 2014 | December 31, 2013 | |||||||||||||||||||
Retail | 4.2 | % | 4.9 | % | 4.4 | % | 6.4 | % | 10.5 | % | Retail | 5.1 | % | 2.6 | % | 3.6 | % | |||||||||
Office | 7.6 | % | 4.5 | % | 2.4 | % | 4.4 | % | 9.2 | % | Office | 4.9 | % | 6.6 | % | (6.4 | )% | |||||||||
Apartments | 5.6 | % | 2.2 | % | 5.2 | % | 5.5 | % | 2.8 | % | Apartments | 4.7 | % | 4.3 | % | 4.7 | % | |||||||||
Total | 5.9 | % | 3.9 | % | 3.8 | % | 5.3 | % | 7.7 | % | Total | 4.9 | % | 4.8 | % | (0.2 | )% | |||||||||
24
Forest City Realty Trust, Inc. and Subsidiaries
Supplemental Operating Information
Net Operating Income (in thousands) | |||||||||||||||||||||||||||||
Three Months Ended December 31, 2015 | Three Months Ended December 31, 2014 | % Change | |||||||||||||||||||||||||||
Full Consolidation (1) | Less Noncontrolling Interest | Plus Discontinued Operations | Pro-Rata Consolidation (Non-GAAP) | Full Consolidation (1) | Less Noncontrolling Interest | Plus Discontinued Operations | Pro-Rata Consolidation (Non-GAAP) | Full Consolidation (1) | Pro-Rata Consolidation (Non-GAAP) | ||||||||||||||||||||
Retail | |||||||||||||||||||||||||||||
Comparable | |||||||||||||||||||||||||||||
Adjusted revenues | $ | 84,545 | $ | — | $ | — | $ | 84,545 | $ | 79,887 | $ | — | $ | — | $ | 79,887 | 5.8 | % | 5.8 | % | |||||||||
Adjusted operating expenses | 37,766 | — | — | 37,766 | 35,006 | — | — | 35,006 | 7.9 | % | 7.9 | % | |||||||||||||||||
Comparable NOI | 46,779 | — | — | 46,779 | 44,881 | — | — | 44,881 | 4.2 | % | 4.2 | % | |||||||||||||||||
Non-Comparable NOI | 810 | — | — | 810 | 4,851 | — | — | 4,851 | |||||||||||||||||||||
Total | 47,589 | — | — | 47,589 | 49,732 | — | — | 49,732 | |||||||||||||||||||||
Office Buildings | |||||||||||||||||||||||||||||
Comparable | |||||||||||||||||||||||||||||
Adjusted revenues | 106,015 | 5,006 | — | 101,009 | 101,077 | 4,862 | — | 96,215 | 4.9 | % | 5.0 | % | |||||||||||||||||
Adjusted operating expenses | 45,170 | 2,521 | — | 42,649 | 44,464 | 2,499 | — | 41,965 | 1.6 | % | 1.6 | % | |||||||||||||||||
Comparable NOI | 60,845 | 2,485 | — | 58,360 | 56,613 | 2,363 | — | 54,250 | 7.5 | % | 7.6 | % | |||||||||||||||||
Non-Comparable NOI | 7,099 | (220 | ) | — | 7,319 | 1,524 | (18 | ) | — | 1,542 | |||||||||||||||||||
Total | 67,944 | 2,265 | — | 65,679 | 58,137 | 2,345 | — | 55,792 | |||||||||||||||||||||
Apartments | |||||||||||||||||||||||||||||
Comparable | |||||||||||||||||||||||||||||
Adjusted revenues | 74,053 | 4,542 | — | 69,511 | 72,038 | 4,169 | — | 67,869 | 2.8 | % | 2.4 | % | |||||||||||||||||
Adjusted operating expenses | 32,189 | 1,723 | — | 30,466 | 32,529 | 1,648 | — | 30,881 | (1.0 | )% | (1.3 | )% | |||||||||||||||||
Comparable NOI | 41,864 | 2,819 | — | 39,045 | 39,509 | 2,521 | — | 36,988 | 6.0 | % | 5.6 | % | |||||||||||||||||
Non-Comparable NOI | 5,497 | 3,331 | — | 2,166 | (3,491 | ) | (3,335 | ) | — | (156 | ) | ||||||||||||||||||
Total | 47,361 | 6,150 | — | 41,211 | 36,018 | (814 | ) | — | 36,832 | ||||||||||||||||||||
Arena | — | — | 8,489 | 8,489 | — | — | 5,826 | 5,826 | |||||||||||||||||||||
Subsidized Senior Housing | 4,650 | — | — | 4,650 | 4,125 | — | — | 4,125 | |||||||||||||||||||||
Military Housing | 6,998 | — | — | 6,998 | 7,224 | — | — | 7,224 | |||||||||||||||||||||
Straight-line rent adjustments | 13 | 18 | 31 | 26 | 2,812 | 60 | (19 | ) | 2,733 | ||||||||||||||||||||
Participation payments | (1,002 | ) | — | — | (1,002 | ) | (1,075 | ) | — | — | (1,075 | ) | |||||||||||||||||
Other (2) | (12,359 | ) | (1,085 | ) | — | (11,274 | ) | (15,898 | ) | (571 | ) | — | (15,327 | ) | |||||||||||||||
Total NOI | |||||||||||||||||||||||||||||
Comparable | |||||||||||||||||||||||||||||
Adjusted revenues | 264,613 | 9,548 | — | 255,065 | 253,002 | 9,031 | — | 243,971 | 4.6 | % | 4.5 | % | |||||||||||||||||
Adjusted operating expenses | 115,125 | 4,244 | — | 110,881 | 111,999 | 4,147 | — | 107,852 | 2.8 | % | 2.8 | % | |||||||||||||||||
Comparable NOI | 149,488 | 5,304 | — | 144,184 | 141,003 | 4,884 | — | 136,119 | 6.0 | % | 5.9 | % | |||||||||||||||||
Non-Comparable NOI | 11,706 | 2,044 | 8,520 | 18,182 | 72 | (3,864 | ) | 5,807 | 9,743 | ||||||||||||||||||||
Grand Total | $ | 161,194 | $ | 7,348 | $ | 8,520 | $ | 162,366 | $ | 141,075 | $ | 1,020 | $ | 5,807 | $ | 145,862 | |||||||||||||
(1) | Includes the Company’s pro-rata share of NOI from unconsolidated subsidiaries accounted for under the equity method of accounting. |
(2) | Includes non-capitalizable development costs and unallocated management and service company overhead. |
25
Forest City Realty Trust, Inc. and Subsidiaries
Supplemental Operating Information
Net Operating Income (in thousands) | |||||||||||||||||||||||||||||
Year Ended December 31, 2015 | Year Ended December 31, 2014 | % Change | |||||||||||||||||||||||||||
Full Consolidation (1) | Less Noncontrolling Interest | Plus Discontinued Operations | Pro-Rata Consolidation (Non-GAAP) | Full Consolidation (1) | Less Noncontrolling Interest | Plus Discontinued Operations | Pro-Rata Consolidation (Non-GAAP) | Full Consolidation (1) | Pro-Rata Consolidation (Non-GAAP) | ||||||||||||||||||||
Retail | |||||||||||||||||||||||||||||
Comparable | |||||||||||||||||||||||||||||
Adjusted revenues | $ | 312,495 | $ | — | $ | — | $ | 312,495 | $ | 301,246 | $ | — | $ | — | $ | 301,246 | 3.7 | % | 3.7 | % | |||||||||
Adjusted operating expenses | 140,672 | — | — | 140,672 | 137,735 | — | — | 137,735 | 2.1 | % | 2.1 | % | |||||||||||||||||
Comparable NOI | 171,823 | — | — | 171,823 | 163,511 | — | — | 163,511 | 5.1 | % | 5.1 | % | |||||||||||||||||
Non-Comparable NOI | 12,528 | — | — | 12,528 | 15,738 | (34 | ) | 3,678 | 19,450 | ||||||||||||||||||||
Total | 184,351 | — | — | 184,351 | 179,249 | (34 | ) | 3,678 | 182,961 | ||||||||||||||||||||
Office Buildings | |||||||||||||||||||||||||||||
Comparable | |||||||||||||||||||||||||||||
Adjusted revenues | 419,412 | 19,793 | — | 399,619 | 403,894 | 18,977 | — | 384,917 | 3.8 | % | 3.8 | % | |||||||||||||||||
Adjusted operating expenses | 180,487 | 9,988 | — | 170,499 | 176,403 | 9,826 | — | 166,577 | 2.3 | % | 2.4 | % | |||||||||||||||||
Comparable NOI | 238,925 | 9,805 | — | 229,120 | 227,491 | 9,151 | — | 218,340 | 5.0 | % | 4.9 | % | |||||||||||||||||
Non-Comparable NOI | 19,883 | 186 | — | 19,697 | 5,949 | 193 | (43 | ) | 5,713 | ||||||||||||||||||||
Total | 258,808 | 9,991 | — | 248,817 | 233,440 | 9,344 | (43 | ) | 224,053 | ||||||||||||||||||||
Apartments | |||||||||||||||||||||||||||||
Comparable | |||||||||||||||||||||||||||||
Adjusted revenues | 288,464 | 17,608 | — | 270,856 | 278,765 | 16,304 | — | 262,461 | 3.5 | % | 3.2 | % | |||||||||||||||||
Adjusted operating expenses | 123,786 | 6,477 | — | 117,309 | 122,195 | 6,326 | — | 115,869 | 1.3 | % | 1.2 | % | |||||||||||||||||
Comparable NOI | 164,678 | 11,131 | — | 153,547 | 156,570 | 9,978 | — | 146,592 | 5.2 | % | 4.7 | % | |||||||||||||||||
Non-Comparable NOI | 23,822 | 13,619 | — | 10,203 | (1,223 | ) | (8,847 | ) | — | 7,624 | |||||||||||||||||||
Total | 188,500 | 24,750 | — | 163,750 | 155,347 | 1,131 | — | 154,216 | |||||||||||||||||||||
Arena | — | — | 21,864 | 21,864 | — | — | 21,739 | 21,739 | |||||||||||||||||||||
Subsidized Senior Housing | 17,841 | — | — | 17,841 | 16,255 | — | — | 16,255 | |||||||||||||||||||||
Military Housing | 26,614 | 732 | — | 25,882 | 23,020 | 47 | — | 22,973 | |||||||||||||||||||||
Straight-line rent adjustments | 4,580 | 162 | 79 | 4,497 | 5,525 | 139 | (57 | ) | 5,329 | ||||||||||||||||||||
Participation payments | (1,013 | ) | — | — | (1,013 | ) | (2,544 | ) | — | — | (2,544 | ) | |||||||||||||||||
Other (2) | (62,970 | ) | (3,114 | ) | — | (59,856 | ) | (66,066 | ) | (913 | ) | — | (65,153 | ) | |||||||||||||||
Total NOI | |||||||||||||||||||||||||||||
Comparable | |||||||||||||||||||||||||||||
Adjusted revenues | 1,020,371 | 37,401 | — | 982,970 | 983,905 | 35,281 | — | 948,624 | 3.7 | % | 3.6 | % | |||||||||||||||||
Adjusted operating expenses | 444,945 | 16,465 | — | 428,480 | 436,333 | 16,152 | — | 420,181 | 2.0 | % | 2.0 | % | |||||||||||||||||
Comparable NOI | 575,426 | 20,936 | — | 554,490 | 547,572 | 19,129 | — | 528,443 | 5.1 | % | 4.9 | % | |||||||||||||||||
Non-Comparable NOI | 41,285 | 11,585 | 21,943 | 51,643 | (3,346 | ) | (9,415 | ) | 25,317 | 31,386 | |||||||||||||||||||
Grand Total | $ | 616,711 | $ | 32,521 | $ | 21,943 | $ | 606,133 | $ | 544,226 | $ | 9,714 | $ | 25,317 | $ | 559,829 | |||||||||||||
(1) | Includes the Company’s pro-rata share of NOI from unconsolidated subsidiaries accounted for under the equity method of accounting. |
(2) | Includes non-capitalizable development costs and unallocated management and service company overhead. |
26
Forest City Realty Trust, Inc. and Subsidiaries
Supplemental Operating Information
Net Operating Income by Product Type
Pro-Rata Consolidation (dollars in thousands)
Year Ended December 31, 2015 | Year Ended December 31, 2014 | |
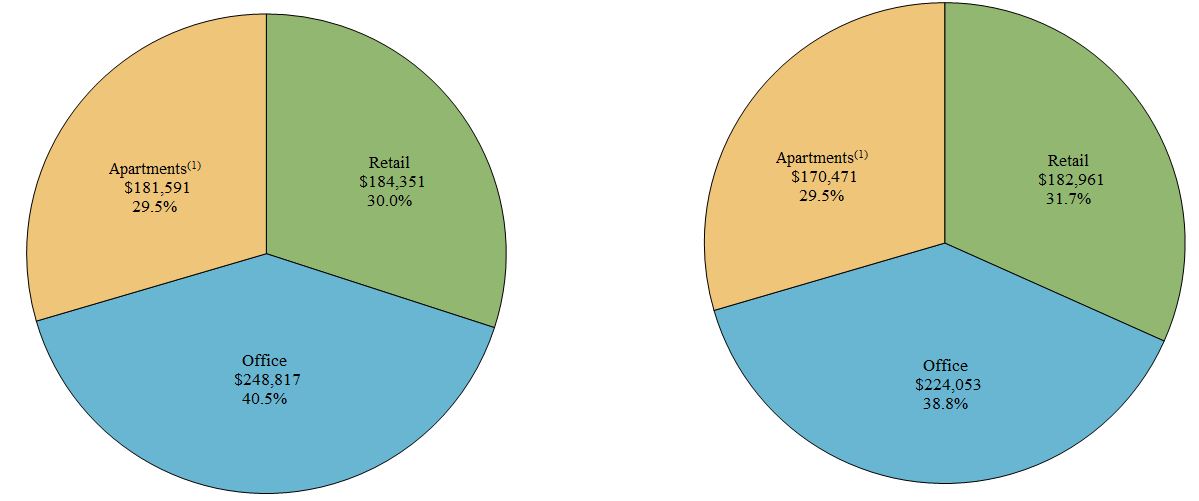
NOI by Product Type | $ | 614,759 | NOI by Product Type | $ | 577,485 | |||
Arena | 21,864 | Arena | 21,739 | |||||
Military Housing | 25,882 | Military Housing | 22,973 | |||||
Straight-line rent adjustments | 4,497 | Straight-line rent adjustments | 5,329 | |||||
Participation payments | (1,013 | ) | Participation payments | (2,544 | ) | |||
Other (2) | (59,856 | ) | Other (2) | (65,153 | ) | |||
Grand Total NOI | $ | 606,133 | Grand Total NOI | $ | 559,829 | |||
(1) | Includes limited-distribution subsidized senior housing. |
(2) | Includes non-capitalizable development costs and unallocated management and service company overhead. |
27
Forest City Realty Trust, Inc. and Subsidiaries
Supplemental Operating Information
Net Operating Income by Core Market
Pro-Rata Consolidation (dollars in thousands)
Year Ended December 31, 2015 | Year Ended December 31, 2014 | |
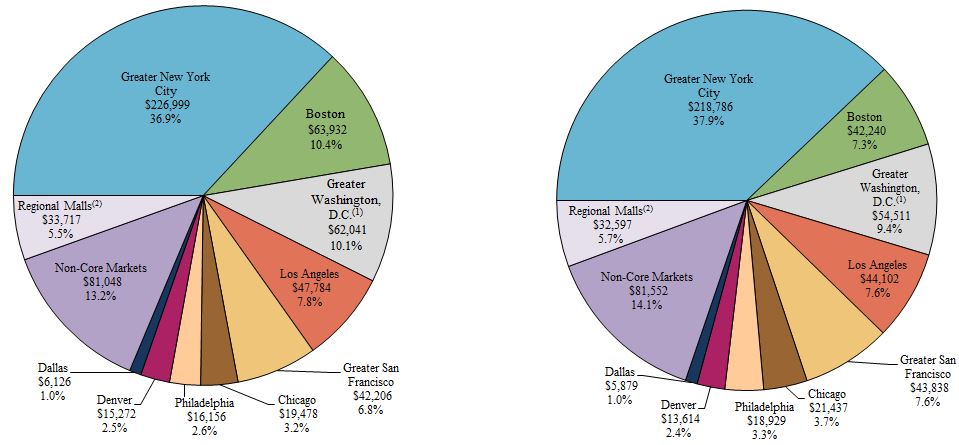
NOI by Market | $ | 614,759 | NOI by Market | $ | 577,485 | |||
Arena | 21,864 | Arena | 21,739 | |||||
Military Housing | 25,882 | Military Housing | 22,973 | |||||
Straight-line rent adjustments | 4,497 | Straight-line rent adjustments | 5,329 | |||||
Participation payments | (1,013 | ) | Participation payments | (2,544 | ) | |||
Other (3) | (59,856 | ) | Other (3) | (65,153 | ) | |||
Grand Total NOI | $ | 606,133 | Grand Total NOI | $ | 559,829 | |||
(1) | Includes Richmond, Virginia. |
(2) | Represents Regional Malls located in Non-Core Markets. Regional Malls located in Core Markets are included in their applicable Core Markets. |
(3) | Includes non-capitalizable development costs and unallocated management and service company overhead. |
28
Forest City Realty Trust, Inc. and Subsidiaries
Supplemental Operating Information
Reconciliation of Net Operating Income (non-GAAP) to Earnings (Loss) Before Income Taxes (GAAP) (in thousands)
Three Months Ended December 31, 2015 | Three Months Ended December 31, 2014 | ||||||||||||||||||||||||||||||
Full Consolidation (GAAP) | Less Noncontrolling Interest | Plus Unconsolidated Investments at Pro-Rata | Plus Discontinued Operations | Pro-Rata Consolidation (Non-GAAP) | Full Consolidation (GAAP) | Less Noncontrolling Interest | Plus Unconsolidated Investments at Pro-Rata | Plus Discontinued Operations | Pro-Rata Consolidation (Non-GAAP) | ||||||||||||||||||||||
Total revenues | $ | 272,830 | $ | 16,990 | $ | 93,064 | $ | 30,423 | $ | 379,327 | $ | 220,408 | $ | 8,242 | $ | 111,762 | $ | 17,497 | $ | 341,425 | |||||||||||
Revenues of unconsolidated entities | 93,064 | — | (93,064 | ) | — | — | 111,762 | — | (111,762 | ) | — | — | |||||||||||||||||||
Exclude land sales | (31,580 | ) | (2,302 | ) | (297 | ) | — | (29,575 | ) | (17,735 | ) | (1,574 | ) | (149 | ) | — | (16,310 | ) | |||||||||||||
Exclude land sales of unconsolidated entities | (297 | ) | — | 297 | — | — | (149 | ) | — | 149 | — | — | |||||||||||||||||||
Exclude Land Development Group other revenues | (2,912 | ) | (290 | ) | (58 | ) | — | (2,680 | ) | (4,173 | ) | (390 | ) | (97 | ) | — | (3,880 | ) | |||||||||||||
Exclude Land Development Group other revenues of unconsolidated entities | (58 | ) | — | 58 | — | — | (97 | ) | — | 97 | — | — | |||||||||||||||||||
Adjusted revenues | 331,047 | 14,398 | — | 30,423 | 347,072 | 310,016 | 6,278 | — | 17,497 | 321,235 | |||||||||||||||||||||
Operating expenses | 179,679 | 7,941 | 43,663 | 21,903 | 237,304 | 146,532 | 5,957 | 48,224 | 11,690 | 200,489 | |||||||||||||||||||||
Operating expenses of unconsolidated entities | 43,663 | — | (43,663 | ) | — | — | 48,224 | — | (48,224 | ) | — | — | |||||||||||||||||||
Exclude cost of land sales | (15,697 | ) | (695 | ) | — | — | (15,002 | ) | (6,376 | ) | (404 | ) | — | — | (5,972 | ) | |||||||||||||||
Exclude Land Development Group operating expenses | (2,145 | ) | (196 | ) | (541 | ) | — | (2,490 | ) | (3,164 | ) | (295 | ) | (542 | ) | — | (3,411 | ) | |||||||||||||
Exclude Land Development Group operating expenses of unconsolidated entities | (541 | ) | — | 541 | — | — | (542 | ) | — | 542 | — | — | |||||||||||||||||||
Exclude corporate general and administrative expenses | (12,479 | ) | — | — | — | (12,479 | ) | (10,036 | ) | — | — | — | (10,036 | ) | |||||||||||||||||
Exclude REIT conversion and reorganization costs | (22,627 | ) | — | — | — | (22,627 | ) | (5,697 | ) | — | — | — | (5,697 | ) | |||||||||||||||||
Adjusted operating expenses | 169,853 | 7,050 | — | 21,903 | 184,706 | 168,941 | 5,258 | — | 11,690 | 175,373 | |||||||||||||||||||||
Net operating income | $ | 161,194 | $ | 7,348 | $ | — | $ | 8,520 | $ | 162,366 | $ | 141,075 | $ | 1,020 | $ | — | $ | 5,807 | $ | 145,862 | |||||||||||
Revenues of unconsolidated entities | (93,064 | ) | — | 93,064 | — | — | (111,762 | ) | — | 111,762 | — | — | |||||||||||||||||||
Operating expenses of unconsolidated entities | 43,663 | — | (43,663 | ) | — | — | 48,224 | — | (48,224 | ) | — | — | |||||||||||||||||||
Land sales | 31,580 | 2,302 | 297 | — | 29,575 | 17,735 | 1,574 | 149 | — | 16,310 | |||||||||||||||||||||
Land sales of unconsolidated entities | 297 | — | (297 | ) | — | — | 149 | — | (149 | ) | — | — | |||||||||||||||||||
Cost of land sales | (15,697 | ) | (695 | ) | — | — | (15,002 | ) | (6,376 | ) | (404 | ) | — | — | (5,972 | ) | |||||||||||||||
Land Development Group other revenues | 2,912 | 290 | 58 | — | 2,680 | 4,173 | 390 | 97 | — | 3,880 | |||||||||||||||||||||
Land Development Group other revenues of unconsolidated entities | 58 | — | (58 | ) | — | — | 97 | — | (97 | ) | — | — | |||||||||||||||||||
Land Development Group operating expenses | (2,145 | ) | (196 | ) | (541 | ) | — | (2,490 | ) | (3,164 | ) | (295 | ) | (542 | ) | — | (3,411 | ) | |||||||||||||
Land Development Group operating expenses of unconsolidated entities | (541 | ) | — | 541 | — | — | (542 | ) | — | 542 | — | — | |||||||||||||||||||
Corporate general and administrative expenses | (12,479 | ) | — | — | — | (12,479 | ) | (10,036 | ) | — | — | — | (10,036 | ) | |||||||||||||||||
REIT conversion and reorganization costs | (22,627 | ) | — | — | — | (22,627 | ) | (5,697 | ) | — | — | — | (5,697 | ) | |||||||||||||||||
Write-offs of abandoned development projects and demolition costs | (3,756 | ) | (116 | ) | — | — | (3,640 | ) | (266 | ) | — | — | — | (266 | ) | ||||||||||||||||
Interest and other income | 9,762 | 670 | 722 | — | 9,814 | 8,806 | 2,180 | 590 | — | 7,216 | |||||||||||||||||||||
Interest expense | (37,481 | ) | (2,383 | ) | (22,079 | ) | (4,917 | ) | (62,094 | ) | (45,360 | ) | (1,494 | ) | (28,432 | ) | (4,834 | ) | (77,132 | ) | |||||||||||
Loss on extinguishment of debt | (3,133 | ) | — | — | — | (3,133 | ) | (252 | ) | (11 | ) | (3,759 | ) | — | (4,000 | ) | |||||||||||||||
Net loss on disposition of partial interest in development project | — | — | — | — | — | (708 | ) | — | — | — | (708 | ) | |||||||||||||||||||
Net gain on disposition of full or partial interests in rental properties | — | — | — | — | — | 30,894 | — | 2,346 | — | 33,240 | |||||||||||||||||||||
Net gain (loss) on change in control of interests | (1,405 | ) | — | — | — | (1,405 | ) | 227,901 | — | — | — | 227,901 | |||||||||||||||||||
Impairment of real estate | (25,971 | ) | — | (12,460 | ) | — | (38,431 | ) | (146,300 | ) | (261 | ) | (3,124 | ) | — | (149,163 | ) | ||||||||||||||
Depreciation and amortization | (72,546 | ) | (4,374 | ) | (22,792 | ) | (4,862 | ) | (95,826 | ) | (52,328 | ) | (1,600 | ) | (24,419 | ) | (4,985 | ) | (80,132 | ) | |||||||||||
Amortization of mortgage procurement costs | (1,793 | ) | (80 | ) | (802 | ) | (226 | ) | (2,741 | ) | (2,066 | ) | (74 | ) | (820 | ) | (165 | ) | (2,977 | ) | |||||||||||
Earnings (loss) before income taxes | $ | (43,172 | ) | $ | 2,766 | $ | (8,010 | ) | $ | (1,485 | ) | $ | (55,433 | ) | $ | 94,197 | $ | 1,025 | $ | 5,920 | $ | (4,177 | ) | $ | 94,915 | ||||||
29
Forest City Realty Trust, Inc. and Subsidiaries
Supplemental Operating Information
Reconciliation of Net Operating Income (non-GAAP) to Earnings (Loss) Before Income Taxes (GAAP) (in thousands) (continued) | |||||||||||||||||||||||||||||||
Year Ended December 31, 2015 | Year Ended December 31, 2014 | ||||||||||||||||||||||||||||||
Full Consolidation (GAAP) | Less Noncontrolling Interest | Plus Unconsolidated Investments at Pro-Rata | Plus Discontinued Operations | Pro-Rata Consolidation (Non-GAAP) | Full Consolidation (GAAP) | Less Noncontrolling Interest | Plus Unconsolidated Investments at Pro-Rata | Plus Discontinued Operations | Pro-Rata Consolidation (Non-GAAP) | ||||||||||||||||||||||
Total revenues | $ | 978,231 | $ | 65,636 | $ | 390,283 | $ | 74,598 | $ | 1,377,476 | $ | 849,357 | $ | 31,794 | $ | 441,351 | $ | 71,074 | $ | 1,329,988 | |||||||||||
Revenues of unconsolidated entities | 390,283 | — | (390,283 | ) | — | — | 441,351 | — | (441,351 | ) | — | — | |||||||||||||||||||
Exclude land sales | (79,169 | ) | (6,998 | ) | (1,780 | ) | — | (73,951 | ) | (68,102 | ) | (6,548 | ) | (2,837 | ) | (1,601 | ) | (65,992 | ) | ||||||||||||
Exclude land sales of unconsolidated entities | (1,780 | ) | — | 1,780 | — | — | (2,837 | ) | — | 2,837 | — | — | |||||||||||||||||||
Exclude Land Development Group other revenues | (8,254 | ) | (810 | ) | (561 | ) | — | (8,005 | ) | (9,758 | ) | (927 | ) | (771 | ) | — | (9,602 | ) | |||||||||||||
Exclude Land Development Group other revenues of unconsolidated entities | (561 | ) | — | 561 | — | — | (771 | ) | — | 771 | — | — | |||||||||||||||||||
Adjusted revenues | 1,278,750 | 57,828 | — | 74,598 | 1,295,520 | 1,209,240 | 24,319 | — | 69,473 | 1,254,394 | |||||||||||||||||||||
Operating expenses | 625,352 | 28,340 | 176,440 | 52,655 | 826,107 | 558,197 | 17,584 | 195,570 | 45,298 | 781,481 | |||||||||||||||||||||
Operating expenses of unconsolidated entities | 176,440 | — | (176,440 | ) | — | — | 195,570 | — | (195,570 | ) | — | — | |||||||||||||||||||
Exclude cost of land sales | (31,413 | ) | (2,069 | ) | — | — | (29,344 | ) | (23,457 | ) | (1,928 | ) | (990 | ) | (1,142 | ) | (23,661 | ) | |||||||||||||
Exclude cost of land sales of unconsolidated entities | — | — | — | — | — | (990 | ) | — | 990 | — | — | ||||||||||||||||||||
Exclude Land Development Group operating expenses | (9,753 | ) | (964 | ) | (2,088 | ) | — | (10,877 | ) | (10,650 | ) | (1,051 | ) | (2,540 | ) | — | (12,139 | ) | |||||||||||||
Exclude Land Development Group operating expenses of unconsolidated entities | (2,088 | ) | — | 2,088 | — | — | (2,540 | ) | — | 2,540 | — | — | |||||||||||||||||||
Exclude corporate general and administrative expenses | (48,374 | ) | — | — | — | (48,374 | ) | (45,419 | ) | — | — | — | (45,419 | ) | |||||||||||||||||
Exclude REIT conversion and reorganization costs | (48,125 | ) | — | — | — | (48,125 | ) | (5,697 | ) | — | — | — | (5,697 | ) | |||||||||||||||||
Adjusted operating expenses | 662,039 | 25,307 | — | 52,655 | 689,387 | 665,014 | 14,605 | — | 44,156 | 694,565 | |||||||||||||||||||||
Net operating income | $ | 616,711 | $ | 32,521 | $ | — | $ | 21,943 | $ | 606,133 | $ | 544,226 | $ | 9,714 | $ | — | $ | 25,317 | $ | 559,829 | |||||||||||
Revenues of unconsolidated entities | (390,283 | ) | — | 390,283 | — | — | (441,351 | ) | — | 441,351 | — | — | |||||||||||||||||||
Operating expenses of unconsolidated entities | 176,440 | — | (176,440 | ) | — | — | 195,570 | — | (195,570 | ) | — | — | |||||||||||||||||||
Land sales | 79,169 | 6,998 | 1,780 | — | 73,951 | 68,102 | 6,548 | 2,837 | 1,601 | 65,992 | |||||||||||||||||||||
Land sales of unconsolidated entities | 1,780 | — | (1,780 | ) | — | — | 2,837 | — | (2,837 | ) | — | — | |||||||||||||||||||
Cost of land sales | (31,413 | ) | (2,069 | ) | — | — | (29,344 | ) | (23,457 | ) | (1,928 | ) | (990 | ) | (1,142 | ) | (23,661 | ) | |||||||||||||
Cost of land sales of unconsolidated entities | — | — | — | — | — | (990 | ) | — | 990 | — | — | ||||||||||||||||||||
Land Development Group other revenues | 8,254 | 810 | 561 | — | 8,005 | 9,758 | 927 | 771 | — | 9,602 | |||||||||||||||||||||
Land Development Group other revenues of unconsolidated entities | 561 | — | (561 | ) | — | — | 771 | — | (771 | ) | — | — | |||||||||||||||||||
Land Development Group operating expenses | (9,753 | ) | (964 | ) | (2,088 | ) | — | (10,877 | ) | (10,650 | ) | (1,051 | ) | (2,540 | ) | — | (12,139 | ) | |||||||||||||
Land Development Group operating expenses of unconsolidated entities | (2,088 | ) | — | 2,088 | — | — | (2,540 | ) | — | 2,540 | — | — | |||||||||||||||||||
Corporate general and administrative expenses | (48,374 | ) | — | — | — | (48,374 | ) | (45,419 | ) | — | — | — | (45,419 | ) | |||||||||||||||||
REIT conversion and reorganization costs | (48,125 | ) | — | — | — | (48,125 | ) | (5,697 | ) | — | — | — | (5,697 | ) | |||||||||||||||||
Write-offs of abandoned development projects and demolition costs | (9,534 | ) | (116 | ) | (10,191 | ) | — | (19,609 | ) | (1,655 | ) | — | — | — | (1,655 | ) | |||||||||||||||
Interest and other income | 37,739 | 2,105 | 1,779 | — | 37,413 | 42,780 | 3,681 | 883 | — | 39,982 | |||||||||||||||||||||
Interest expense | (157,166 | ) | (9,158 | ) | (97,430 | ) | (18,861 | ) | (264,299 | ) | (194,176 | ) | (5,649 | ) | (110,195 | ) | (24,647 | ) | (323,369 | ) | |||||||||||
Loss on extinguishment of debt | (65,086 | ) | (719 | ) | (736 | ) | — | (65,103 | ) | (1,179 | ) | (48 | ) | (3,743 | ) | (448 | ) | (5,322 | ) | ||||||||||||
Net loss on disposition of partial interest in development project | — | — | — | — | — | (20,298 | ) | (3,379 | ) | — | — | (16,919 | ) | ||||||||||||||||||
Net gain on disposition of full or partial interests in rental properties | 1,746 | — | 20,293 | — | 22,039 | 30,281 | 27 | 52,421 | 28,042 | 110,717 | |||||||||||||||||||||
Net gain on change in control of interests | 486,279 | — | — | — | 486,279 | 230,660 | — | — | — | 230,660 | |||||||||||||||||||||
Impairment of real estate | (451,434 | ) | — | (13,844 | ) | — | (465,278 | ) | (277,095 | ) | (261 | ) | (3,124 | ) | — | (279,958 | ) | ||||||||||||||
Depreciation and amortization | (252,925 | ) | (16,069 | ) | (85,345 | ) | (20,104 | ) | (342,305 | ) | (196,167 | ) | (4,828 | ) | (88,923 | ) | (20,948 | ) | (301,210 | ) | |||||||||||
Amortization of mortgage procurement costs | (7,549 | ) | (285 | ) | (3,110 | ) | (226 | ) | (10,600 | ) | (7,797 | ) | (211 | ) | (3,217 | ) | (286 | ) | (11,089 | ) | |||||||||||
Earnings (loss) before income taxes | $ | (65,051 | ) | $ | 13,054 | $ | 25,259 | $ | (17,248 | ) | $ | (70,094 | ) | $ | (103,486 | ) | $ | 3,542 | $ | 89,883 | $ | 7,489 | $ | (9,656 | ) | ||||||
30
Forest City Realty Trust, Inc. and Subsidiaries
Supplemental Operating Information
Segment Operating Results - Year-to-Date Comparison
The following tables present revenues, operating expenses and interest expense by segment on a pro-rata basis for the year ended December 31, 2015 compared with the year ended December 31, 2014.
Commercial Group | Residential Group | Arena | Land Development Group | Total | |||||||||||
Revenues for the year ended December 31, 2014 | $ | 782,518 | $ | 412,398 | $ | 64,045 | $ | 71,027 | $ | 1,329,988 | |||||
Increase (decrease) due to: | |||||||||||||||
Comparable portfolio | 12,580 | 8,799 | — | — | 21,379 | ||||||||||
Non-comparable properties (1) | (482 | ) | 21,617 | 10,553 | — | 31,688 | |||||||||
Properties in which partners’ interest recently acquired | 40,041 | 5,119 | — | — | 45,160 | ||||||||||
Recently disposed properties | (19,514 | ) | (20,034 | ) | — | — | (39,548 | ) | |||||||
Properties in which partial interest was recently disposed | — | (12,976 | ) | — | — | (12,976 | ) | ||||||||
Land sales | 4,122 | 476 | — | 3,361 | 7,959 | ||||||||||
Military housing | — | (386 | ) | — | — | (386 | ) | ||||||||
Subsidized senior housing | — | 1,334 | — | — | 1,334 | ||||||||||
Other | (7,141 | ) | 1,617 | — | (1,598 | ) | (7,122 | ) | |||||||
Revenues for the year ended December 31, 2015 | $ | 812,124 | $ | 417,964 | $ | 74,598 | $ | 72,790 | $ | 1,377,476 | |||||
Corporate Activities | Commercial Group | Residential Group | Arena | Land Development Group | Total | |||||||||||||
Operating expenses for the year ended December 31, 2014 | $ | 51,116 | $ | 404,299 | $ | 251,733 | $ | 42,284 | $ | 32,049 | $ | 781,481 | ||||||
Increase (decrease) due to: | ||||||||||||||||||
Comparable portfolio | — | 7,723 | 3,124 | — | — | 10,847 | ||||||||||||
Non-comparable properties (1) | — | (188 | ) | 6,815 | 10,371 | — | 16,998 | |||||||||||
Properties in which partners’ interest recently acquired | — | 8,814 | 2,646 | — | — | 11,460 | ||||||||||||
Recently disposed properties | — | (9,089 | ) | (13,003 | ) | — | — | (22,092 | ) | |||||||||
Properties in which partial interest was recently disposed | — | — | (6,296 | ) | — | — | (6,296 | ) | ||||||||||
Land cost of sales | — | 4,752 | 68 | — | 863 | 5,683 | ||||||||||||
Military housing | — | — | (3,295 | ) | — | — | (3,295 | ) | ||||||||||
Subsidized senior housing | — | — | (252 | ) | — | — | (252 | ) | ||||||||||
REIT conversion and reorganization costs | 42,428 | — | — | — | — | 42,428 | ||||||||||||
Development, management, corporate and other expenses | 2,955 | (13,883 | ) | 1,336 | — | (1,263 | ) | (10,855 | ) | |||||||||
Operating expenses for the year ended December 31, 2015 | $ | 96,499 | $ | 402,428 | $ | 242,876 | $ | 52,655 | $ | 31,649 | $ | 826,107 | ||||||
Corporate Activities | Commercial Group | Residential Group | Arena | Land Development Group | Total | |||||||||||||
Interest expense for the year ended December 31, 2014 | $ | 37,643 | $ | 210,508 | $ | 56,759 | $ | 19,109 | $ | (650 | ) | $ | 323,369 | |||||
Increase (decrease) due to: | ||||||||||||||||||
Comparable portfolio | — | (13,713 | ) | (1,371 | ) | — | — | (15,084 | ) | |||||||||
Non-comparable properties (1) | — | 87 | 5,608 | (248 | ) | — | 5,447 | |||||||||||
Properties in which partners’ interest recently acquired | — | 2,606 | 292 | — | — | 2,898 | ||||||||||||
Recently disposed properties | — | (9,746 | ) | (3,054 | ) | — | — | (12,800 | ) | |||||||||
Properties in which partial interest was recently disposed | — | — | (8,526 | ) | — | — | (8,526 | ) | ||||||||||
Capitalized interest | — | (6,258 | ) | (10,229 | ) | — | 271 | (16,216 | ) | |||||||||
Mark-to-market adjustments on non-designated swaps | 377 | (165 | ) | (3,051 | ) | — | (266 | ) | (3,105 | ) | ||||||||
Corporate borrowings | (14,331 | ) | — | — | — | — | (14,331 | ) | ||||||||||
Other | — | 257 | 2,512 | — | (122 | ) | 2,647 | |||||||||||
Interest expense for the year ended December 31, 2015 | $ | 23,689 | $ | 183,576 | $ | 38,940 | $ | 18,861 | $ | (767 | ) | $ | 264,299 | |||||
31
Forest City Realty Trust, Inc. and Subsidiaries
Supplemental Operating Information
(1) | The following table presents the increases (decreases) in revenues, operating expenses and interest expense for Commercial and Residential properties in lease-up or recently stabilized but not comparable and other non-comparable properties: |
Year Ended December 31, 2015 vs. 2014 | ||||||||||
Property | Quarter Opened | Revenues | Operating Expenses | Interest Expense | ||||||
Commercial: | ||||||||||
Non-comparable property: | ||||||||||
Ballston Quarter | (482 | ) | (188 | ) | 87 | |||||
Total Commercial | $ | (482 | ) | $ | (188 | ) | $ | 87 | ||
Residential: | ||||||||||
Properties recently stabilized or in lease-up: | ||||||||||
2175 Market Street | Q4-14 | 705 | 106 | 162 | ||||||
3700M | Q3-14 | 1,752 | 638 | 378 | ||||||
Aster Conservatory Green | Q3-13/14 | 2,545 | 234 | 853 | ||||||
Aster Town Center North | Q4-15/Q1-16 | 75 | 153 | 30 | ||||||
Kapolei Lofts | Q3-15/Q1-17 | — | 2,450 | — | ||||||
Radian | Q2-14 | 3,468 | 431 | 855 | ||||||
The Yards - Twelve12 | Q2-14 | 6,590 | 1,398 | 1,358 | ||||||
Winchester Lofts | Q4-14 | 1,323 | 892 | 1,296 | ||||||
Non-comparable properties: | ||||||||||
Heritage | 2,761 | (495 | ) | (419 | ) | |||||
500 Sterling Place | 2,398 | 1,008 | 1,095 | |||||||
Total Residential | $ | 21,617 | $ | 6,815 | $ | 5,608 | ||||
Commercial Group - Year-to-Date Comparison
The increases in revenues, operating expenses and interest expense related to partners’ interest recently acquired are related to Boulevard Mall (Q4-2014), a regional mall located in Amherst, New York and the seven life science office properties and two parking facilities at University Park at MIT (Q2-2015) upon the acquisition of our partner’s equity interests in those properties. The decreases in revenues, operating expenses and interest expense related to recent disposals are due to our ongoing strategy to sell operating assets in non-core markets. The decrease in interest expense for the comparable portfolio is primarily due to the paydown of nonrecourse mortgage notes for One MetroTech Center (Q2-2015), Harlem Office (Q3-2014) and Ballston Common Office Center (Q1-2015).
Ballston Quarter, a regional mall in Arlington, Virginia, is classified as a non-comparable property due to its upcoming planned renovation project.
Residential Group - Year-to-Date Comparison
The increases in revenues and operating expenses related to partners’ interest recently acquired are related to three operating apartment communities located in Northeast Ohio. The decreases in revenues, operating expenses and interest expense related to recent disposals are due to our ongoing strategy to sell operating assets in non-core markets. The decreases in revenues, operating expenses and interest expense related to partial interest recently disposed are related to the contribution of two operating apartment communities into our strategic capital partnership with Arizona State Retirement System in the prior year. The decrease in interest expense related to capitalized interest is due to the increased number of projects under construction and development as we increased our construction pipeline.
Heritage is classified as a non-comparable property due to its recently completed renovation project resulting in a significant number of units being off-line.
500 Sterling Place, an apartment community in Brooklyn, New York, was acquired (Q1-2015) and is classified as a non-comparable property.
Corporate Activities - Year-to-Date Comparison
The decrease in interest expense is due to the privately negotiated exchanges of a portion of our Senior Notes due 2016, 2018 and 2020 for Class A common stock during 2015.
32
Forest City Realty Trust, Inc. and Subsidiaries
Supplemental Operating Information
Net Earnings (Loss) Attributable to Forest City Realty Trust, Inc.
Net earnings attributable to Forest City Realty Trust, Inc. for the year ended December 31, 2015 was $496,042,000 versus net loss of$(7,595,000) for the year ended December 31, 2014. The variance to the prior year period is primarily attributable to the following fluctuations, which are pre-tax, include unconsolidated investment activity and are net of noncontrolling interests:
Asset Dispositions - $(72,071,000)
• | $(88,678,000) related to decreased gains on disposition of full or partial interest in rental properties and unconsolidated investments in 2015 compared to 2014; |
• | $16,919,000 related to the net loss on partial disposition of our interest in Pacific Park Brooklyn, related to the formation of a new joint venture with Greenland in 2014; |
• | $(2,810,000) related to a combined fluctuation in revenues, operating expenses and interest expense at properties in which we disposed of our full or partial interest during 2015 and 2014; and |
• | $2,498,000 related to increased Land Development Group sales in 2015 compared with 2014, primarily at our Stapleton project. |
Financing Transactions - $(26,129,000)
• | $(59,781,000) related to increased losses on extinguishment of debt compared with 2014 primarily due to the February, March and July 2015 separate, privately negotiated exchange transactions involving a portion of our Senior Notes due 2016, 2018 and 2020; |
• | $16,216,000 related to a decrease in interest expense in 2015 compared with 2014 due to increased capitalized interest on projects under construction and development as we increased our construction pipeline; |
• | $14,331,000 related to a decrease in interest expense on corporate debt due to separate, privately negotiated exchange transactions involving certain of our Senior Notes due 2016, 2018 and 2020 in February, March and July 2015; and |
• | $3,105,000 related to the change in fair market value of certain derivatives not qualifying for hedge accounting between the comparable periods, which was marked to market through interest expense. |
Non-Cash Transactions - $11,250,000
• | $255,619,000 related to increased gains on change in control of interest in 2015 compared with 2014 activity. The net gain on change in control of interest in 2015 was primarily from the June 2015 acquisition of our partner’s 49% equity ownership interest in seven life science office properties and two parking facilities at University Park at MIT, a mixed-use life science office campus in Cambridge, Massachusetts (“MIT Assets”), and the April 2015 acquisition of our partner’s 50% equity ownership interest in three operating apartment communities (Cherry Tree, Chestnut Lake and Stratford Crossing). The net gain on change in control of interests in 2014 primarily related to the remeasurement of our equity interest in Bayside Village, an apartment community in San Francisco, California, at fair value upon our partner’s transfer of ownership to an unrelated third party and the acquisition of our partner’s interest in Boulevard Mall, a regional mall in Amherst, New York; |
• | $(185,320,000) related to increased impairment of real estate in 2015 compared with 2014 primarily driven by the impairment recorded at Westchester's Ridge Hill in the amount of $398,558,000; |
• | $(41,095,000) related to an increase in depreciation and amortization expense in 2015 compared with 2014 primarily due to recently opened properties and the change from equity method of accounting to full consolidation method upon the acquisition of our partner’s interest in the MIT Assets and three operating apartment communities in Q2 2015, and Bayside Village and Boulevard Mall in Q4 2014. These increases were partially offset by the disposition of full or partial interests in several properties during 2015 and 2014; and |
• | $(17,954,000) related to increased write-offs of abandoned development projects, including $(10,191,000) related to unconsolidated entities, in 2015 compared to 2014. |
Operations - $21,140,000
• | $(42,428,000) related to an increase in REIT conversion and reorganization costs incurred in 2015 compared with 2014; |
• | $30,802,000 related to a combined fluctuation in revenues, operating expenses and interest expense in properties in which we recently acquired our partners’ interest; |
• | $25,616,000 related to a combined fluctuation in revenues, operating expenses and interest expense in our comparable portfolio in 2015 compared with 2014; |
• | $5,224,000 related to a combined fluctuation in revenues, operating expenses and interest expense at properties in lease-up at December 31, 2015; |
33
Forest City Realty Trust, Inc. and Subsidiaries
Supplemental Operating Information
• | $2,909,000 related to a combined fluctuation in revenues and operating expenses in our Military Housing business unit in 2015 compared with 2014; |
• | $(2,569,000) in interest and other income primarily related to income recognized for a legal settlement at Heritage in 2014, which did not recur in 2015, and decreases in the income recognition on the allocation of state and federal historic preservation, low income housing and new market tax credits in 2015 compared with 2014; and |
• | $1,586,000 related to a combined fluctuation in revenues and operating expenses in our Subsidized Senior Housing business unit in 2015 compared with 2014. |
Discontinued Operations - $(37,579,000)
• | $(37,579,000) related to an increase in our equity in loss of the Nets in 2015 compared to 2014. |
Income Taxes - $598,483,000
• | $588,607,000 due to a one-time adjustment to deferred taxes as a result of the REIT conversion; and |
• | $9,876,000 due to decreased income tax expense attributable to both continuing and discontinued operations primarily related to the fluctuations in pre-tax earnings, including gains included in discontinued operations. These fluctuations are primarily due to the various transactions discussed herein. |
Capital Expenditures for our Operating Portfolio – Our diversified real estate portfolio requires capital expenditures, including tenant improvements, to maintain and improve its operating performance. The following table represents our capital expenditures by segment:
Year Ended December 31, 2015 | Year Ended December 31, 2014 | ||||||||||||
Full Consolidation (GAAP) | Pro-Rata Consolidation (Non-GAAP) | Full Consolidation (GAAP) | Pro-Rata Consolidation (Non-GAAP) | ||||||||||
(in thousands) | |||||||||||||
Operating properties: | |||||||||||||
Residential Group | $ | 27,722 | $ | 39,222 | $ | 23,169 | $ | 38,041 | |||||
Commercial Group | 19,883 | 32,444 | 17,172 | 40,346 | |||||||||
Other | 208 | 208 | 52 | 52 | |||||||||
Total operating properties | 47,813 | 71,874 | 40,393 | 78,439 | |||||||||
Tenant improvements: | |||||||||||||
Commercial Group | 46,470 | 53,796 | 20,751 | 34,170 | |||||||||
Total capital expenditures | $ | 94,283 | $ | 125,670 | $ | 61,144 | $ | 112,609 | |||||
Disposition: | |||||||||||||
Arena | $ | 10,568 | $ | 3,594 | $ | 2,942 | $ | 1,001 | |||||
34
Forest City Realty Trust, Inc. and Subsidiaries
Supplemental Operating Information
Reconciliation of Net Earnings (Loss) to FFO
The table below reconciles net earnings (loss), the most comparable GAAP measure, to FFO, a non-GAAP measure.
Three Months Ended December 31, | Years Ended December 31, | ||||||||||||
2015 | 2014 | 2015 | 2014 | ||||||||||
(in thousands) | |||||||||||||
Net earnings (loss) attributable to Forest City Realty Trust, Inc. | $ | 548,714 | $ | 69,191 | $ | 496,042 | $ | (7,595 | ) | ||||
Depreciation and Amortization—Real Estate Groups (1) | 94,756 | 78,788 | 337,740 | 296,382 | |||||||||
Gain on disposition of full or partial interests in rental properties | — | (33,240 | ) | (22,039 | ) | (110,717 | ) | ||||||
Impairment of depreciable rental properties | 38,431 | 149,163 | 447,587 | 278,222 | |||||||||
Income tax expense (benefit) adjustment — current and deferred (2): | |||||||||||||
Gain on disposition of full or partial interests in rental properties | — | 12,960 | 8,549 | 44,988 | |||||||||
Impairment of depreciable rental properties | (14,785 | ) | (56,638 | ) | (173,590 | ) | (106,691 | ) | |||||
One-time adjustment to deferred taxes related to REIT conversion | (588,607 | ) | — | (588,607 | ) | — | |||||||
FFO attributable to Forest City Realty Trust, Inc. | $ | 78,509 | $ | 220,224 | $ | 505,682 | $ | 394,589 | |||||
FFO Per Share - Diluted | |||||||||||||
Numerator (in thousands): | |||||||||||||
FFO attributable to Forest City Realty Trust, Inc. | $ | 78,509 | $ | 220,224 | $ | 505,682 | $ | 394,589 | |||||
If-Converted Method (adjustments for interest, net of tax): | |||||||||||||
5.000% Notes due 2016 | 8 | 382 | 415 | 1,530 | |||||||||
4.250% Notes due 2018 | 1,005 | 2,277 | 5,646 | 9,106 | |||||||||
3.625% Notes due 2020 | 646 | 1,664 | 3,754 | 6,657 | |||||||||
FFO for per share data | $ | 80,168 | $ | 224,547 | $ | 515,497 | $ | 411,882 | |||||
Denominator: | |||||||||||||
Weighted average shares outstanding—Basic | 257,682,590 | 198,931,478 | 237,559,598 | 198,480,783 | |||||||||
Effect of stock options, restricted stock and performance shares | 1,951,293 | 1,764,151 | 2,407,276 | 1,747,484 | |||||||||
Effect of convertible debt | 12,013,760 | 32,138,215 | 17,920,119 | 32,138,215 | |||||||||
Effect of convertible 2006 Class A Common Units | 1,940,788 | 2,973,190 | 2,667,712 | 3,261,070 | |||||||||
Weighted average shares outstanding - Diluted | 273,588,431 | 235,807,034 | 260,554,705 | 235,627,552 | |||||||||
FFO Per Share | $ | 0.29 | $ | 0.95 | $ | 1.98 | $ | 1.75 | |||||
(1) | The following table provides detail of depreciation and amortization: |
Three Months Ended December 31, | Years Ended December 31, | ||||||||||||
2015 | 2014 | 2015 | 2014 | ||||||||||
(in thousands) | |||||||||||||
Full Consolidation | $ | 72,546 | $ | 52,328 | $ | 252,925 | $ | 196,167 | |||||
Non-Real Estate | (1,055 | ) | (1,327 | ) | (4,500 | ) | (4,761 | ) | |||||
Real Estate Groups Full Consolidation | 71,491 | 51,001 | 248,425 | 191,406 | |||||||||
Real Estate Groups related to noncontrolling interest | (4,374 | ) | (1,600 | ) | (16,069 | ) | (4,828 | ) | |||||
Real Estate Groups Unconsolidated | 22,792 | 24,419 | 85,345 | 88,923 | |||||||||
Real Estate Groups Discontinued Operations | 4,847 | 4,968 | 20,039 | 20,881 | |||||||||
Real Estate Groups at our proportional share | $ | 94,756 | $ | 78,788 | $ | 337,740 | $ | 296,382 | |||||
(2) | The following table provides detail of income tax expense (benefit): |
Three Months Ended December 31, | Years Ended December 31, | ||||||||||||
2015 | 2014 | 2015 | 2014 | ||||||||||
(in thousands) | |||||||||||||
Income tax expense (benefit) on FFO | |||||||||||||
Operating Earnings: | |||||||||||||
Current taxes | $ | (6,367 | ) | $ | (35,646 | ) | $ | (4,637 | ) | $ | (49,150 | ) | |
Deferred taxes | 2,763 | 105,509 | 154,688 | 105,739 | |||||||||
Total income tax expense (benefit) on FFO | (3,604 | ) | 69,863 | 150,051 | 56,589 | ||||||||
Income tax expense (benefit) on non-FFO | |||||||||||||
Disposition of full or partial interests in rental properties: | |||||||||||||
Current taxes | $ | (2,345 | ) | $ | 32,940 | $ | 5,975 | $ | 59,111 | ||||
Deferred taxes | 2,345 | (19,980 | ) | 2,574 | (14,123 | ) | |||||||
Disposition of full or partial interests in rental properties | — | 12,960 | 8,549 | 44,988 | |||||||||
Impairment of depreciable rental properties - deferred taxes | (14,785 | ) | (56,638 | ) | (173,590 | ) | (106,691 | ) | |||||
One-time adjustment to deferred taxes related to REIT conversion | (588,607 | ) | — | (588,607 | ) | — | |||||||
Total income tax expense (benefit) on non-FFO | (603,392 | ) | (43,678 | ) | (753,648 | ) | (61,703 | ) | |||||
Grand Total | $ | (606,996 | ) | $ | 26,185 | $ | (603,597 | ) | $ | (5,114 | ) | ||
35
Forest City Realty Trust, Inc. and Subsidiaries
Supplemental Operating Information
Reconciliation of FFO to Operating FFO - Pro-Rata Consolidation
Three Months Ended December 31, | Years Ended December 31, | ||||||||||||||
2015 | 2014 | % Change | 2015 | 2014 | % Change | ||||||||||
(in thousands) | (in thousands) | ||||||||||||||
FFO attributable to Forest City Realty Trust, Inc. | $ | 78,509 | $ | 220,224 | $ | 505,682 | $ | 394,589 | |||||||
Impairment of non-depreciable real estate | — | — | 17,691 | 1,736 | |||||||||||
Write-offs of abandoned development projects and demolition costs | 3,640 | 266 | 19,609 | 1,655 | |||||||||||
Tax credit income | (4,287 | ) | 7,139 | (14,807 | ) | (5,803 | ) | ||||||||
Loss on extinguishment of debt | 3,133 | 4,000 | 65,103 | 5,322 | |||||||||||
Change in fair market value of nondesignated hedges | (791 | ) | (1,082 | ) | (4,850 | ) | 1,964 | ||||||||
Net (gain) loss on change in control of interests | 1,405 | (227,901 | ) | (486,279 | ) | (230,660 | ) | ||||||||
Straight-line rent adjustments | (26 | ) | (2,733 | ) | (4,497 | ) | (5,329 | ) | |||||||
Participation payments | 1,002 | 1,075 | 1,013 | 2,544 | |||||||||||
Net loss on disposition of partial interest in development project | — | 708 | — | 16,919 | |||||||||||
REIT conversion and reorganization costs | 22,627 | 5,697 | 48,125 | 5,697 | |||||||||||
Nets pre-tax FFO | 2,325 | 820 | 40,760 | 3,181 | |||||||||||
Income tax expense (benefit) on FFO | (3,604 | ) | 69,863 | 150,051 | 56,589 | ||||||||||
Operating FFO attributable to Forest City Realty Trust, Inc. | $ | 103,933 | $ | 78,076 | 33.1% | $ | 337,601 | $ | 248,404 | 35.9% | |||||
Operating FFO Per Share - Diluted | |||||||||||||||
Numerator (in thousands): | |||||||||||||||
Operating FFO attributable to Forest City Realty Trust, Inc. | $ | 103,933 | $ | 78,076 | $ | 337,601 | $ | 248,404 | |||||||
If-Converted Method (adjustments for interest, pre-tax): | |||||||||||||||
5.000% Notes due 2016 | 13 | 625 | 678 | 2,500 | |||||||||||
4.250% Notes due 2018 | 1,641 | 3,719 | 9,222 | 14,875 | |||||||||||
3.625% Notes due 2020 | 1,054 | 2,718 | 6,132 | 10,875 | |||||||||||
Operating FFO for per share data | $ | 106,641 | $ | 85,138 | $ | 353,633 | $ | 276,654 | |||||||
Denominator: | |||||||||||||||
Weighted average shares outstanding - Diluted | 273,588,431 | 235,807,034 | 260,554,705 | 235,627,552 | |||||||||||
Operating FFO Per Share | $ | 0.39 | $ | 0.36 | $ | 1.36 | $ | 1.17 | |||||||
Three Months Ended December 31, | Years Ended December 31, | ||||||||||||||
2015 | 2014 | 2015 | 2014 | ||||||||||||
(in thousands) | (in thousands) | ||||||||||||||
Operating FFO by segment: | |||||||||||||||
Commercial Group | $ | 60,807 | $ | 47,976 | $ | 217,801 | $ | 162,667 | |||||||
Residential Group | 38,836 | 34,489 | 133,533 | 117,408 | |||||||||||
Arena | 3,331 | 810 | 2,712 | 2,318 | |||||||||||
Land Group | 18,684 | 14,786 | 57,984 | 51,798 | |||||||||||
Corporate Group | (17,725 | ) | (19,985 | ) | (74,429 | ) | (85,787 | ) | |||||||
Operating FFO | $ | 103,933 | $ | 78,076 | $ | 337,601 | $ | 248,404 | |||||||
36
Forest City Realty Trust, Inc. and Subsidiaries
Supplemental Operating Information
Reconciliation of Net Earnings (Loss) to EBITDA - Pro-Rata Consolidation
Three Months Ended December 31, | Years Ended December 31, | ||||||||||||
2015 | 2014 | 2015 | 2014 | ||||||||||
(in thousands) | |||||||||||||
Net earnings (loss) attributable to Forest City Realty Trust, Inc. | $ | 548,714 | $ | 69,191 | $ | 496,042 | $ | (7,595 | ) | ||||
Depreciation and amortization | 95,826 | 80,132 | 342,305 | 301,210 | |||||||||
Interest expense | 62,094 | 77,132 | 264,299 | 323,369 | |||||||||
Amortization of mortgage procurement costs | 2,741 | 2,977 | 10,600 | 11,089 | |||||||||
Income tax expense (benefit) | (606,996 | ) | 26,185 | (603,597 | ) | (5,114 | ) | ||||||
EBITDA attributable to Forest City Realty Trust, Inc. | $ | 102,379 | $ | 255,617 | $ | 509,649 | $ | 622,959 | |||||
Impairment of real estate | 38,431 | 149,163 | 465,278 | 279,958 | |||||||||
Net loss on extinguishment of debt | 3,133 | 4,000 | 65,103 | 5,322 | |||||||||
Net loss on disposition of partial interest in development project | — | 708 | — | 16,919 | |||||||||
Net gain on disposition of full or partial interests in rental properties | — | (33,240 | ) | (22,039 | ) | (110,717 | ) | ||||||
Net (gain) loss on change in control of interests | 1,405 | (227,901 | ) | (486,279 | ) | (230,660 | ) | ||||||
Nets pre-tax EBITDA | 2,325 | 820 | 40,760 | 3,181 | |||||||||
REIT conversion and reorganization costs | 22,627 | 5,697 | 48,125 | 5,697 | |||||||||
Adjusted EBITDA attributable to Forest City Realty Trust, Inc. | $ | 170,300 | $ | 154,864 | $ | 620,597 | $ | 592,659 | |||||
As of December 31, | As of December 31, | ||||||||||||
2015 | 2014 | 2015 | 2014 | ||||||||||
(in thousands) | |||||||||||||
Total mortgage debt and notes payable, nonrecourse | $ | 5,896,237 | $ | 5,883,710 | $ | 5,896,237 | $ | 5,883,710 | |||||
Mortgage debt, nonrecourse on assets held for sale | 140,460 | 136,902 | 140,460 | 136,902 | |||||||||
Revolving credit facility | — | — | — | — | |||||||||
Convertible senior debt | 271,006 | 700,000 | 271,006 | 700,000 | |||||||||
Total debt | $ | 6,307,703 | $ | 6,720,612 | $ | 6,307,703 | $ | 6,720,612 | |||||
Less cash and equivalents | (309,949 | ) | (352,947 | ) | (309,949 | ) | (352,947 | ) | |||||
Less cash and equivalents on assets held for sale | (5,410 | ) | (12,225 | ) | (5,410 | ) | (12,225 | ) | |||||
Net Debt | $ | 5,992,344 | $ | 6,355,440 | $ | 5,992,344 | $ | 6,355,440 | |||||
Net Debt to Adjusted EBITDA (Annualized) | 8.8 | x | 10.3 | x | 9.7 | x | 10.7 | x | |||||
37
Forest City Realty Trust, Inc. and Subsidiaries
Supplemental Operating Information
Net Debt to Adjusted EBITDA - Pro-Rata Consolidation - Additional Impacts
The schedule below is provided to show the impact of certain recently closed transactions to our Net Debt to Adjusted EBITDA ratio.
Adjusted | Net Debt to | |||||||
EBITDA | Net Debt | Adjusted EBITDA | ||||||
(in thousands) | ||||||||
Per The Year Ended December 31, 2015 Reconciliation of Net Earnings (Loss) to EBITDA | $ | 620,597 | $ | 5,992,344 | 9.7 | x | ||
Impact of: | ||||||||
2015 Acquisitions (1) | 13,957 | — | ||||||
2015 Sales (2) | (4,012 | ) | — | |||||
2015 Opening (3) | 1,733 | 4,195 | ||||||
Subtotal | $ | 632,275 | $ | 5,996,539 | 9.5 | x | ||
Impact of closed 2016 sales: | ||||||||
Arena (4) | (21,943 | ) | (140,460 | ) | ||||
Westchester’s Ridge Hill (5) | (9,775 | ) | (169,369 | ) | ||||
Net cash proceeds from asset sales (6) | — | (289,000 | ) | |||||
$ | 600,557 | $ | 5,397,710 | 9.0 | x | |||
(1) | Represents additional Adjusted EBITDA which would have been generated in 2015 by our additional ownership interests in the MIT Assets, which were acquired in June 2015, and the residential partner acquisitions, which were made in April 2015, if these acquisitions were made at the beginning of the year. |
(2) | Represents lost Adjusted EBITDA on assets disposed during 2015. |
(3) | Represents additional Adjusted EBITDA, at stabilization, and estimated loan draws on properties that are in lease-up or are opening in phases in 2015. |
(4) | Represents Adjusted EBITDA and debt associated with the Arena, which was sold on January 29, 2016. |
(5) | Represents reduction of Adjusted EBITDA and related debt assumed by QIC as a result of the joint venture transaction that closed on January 29, 2016. |
(6) | Includes net cash proceeds received or expected to be received in 2016 as follows: |
Net Cash Proceeds | |||
(in thousands) | |||
625 Fulton Avenue (Land) | $ | 152,000 | |
Westchester’s Ridge Hill | 83,000 | ||
Arena | 54,000 | ||
$ | 289,000 | ||
38
Forest City Realty Trust, Inc. and Subsidiaries
Supplemental Operating Information
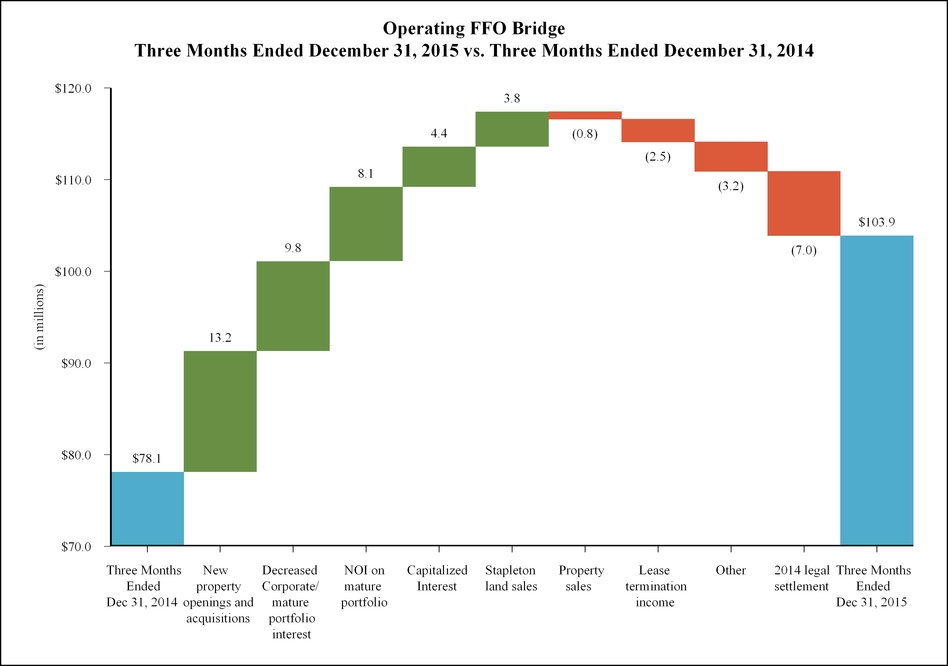
39
Forest City Realty Trust, Inc. and Subsidiaries
Supplemental Operating Information
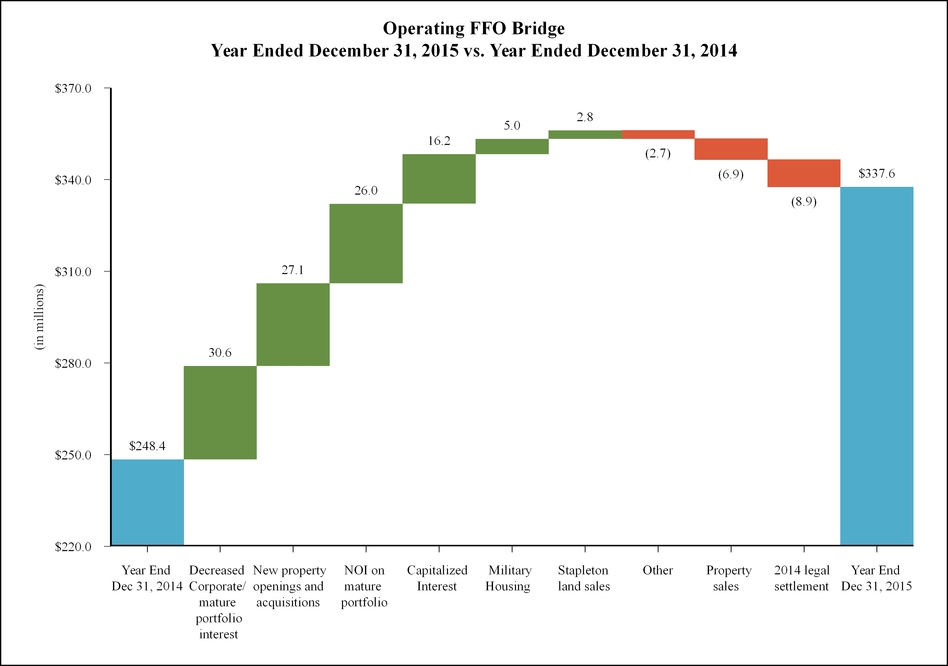
40
Forest City Realty Trust, Inc. and Subsidiaries
Supplemental Operating Information
Retail Lease Expirations as of December 31, 2015
Expiration Year | Number of Expiring Leases | Square Feet of Expiring Leases (1) | Percentage of Total Leased GLA | Contractual Rent Expiring (2) | Percentage of Total Contractual Rent | Average Contractual Rent Per Square Foot Expiring (1) | |||||||||
2016 | 271 | 870,521 | 8.80 | % | $ | 26,076,027 | 10.26 | % | $ | 50.68 | |||||
2017 | 269 | 963,098 | 9.74 | 29,965,928 | 11.79 | 57.14 | |||||||||
2018 | 181 | 877,680 | 8.87 | 20,088,960 | 7.90 | 39.05 | |||||||||
2019 | 189 | 1,232,009 | 12.46 | 26,909,749 | 10.59 | 37.16 | |||||||||
2020 | 147 | 1,031,685 | 10.43 | 22,885,923 | 9.00 | 39.84 | |||||||||
2021 | 108 | 896,166 | 9.06 | 23,697,129 | 9.32 | 46.08 | |||||||||
2022 | 119 | 915,113 | 9.25 | 29,656,997 | 11.67 | 50.79 | |||||||||
2023 | 76 | 651,970 | 6.59 | 19,640,841 | 7.73 | 44.73 | |||||||||
2024 | 92 | 532,573 | 5.38 | 13,257,289 | 5.22 | 48.52 | |||||||||
2025 | 115 | 638,519 | 6.46 | 16,976,123 | 6.68 | 49.32 | |||||||||
Thereafter | 54 | 1,280,741 | 12.96 | 25,023,369 | 9.84 | 31.33 | |||||||||
Total | 1,621 | 9,890,075 | 100.00 | % | $ | 254,178,335 | 100.00 | % | $ | 43.95 | |||||
(1) | Square feet of expiring leases and average contractual rent per square foot are operating statistics that represent 100% of the square footage and contractual rental income per square foot from expiring leases. |
(2) | Contractual rent expiring is an operating statistic and is not comparable to rental revenue, a GAAP financial measure. The primary differences arise because contractual rent is calculated at the Company’s ownership share and excludes adjustments for the impacts of straight-line rent, amortization of intangible assets related to in-place leases, above and below market leases and overage rental payments (which are not reasonably estimable). Contractual rent per square foot includes base rent, fixed additional charges for marketing/promotional charges, common area maintenance and real estate taxes. |
Retail Lease Expirations
Percentage of Contractual Rent Expiring
As of December 31, 2015
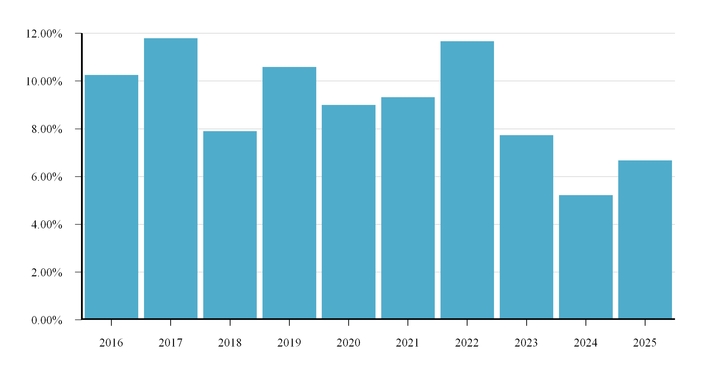
41
Forest City Realty Trust, Inc. and Subsidiaries
Supplemental Operating Information
Office Lease Expirations as of December 31, 2015
Expiration Year | Number of Expiring Leases | Square Feet of Expiring Leases (1) | Percentage of Total Leased GLA | Contractual Rent Expiring (2) | Percentage of Total Contractual Rent | Average Contractual Rent Per Square Foot Expiring (1) | ||||||||||
2016 | 91 | 1,016,069 | 10.39 | % | $ | 27,832,085 | 6.90 | % | $ | 27.94 | ||||||
2017 | 58 | 438,169 | 4.48 | 14,998,480 | 3.72 | 36.21 | ||||||||||
2018 | 54 | 1,160,753 | 11.87 | 47,531,608 | 11.78 | 47.49 | ||||||||||
2019 | 44 | 976,743 | 9.99 | 41,747,476 | 10.34 | 45.39 | ||||||||||
2020 | 29 | 1,195,598 | 12.22 | 48,449,321 | 12.00 | 43.58 | ||||||||||
2021 | 23 | 744,780 | 7.61 | 28,285,379 | 7.01 | 44.20 | ||||||||||
2022 | 19 | 523,144 | 5.35 | 26,619,168 | 6.60 | 56.41 | ||||||||||
2023 | 12 | 598,139 | 6.12 | 35,767,930 | 8.86 | 60.37 | ||||||||||
2024 | 22 | 1,279,240 | 13.08 | 58,533,339 | 14.50 | 48.06 | ||||||||||
2025 | 11 | 441,590 | 4.51 | 13,652,783 | 3.38 | 35.98 | ||||||||||
Thereafter | 22 | 1,406,631 | 14.38 | 60,187,387 | 14.91 | 46.00 | ||||||||||
Total | 385 | 9,780,856 | 100.00 | % | $ | 403,604,956 | 100.00 | % | $ | 44.62 | ||||||
(1) | Square feet of expiring leases and average contractual rent per square foot are operating statistics that represent 100% of the square footage and contractual rental income per square foot from expiring leases. |
(2) | Contractual rent expiring is an operating statistic and is not comparable to rental revenue, a GAAP financial measure. The primary differences arise because contractual rent is calculated at the Company’s ownership share and excludes adjustments for the impacts of straight-line rent, amortization of intangible assets related to in-place leases, above and below market leases and overage rental payments (which are not reasonably estimable). Contractual rent per square foot includes base rent, common area maintenance and real estate taxes. |
Office Lease Expirations
Percentage of Contractual Rent Expiring
As of December 31, 2015
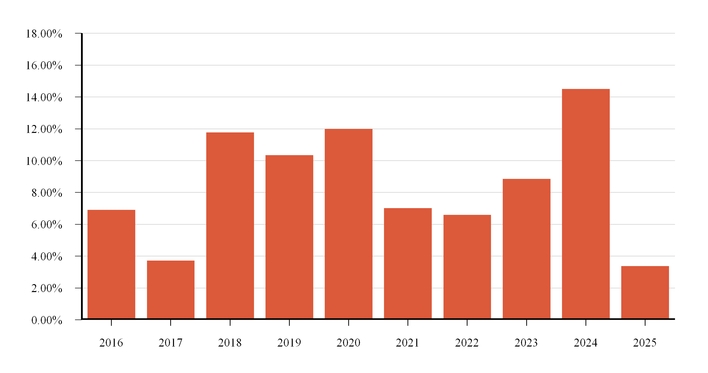
42
Forest City Realty Trust, Inc. and Subsidiaries
Supplemental Operating Information
Significant Retail Tenants as of December 31, 2015
(Based on contractual rent of 1% or greater at the Company’s ownership share) | ||||||||
Tenant | Primary DBA | Number of Leases | Leased Square Feet | Percentage of Total Retail Square Feet | ||||
Dick’s Sporting Goods, Inc. | Dick’s Sporting Goods | 7 | 421,749 | 4.26 | % | |||
Regal Entertainment Group | Regal Cinemas, Edwards Theatres, United Artists Theatres | 5 | 381,461 | 3.86 | ||||
Bass Pro Shops, Inc. | Bass Pro Outdoor World | 2 | 364,500 | 3.69 | ||||
Target Corporation | Target | 2 | 362,498 | 3.67 | ||||
The Gap, Inc. | Banana Republic, Gap, Old Navy, Athleta | 25 | 309,732 | 3.13 | ||||
AMC Entertainment, Inc. | AMC Theaters | 3 | 260,886 | 2.64 | ||||
The TJX Companies, Inc. | Marshalls, T.J. Maxx | 7 | 230,552 | 2.33 | ||||
H&M Hennes & Mauritz AB | H&M | 11 | 219,638 | 2.22 | ||||
L Brands, Inc. | Bath and Body Works, Victoria’s Secret, Pink | 32 | 202,329 | 2.05 | ||||
Ahold USA | Pathmark, Stop & Shop | 3 | 187,025 | 1.89 | ||||
Abercrombie & Fitch Co. | Abercrombie & Fitch, Hollister | 19 | 135,066 | 1.37 | ||||
Ascena Retail Group, Inc. | Ann Taylor, Loft, Lane Bryant, Justice | 23 | 113,426 | 1.15 | ||||
Costco Wholesale Corporation | Costco | 1 | 110,074 | 1.11 | ||||
Foot Locker, Inc. | FootLocker, Lady FootLocker, Kids FootLocker, FootAction USA, Champs Sports | 26 | 109,192 | 1.10 | ||||
Express, Inc. | Express | 12 | 107,780 | 1.09 | ||||
Best Buy Co., Inc. | Best Buy | 4 | 104,220 | 1.05 | ||||
Fitness International | LA Fitness, Fitness International | 2 | 85,062 | 0.86 | ||||
American Eagle Outfitters, Inc. | American Eagle Outfitters, Aerie | 12 | 69,895 | 0.71 | ||||
Signet Jewelers | Kay Jewelers, Zales Jewelers, Piercing Pagoda, Jared The Galleria of Jewelry | 30 | 42,255 | 0.43 | ||||
Subtotal | 226 | 3,817,340 | 38.61 | |||||
Others | 1,395 | 6,072,735 | 61.39 | |||||
Total | 1,621 | 9,890,075 | 100.00 | % | ||||
43
Forest City Realty Trust, Inc. and Subsidiaries
Supplemental Operating Information
Significant Office Tenants as of December 31, 2015
(Based on contractual rent of 2% or greater at the Company’s ownership share) | |||||
Tenant | Leased Square Feet | Percentage of Total Office Square Feet | |||
City of New York | 1,094,786 | 11.19 | % | ||
Millennium Pharmaceuticals, Inc. | 567,641 | 5.80 | |||
Anthem, Inc. | 392,514 | 4.01 | |||
U.S. Government | 388,076 | 3.97 | |||
JP Morgan Chase & Co. | 361,422 | 3.70 | |||
Bank of New York Mellon Corp. | 317,572 | 3.25 | |||
National Grid | 259,561 | 2.65 | |||
Clearbridge Investments, LLC | 201,028 | 2.06 | |||
Covington & Burling, LLP | 160,565 | 1.64 | |||
Agios Pharmaceuticals, Inc. | 146,034 | 1.49 | |||
Partners HealthCare | 136,150 | 1.39 | |||
ARIAD Pharmaceuticals, Inc. | 126,509 | 1.29 | |||
Seyfarth Shaw, LLP | 96,909 | 0.99 | |||
Subtotal | 4,248,767 | 43.43 | |||
Others | 5,532,089 | 56.57 | |||
Total | 9,780,856 | 100.00 | % | ||
44
Forest City Realty Trust, Inc. and Subsidiaries
Supplemental Operating Information
Historical Trends
Through the implementation of our strategic plan, we approach our business by:
• | Focusing on core markets and products as we develop, own and operate a high-quality portfolio; |
• | Driving operational excellence through all aspects of our company; and |
• | Building a strong, sustaining capital structure, improved balance sheet and debt metrics. |
The tables below illustrate our progress as we continue to implement our strategic plan. The financial and operating data presented is as reported in previous year-end supplemental packages. GAAP reconciliations for previous years can be found in prior supplemental packages furnished with the SEC and are available on our website at www.forestcity.net.
Development ratio is calculated in accordance with our financial covenants contained in our revolving credit facility. Total debt includes outstanding borrowings on our revolving credit facility, convertible senior debt, nonrecourse mortgages and notes payable. Net debt to Adjusted EBITDA is defined as total debt, less cash and equivalents, divided by Adjusted EBITDA. All metrics are reflected at our pro-rata share.
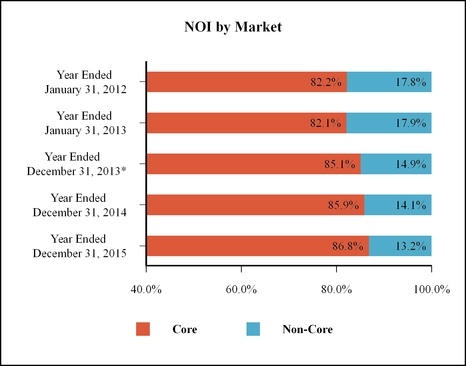
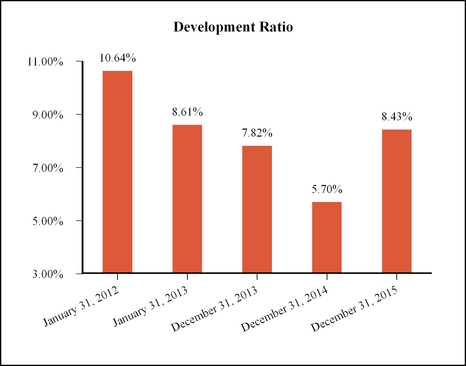
45
Forest City Realty Trust, Inc. and Subsidiaries
Supplemental Operating Information
Historical Trends (continued)
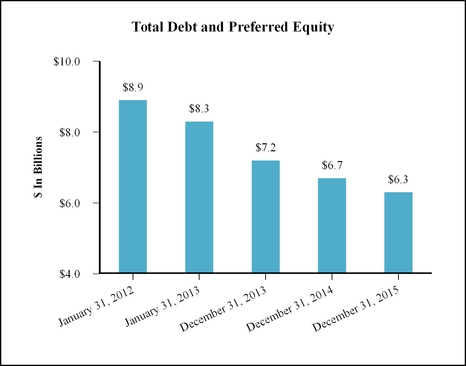
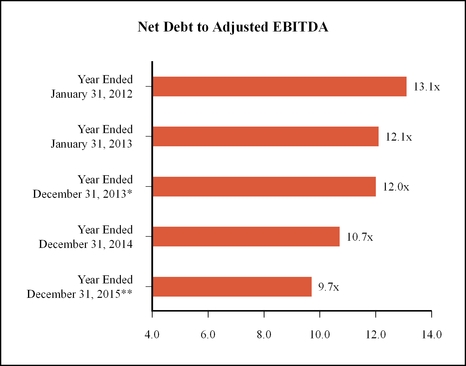
* | Represents data for the full year ended December 31, 2013, which is consistent with our calendar year-end adopted in 2013. As such, data for the year ended December 31, 2013 includes results for the month ended January 31, 2013, which was previously included in the financial results for the year ended January 31, 2013 in our supplemental package furnished with the SEC on March 27, 2013. |
** | See the Net Debt to Adjusted EBITDA schedule on page 38 of this supplemental package for impacts to this ratio related to annualizing 2015 acquisitions, sales and new openings and layering on the impacts of asset sales that closed prior to furnishing this Form 8-K. |
46
Forest City Realty Trust, Inc. and Subsidiaries
Supplemental Operating Information
Development Pipeline
Phased Property Openings and Projects Under Construction
December 31, 2015
Cost at Completion (b) | Cost Incurred to Date (c) | ||||||||||||||||||||||||||||
Anticipated | Legal | Cost at | Cost at | ||||||||||||||||||||||||||
Opening | Ownership | Pro-Rata | Cost | Pro-Rata | Cost | Pro-Rata | No. of | Lease % | |||||||||||||||||||||
Location | Date | (a) | % (a) | at 100% | Share | at 100% | Share | Units | GLA | (d) | |||||||||||||||||||
(in millions) | |||||||||||||||||||||||||||||
2015 Phased Openings | |||||||||||||||||||||||||||||
Residential: | |||||||||||||||||||||||||||||
Aster Town Center North | Denver, CO | Q4-15/Q1-16 | 90 | % | 90 | % | $ | 23.4 | $ | 21.1 | $ | 19.9 | $ | 17.9 | 135 | (e) | — | 43 | % | ||||||||||
Other: | |||||||||||||||||||||||||||||
Kapolei Lofts | Kapolei, HI | Q3-15/Q3-16 | 100 | % | 0 | % | (f) | 154.8 | 0.0 | 115.3 | 6.2 | 499 | — | 27 | % | ||||||||||||||
Total Phased Openings | $ | 178.2 | $ | 21.1 | $ | 135.2 | $ | 24.1 | |||||||||||||||||||||
Projects Under Construction | |||||||||||||||||||||||||||||
Residential: | |||||||||||||||||||||||||||||
Arizona State Retirement System Joint Venture: | |||||||||||||||||||||||||||||
The Yards - Arris | Washington, D.C. | Q1-16 | 25 | % | 25 | % | $ | 145.1 | $ | 37.8 | $ | 112.5 | $ | 30.1 | 327 | 19,000 | |||||||||||||
Blossom Plaza | Los Angeles, CA | Q2-16 | 25 | % | 25 | % | 104.9 | 26.9 | 65.8 | 19.1 | 237 | 19,000 | |||||||||||||||||
Eliot on 4th | Washington, D.C. | Q4-16 | 25 | % | 25 | % | 143.0 | 38.4 | 42.8 | 13.5 | 365 | 5,000 | |||||||||||||||||
Museum Towers II | Philadelphia, PA | Q4-16 | 25 | % | 25 | % | 114.0 | 28.9 | 46.1 | 13.0 | 286 | — | |||||||||||||||||
Broadway and Hill | Los Angeles, CA | Q3-17 | 25 | % | 25 | % | 140.3 | 36.3 | 60.5 | 19.4 | 391 | 15,000 | |||||||||||||||||
647.3 | 168.3 | 327.7 | 95.1 | 1,606 | 58,000 | ||||||||||||||||||||||||
Greenland Joint Venture: | |||||||||||||||||||||||||||||
535 Carlton | Brooklyn, NY | Q4-16/17 | 30 | % | (g) | 30 | % | 168.8 | 51.2 | 68.7 | 20.7 | 298 | — | ||||||||||||||||
550 Vanderbilt (condominiums) | Brooklyn, NY | Q1-17/18 | 30 | % | (g) | 30 | % | 362.7 | 111.8 | 191.3 | 60.5 | 278 | 7,000 | ||||||||||||||||
38 Sixth Ave | Brooklyn, NY | Q2-17/18 | 30 | % | (g) | 30 | % | 202.7 | 61.6 | 46.2 | 14.7 | 303 | 28,000 | ||||||||||||||||
Pacific Park - Parking (h) | Brooklyn, NY | Q4-16/17 | 30 | % | (g) | 30 | % | 46.2 | 13.8 | 26.5 | 7.9 | — | — | ||||||||||||||||
780.4 | 238.4 | 332.7 | 103.8 | 879 | 35,000 | ||||||||||||||||||||||||
The Bixby | Washington, D.C. | Q2-16 | 25 | % | (g) | 25 | % | 54.0 | 10.8 | 27.3 | 5.5 | 195 | — | ||||||||||||||||
B2 BKLYN | Brooklyn, NY | Q3-16 | 100 | % | 100 | % | 192.1 | 192.1 | 129.9 | 129.9 | 363 | 4,000 | |||||||||||||||||
Town Center Wrap | Denver, CO | Q4-16/Q3-17 | 95 | % | 95 | % | 93.1 | 88.4 | 4.9 | 4.7 | 399 | 7,000 | |||||||||||||||||
Hudson Exchange | Jersey City, NJ | Q1-18 | 50 | % | (g) | 50 | % | 213.2 | 106.6 | 37.3 | 19.8 | 421 | 9,000 | ||||||||||||||||
$ | 1,980.1 | $ | 804.6 | $ | 859.8 | $ | 358.8 | 3,863 | 113,000 | ||||||||||||||||||||
Office: | |||||||||||||||||||||||||||||
300 Massachusetts Ave | Cambridge, MA | Q1-16 | 50 | % | (g) | 50 | % | $ | 175.3 | $ | 98.8 | $ | 130.5 | $ | 71.0 | — | 246,000 | 100 | % | ||||||||||
1812 Ashland Ave | Baltimore, MD | Q3-16 | 85 | % | 100 | % | 60.7 | 60.7 | 35.7 | 35.7 | — | 164,000 | 70 | % | |||||||||||||||
The Bridge at Cornell Tech | Roosevelt Island, NY | Q2-17 | 100 | % | 100 | % | 164.1 | 164.1 | 48.6 | 48.6 | — | 235,000 | 39 | % | |||||||||||||||
$ | 400.1 | $ | 323.6 | $ | 214.8 | $ | 155.3 | — | 645,000 | ||||||||||||||||||||
Total Projects Under Construction (i) | $ | 2,380.2 | $ | 1,128.2 | $ | 1,074.6 | $ | 514.1 | |||||||||||||||||||||
Estimated Initial Yield on Cost | 5.5% - 6.0% | (j) | |||||||||||||||||||||||||||
See footnotes on the following page.
47
Forest City Realty Trust, Inc. and Subsidiaries
Supplemental Operating Information
Development Pipeline
Property Acquisition and Openings
December 31, 2015
Cost at Completion (b) | ||||||||||||||||||||||
Date Acquired/ | Legal | Cost | Cost at | No. of | ||||||||||||||||||
Location | Opened | Ownership (a) | Pro-Rata % (a) | at 100% | Pro-Rata Share | Units | GLA | Lease % (d) | ||||||||||||||
(in millions) | ||||||||||||||||||||||
2015 Property Acquisition | ||||||||||||||||||||||
Residential: | ||||||||||||||||||||||
500 Sterling Place | Brooklyn, NY | Q1-15 | 100 | % | 100 | % | $ | 48.1 | $ | 48.1 | 77 | — | 88 | % | ||||||||
2015 Property Openings | ||||||||||||||||||||||
Retail Expansions: | ||||||||||||||||||||||
Boulevard Mall | Amherst, NY | Q4-15 | 100 | % | 100 | % | $ | 10.9 | $ | 10.9 | — | 46,000 | 100 | % | ||||||||
Galleria at Sunset | Henderson, NV | Q2-15 | 51 | % | (g) | 51 | % | 24.7 | 13.8 | — | 32,000 | 59 | % | |||||||||
Total Property Openings | $ | 35.6 | $ | 24.7 | — | 78,000 | ||||||||||||||||
(a) | The Company invests in certain real estate projects through joint ventures and, at times, may provide funding at percentages that differ from the Company’s legal ownership. |
(b) | Represents estimated project costs to achieve stabilization, at 100% and the Company’s pro-rata share, respectively. Amounts exclude capitalized interest not allocated to the underlying joint venture. |
(c) | Represents total capitalized project costs incurred to date, at full consolidation and the Company’s pro-rata share, respectively, including all capitalized interest related to the development project. |
(d) | Lease commitments as of February 16, 2016. |
(e) | As of December 31, 2015, 63 of the 135 units were open. |
(f) | Kapolei Lofts is a residential project on land leased to the Company. The Company consolidates the land lessor, who is entitled to a preferred return that currently exceeds anticipated operating cash flow of the project, and therefore, this project is reflected at 0% for pro-rata purposes. In accordance with the waterfall provisions of the distribution Agreement, the Company expects to share in the net proceeds upon a sale of the project. The payments made under the lease are deemed a preferential return and allocated to noncontrolling interest. As of December 31, 2015, 139 of the 499 units were open. |
(g) | Reported under the equity method of accounting. This method represents a GAAP measure for investments in which the Company is not deemed to have control or to be the primary beneficiary of its investments in a VIE. |
(h) | Expected to include 370 parking spaces. |
(i) | Of the remaining project costs, the Company has undrawn construction loan commitments of $462.9 million on a pro-rata basis ($1.0 billion at 100%). |
(j) | Range of estimated initial yield on cost for projects under construction is calculated using estimated pro-rata initial stabilized NOI divided by pro-rata share of project cost per above, net of anticipated subsidies and other cost adjustments. 550 Vanderbilt (condominiums) has been excluded from estimated initial yield on cost. |
48
Forest City Realty Trust, Inc. and Subsidiaries
Supplemental Operating Information
Development Pipeline
Projects Under Development
December 31, 2015
Below is a summary of our active large scale development projects which are crucial to our long-term growth. While we cannot make any assurances on the timing or delivery of these projects, our track record speaks to our ability to bring large, complex projects to fruition when there is demand and available construction financing. The projects listed below represent pro-rata costs of $365.5 million ($150.7 million at full consolidation) of Projects Under Development on our balance sheet and pro-rata mortgage debt of $163.8 million ($11.0 million at full consolidation).
1) | Pacific Park Brooklyn - Brooklyn, NY |
Pacific Park Brooklyn, a 22-acre mixed-use project, is located adjacent to the state-of-the-art arena, Barclays Center. At full build-out, Pacific Park Brooklyn is expected to feature more than 6,400 units of housing, including 2,250 affordable units, approximately 250,000 square feet of retail space, and more than 8 acres of landscaped open space. Projects currently under construction include B2 BKLYN, a 50% market-rate and 50% affordable rental building with 363 residential units, 535 Carlton, a 100% affordable rental building with 298 residential units, 550 Vanderbilt, a 278-unit condominium building, 38 Sixth Ave, a 303-unit, 100% affordable rental building and parking garages which are expected to include 370 parking spaces.
2) | The Yards - Washington, D.C. |
The Yards is a 48-acre mixed-use project, located in the neighborhood of the Washington Nationals baseball park in the Capitol Riverfront District. At full build-out, the project is expected to include up to 3,400 residential units, 1.8 million square feet of office space and approximately 400,000 square feet of retail and dining space. The Yards features a 5.5-acre publicly funded public park that is a gathering place and recreational focus for the community. Current completed projects include a 170-unit residential building, Foundry Lofts; two retail centers: Boilermaker Shops and Lumber Shed, with 40,000 and 31,000 square feet, respectively; and Twelve12, a mixed-use property, with 218 residential units and 88,000 square feet of retail space. Arris, a mixed-use project, is currently under construction and is expected to feature 327 residential units and 19,000 square feet of retail space.
3) | The Science + Technology Park at Johns Hopkins - Baltimore, MD |
The Science + Technology Park at Johns Hopkins is a 31-acre center for collaborative research directly adjacent to the world-renowned Johns Hopkins medical and research complex. Plans call for 1.1 million square feet in five buildings, with future phases able to support additional expansion. Current completed projects include the 279,000 square-foot 855 North Wolfe Street, a 492,000 square-foot parking garage for Johns Hopkins and a 234,000 square-foot commercial building developed on a fee basis which is fully leased by the Department of Health & Mental Hygiene. Currently under construction is a 164,000 square-foot office building, 1812 Ashland Ave.
4) Waterfront Station - Washington, D.C.
Located in Southwest Washington, D.C., Waterfront Station is adjacent to the Waterfront MetroRail station. Waterfront Station is expected to include 660,000 square feet of office space, 365 residential units and 40,000 square feet of retail stores and restaurants. Currently under construction is a 365-unit residential building, Eliot on 4th.
5) Pier 70 - San Francisco, CA
Pier 70 is a former shipyard on San Francisco’s eastern waterfront. Our master development area of 28 acres is a mixed-use project, which is expected to include 3.2 million total square feet, consisting of 900,000 to 1.8 million square feet of office space, approximately 400,000 square feet of traditional retail, local production, and cultural/community uses, 1,000 to 2,000 residential units, approximately 2,000 parking spaces and 7 acres of waterfront parks.
6) 5M - San Francisco, CA
5M is a mixed-use project on approximately 4 acres in downtown San Francisco. 5M is expected to include approximately 800,000 square feet of commercial uses and 690 residential units. The project will retain three existing historic buildings, including the iconic San Francisco Chronicle building and would create significant new open spaces for the neighborhood. The project is designed to house a dynamic ground-floor mix featuring local retail and arts, cultural and community uses for a total of approximately 1.7 million square feet of development.
49
Forest City Realty Trust, Inc. and Subsidiaries
Supplemental Operating Information
Development Pipeline
Land Inventory
Land inventory represents undeveloped land parcels we currently do not intend to hold for future vertical development. A summary of our land inventory follows:
December 31, 2015 | December 31, 2014 | |||||||||||
Full Consolidation (GAAP) | Pro-Rata Consolidation (Non-GAAP) | Full Consolidation (GAAP) | Pro-Rata Consolidation (Non-GAAP) | |||||||||
(in thousands) | ||||||||||||
Stapleton | $ | 49,240 | $ | 44,378 | $ | 51,604 | $ | 46,583 | ||||
Commercial outlots | 20,078 | 28,545 | 45,865 | 54,072 | ||||||||
Total Land Inventory (1) | $ | 69,318 | $ | 72,923 | $ | 97,469 | $ | 100,655 | ||||
(1) | A full reconciliation of pro-rata consolidation (non-GAAP) to their GAAP equivalents can be found in the Selected Financial Information section of this supplemental package. |
Stapleton
Stapleton represents one of the nation’s largest urban redevelopments. At full build-out of 4,700 acres or 7.5 square miles, Stapleton is planned for more than 12,000 homes and apartments, 3 million square feet of retail and 10 million square feet of office/research and development/industrial space. Located 10 minutes east of Downtown Denver and 20 minutes from Denver International Airport, Stapleton is expected to be home to 30,000 residents and 35,000 workers when complete. As of December 31, 2015, we own 403 gross acres, of which 159 acres are saleable. We also have an option to purchase an additional 566 gross acres at Stapleton.
Commercial Outlots
Commercial outlots are primarily undeveloped parcels of land adjacent to our retail assets throughout the United States. These parcels are sold to third party operators that benefit from being in close proximity to the existing retail asset. Typically, these outlots have zoning and entitlements consistent with our retail asset. At December 31, 2014, land inventory included 13.5 acres of undeveloped land located in downtown Las Vegas, NV. We recorded an impairment charge of $16.3 million on this land inventory in 2015 and subsequently sold 6.1 acres of the land inventory at a sales price that approximated the carrying value.
50
Forest City Realty Trust, Inc. and Subsidiaries
Supplemental Operating Information
Military Housing
Property Openings and Projects Under Construction
as of December 31, 2015
The following summary includes Military Housing properties opened and those project phases having a percentage of units both opened and under construction:
Property | Location | Date Opened/Anticipated Opening | FCE Pro-Rata % | No. of Units | |
Military Housing Portfolio | |||||
Air Force Academy | Colorado Springs, CO | 2007-2011 | 50.00% | 427 | |
Marine Corp Base - Hawaii | Kaneohe, HI | 2007-2014 | * | 2,316 | |
Marines Region - Hawaii (Under Construction) | Honolulu, HI | 2015-2018 | * | 260 | |
Midwest Millington | Memphis, TN | 2008-2011 | * | 318 | |
Navy Midwest | Chicago, IL | 2006-2011 | * | 1,401 | |
Navy Region - Hawaii | Honolulu, HI | 2005-2011 | * | 4,472 | |
Pacific Northwest Communities | Seattle, WA | 2007-2011 | * | 3,077 | |
Pacific Northwest Communities - Phase II (Under Construction) | Seattle, WA | 2015-2018 | * | 367 | |
Southern Group: | |||||
Arnold Air Force Base | Tullahoma, TN | 2011-2013 | ** | 22 | |
Joint Base Charleston | Charleston, SC | 2011-2013 | ** | 345 | |
Keesler Air Force Base | Biloxi, MS | 2011-2012 | ** | 1,184 | |
Shaw Air Force Base | Sumter, SC | 2011-2015 | ** | 630 | |
Total Military Housing Units | 14,819 | ||||
*The Company's share of residual cash flow ranges from 0-20% during the life cycle of the project. | |||||
**We do not share in any cash flow from operations. However, we are entitled to the return of our equity at the end of the 50-year lease term. | |||||
Summary of Military Housing Net Operating Income
Development and construction management fees related to our military housing projects are earned based on a contractual percentage of the actual development and construction costs incurred. We also recognize additional development and construction incentive fees upon successful completion of certain criteria, such as incentives to realize development cost savings, encourage small and local business participation, comply with specified safety standards and other project management incentives as specified in the development and construction agreements. NOI from development, construction and incentive fees was $6,319,000 and $4,761,000 for the years ended December 31, 2015 and 2014, respectively.
Property and asset management fees are earned based on a contractual percentage of the annual net rental income and annual operating income, respectively, that is generated by the military housing privatization projects as defined in the agreements. We also recognize certain property management incentive fees based upon successful completion of certain criteria as set forth in the property management agreements. Property management, management incentive and asset management fees generated NOI of $18,247,000 and $15,844,000 for the years ended December 31, 2015 and 2014, respectively.
Disposal of Military Housing Portfolio
On February 22, 2016, we sold 100% of our ownership interests in our Military Housing portfolio.
51
Forest City Realty Trust, Inc. and Subsidiaries
Supplemental Financial Information
Common Stock Data (NYSE: FCE A and FCE B)
The following summarizes information related to the Company’s Class A and Class B common stock based on information reported by the New York Stock Exchange:
Quarter Ended | |||||||||||||||||||
December 31, 2015 | September 30, 2015 | June 30, 2015 | March 31, 2015 | December 31, 2014 | |||||||||||||||
Class A Common Stock | |||||||||||||||||||
Closing Price, end of period | $ | 21.93 | $ | 20.13 | $ | 22.10 | $ | 25.52 | $ | 21.30 | |||||||||
High Sales Price | $ | 23.73 | $ | 23.96 | $ | 25.88 | $ | 25.90 | $ | 21.90 | |||||||||
Low Sales Price | $ | 20.12 | $ | 19.34 | $ | 22.07 | $ | 20.68 | $ | 19.03 | |||||||||
Average Sales Price | $ | 21.76 | $ | 22.04 | $ | 23.70 | $ | 24.49 | $ | 20.80 | |||||||||
Total Volume | 66,703,892 | 99,971,191 | 102,548,636 | 69,096,438 | 70,389,527 | ||||||||||||||
Average Volume | 1,042,248 | 1,562,050 | 1,627,756 | 1,132,728 | 1,099,836 | ||||||||||||||
Common shares outstanding, end of period | 238,949,141 | 238,844,963 | 231,391,181 | 193,501,911 | 179,763,952 | ||||||||||||||
Class B Common Stock | |||||||||||||||||||
Closing Price, end of period | $ | 21.87 | $ | 20.95 | $ | 23.00 | $ | 25.50 | $ | 21.34 | |||||||||
High Sales Price | $ | 23.82 | $ | 23.83 | $ | 25.83 | $ | 25.81 | $ | 21.74 | |||||||||
Low Sales Price | $ | 19.97 | $ | 19.76 | $ | 22.50 | $ | 20.74 | $ | 19.20 | |||||||||
Average Sales Price | $ | 22.07 | $ | 21.93 | $ | 23.89 | $ | 24.60 | $ | 20.69 | |||||||||
Total Volume | 43,101 | 139,488 | 64,791 | 37,129 | 59,140 | ||||||||||||||
Average Volume | 673 | 2,180 | 1,028 | 609 | 924 | ||||||||||||||
Common shares outstanding, end of period | 18,805,285 | 18,824,341 | 18,891,153 | 18,942,503 | 19,208,517 | ||||||||||||||
Common Equity Market Capitalization | $ | 5,651,426,245 | $ | 5,202,319,049 | $ | 5,548,241,619 | $ | 5,421,202,595 | $ | 4,238,881,931 | |||||||||
Quarterly dividends declared per common share Class A and Class B | $ | — | $ | — | $ | — | $ | — | $ | — | |||||||||
Financial Covenants
Our revolving credit facility contains certain restrictive financial covenants. A summary of the key financial covenants as defined in the agreement, all of which we are compliant with at December 31, 2015, follows:
Requirement Per Agreement | As of December 31, 2015 | |||
(dollars in thousands) | ||||
Credit Facility Financial Covenants | ||||
Maximum Total Leverage Ratio | ≤65% | 52.71 | % | |
Maximum Secured Leverage Ratio (1) | ≤55% | 50.71 | % | |
Maximum Secured Recourse Leverage Ratio (1) | ≤15% | 0.00 | % | |
Minimum Fixed Charge Coverage Ratio (1) | ≥1.50x | 1.72 | x | |
Maximum Unsecured Leverage Ratio (1) | ≤60% | 12.00 | % | |
Minimum Unencumbered Interest Coverage Ratio (1) | ≥1.50x | 2.18 | x | |
(1) | The first required reporting period for these financial covenants is effective for the three months ending March 31, 2016; however, at December 31, 2015, we would have been in compliance with all of these financial covenants. |
52
Forest City Realty Trust, Inc. and Subsidiaries
Supplemental Financial Information
Nonrecourse Debt Maturities Table (dollars in thousands)
As of December 31, 2015
Year Ending December 31, 2016 | Year Ending December 31, 2017 | ||||||||||||||||||||||||
Full Consolidation | Less Noncontrolling Interest | Plus Unconsolidated Investments at Pro-Rata | Pro-Rata Consolidation | Full Consolidation | Less Noncontrolling Interest | Plus Unconsolidated Investments at Pro-Rata | Pro-Rata Consolidation | ||||||||||||||||||
Fixed: | |||||||||||||||||||||||||
Fixed-rate debt | $ | 209,362 | $ | 47,634 | $ | 172,384 | $ | 334,112 | $ | 270,182 | $ | 10,954 | $ | 361,106 | $ | 620,334 | |||||||||
Weighted average rate | 7.87 | % | 10.73 | % | 5.71 | % | 6.35 | % | 5.65 | % | 5.99 | % | 5.72 | % | 5.69 | % | |||||||||
Variable: | |||||||||||||||||||||||||
Variable-rate debt | 63,767 | 476 | 10,828 | 74,119 | 1,007,597 | 4,465 | 62,624 | 1,065,756 | |||||||||||||||||
Weighted average rate | 2.71 | % | 3.17 | % | 3.84 | % | 2.87 | % | 5.77 | % | 3.05 | % | 1.64 | % | 5.53 | % | |||||||||
Tax-Exempt | — | — | 280 | 280 | — | — | 25,100 | 25,100 | |||||||||||||||||
Weighted average rate | — | % | — | % | 1.38 | % | 1.38 | % | — | % | — | % | 0.91 | % | 0.91 | % | |||||||||
Total variable-rate debt | 63,767 | 476 | 11,108 | 74,399 | 1,007,597 | 4,465 | 87,724 | 1,090,856 | |||||||||||||||||
Total Nonrecourse Debt | $ | 273,129 | $ | 48,110 | $ | 183,492 | $ | 408,511 | $ | 1,277,779 | $ | 15,419 | $ | 448,830 | $ | 1,711,190 | |||||||||
Weighted Average Rate | 6.67 | % | 10.65 | % | 5.59 | % | 5.72 | % | 5.74 | % | 5.14 | % | 4.88 | % | 5.52 | % | |||||||||
Year Ending December 31, 2018 | Year Ending December 31, 2019 | ||||||||||||||||||||||||
Full Consolidation | Less Noncontrolling Interest | Plus Unconsolidated Investments at Pro-Rata | Pro-Rata Consolidation | Full Consolidation | Less Noncontrolling Interest | Plus Unconsolidated Investments at Pro-Rata | Pro-Rata Consolidation | ||||||||||||||||||
Fixed: | |||||||||||||||||||||||||
Fixed-rate debt | $ | 208,737 | $ | 7,162 | $ | 250,794 | $ | 452,369 | $ | 114,212 | $ | 3,885 | $ | 40,650 | $ | 150,977 | |||||||||
Weighted average rate | 4.57 | % | 3.80 | % | 4.99 | % | 4.81 | % | 4.01 | % | 4.80 | % | 5.73 | % | 4.45 | % | |||||||||
Variable: | |||||||||||||||||||||||||
Variable-rate debt | 64,232 | 39,391 | 7,823 | 32,664 | 239,554 | 53,293 | 106,780 | 293,041 | |||||||||||||||||
Weighted average rate | 2.96 | % | 2.79 | % | 3.69 | % | 3.33 | % | 2.21 | % | 1.31 | % | 4.15 | % | 3.08 | % | |||||||||
Tax-Exempt | 129,776 | 38,682 | 53,040 | 144,134 | 8,500 | — | 20,000 | 28,500 | |||||||||||||||||
Weighted average rate | 1.44 | % | 2.12 | % | 2.01 | % | 1.47 | % | 2.97 | % | — | % | 0.84 | % | 1.48 | % | |||||||||
Total variable-rate debt | 194,008 | 78,073 | 60,863 | 176,798 | 248,054 | 53,293 | 126,780 | 321,541 | |||||||||||||||||
Total Nonrecourse Debt | $ | 402,745 | $ | 85,235 | $ | 311,657 | $ | 629,167 | $ | 362,266 | $ | 57,178 | $ | 167,430 | $ | 472,518 | |||||||||
Weighted Average Rate | 3.30 | % | 2.57 | % | 4.45 | % | 3.97 | % | 2.79 | % | 1.55 | % | 4.14 | % | 3.42 | % | |||||||||
53
Forest City Realty Trust, Inc. and Subsidiaries
Supplemental Financial Information
Scheduled Maturities Table: Nonrecourse Debt (dollars in thousands) (continued)
As of December 31, 2015
Year Ending December 31, 2020 | Thereafter | ||||||||||||||||||||||||
Full Consolidation | Less Noncontrolling Interest | Plus Unconsolidated Investments at Pro-Rata | Pro-Rata Consolidation | Full Consolidation | Less Noncontrolling Interest | Plus Unconsolidated Investments at Pro-Rata | Pro-Rata Consolidation | ||||||||||||||||||
Fixed: | |||||||||||||||||||||||||
Fixed-rate debt | $ | 160,767 | $ | 23,184 | $ | 143,986 | $ | 281,569 | $ | 1,486,116 | $ | 340,537 | $ | 909,618 | $ | 2,055,197 | |||||||||
Weighted average rate | 5.09 | % | 4.47 | % | 4.85 | % | 5.02 | % | 5.38 | % | 7.25 | % | 4.30 | % | 4.59 | % | |||||||||
Variable: | |||||||||||||||||||||||||
Variable-rate debt | 184 | — | 741 | 925 | 53,080 | — | 2,050 | 55,130 | |||||||||||||||||
Weighted average rate | 4.37 | % | — | % | 1.88 | % | 2.38 | % | 3.19 | % | — | % | 1.30 | % | 3.12 | % | |||||||||
Tax-Exempt | — | — | — | — | 445,129 | 89,514 | 66,875 | 422,490 | |||||||||||||||||
Weighted average rate | — | % | — | % | — | % | — | % | 0.98 | % | 1.01 | % | 0.96 | % | 0.98 | % | |||||||||
Total variable-rate debt | 184 | — | 741 | 925 | 498,209 | 89,514 | 68,925 | 477,620 | |||||||||||||||||
Total Nonrecourse Debt | $ | 160,951 | $ | 23,184 | $ | 144,727 | $ | 282,494 | $ | 1,984,325 | $ | 430,051 | $ | 978,543 | $ | 2,532,817 | |||||||||
Weighted Average Rate | 5.09 | % | 4.47 | % | 4.84 | % | 5.01 | % | 4.33 | % | 5.95 | % | 4.06 | % | 3.95 | % | |||||||||
Total | |||||||||||||||||||||||||
Full Consolidation | Less Noncontrolling Interest | Plus Unconsolidated Investments at Pro-Rata | Pro-Rata Consolidation | ||||||||||||||||||||||
Fixed: | |||||||||||||||||||||||||
Fixed-rate debt | $ | 2,449,376 | $ | 433,356 | $ | 1,878,538 | $ | 3,894,558 | |||||||||||||||||
Weighted average rate | 5.47 | % | 7.37 | % | 4.87 | % | 4.97 | % | |||||||||||||||||
Variable: | |||||||||||||||||||||||||
Variable-rate debt | 1,428,414 | 97,625 | 190,846 | 1,521,635 | |||||||||||||||||||||
Weighted average rate | 4.81 | % | 2.00 | % | 3.25 | % | 4.80 | % | |||||||||||||||||
Tax-Exempt | 583,405 | 128,196 | 165,295 | 620,504 | |||||||||||||||||||||
Weighted average rate | 1.11 | % | 1.34 | % | 1.28 | % | 1.11 | % | |||||||||||||||||
Total variable-rate debt | 2,011,819 | 225,821 | 356,141 | 2,142,139 | |||||||||||||||||||||
Total Nonrecourse Debt | $ | 4,461,195 | $ | 659,177 | $ | 2,234,679 | $ | 6,036,697 | |||||||||||||||||
Weighted Average Rate | 4.69 | % | 5.40 | % | 4.46 | % | 4.53 | % | |||||||||||||||||
54
Forest City Realty Trust, Inc. and Subsidiaries
Supplemental Financial Information
Summary of FFO by Segment - Three Months and Year Ended December 31, 2015 (in thousands)
Three Months Ended December 31, 2015 | Year Ended December 31, 2015 | |||||||||||||||||||||||||||||||
Full Consolidation (GAAP) | Less Noncontrolling Interest | Plus Unconsolidated Investments at Pro-Rata | Plus Discontinued Operations | Pro-Rata Consolidation (Non-GAAP) | Full Consolidation (GAAP) | Less Noncontrolling Interest | Plus Unconsolidated Investments at Pro-Rata | Plus Discontinued Operations | Pro-Rata Consolidation (Non-GAAP) | |||||||||||||||||||||||
Commercial Group | ||||||||||||||||||||||||||||||||
Total revenues | $ | 164,162 | $ | 4,853 | $ | 57,270 | $ | — | $ | 216,579 | $ | 587,020 | $ | 20,298 | $ | 245,402 | $ | — | $ | 812,124 | ||||||||||||
Revenue adjustments: | ||||||||||||||||||||||||||||||||
Revenues of unconsolidated entities | 57,270 | — | (57,270 | ) | — | — | 245,402 | — | (245,402 | ) | — | — | ||||||||||||||||||||
Exclude land sales | (8,555 | ) | — | — | — | (8,555 | ) | (8,555 | ) | — | — | — | (8,555 | ) | ||||||||||||||||||
Exclude land sales of unconsolidated entities | — | — | — | — | — | — | — | — | — | — | ||||||||||||||||||||||
Exclude Land Development Group revenues | — | — | — | — | — | — | — | — | — | — | ||||||||||||||||||||||
Exclude Land Development Group revenues of unconsolidated entities | — | — | — | — | — | — | — | — | — | — | ||||||||||||||||||||||
Adjusted revenues | 212,877 | 4,853 | — | — | 208,024 | 823,867 | 20,298 | — | — | 803,569 | ||||||||||||||||||||||
Operating expenses | 88,321 | 2,837 | 24,720 | — | 110,204 | 315,250 | 10,792 | 97,970 | — | 402,428 | ||||||||||||||||||||||
Operating expense adjustments: | ||||||||||||||||||||||||||||||||
Operating expenses of unconsolidated entities | 24,720 | — | (24,720 | ) | — | — | 97,970 | — | (97,970 | ) | — | — | ||||||||||||||||||||
Exclude cost of land sales | (8,482 | ) | — | — | — | (8,482 | ) | (8,482 | ) | — | — | — | (8,482 | ) | ||||||||||||||||||
Exclude Land Development Group operating expenses | — | — | — | — | — | — | — | — | — | — | ||||||||||||||||||||||
Exclude Land Development Group operating expenses of unconsolidated entities | — | — | — | — | — | — | — | — | — | — | ||||||||||||||||||||||
Exclude corporate general and administrative expenses | — | — | — | — | — | — | — | — | — | — | ||||||||||||||||||||||
Exclude REIT conversion and reorganization costs | — | — | — | — | — | — | — | — | — | — | ||||||||||||||||||||||
Adjusted operating expenses | 104,559 | 2,837 | — | — | 101,722 | 404,738 | 10,792 | — | — | 393,946 | ||||||||||||||||||||||
Net operating income | 108,318 | 2,016 | — | — | 106,302 | 419,129 | 9,506 | — | — | 409,623 | ||||||||||||||||||||||
Equity in earnings (loss) of unconsolidated entities | 1,103 | — | (1,103 | ) | — | — | 22,420 | — | (22,420 | ) | — | — | ||||||||||||||||||||
Exclude depreciation and amortization of unconsolidated entities | 15,499 | — | (15,499 | ) | — | — | 57,593 | — | (57,593 | ) | — | — | ||||||||||||||||||||
Exclude gain on disposition of unconsolidated entities | — | — | — | — | — | (1,009 | ) | — | 1,009 | — | — | |||||||||||||||||||||
Exclude impairment of unconsolidated depreciable real estate | — | — | — | — | — | — | — | — | — | — | ||||||||||||||||||||||
Revenue adjustments (per above) | (48,715 | ) | — | 57,270 | — | 8,555 | (236,847 | ) | — | 245,402 | — | 8,555 | ||||||||||||||||||||
Operating expense adjustments (per above) | 16,238 | — | (24,720 | ) | — | (8,482 | ) | 89,488 | — | (97,970 | ) | — | (8,482 | ) | ||||||||||||||||||
Write-offs of abandoned development projects | — | — | — | — | — | (5,104 | ) | — | — | — | (5,104 | ) | ||||||||||||||||||||
Interest and other income | 1,499 | — | 349 | — | 1,848 | 7,113 | 10 | 472 | — | 7,575 | ||||||||||||||||||||||
Interest expense | (29,586 | ) | (967 | ) | (16,297 | ) | — | (44,916 | ) | (118,797 | ) | (4,113 | ) | (68,892 | ) | — | (183,576 | ) | ||||||||||||||
Loss on extinguishment of debt | — | — | — | — | — | (3,114 | ) | — | (8 | ) | — | (3,122 | ) | |||||||||||||||||||
Impairment of non-depreciable real estate | — | — | — | — | — | (16,307 | ) | — | — | — | (16,307 | ) | ||||||||||||||||||||
Amortization of mortgage procurement costs | (1,750 | ) | — | — | — | (1,750 | ) | (7,139 | ) | — | — | — | (7,139 | ) | ||||||||||||||||||
Net gain (loss) on change in control of interests | (1,405 | ) | — | — | — | (1,405 | ) | 462,238 | — | — | — | 462,238 | ||||||||||||||||||||
Non-Real Estate depreciation and amortization | (349 | ) | — | — | — | (349 | ) | (1,141 | ) | — | — | — | (1,141 | ) | ||||||||||||||||||
Noncontrolling interest in FFO | (1,049 | ) | (1,049 | ) | — | — | — | (5,403 | ) | (5,403 | ) | — | — | — | ||||||||||||||||||
Pre-tax FFO from discontinued operations | — | — | — | — | — | — | — | — | — | — | ||||||||||||||||||||||
Income tax benefit (expense) on FFO | — | — | — | — | — | — | — | — | — | — | ||||||||||||||||||||||
FFO attributable to Forest City Realty Trust, Inc. | $ | 59,803 | $ | — | $ | — | $ | — | $ | 59,803 | $ | 663,120 | $ | — | $ | — | $ | — | $ | 663,120 | ||||||||||||
Depreciation and amortization - Real Estate Groups | (61,631 | ) | — | — | — | (61,631 | ) | (214,339 | ) | — | — | — | (214,339 | ) | ||||||||||||||||||
Net gain on disposition of full or partial interests in rental properties | — | — | — | — | — | 1,746 | — | 1,009 | — | 2,755 | ||||||||||||||||||||||
Gain on disposition of unconsolidated entities | — | — | — | — | — | 1,009 | — | (1,009 | ) | — | — | |||||||||||||||||||||
Impairment of consolidated and unconsolidated depreciable real estate | (25,971 | ) | — | — | — | (25,971 | ) | (426,704 | ) | — | — | — | (426,704 | ) | ||||||||||||||||||
Impairment of unconsolidated depreciable real estate | — | — | — | — | — | — | — | — | — | — | ||||||||||||||||||||||
Non-FFO from discontinued operations | — | — | — | — | — | — | — | — | — | — | ||||||||||||||||||||||
Net earnings (loss) attributable to Forest City Realty Trust, Inc. | $ | (27,799 | ) | $ | — | $ | — | $ | — | $ | (27,799 | ) | $ | 24,832 | $ | — | $ | — | $ | — | $ | 24,832 | ||||||||||
55
Forest City Realty Trust, Inc. and Subsidiaries
Supplemental Financial Information
Summary of FFO by Segment - Three Months and Year Ended December 31, 2015 (in thousands) (continued)
Three Months Ended December 31, 2015 | Year Ended December 31, 2015 | |||||||||||||||||||||||||||||||
Full Consolidation (GAAP) | Less Noncontrolling Interest | Plus Unconsolidated Investments at Pro-Rata | Plus Discontinued Operations | Pro-Rata Consolidation (Non-GAAP) | Full Consolidation (GAAP) | Less Noncontrolling Interest | Plus Unconsolidated Investments at Pro-Rata | Plus Discontinued Operations | Pro-Rata Consolidation (Non-GAAP) | |||||||||||||||||||||||
Residential Group | ||||||||||||||||||||||||||||||||
Total revenues | $ | 82,731 | $ | 9,545 | $ | 35,439 | $ | — | $ | 108,625 | $ | 312,954 | $ | 37,530 | $ | 142,540 | $ | — | $ | 417,964 | ||||||||||||
Revenue adjustments: | ||||||||||||||||||||||||||||||||
Revenues of unconsolidated entities | 35,439 | — | (35,439 | ) | — | — | 142,540 | — | (142,540 | ) | — | — | ||||||||||||||||||||
Exclude land sales | — | — | — | — | — | (611 | ) | — | — | — | (611 | ) | ||||||||||||||||||||
Exclude land sales of unconsolidated entities | — | — | — | — | — | — | — | — | — | — | ||||||||||||||||||||||
Exclude Land Development Group revenues | — | — | — | — | — | — | — | — | — | — | ||||||||||||||||||||||
Exclude Land Development Group revenues of unconsolidated entities | — | — | — | — | — | — | — | — | — | — | ||||||||||||||||||||||
Adjusted revenues | 118,170 | 9,545 | — | — | 108,625 | 454,883 | 37,530 | — | — | 417,353 | ||||||||||||||||||||||
Operating expenses | 46,892 | 4,213 | 18,402 | — | 61,081 | 181,009 | 14,515 | 76,382 | — | 242,876 | ||||||||||||||||||||||
Operating expense adjustments: | ||||||||||||||||||||||||||||||||
Operating expenses of unconsolidated entities | 18,402 | — | (18,402 | ) | — | — | 76,382 | — | (76,382 | ) | — | — | ||||||||||||||||||||
Exclude cost of land sales | — | — | — | — | — | (90 | ) | — | — | — | (90 | ) | ||||||||||||||||||||
Exclude Land Development Group operating expenses | — | — | — | — | — | — | — | — | — | — | ||||||||||||||||||||||
Exclude Land Development Group operating expenses of unconsolidated entities | — | — | — | — | — | — | — | — | — | — | ||||||||||||||||||||||
Exclude corporate general and administrative expenses | — | — | — | — | — | — | — | — | — | — | ||||||||||||||||||||||
Exclude REIT conversion and reorganization costs | — | — | — | — | — | — | — | — | — | — | ||||||||||||||||||||||
Adjusted operating expenses | 65,294 | 4,213 | — | — | 61,081 | 257,301 | 14,515 | — | — | 242,786 | ||||||||||||||||||||||
Net operating income | 52,876 | 5,332 | — | — | 47,544 | 197,582 | 23,015 | — | — | 174,567 | ||||||||||||||||||||||
Equity in earnings (loss) of unconsolidated entities | (9,316 | ) | 46 | 8,836 | — | (526 | ) | 6,009 | 204 | (4,299 | ) | — | 1,506 | |||||||||||||||||||
Exclude depreciation and amortization of unconsolidated entities | 8,075 | — | (8,075 | ) | — | — | 30,822 | — | (30,822 | ) | — | — | ||||||||||||||||||||
Exclude gain on disposition of unconsolidated entities | — | — | — | — | — | (19,284 | ) | — | 19,284 | — | — | |||||||||||||||||||||
Exclude impairment of unconsolidated depreciable real estate | 12,460 | — | (12,460 | ) | — | — | 12,460 | — | (12,460 | ) | — | |||||||||||||||||||||
Revenue adjustments (per above) | (35,439 | ) | — | 35,439 | — | — | (141,929 | ) | — | 142,540 | — | 611 | ||||||||||||||||||||
Operating expense adjustments (per above) | 18,402 | — | (18,402 | ) | — | — | 76,292 | — | (76,382 | ) | — | (90 | ) | |||||||||||||||||||
Write-offs of abandoned development projects | (2,596 | ) | — | — | — | (2,596 | ) | (3,270 | ) | — | (10,191 | ) | — | (13,461 | ) | |||||||||||||||||
Interest and other income | 3,806 | 230 | 373 | — | 3,949 | 13,596 | 407 | 1,304 | — | 14,493 | ||||||||||||||||||||||
Interest expense | (3,194 | ) | (1,415 | ) | (5,711 | ) | — | (7,490 | ) | (15,823 | ) | (5,129 | ) | (28,246 | ) | — | (38,940 | ) | ||||||||||||||
Loss on extinguishment of debt | (2,351 | ) | — | — | — | (2,351 | ) | (3,398 | ) | (719 | ) | (728 | ) | — | (3,407 | ) | ||||||||||||||||
Impairment of non-depreciable real estate | — | — | — | — | — | — | — | — | — | — | ||||||||||||||||||||||
Amortization of mortgage procurement costs | (765 | ) | — | — | — | (765 | ) | (3,235 | ) | — | — | — | (3,235 | ) | ||||||||||||||||||
Net gain (loss) on change in control of interests | — | — | — | — | — | 24,041 | — | — | — | 24,041 | ||||||||||||||||||||||
Non-Real Estate depreciation and amortization | (197 | ) | — | — | — | (197 | ) | (687 | ) | — | — | — | (687 | ) | ||||||||||||||||||
Noncontrolling interest in FFO | (4,193 | ) | (4,193 | ) | — | — | — | (17,778 | ) | (17,778 | ) | — | — | — | ||||||||||||||||||
Pre-tax FFO from discontinued operations | — | — | — | — | — | — | — | — | — | — | ||||||||||||||||||||||
Income tax benefit (expense) on FFO | — | — | — | — | — | — | — | — | — | — | ||||||||||||||||||||||
FFO attributable to Forest City Realty Trust, Inc. | $ | 37,568 | $ | — | $ | — | $ | — | $ | 37,568 | $ | 155,398 | $ | — | $ | — | $ | — | $ | 155,398 | ||||||||||||
Depreciation and amortization - Real Estate Groups | (28,243 | ) | — | — | — | (28,243 | ) | (102,900 | ) | — | — | — | (102,900 | ) | ||||||||||||||||||
Net gain on disposition of full or partial interests in rental properties | — | — | — | — | — | — | — | 19,284 | — | 19,284 | ||||||||||||||||||||||
Gain on disposition of unconsolidated entities | — | — | — | — | — | 19,284 | — | (19,284 | ) | — | — | |||||||||||||||||||||
Impairment of consolidated and unconsolidated depreciable real estate | — | — | (12,460 | ) | — | (12,460 | ) | (8,423 | ) | — | (12,460 | ) | — | (20,883 | ) | |||||||||||||||||
Impairment of unconsolidated depreciable real estate | (12,460 | ) | — | 12,460 | — | — | (12,460 | ) | — | 12,460 | — | — | ||||||||||||||||||||
Non-FFO from discontinued operations | — | — | — | — | — | — | — | — | — | — | ||||||||||||||||||||||
Net earnings (loss) attributable to Forest City Realty Trust, Inc. | $ | (3,135 | ) | $ | — | $ | — | $ | — | $ | (3,135 | ) | $ | 50,899 | $ | — | $ | — | $ | — | $ | 50,899 | ||||||||||
56
Forest City Realty Trust, Inc. and Subsidiaries
Supplemental Financial Information
Summary of FFO by Segment - Three Months and Year Ended December 31, 2015 (in thousands) (continued)
Three Months Ended December 31, 2015 | Year Ended December 31, 2015 | |||||||||||||||||||||||||||||||
Full Consolidation (GAAP) | Less Noncontrolling Interest | Plus Unconsolidated Investments at Pro-Rata | Plus Discontinued Operations | Pro-Rata Consolidation (Non-GAAP) | Full Consolidation (GAAP) | Less Noncontrolling Interest | Plus Unconsolidated Investments at Pro-Rata | Plus Discontinued Operations | Pro-Rata Consolidation (Non-GAAP) | |||||||||||||||||||||||
Arena | ||||||||||||||||||||||||||||||||
Total revenues | $ | — | $ | — | $ | — | $ | 30,423 | $ | 30,423 | $ | — | $ | — | $ | — | $ | 74,598 | $ | 74,598 | ||||||||||||
Revenue adjustments: | ||||||||||||||||||||||||||||||||
Revenues of unconsolidated entities | — | — | — | — | — | — | — | — | — | — | ||||||||||||||||||||||
Exclude land sales | — | — | — | — | — | — | — | — | — | — | ||||||||||||||||||||||
Exclude land sales of unconsolidated entities | — | — | — | — | — | — | — | — | — | — | ||||||||||||||||||||||
Exclude Land Development Group revenues | — | — | — | — | — | — | — | — | — | — | ||||||||||||||||||||||
Exclude Land Development Group revenues of unconsolidated entities | — | — | — | — | — | — | — | — | — | — | ||||||||||||||||||||||
Adjusted revenues | — | — | — | 30,423 | 30,423 | — | — | — | 74,598 | 74,598 | ||||||||||||||||||||||
Operating expenses | — | — | — | 21,903 | 21,903 | — | — | — | 52,655 | 52,655 | ||||||||||||||||||||||
Operating expense adjustments: | ||||||||||||||||||||||||||||||||
Operating expenses of unconsolidated entities | — | — | — | — | — | — | — | — | — | — | ||||||||||||||||||||||
Exclude cost of land sales | — | — | — | — | — | — | — | — | — | — | ||||||||||||||||||||||
Exclude Land Development Group operating expenses | — | — | — | — | — | — | — | — | — | — | ||||||||||||||||||||||
Exclude Land Development Group operating expenses of unconsolidated entities | — | — | — | — | — | — | — | — | — | — | ||||||||||||||||||||||
Exclude corporate general and administrative expenses | — | — | — | — | — | — | — | — | — | — | ||||||||||||||||||||||
Exclude REIT conversion and reorganization costs | — | — | — | — | — | — | — | — | — | — | ||||||||||||||||||||||
Adjusted operating expenses | — | — | — | 21,903 | 21,903 | — | — | — | 52,655 | 52,655 | ||||||||||||||||||||||
Net operating income | — | — | — | 8,520 | 8,520 | — | — | — | 21,943 | 21,943 | ||||||||||||||||||||||
Equity in earnings (loss) of unconsolidated entities | — | — | — | — | — | — | — | — | — | — | ||||||||||||||||||||||
Exclude depreciation and amortization of unconsolidated entities | — | — | — | — | — | — | — | — | — | — | ||||||||||||||||||||||
Exclude gain on disposition of unconsolidated entities | — | — | — | — | — | — | — | — | — | — | ||||||||||||||||||||||
Exclude impairment of unconsolidated depreciable real estate | — | — | — | — | — | — | — | — | — | — | ||||||||||||||||||||||
Revenue adjustments (per above) | — | — | — | — | — | — | — | — | — | — | ||||||||||||||||||||||
Operating expense adjustments (per above) | — | — | — | — | — | — | — | — | — | — | ||||||||||||||||||||||
Write-offs of abandoned development projects | — | — | — | — | — | — | — | — | — | — | ||||||||||||||||||||||
Interest and other income | — | — | — | — | — | — | — | — | — | — | ||||||||||||||||||||||
Interest expense | — | — | — | (4,917 | ) | (4,917 | ) | — | — | — | (18,861 | ) | (18,861 | ) | ||||||||||||||||||
Loss on extinguishment of debt | — | — | — | — | — | — | — | — | — | — | ||||||||||||||||||||||
Impairment of non-depreciable real estate | — | — | — | — | — | — | — | — | — | — | ||||||||||||||||||||||
Amortization of mortgage procurement costs | — | — | — | (226 | ) | (226 | ) | — | — | — | (226 | ) | (226 | ) | ||||||||||||||||||
Net gain (loss) on change in control of interests | — | — | — | — | — | — | — | — | — | — | ||||||||||||||||||||||
Non-Real Estate depreciation and amortization | — | — | — | (15 | ) | (15 | ) | — | — | — | (65 | ) | (65 | ) | ||||||||||||||||||
Noncontrolling interest in FFO | — | — | — | — | — | — | — | — | — | — | ||||||||||||||||||||||
Pre-tax FFO from discontinued operations | 3,362 | — | — | (3,362 | ) | — | 2,791 | — | — | (2,791 | ) | — | ||||||||||||||||||||
Income tax benefit (expense) on FFO | — | — | — | — | — | — | — | — | — | — | ||||||||||||||||||||||
FFO attributable to Forest City Realty Trust, Inc. | $ | 3,362 | $ | — | $ | — | $ | — | $ | 3,362 | $ | 2,791 | $ | — | $ | — | $ | — | $ | 2,791 | ||||||||||||
Depreciation and amortization - Real Estate Groups | — | — | — | (4,847 | ) | (4,847 | ) | — | — | — | (20,039 | ) | (20,039 | ) | ||||||||||||||||||
Net gain on disposition of full or partial interests in rental properties | — | — | — | — | — | — | — | — | — | — | ||||||||||||||||||||||
Gain on disposition of unconsolidated entities | — | — | — | — | — | — | — | — | — | — | ||||||||||||||||||||||
Impairment of consolidated and unconsolidated depreciable real estate | — | — | — | — | — | — | — | — | — | — | ||||||||||||||||||||||
Impairment of unconsolidated depreciable real estate | — | — | — | — | — | — | — | — | — | — | ||||||||||||||||||||||
Non-FFO from discontinued operations | (4,847 | ) | — | — | 4,847 | — | (20,039 | ) | — | — | 20,039 | — | ||||||||||||||||||||
Net earnings (loss) attributable to Forest City Realty Trust, Inc. | $ | (1,485 | ) | $ | — | $ | — | $ | — | $ | (1,485 | ) | $ | (17,248 | ) | $ | — | $ | — | $ | — | $ | (17,248 | ) | ||||||||
57
Forest City Realty Trust, Inc. and Subsidiaries
Supplemental Financial Information
Summary of FFO by Segment - Three Months and Year Ended December 31, 2015 (in thousands) (continued)
Three Months Ended December 31, 2015 | Year Ended December 31, 2015 | |||||||||||||||||||||||||||||||
Full Consolidation (GAAP) | Less Noncontrolling Interest | Plus Unconsolidated Investments at Pro-Rata | Plus Discontinued Operations | Pro-Rata Consolidation (Non-GAAP) | Full Consolidation (GAAP) | Less Noncontrolling Interest | Plus Unconsolidated Investments at Pro-Rata | Plus Discontinued Operations | Pro-Rata Consolidation (Non-GAAP) | |||||||||||||||||||||||
Land Group | ||||||||||||||||||||||||||||||||
Total revenues | $ | 25,937 | $ | 2,592 | $ | 355 | $ | — | $ | 23,700 | $ | 78,257 | $ | 7,808 | $ | 2,341 | $ | — | $ | 72,790 | ||||||||||||
Revenue adjustments: | ||||||||||||||||||||||||||||||||
Revenues of unconsolidated entities | 355 | — | (355 | ) | — | — | 2,341 | — | (2,341 | ) | — | — | ||||||||||||||||||||
Exclude land sales | (23,025 | ) | (2,302 | ) | (297 | ) | — | (21,020 | ) | (70,003 | ) | (6,998 | ) | (1,780 | ) | — | (64,785 | ) | ||||||||||||||
Exclude land sales of unconsolidated entities | (297 | ) | — | 297 | — | — | (1,780 | ) | — | 1,780 | — | — | ||||||||||||||||||||
Exclude Land Development Group revenues | (2,912 | ) | (290 | ) | (58 | ) | — | (2,680 | ) | (8,254 | ) | (810 | ) | (561 | ) | — | (8,005 | ) | ||||||||||||||
Exclude Land Development Group revenues of unconsolidated entities | (58 | ) | — | 58 | — | — | (561 | ) | — | 561 | — | — | ||||||||||||||||||||
Adjusted revenues | — | — | — | — | — | — | — | — | — | — | ||||||||||||||||||||||
Operating expenses | 9,360 | 891 | 541 | — | 9,010 | 32,594 | 3,033 | 2,088 | — | 31,649 | ||||||||||||||||||||||
Operating expense adjustments: | ||||||||||||||||||||||||||||||||
Operating expenses of unconsolidated entities | 541 | — | (541 | ) | — | — | 2,088 | — | (2,088 | ) | — | — | ||||||||||||||||||||
Exclude cost of land sales | (7,215 | ) | (695 | ) | — | — | (6,520 | ) | (22,841 | ) | (2,069 | ) | — | — | (20,772 | ) | ||||||||||||||||
Exclude Land Development Group operating expenses | (2,145 | ) | (196 | ) | (541 | ) | — | (2,490 | ) | (9,753 | ) | (964 | ) | (2,088 | ) | — | (10,877 | ) | ||||||||||||||
Exclude Land Development Group operating expenses of unconsolidated entities | (541 | ) | — | 541 | — | — | (2,088 | ) | — | 2,088 | — | — | ||||||||||||||||||||
Exclude corporate general and administrative expenses | — | — | — | — | — | — | — | — | — | — | ||||||||||||||||||||||
Exclude REIT conversion and reorganization costs | — | — | — | — | — | — | — | — | — | — | ||||||||||||||||||||||
Adjusted operating expenses | — | — | — | — | — | — | — | — | — | — | ||||||||||||||||||||||
Net operating income | — | — | — | — | — | — | — | — | — | — | ||||||||||||||||||||||
Equity in earnings (loss) of unconsolidated entities | (275 | ) | — | 277 | — | 2 | 333 | — | 1,460 | — | 1,793 | |||||||||||||||||||||
Exclude depreciation and amortization of unconsolidated entities | 20 | — | (20 | ) | — | — | 40 | — | (40 | ) | — | — | ||||||||||||||||||||
Exclude gain on disposition of unconsolidated entities | — | — | — | — | — | — | — | — | — | — | ||||||||||||||||||||||
Exclude impairment of unconsolidated depreciable real estate | — | — | — | — | — | — | — | — | — | — | ||||||||||||||||||||||
Revenue adjustments (per above) | 25,937 | 2,592 | 355 | — | 23,700 | 78,257 | 7,808 | 2,341 | — | 72,790 | ||||||||||||||||||||||
Operating expense adjustments (per above) | (9,360 | ) | (891 | ) | (541 | ) | — | (9,010 | ) | (32,594 | ) | (3,033 | ) | (2,088 | ) | — | (31,649 | ) | ||||||||||||||
Write-offs of abandoned development projects | (1,160 | ) | (116 | ) | — | — | (1,044 | ) | (1,160 | ) | (116 | ) | — | — | (1,044 | ) | ||||||||||||||||
Interest and other income | 4,420 | 440 | — | — | 3,980 | 16,814 | 1,688 | 3 | — | 15,129 | ||||||||||||||||||||||
Interest expense | 84 | (1 | ) | (71 | ) | — | 14 | 1,143 | 84 | (292 | ) | — | 767 | |||||||||||||||||||
Loss on extinguishment of debt | — | — | — | — | — | — | — | — | — | — | ||||||||||||||||||||||
Impairment of non-depreciable real estate | — | — | — | — | — | — | — | (1,384 | ) | — | (1,384 | ) | ||||||||||||||||||||
Amortization of mortgage procurement costs | — | — | — | — | — | — | — | — | — | — | ||||||||||||||||||||||
Net gain (loss) on change in control of interests | — | — | — | — | — | — | — | — | — | — | ||||||||||||||||||||||
Non-Real Estate depreciation and amortization | (11 | ) | — | — | — | (11 | ) | (90 | ) | — | — | — | (90 | ) | ||||||||||||||||||
Noncontrolling interest in FFO | (2,024 | ) | (2,024 | ) | — | — | — | (6,431 | ) | (6,431 | ) | — | — | — | ||||||||||||||||||
Pre-tax FFO from discontinued operations | — | — | — | — | — | — | — | — | — | — | ||||||||||||||||||||||
Income tax benefit (expense) on FFO | — | — | — | — | — | — | — | — | — | — | ||||||||||||||||||||||
FFO attributable to Forest City Realty Trust, Inc. | $ | 17,631 | $ | — | $ | — | $ | — | $ | 17,631 | $ | 56,312 | $ | — | $ | — | $ | — | $ | 56,312 | ||||||||||||
Depreciation and amortization - Real Estate Groups | (35 | ) | — | — | — | (35 | ) | (462 | ) | — | — | — | (462 | ) | ||||||||||||||||||
Net gain on disposition of full or partial interests in rental properties | — | — | — | — | — | — | — | — | — | — | ||||||||||||||||||||||
Gain on disposition of unconsolidated entities | — | — | — | — | — | — | — | — | — | — | ||||||||||||||||||||||
Impairment of consolidated and unconsolidated depreciable real estate | — | — | — | — | — | — | — | — | — | — | ||||||||||||||||||||||
Impairment of unconsolidated depreciable real estate | — | — | — | — | — | — | — | — | — | — | ||||||||||||||||||||||
Non-FFO from discontinued operations | — | — | — | — | — | — | — | — | — | — | ||||||||||||||||||||||
Net earnings (loss) attributable to Forest City Realty Trust, Inc. | $ | 17,596 | $ | — | $ | — | $ | — | $ | 17,596 | $ | 55,850 | $ | — | $ | — | $ | — | $ | 55,850 | ||||||||||||
58
Forest City Realty Trust, Inc. and Subsidiaries
Supplemental Financial Information
Summary of FFO by Segment - Three Months and Year Ended December 31, 2015 (in thousands) (continued)
Three Months Ended December 31, 2015 | Year Ended December 31, 2015 | |||||||||||||||||||||||||||||||
Full Consolidation (GAAP) | Less Noncontrolling Interest | Plus Unconsolidated Investments at Pro-Rata | Plus Discontinued Operations | Pro-Rata Consolidation (Non-GAAP) | Full Consolidation (GAAP) | Less Noncontrolling Interest | Plus Unconsolidated Investments at Pro-Rata | Plus Discontinued Operations | Pro-Rata Consolidation (Non-GAAP) | |||||||||||||||||||||||
Corporate Group | ||||||||||||||||||||||||||||||||
Total revenues | $ | — | $ | — | $ | — | $ | — | $ | — | $ | — | $ | — | $ | — | $ | — | $ | — | ||||||||||||
Revenue adjustments: | ||||||||||||||||||||||||||||||||
Revenues of unconsolidated entities | — | — | — | — | — | — | — | — | — | — | ||||||||||||||||||||||
Exclude land sales | — | — | — | — | — | — | — | — | — | — | ||||||||||||||||||||||
Exclude land sales of unconsolidated entities | — | — | — | — | — | — | — | — | — | — | ||||||||||||||||||||||
Exclude Land Development Group revenues | — | — | — | — | — | — | — | — | — | — | ||||||||||||||||||||||
Exclude Land Development Group revenues of unconsolidated entities | — | — | — | — | — | — | — | — | — | — | ||||||||||||||||||||||
Adjusted revenues | — | — | — | — | — | — | — | — | — | — | ||||||||||||||||||||||
Operating expenses | 35,106 | — | — | — | 35,106 | 96,499 | — | — | — | 96,499 | ||||||||||||||||||||||
Operating expense adjustments: | ||||||||||||||||||||||||||||||||
Operating expenses of unconsolidated entities | — | — | — | — | — | — | — | — | — | — | ||||||||||||||||||||||
Exclude cost of land sales | — | — | — | — | — | — | — | — | — | — | ||||||||||||||||||||||
Exclude Land Development Group operating expenses | — | — | — | — | — | — | — | — | — | — | ||||||||||||||||||||||
Exclude Land Development Group operating expenses of unconsolidated entities | — | — | — | — | — | — | — | — | — | — | ||||||||||||||||||||||
Exclude corporate general and administrative expenses | (12,479 | ) | — | — | — | (12,479 | ) | (48,374 | ) | — | — | — | (48,374 | ) | ||||||||||||||||||
Exclude REIT conversion and reorganization costs | (22,627 | ) | — | — | — | (22,627 | ) | (48,125 | ) | — | — | — | (48,125 | ) | ||||||||||||||||||
Adjusted operating expenses | — | — | — | — | — | — | — | — | — | — | ||||||||||||||||||||||
Net operating income | — | — | — | — | — | — | — | — | — | — | ||||||||||||||||||||||
Equity in earnings (loss) of unconsolidated entities | — | — | — | (2,325 | ) | (2,325 | ) | — | — | — | (40,760 | ) | (40,760 | ) | ||||||||||||||||||
Exclude depreciation and amortization of unconsolidated entities | — | — | — | — | — | — | — | — | — | — | ||||||||||||||||||||||
Exclude gain on disposition of unconsolidated entities | — | — | — | — | — | — | — | — | — | — | ||||||||||||||||||||||
Exclude impairment of unconsolidated depreciable real estate | — | — | — | — | — | — | — | — | — | — | ||||||||||||||||||||||
Revenue adjustments (per above) | — | — | — | — | — | — | — | — | — | — | ||||||||||||||||||||||
Operating expense adjustments (per above) | (35,106 | ) | — | — | — | (35,106 | ) | (96,499 | ) | — | — | — | (96,499 | ) | ||||||||||||||||||
Write-offs of abandoned development projects | — | — | — | — | — | — | — | — | — | — | ||||||||||||||||||||||
Interest and other income | 37 | — | — | — | 37 | 216 | — | — | — | 216 | ||||||||||||||||||||||
Interest expense | (4,785 | ) | — | — | — | (4,785 | ) | (23,689 | ) | — | — | — | (23,689 | ) | ||||||||||||||||||
Loss on extinguishment of debt | (782 | ) | — | — | — | (782 | ) | (58,574 | ) | — | — | — | (58,574 | ) | ||||||||||||||||||
Impairment of non-depreciable real estate | — | — | — | — | — | — | — | — | — | — | ||||||||||||||||||||||
Amortization of mortgage procurement costs | — | — | — | — | — | — | — | — | — | — | ||||||||||||||||||||||
Net gain (loss) on change in control of interests | — | — | — | — | — | — | — | — | — | — | ||||||||||||||||||||||
Non-Real Estate depreciation and amortization | (498 | ) | — | — | — | (498 | ) | (2,582 | ) | — | — | — | (2,582 | ) | ||||||||||||||||||
Noncontrolling interest in FFO | — | — | — | — | — | — | — | — | — | — | ||||||||||||||||||||||
Pre-tax FFO from discontinued operations | (2,325 | ) | — | — | 2,325 | — | (40,760 | ) | — | — | 40,760 | — | ||||||||||||||||||||
Income tax benefit (expense) on FFO | 3,604 | — | — | — | 3,604 | (150,051 | ) | — | — | — | (150,051 | ) | ||||||||||||||||||||
FFO attributable to Forest City Realty Trust, Inc. | $ | (39,855 | ) | $ | — | $ | — | $ | — | $ | (39,855 | ) | $ | (371,939 | ) | $ | — | $ | — | $ | — | $ | (371,939 | ) | ||||||||
Depreciation and amortization - Real Estate Groups | — | — | — | — | — | — | — | — | — | — | ||||||||||||||||||||||
Net gain on disposition of full or partial interests in rental properties | — | — | — | — | — | — | — | — | — | — | ||||||||||||||||||||||
Gain on disposition of unconsolidated entities | — | — | — | — | — | — | — | — | — | — | ||||||||||||||||||||||
Impairment of consolidated and unconsolidated depreciable real estate | — | — | — | — | — | — | — | — | — | — | ||||||||||||||||||||||
Impairment of unconsolidated depreciable real estate | — | — | — | — | — | — | — | — | — | — | ||||||||||||||||||||||
Non-FFO from discontinued operations | — | — | — | — | — | — | — | — | — | — | ||||||||||||||||||||||
Income tax benefit (expense) on non-FFO: | ||||||||||||||||||||||||||||||||
Gain on disposition of rental properties | — | — | — | — | — | (8,549 | ) | — | — | — | (8,549 | ) | ||||||||||||||||||||
Impairment of depreciable real estate | 14,785 | — | — | — | 14,785 | 173,590 | — | — | — | 173,590 | ||||||||||||||||||||||
One-time adjustment to deferred taxes related to REIT conversion | 588,607 | — | — | — | 588,607 | 588,607 | — | — | — | 588,607 | ||||||||||||||||||||||
Net earnings (loss) attributable to Forest City Realty Trust, Inc. | $ | 563,537 | $ | — | $ | — | $ | — | $ | 563,537 | $ | 381,709 | $ | — | $ | — | $ | — | $ | 381,709 | ||||||||||||
59
Forest City Realty Trust, Inc. and Subsidiaries
Supplemental Financial Information
Summary of FFO by Segment - Three Months and Year Ended December 31, 2015 (in thousands) (continued)
Three Months Ended December 31, 2015 | Year Ended December 31, 2015 | |||||||||||||||||||||||||||||||
Full Consolidation (GAAP) | Less Noncontrolling Interest | Plus Unconsolidated Investments at Pro-Rata | Plus Discontinued Operations | Pro-Rata Consolidation (Non-GAAP) | Full Consolidation (GAAP) | Less Noncontrolling Interest | Plus Unconsolidated Investments at Pro-Rata | Plus Discontinued Operations | Pro-Rata Consolidation (Non-GAAP) | |||||||||||||||||||||||
Total | ||||||||||||||||||||||||||||||||
Total revenues | $ | 272,830 | $ | 16,990 | $ | 93,064 | $ | 30,423 | $ | 379,327 | $ | 978,231 | $ | 65,636 | $ | 390,283 | $ | 74,598 | $ | 1,377,476 | ||||||||||||
Revenue adjustments: | ||||||||||||||||||||||||||||||||
Revenues of unconsolidated entities | 93,064 | — | (93,064 | ) | — | — | 390,283 | — | (390,283 | ) | — | — | ||||||||||||||||||||
Exclude land sales | (31,580 | ) | (2,302 | ) | (297 | ) | — | (29,575 | ) | (79,169 | ) | (6,998 | ) | (1,780 | ) | — | (73,951 | ) | ||||||||||||||
Exclude land sales of unconsolidated entities | (297 | ) | — | 297 | — | — | (1,780 | ) | — | 1,780 | — | — | ||||||||||||||||||||
Exclude Land Development Group revenues | (2,912 | ) | (290 | ) | (58 | ) | — | (2,680 | ) | (8,254 | ) | (810 | ) | (561 | ) | — | (8,005 | ) | ||||||||||||||
Exclude Land Development Group revenues of unconsolidated entities | (58 | ) | — | 58 | — | — | (561 | ) | — | 561 | — | — | ||||||||||||||||||||
Adjusted revenues | 331,047 | 14,398 | — | 30,423 | 347,072 | 1,278,750 | 57,828 | — | 74,598 | 1,295,520 | ||||||||||||||||||||||
Operating expenses | 179,679 | 7,941 | 43,663 | 21,903 | 237,304 | 625,352 | 28,340 | 176,440 | 52,655 | 826,107 | ||||||||||||||||||||||
Operating expense adjustments: | ||||||||||||||||||||||||||||||||
Operating expenses of unconsolidated entities | 43,663 | — | (43,663 | ) | — | — | 176,440 | — | (176,440 | ) | — | — | ||||||||||||||||||||
Exclude cost of land sales | (15,697 | ) | (695 | ) | — | — | (15,002 | ) | (31,413 | ) | (2,069 | ) | — | — | (29,344 | ) | ||||||||||||||||
Exclude Land Development Group operating expenses | (2,145 | ) | (196 | ) | (541 | ) | — | (2,490 | ) | (9,753 | ) | (964 | ) | (2,088 | ) | — | (10,877 | ) | ||||||||||||||
Exclude Land Development Group operating expenses of unconsolidated entities | (541 | ) | — | 541 | — | — | (2,088 | ) | — | 2,088 | — | — | ||||||||||||||||||||
Exclude corporate general and administrative expenses | (12,479 | ) | — | — | — | (12,479 | ) | (48,374 | ) | — | — | — | (48,374 | ) | ||||||||||||||||||
Exclude REIT conversion and reorganization costs | (22,627 | ) | — | — | — | (22,627 | ) | (48,125 | ) | — | — | — | (48,125 | ) | ||||||||||||||||||
Adjusted operating expenses | 169,853 | 7,050 | — | 21,903 | 184,706 | 662,039 | 25,307 | — | 52,655 | 689,387 | ||||||||||||||||||||||
Net operating income | 161,194 | 7,348 | — | 8,520 | 162,366 | 616,711 | 32,521 | — | 21,943 | 606,133 | ||||||||||||||||||||||
Equity in earnings (loss) of unconsolidated entities | (8,488 | ) | 46 | 8,010 | (2,325 | ) | (2,849 | ) | 28,762 | 204 | (25,259 | ) | (40,760 | ) | (37,461 | ) | ||||||||||||||||
Exclude depreciation and amortization of unconsolidated entities | 23,594 | — | (23,594 | ) | — | — | 88,455 | — | (88,455 | ) | — | — | ||||||||||||||||||||
Exclude gain on disposition of unconsolidated entities | — | — | — | — | — | (20,293 | ) | — | 20,293 | — | — | |||||||||||||||||||||
Exclude impairment of unconsolidated depreciable real estate | 12,460 | — | (12,460 | ) | — | — | 12,460 | — | (12,460 | ) | — | — | ||||||||||||||||||||
Revenue adjustments (per above) | (58,217 | ) | 2,592 | 93,064 | — | 32,255 | (300,519 | ) | 7,808 | 390,283 | — | 81,956 | ||||||||||||||||||||
Operating expense adjustments (per above) | (9,826 | ) | (891 | ) | (43,663 | ) | — | (52,598 | ) | 36,687 | (3,033 | ) | (176,440 | ) | — | (136,720 | ) | |||||||||||||||
Write-offs of abandoned development projects | (3,756 | ) | (116 | ) | — | — | (3,640 | ) | (9,534 | ) | (116 | ) | (10,191 | ) | — | (19,609 | ) | |||||||||||||||
Interest and other income | 9,762 | 670 | 722 | — | 9,814 | 37,739 | 2,105 | 1,779 | — | 37,413 | ||||||||||||||||||||||
Interest expense | (37,481 | ) | (2,383 | ) | (22,079 | ) | (4,917 | ) | (62,094 | ) | (157,166 | ) | (9,158 | ) | (97,430 | ) | (18,861 | ) | (264,299 | ) | ||||||||||||
Loss on extinguishment of debt | (3,133 | ) | — | — | — | (3,133 | ) | (65,086 | ) | (719 | ) | (736 | ) | — | (65,103 | ) | ||||||||||||||||
Impairment of non-depreciable real estate | — | — | — | — | — | (16,307 | ) | — | (1,384 | ) | — | (17,691 | ) | |||||||||||||||||||
Amortization of mortgage procurement costs | (2,515 | ) | — | — | (226 | ) | (2,741 | ) | (10,374 | ) | — | — | (226 | ) | (10,600 | ) | ||||||||||||||||
Net gain (loss) on change in control of interests | (1,405 | ) | — | — | — | (1,405 | ) | 486,279 | — | — | — | 486,279 | ||||||||||||||||||||
Non-Real Estate depreciation and amortization | (1,055 | ) | — | — | (15 | ) | (1,070 | ) | (4,500 | ) | — | — | (65 | ) | (4,565 | ) | ||||||||||||||||
Noncontrolling interest in FFO | (7,266 | ) | (7,266 | ) | — | — | — | (29,612 | ) | (29,612 | ) | — | — | — | ||||||||||||||||||
Pre-tax FFO from discontinued operations | 1,037 | — | — | (1,037 | ) | — | (37,969 | ) | — | — | 37,969 | — | ||||||||||||||||||||
Income tax benefit (expense) on FFO | 3,604 | — | — | — | 3,604 | (150,051 | ) | — | — | — | (150,051 | ) | ||||||||||||||||||||
FFO attributable to Forest City Realty Trust, Inc. | $ | 78,509 | $ | — | $ | — | $ | — | $ | 78,509 | $ | 505,682 | $ | — | $ | — | $ | — | $ | 505,682 | ||||||||||||
Depreciation and amortization - Real Estate Groups | (89,909 | ) | — | — | (4,847 | ) | (94,756 | ) | (317,701 | ) | — | — | (20,039 | ) | (337,740 | ) | ||||||||||||||||
Net gain on disposition of full or partial interests in rental properties | — | — | — | — | — | 1,746 | — | 20,293 | — | 22,039 | ||||||||||||||||||||||
Gain on disposition of unconsolidated entities | — | — | — | — | — | 20,293 | — | (20,293 | ) | — | — | |||||||||||||||||||||
Impairment of consolidated and unconsolidated depreciable real estate | (25,971 | ) | — | (12,460 | ) | — | (38,431 | ) | (435,127 | ) | — | (12,460 | ) | — | (447,587 | ) | ||||||||||||||||
Impairment of unconsolidated depreciable real estate | (12,460 | ) | — | 12,460 | — | — | (12,460 | ) | — | 12,460 | — | — | ||||||||||||||||||||
Non-FFO from discontinued operations | (4,847 | ) | — | — | 4,847 | — | (20,039 | ) | — | — | 20,039 | — | ||||||||||||||||||||
Income tax benefit (expense) on non-FFO: | ||||||||||||||||||||||||||||||||
Gain on disposition of rental properties | — | — | — | — | — | (8,549 | ) | — | — | — | (8,549 | ) | ||||||||||||||||||||
Impairment of depreciable real estate | 14,785 | — | — | — | 14,785 | 173,590 | — | — | — | 173,590 | ||||||||||||||||||||||
One-time adjustment to deferred taxes related to REIT conversion | 588,607 | — | — | — | 588,607 | 588,607 | — | — | — | 588,607 | ||||||||||||||||||||||
Net earnings (loss) attributable to Forest City Realty Trust, Inc. | $ | 548,714 | $ | — | $ | — | $ | — | $ | 548,714 | $ | 496,042 | $ | — | $ | — | $ | — | $ | 496,042 | ||||||||||||
60
Real Estate Operating Portfolio as of December 31, 2015 - Commercial Group - Office Buildings
Name | Date of Opening/ Acquisition/ Expansion | Legal Ownership (1) | Pro-Rata Ownership (2) | Location | Major Tenants | Gross Leasable Area | Gross Leasable Area at Pro- Rata % | Nonrecourse Debt Pro-Rata Consolidation (3) (in thousands) | |||||||
Consolidated Office Buildings | |||||||||||||||
Atlantic Terminal Office | 2004 | 100 | % | 100 | % | Brooklyn, NY | Bank of New York; HSBC | 399,000 | 399,000 | $ | 104,056 | ||||
Ballston Common Office Center | 2005 | 100 | % | 100 | % | Arlington, VA | US Coast Guard | 176,000 | 176,000 | — | |||||
Commerce Court | 2007 | 100 | % | 100 | % | Pittsburgh, PA | US Bank; Wesco Distributors; Cardworks Services; Marc USA | 374,000 | 374,000 | 23,666 | |||||
Edgeworth Building | 2006 | 100 | % | 100 | % | Richmond, VA | Hirschler Fleischer; Ernst & Young; Rummel, Klepper & Kahl | 139,000 | 139,000 | 19,540 | |||||
Glen Forest Office Park | 2007 | 100 | % | 100 | % | Richmond, VA | The Brinks Co.; Wells Fargo; Bon Secours Virginia HealthSource | 563,000 | 563,000 | 59,189 | |||||
Harlem Office | 2003 | 100 | % | 100 | % | Manhattan, NY | Office of General Services-Temporary Disability & Assistance; State Liquor Authority | 147,000 | 147,000 | — | |||||
Illinois Science and Technology Park | |||||||||||||||
4901 Searle | 2006 | 100 | % | 100 | % | Skokie, IL | Northshore University Health System | 204,000 | 204,000 | 20,333 | |||||
4930 Oakton | 2006 | 100 | % | 100 | % | Skokie, IL | Leasing in progress | 40,000 | 40,000 | — | |||||
8025 Lamon | 2006 | 100 | % | 100 | % | Skokie, IL | WIL Research; Vetter Development Services | 130,000 | 130,000 | 14,378 | |||||
8045 Lamon | 2007 | 100 | % | 100 | % | Skokie, IL | Astellas; Polyera; Fresenius Kabi USA, LLC; LanzaTech Inc. | 159,000 | 159,000 | 17,817 | |||||
Johns Hopkins - 855 North Wolfe Street | 2008 | 84 | % | 99 | % | Baltimore, MD | Johns Hopkins; Brain Institute; Howard Hughes Institute; Lieber Institute | 279,000 | 276,000 | 66,772 | |||||
Mesa del Sol | |||||||||||||||
Aperture Center | 2008 | 95 | % | 95 | % | Albuquerque, NM | Forest City Covington NM, LLC | 76,000 | 72,000 | — | |||||
Fidelity Investments | 2008/2009 | 80 | % | 80 | % | Albuquerque, NM | Fidelity Investments | 210,000 | 168,000 | 14,161 | |||||
MetroTech Campus | |||||||||||||||
One MetroTech Center | 1991 | 83 | % | 83 | % | Brooklyn, NY | JP Morgan Chase; National Grid | 910,000 | 751,000 | — | |||||
Two MetroTech Center | 1990 | 83 | % | 83 | % | Brooklyn, NY | City of New York - Board of Education; City of New York - DoITT; Internal Revenue Service; NYU | 517,000 | 427,000 | 59,508 | |||||
Nine MetroTech Center | 1997 | 85 | % | 85 | % | Brooklyn, NY | City of New York - Fire Department | 317,000 | 269,000 | 49,638 | |||||
Eleven MetroTech Center | 1995 | 85 | % | 85 | % | Brooklyn, NY | City of New York - DoITT; E-911 | 216,000 | 184,000 | 51,850 | |||||
Twelve MetroTech Center | 2004 | 100 | % | 100 | % | Brooklyn, NY | National Union Fire Insurance Co. | 177,000 | 177,000 | — | |||||
Fifteen MetroTech Center | 2003 | 95 | % | 95 | % | Brooklyn, NY | Wellpoint, Inc.; City of New York - HRA | 649,000 | 617,000 | 154,204 | |||||
New York Times | 2007 | 100 | % | 100 | % | Manhattan, NY | ClearBridge Advisors, LLC, a Legg Mason Co.; Covington & Burling; Osler Hoskin & Harcourt; Seyfarth Shaw | 735,000 | 735,000 | 640,000 | |||||
One Pierrepont Plaza | 1988 | 100 | % | 100 | % | Brooklyn, NY | Morgan Stanley; Mt. Sinai School of Medicine; G.S.A. | 744,000 | 744,000 | — | |||||
Post Office Plaza | 1990 | 100 | % | 100 | % | Cleveland, OH | URS Energy; Chase Home Finance, LLC; Quicken Loans; Squire Patton Boggs, LLP | 477,000 | 477,000 | 14,108 | |||||
Terminal Tower | 1983 | 100 | % | 100 | % | Cleveland, OH | Forest City Realty Trust, Inc.; Falls Communications; Riverside Company | 597,000 | 597,000 | — | |||||
University of Pennsylvania | 2004 | 100 | % | 100 | % | Philadelphia, PA | University of Pennsylvania | 122,000 | 122,000 | 42,427 | |||||
61
Real Estate Operating Portfolio as of December 31, 2015 - Commercial Group - Office Buildings (continued)
Name | Date of Opening/ Acquisition/ Expansion | Legal Ownership (1) | Pro-Rata Ownership (2) | Location | Major Tenants | Gross Leasable Area | Gross Leasable Area at Pro- Rata % | Nonrecourse Debt Pro-Rata Consolidation (3) (in thousands) | |||||||
University Park at MIT | |||||||||||||||
26 Landsdowne Street | 1987 | 100 | % | 100 | % | Cambridge, MA | Ariad Pharmaceuticals, Inc. | 100,000 | 100,000 | 28,554 | |||||
35 Landsdowne Street | 2002 | 100 | % | 100 | % | Cambridge, MA | Millennium Pharmaceuticals | 202,000 | 202,000 | 63,610 | |||||
40 Landsdowne Street | 2003 | 100 | % | 100 | % | Cambridge, MA | Millennium Pharmaceuticals | 215,000 | 215,000 | 65,980 | |||||
45/75 Sidney Street | 1999 | 100 | % | 100 | % | Cambridge, MA | Millennium Pharmaceuticals; Novartis | 277,000 | 277,000 | 85,669 | |||||
64 Sidney Street | 1990 | 100 | % | 100 | % | Cambridge, MA | Vericel Corporation; Ariad Pharmaceuticals, Inc.; Novartis | 126,000 | 126,000 | 50,641 | |||||
65 Landsdowne Street | 2001 | 100 | % | 100 | % | Cambridge, MA | Partners HealthCare System | 122,000 | 122,000 | 63,252 | |||||
88 Sidney Street | 2002 | 100 | % | 100 | % | Cambridge, MA | Agios Pharmaceuticals | 146,000 | 146,000 | 37,521 | |||||
Other | — | — | 8,758 | ||||||||||||
Consolidated Office Buildings Total | 9,545,000 | 9,135,000 | $ | 1,755,632 | |||||||||||
Unconsolidated Office Buildings | |||||||||||||||
Enterprise Place | 1998 | 50 | % | 50 | % | Beachwood, OH | University of Phoenix; Advance Payroll; PS Executive Centers; Retina Assoc. of Cleveland | 131,000 | 66,000 | $ | 5,161 | ||||
Signature Square I | 1986 | 50 | % | 50 | % | Beachwood, OH | Ciuni & Panichi; PCC Airfoils; Liberty Bank | 79,000 | 40,000 | 3,413 | |||||
Signature Square II | 1989 | 50 | % | 50 | % | Beachwood, OH | Pro Ed Communications; Goldberg Co.; Resilience Management | 82,000 | 41,000 | 3,413 | |||||
University Park at MIT | |||||||||||||||
350 Massachusetts Ave | 1998 | 50 | % | 50 | % | Cambridge, MA | Millennium Pharmaceuticals; Glaxo Smith Kline; Star Market | 169,000 | 85,000 | 22,950 | |||||
38 Sidney Street | 1989 | 50 | % | 50 | % | Cambridge, MA | Sanofi Pasteur Biologics; Blueprint Medicines Corp. | 122,000 | 61,000 | 24,250 | |||||
Westfield San Francisco Centre - Emporium Office | 2006 | 50 | % | 50 | % | San Francisco, CA | San Francisco State University; Cruncyroll Inc.; TRUSTe, Inc. | 242,000 | 121,000 | — | |||||
Other | — | — | 17,077 | ||||||||||||
Unconsolidated Office Buildings Total | 825,000 | 414,000 | $ | 76,264 | |||||||||||
Total Office Buildings at December 31, 2015 | 10,370,000 | 9,549,000 | $ | 1,831,896 | |||||||||||
Total Office Buildings at December 31, 2014 | 10,687,000 | 9,284,000 | $ | 1,818,060 | |||||||||||
62
Real Estate Operating Portfolio as of December 31, 2015 - Commercial Group - Retail Centers
Name | Date of Opening/ Acquisition/ Expansion | Legal Ownership (1) | Pro-Rata Ownership (2) | Location | Major Tenants/Anchors | Total Square Feet | Total Square Feet at Pro- Rata % | Gross Leasable Area | Gross Leasable Area at Pro- Rata % | Nonrecourse Debt Pro-Rata Consolidation (3) (in thousands) | |||||||||
Consolidated Regional Malls | |||||||||||||||||||
Ballston Quarter (Ballston Common) | 1986/1999 | 100 | % | 100 | % | Arlington, VA | Macy’s; Sport & Health; Regal Cinemas | 578,000 | 578,000 | 310,000 | 310,000 | $ | 42,500 | ||||||
Boulevard Mall | 1996/2000/2015 | 100 | % | 100 | % | Amherst, NY | JCPenney; Macy’s; Sears; Michael’s; Dick’s Sporting Goods | 962,000 | 962,000 | 385,000 | 385,000 | 96,468 | |||||||
Shops at Northfield Stapleton | 2005/2006 | 100 | % | 100 | % | Denver, CO | Bass Pro Shops; Target; Harkins Theatre; JCPenney; Macy’s | 1,125,000 | 1,125,000 | 672,000 | 672,000 | — | |||||||
Shops at Wiregrass | 2008 | 100 | % | 100 | % | Tampa, FL | JCPenney; Dillard’s; Macy’s; Barnes & Noble | 747,000 | 747,000 | 358,000 | 358,000 | 83,545 | |||||||
Westchester’s Ridge Hill (4) | 2011/2012 | 100 | % | 100 | % | Yonkers, NY | Lord & Taylor; WESTMED Medical Group; Apple; LA Fitness; Whole Foods; Dick’s Sporting Goods; National Amusements’ Cinema de Lux; Legoland; Lowe’s (2016 opening) | 1,271,000 | 1,271,000 | 1,271,000 | 1,271,000 | 332,096 | |||||||
Unconsolidated Regional Malls | |||||||||||||||||||
Antelope Valley Mall | 1990/1999/ 2014/2015 | 51 | % | 51 | % | Palmdale, CA | Macy’s; Sears; JCPenney; Dillard’s; Forever 21; Cinemark Theatre; Dick’s Sporting Goods | 1,184,000 | 604,000 | 654,000 | 334,000 | 45,180 | |||||||
Charleston Town Center | 1983 | 26 | % | 26 | % | Charleston, WV | Macy’s; JCPenney; Sears; Brickstreet Insurance | 892,000 | 227,000 | 347,000 | 88,000 | 25,984 | |||||||
Galleria at Sunset | 1996/2002/2015 | 51 | % | 51 | % | Henderson, NV | Dillard’s; Macy’s; JCPenney; Dick’s Sporting Goods; Kohl’s | 1,599,000 | 815,000 | 444,000 | 226,000 | 72,247 | |||||||
Mall at Robinson | 2001 | 51 | % | 51 | % | Pittsburgh, PA | Macy’s; Sears; JCPenney; Dick’s Sporting Goods | 900,000 | 459,000 | 383,000 | 195,000 | 37,098 | |||||||
Promenade Temecula | 1999/2002/2009 | 51 | % | 51 | % | Temecula, CA | JCPenney; Sears; Macy’s; Edwards Cinema | 1,279,000 | 652,000 | 544,000 | 277,000 | 78,644 | |||||||
Short Pump Town Center | 2003/2005 | 34 | % | 34 | % | Richmond, VA | Nordstrom; Macy’s; Dillard’s; Dick’s Sporting Goods | 1,341,000 | 456,000 | 717,000 | 244,000 | 64,600 | |||||||
South Bay Galleria | 1985/2001/2014 | 51 | % | 51 | % | Redondo Beach, CA | Macy’s; Kohl’s; AMC Theatres | 960,000 | 490,000 | 477,000 | 243,000 | 64,772 | |||||||
Victoria Gardens | 2004/2007 | 51 | % | 51 | % | Rancho Cucamonga, CA | Bass Pro Shops; Macy’s; JCPenney; AMC Theatres | 1,403,000 | 716,000 | 862,000 | 440,000 | 133,261 | |||||||
Westfield San Francisco Centre | 2006 | 50 | % | 50 | % | San Francisco, CA | Nordstrom; Bloomingdale’s; Century Theatres | 1,184,000 | 592,000 | 533,000 | 267,000 | 277,750 | |||||||
Regional Malls Total | 15,425,000 | 9,694,000 | 7,957,000 | 5,310,000 | $ | 1,354,145 | |||||||||||||
Consolidated Specialty Retail Centers | |||||||||||||||||||
Avenue at Tower City Center | 1990 | 100 | % | 100 | % | Cleveland, OH | Hard Rock Café; Morton’s of Chicago; Cleveland Cinemas; Horseshoe Casino | 366,000 | 366,000 | 366,000 | 366,000 | $ | — | ||||||
Brooklyn Commons | 2004 | 100 | % | 100 | % | Brooklyn, NY | Lowe’s | 151,000 | 151,000 | 151,000 | 151,000 | 19,519 | |||||||
East 29th Avenue Town Center | 2004 | 90 | % | 90 | % | Denver, CO | King Soopers; Walgreen’s; Casey’s Pub; Chipotle; SDC Services Corp.; Exempla, Inc. | 213,000 | 192,000 | 98,000 | 88,000 | — | |||||||
Fairmont Plaza Cinema | 1998 | 100 | % | 100 | % | San Jose, CA | Camera 12 Cinemas | 70,000 | 70,000 | 70,000 | 70,000 | — | |||||||
Shops at Atlantic Center Site V | 1998 | 100 | % | 100 | % | Brooklyn, NY | Modell’s; PC Richard & Son | 47,000 | 47,000 | 17,000 | 17,000 | — | |||||||
Station Square | 1994/2002 | 100 | % | 100 | % | Pittsburgh, PA | Hard Rock Café; Grand Concourse Restaurant; Buca di Beppo; Texas de Brazil; Pittsburgh Riverhounds | 235,000 | 235,000 | 235,000 | 235,000 | 34,057 | |||||||
The Yards | |||||||||||||||||||
Boilermaker Shops | 2012 | 100 | % | 100 | % | Washington, D.C. | Willie’s Brew & Que; Bluejacket Brewery | 40,000 | 40,000 | 40,000 | 40,000 | 12,089 | |||||||
Lumber Shed | 2013 | 100 | % | 100 | % | Washington, D.C. | FC Washington; Osteria Morini; Agua 301 | 31,000 | 31,000 | 31,000 | 31,000 | 10,000 | |||||||
Twelve12 | 2014 | 100 | % | 100 | % | Washington, D.C. | Harris Teeter Grocery; VIDA Fitness | 88,000 | 88,000 | 88,000 | 88,000 | — | |||||||
63
Real Estate Operating Portfolio as of December 31, 2015 - Commercial Group - Retail Centers (continued)
Name | Date of Opening/ Acquisition/ Expansion | Legal Ownership (1) | Pro-Rata Ownership (2) | Location | Major Tenants/Anchors | Total Square Feet | Total Square Feet at Pro- Rata % | Gross Leasable Area | Gross Leasable Area at Pro- Rata % | Nonrecourse Debt Pro-Rata Consolidation (3) (in thousands) | |||||||||
Unconsolidated Specialty Retail Centers | |||||||||||||||||||
42nd Street | 1999 | 51 | % | 51 | % | Manhattan, NY | AMC Theatres; Madame Tussaud’s Wax Museum; Dave & Buster’s; Ripley’s Believe It or Not!; Modell’s | 312,000 | 159,000 | 312,000 | 159,000 | $ | 39,665 | ||||||
Atlantic Center | 1996 | 51 | % | 51 | % | Brooklyn, NY | Stop & Shop; Old Navy; Marshall’s; NYC - Dept of Motor Vehicles; Best Buy; Burlington Coat Factory | 396,000 | 202,000 | 396,000 | 202,000 | 42,701 | |||||||
Atlantic Terminal Mall | 2004 | 51 | % | 51 | % | Brooklyn, NY | Target; Designer Shoe Warehouse; Uniqlo; Chuck E. Cheese’s; Guitar Center | 371,000 | 189,000 | 371,000 | 189,000 | 52,282 | |||||||
Castle Center | 2000 | 51 | % | 51 | % | Bronx, NY | Stop & Shop | 63,000 | 32,000 | 63,000 | 32,000 | 5,375 | |||||||
Columbia Park Center | 1999 | 38 | % | 38 | % | North Bergen, NJ | Shop Rite; Old Navy; LA Fitness; Shopper’s World; Phoenix Theatres; Big Lots | 347,000 | 133,000 | 347,000 | 133,000 | 27,158 | |||||||
East River Plaza | 2009/2010 | 50 | % | 50 | % | Manhattan, NY | Costco; Target; Old Navy; Marshall’s; PetSmart; Bob’s Furniture; Aldi; Burlington Coat Factory | 523,000 | 262,000 | 523,000 | 262,000 | 134,819 | |||||||
Forest Avenue | 2000 | 51 | % | 51 | % | Staten Island, NY | United Artists Theatres | 70,000 | 36,000 | 70,000 | 36,000 | 2,744 | |||||||
Harlem Center | 2002 | 51 | % | 51 | % | Manhattan, NY | Marshall’s; CVS/Pharmacy; Staples; H&M; Planet Fitness | 126,000 | 64,000 | 126,000 | 64,000 | 25,395 | |||||||
Queens Place | 2001 | 51 | % | 51 | % | Queens, NY | Target; Best Buy; Designer Shoe Warehouse; Macy’s Furniture; Macy’s Backstage | 455,000 | 232,000 | 222,000 | 113,000 | 41,279 | |||||||
Shops at Bruckner Boulevard | 1996 | 51 | % | 51 | % | Bronx, NY | Conway; Old Navy; Marshall’s | 116,000 | 59,000 | 116,000 | 59,000 | 6,721 | |||||||
Shops at Gun Hill Road | 1997 | 51 | % | 51 | % | Bronx, NY | Home Depot; Chuck E. Cheese’s | 147,000 | 75,000 | 147,000 | 75,000 | 10,232 | |||||||
Shops at Northern Boulevard | 1997 | 51 | % | 51 | % | Queens, NY | Stop & Shop; Marshall’s; Old Navy; Guitar Center; Raymour & Flanigan Furniture | 218,000 | 111,000 | 218,000 | 111,000 | 18,806 | |||||||
Shops at Richmond Avenue | 1998 | 51 | % | 51 | % | Staten Island, NY | Staples; Dick’s Sporting Goods | 76,000 | 39,000 | 76,000 | 39,000 | 9,973 | |||||||
Steinway Street Theaters | 1999 | 51 | % | 51 | % | Queens, NY | United Artists Theatres | 84,000 | 43,000 | 84,000 | 43,000 | 8,291 | |||||||
The Heights | 2000 | 51 | % | 51 | % | Brooklyn, NY | United Artists Theatres; Barnes & Noble | 102,000 | 52,000 | 102,000 | 52,000 | 15,261 | |||||||
Specialty Retail Centers Total | 4,647,000 | 2,908,000 | 4,269,000 | 2,655,000 | $ | 516,367 | |||||||||||||
Total Retail Centers at December 31, 2015 | 20,072,000 | 12,602,000 | 12,226,000 | 7,965,000 | $ | 1,870,512 | |||||||||||||
Total Retail Centers at December 31, 2014 | 20,088,000 | 12,616,000 | 12,069,000 | 7,888,000 | $ | 1,890,955 | |||||||||||||
Arena
Name | Date of Opening | Legal Ownership (1) | Pro-Rata Ownership (2) | Location | Major Tenants | Total Square Feet | Total Square Feet at Pro- Rata % | Est. Seating Capacity for NBA Basketball Event | Est. Seating Capacity for NHL Hockey Event | Nonrecourse Debt Pro-Rata Consolidation (3) (in thousands) | |||||||||
Barclays Center (sold in January 2016) | 2012 | 34 | % | 55 | % | Brooklyn, NY | The Brooklyn Nets (NBA Team); The NY Islanders (NHL Team) | 670,000 | 369,000 | 18,000 | 15,800 | $ | 140,460 | ||||||
64
Real Estate Operating Portfolio as of December 31, 2015 - Residential Group - Apartments
Name | Date of Opening/ Acquisition/ Expansion | Legal Ownership (1) | Pro-Rata Ownership (2) | Location | Leasable Units (5) | Leasable Units at Pro-Rata % (5) | Nonrecourse Debt Pro-Rata Consolidation (3) (in thousands) | |||||||
Consolidated Apartment Communities | ||||||||||||||
100 (100 Landsdowne) | 2005 | 100 | % | 100 | % | Cambridge, MA | 203 | 203 | $ | 45,000 | ||||
1111 Stratford | 2013-2014 | 100 | % | 100 | % | Stratford, CT | 128 | 128 | — | |||||
1251 South Michigan | 2006 | 1 | % | 100 | % | Chicago, IL | 91 | 91 | 9,500 | |||||
2175 Market Street | 2014 | 25 | % | 25 | % | San Francisco, CA | 88 | 22 | 7,500 | |||||
500 Sterling Place | 2015 | 100 | % | 100 | % | Brooklyn, NY | 77 | 77 | 35,389 | |||||
91 Sidney | 2002 | 100 | % | 100 | % | Cambridge, MA | 135 | 135 | 28,336 | |||||
American Cigar Lofts | 2000 | 100 | % | 100 | % | Richmond, VA | 171 | 171 | 11,530 | |||||
Aster Conservatory Green | 2013-2014 | 45 | % | 90 | % | Denver, CO | 352 | 317 | 32,400 | |||||
Aster Town Center North | 2015-2016 | 90 | % | 90 | % | Denver, CO | 135 | 122 | 12,613 | |||||
Bayside Village | 1988-1989 | 50 | % | 50 | % | San Francisco, CA | 862 | 431 | 73,603 | |||||
Botanica Eastbridge | 2012 | 90 | % | 90 | % | Denver, CO | 118 | 106 | 11,700 | |||||
Brookview Place | 1979 | 13 | % | 100 | % | Dayton, OH | 232 | 232 | 2,102 | |||||
Cameron Kinney Lofts | 2007 | 100 | % | 100 | % | Richmond, VA | 259 | 259 | — | |||||
Cedar Place | 1974 | 3 | % | 100 | % | Lansing, MI | 220 | 220 | 3,787 | |||||
Cherry Tree | 1996-2000 | 100 | % | 100 | % | Strongsville, OH | 444 | 444 | 17,360 | |||||
Chestnut Lake | 1969 | 100 | % | 100 | % | Strongsville, OH | 789 | 789 | — | |||||
Consolidated Carolina Lofts | 2003 | 100 | % | 100 | % | Richmond, VA | 158 | 158 | 20,937 | |||||
Cutter’s Ridge | 2006 | 100 | % | 100 | % | Richmond, VA | 12 | 12 | — | |||||
Drake Tower | 1998 | 95 | % | 95 | % | Philadelphia, PA | 284 | 270 | 24,852 | |||||
Easthaven at the Village | 1994/1995 | 100 | % | 100 | % | Beachwood, OH | 360 | 360 | 24,794 | |||||
Grand Lowry Lofts | 2000 | 100 | % | 100 | % | Denver, CO | 261 | 261 | — | |||||
Hamel Mill Lofts | 2008-2010 | 90 | % | 100 | % | Haverhill, MA | 305 | 305 | 38,999 | |||||
Heritage | 2002 | 100 | % | 100 | % | San Diego, CA | 230 | 230 | — | |||||
Hummingbird Pointe Apartments | 1972-1973 | 100 | % | 100 | % | Parma, OH | 406 | 406 | 5,890 | |||||
Independence Place I | 1973 | 50 | % | 50 | % | Parma Heights, OH | 202 | 101 | 2,005 | |||||
Independence Place II | 2003 | 100 | % | 100 | % | Parma Heights, OH | 200 | 200 | 3,480 | |||||
Kapolei Lofts | 2015-2017 | 100 | % | 0 | % | Kapolei, HI | 499 | — | — | |||||
KBL | 1990 | 3 | % | 100 | % | Cambridge, MA | 142 | 142 | 15,600 | |||||
Knolls | 1995 | 100 | % | 100 | % | Orange, CA | 260 | 260 | 32,163 | |||||
Loft 23 | 2005 | 100 | % | 100 | % | Cambridge, MA | 51 | 51 | 5,884 | |||||
Lofts at 1835 Arch | 2001 | 95 | % | 95 | % | Philadelphia, PA | 191 | 182 | 36,396 | |||||
Lucky Strike Lofts | 2008 | 100 | % | 100 | % | Richmond, VA | 131 | 131 | 16,975 | |||||
Mercantile Place on Main | 2008 | 100 | % | 100 | % | Dallas, TX | 366 | 366 | 35,629 | |||||
Metro 417 | 2005 | 100 | % | 100 | % | Los Angeles, CA | 277 | 277 | 46,970 | |||||
Midtown Towers | 1969 | 100 | % | 100 | % | Parma, OH | 635 | 635 | 12,732 | |||||
Museum Towers | 1997 | 33 | % | 33 | % | Philadelphia, PA | 286 | 95 | 10,021 | |||||
North Church Towers and Gardens | 2009 | 100 | % | 100 | % | Parma Heights, OH | 399 | 399 | 4,872 | |||||
One Franklin Town | 1988 | 100 | % | 100 | % | Philadelphia, PA | 335 | 335 | 36,520 | |||||
65
Real Estate Operating Portfolio as of December 31, 2015 - Residential Group - Apartments (continued)
Name | Date of Opening/ Acquisition/ Expansion | Legal Ownership (1) | Pro-Rata Ownership (2) | Location | Leasable Units (5) | Leasable Units at Pro-Rata % (5) | Nonrecourse Debt Pro-Rata Consolidation (3) (in thousands) | |||||||
Consolidated Apartment Communities (continued) | ||||||||||||||
Pavilion | 1992 | 95 | % | 95 | % | Chicago, IL | 1,114 | 1,058 | $ | 47,802 | ||||
Perrytown Place | 1973 | 17 | % | 100 | % | Pittsburgh, PA | 231 | 231 | 4,507 | |||||
Presidio Landmark | 2010 | 100 | % | 100 | % | San Francisco, CA | 161 | 161 | 42,790 | |||||
Queenswood | 1990 | 93 | % | 93 | % | Corona, NY | 296 | 276 | 26,821 | |||||
River Lofts at Ashton Mill | 2005 | 100 | % | 100 | % | Cumberland, RI | 193 | 193 | 16,695 | |||||
Sky55 | 2006 | 100 | % | 100 | % | Chicago, IL | 411 | 411 | 68,388 | |||||
Stratford Crossings | 2007-2010 | 100 | % | 100 | % | Wadsworth, OH | 348 | 348 | 17,661 | |||||
The Aster Town Center | 2012 | 90 | % | 90 | % | Denver, CO | 85 | 77 | 7,528 | |||||
The Continental | 2013 | 90 | % | 100 | % | Dallas, TX | 203 | 203 | 36,852 | |||||
The Met | 1989 | 100 | % | 100 | % | Los Angeles, CA | 270 | 270 | 38,900 | |||||
The Uptown | 2008 | 25 | % | 25 | % | Oakland, CA | 665 | 268 | (6) | 32,127 | ||||
The Wilson | 2007 | 100 | % | 100 | % | Dallas, TX | 135 | 135 | 12,776 | |||||
The Yards | ||||||||||||||
Foundry Lofts | 2011 | 80 | % | 100 | % | Washington, D.C. | 170 | 170 | 44,323 | |||||
Twelve12 | 2014 | 80 | % | 100 | % | Washington, D.C. | 218 | 218 | 72,356 | |||||
Town Center | 2004/2007 | 90 | % | 90 | % | Denver, CO | 298 | 268 | 33,089 | |||||
Winchester Lofts | 2014-2015 | 65 | % | 100 | % | New Haven, CT | 158 | 158 | 23,400 | |||||
Other | — | — | 6,530 | |||||||||||
Consolidated Apartment Communities Total | 15,250 | 13,368 | $ | 1,198,084 | ||||||||||
66
Real Estate Operating Portfolio as of December 31, 2015 - Residential Group - Apartments (continued)
Name | Date of Opening/ Acquisition/ Expansion | Legal Ownership (1) | Pro-Rata Ownership (2) | Location | Leasable Units (5) | Leasable Units at Pro-Rata % (5) | Nonrecourse Debt Pro-Rata Consolidation (3) (in thousands) | |||||||
Unconsolidated Apartment Communities | ||||||||||||||
3700M | 2014 | 25 | % | 25 | % | Dallas, TX | 381 | 95 | $ | 16,000 | ||||
8 Spruce Street | 2011/2012 | 26 | % | 26 | % | Manhattan, NY | 899 | 234 | 143,055 | |||||
Big Creek | 1996-2001 | 50 | % | 50 | % | Parma Heights, OH | 516 | 258 | 10,990 | |||||
Camelot Towers | 1967 | 50 | % | 50 | % | Parma Heights, OH | 151 | 76 | 1,406 | |||||
Cobblestone Court Apartments | 2006-2009 | 50 | % | 50 | % | Painesville, OH | 400 | 200 | 10,995 | |||||
Copper Tree Apartments | 1998 | 50 | % | 50 | % | Mayfield Heights, OH | 342 | 171 | 5,100 | |||||
Deer Run | 1987-1990 | 46 | % | 46 | % | Twinsburg, OH | 562 | 259 | 8,810 | |||||
DKLB BKLN | 2009/2010 | 51 | % | 51 | % | Brooklyn, NY | 365 | 186 | 53,040 | |||||
Grand | 1999 | 43 | % | 43 | % | North Bethesda, MD | 549 | 235 | 40,854 | |||||
Hamptons | 1969 | 50 | % | 50 | % | Beachwood, OH | 651 | 326 | 17,537 | |||||
Hunter’s Hollow | 1990 | 50 | % | 50 | % | Strongsville, OH | 208 | 104 | 5,423 | |||||
Lenox Club | 1991 | 48 | % | 48 | % | Arlington, VA | 386 | 183 | 22,800 | |||||
Lenox Park | 1992 | 48 | % | 48 | % | Silver Spring, MD | 407 | 193 | 25,100 | |||||
Liberty Hills Apartments | 1979-1986 | 50 | % | 50 | % | Solon, OH | 396 | 198 | 10,572 | |||||
Pine Ridge Apartments | 1967-1974, 2005-2007 | 50 | % | 50 | % | Willoughby Hills, OH | 1,309 | 655 | 27,760 | |||||
Radian | 2014 | 50 | % | 50 | % | Boston, MA | 240 | 120 | 41,299 | |||||
Settler’s Landing Apartments | 2000-2004 | 50 | % | 50 | % | Streetsboro, OH | 408 | 204 | 11,557 | |||||
Surfside Towers | 1970 | 50 | % | 50 | % | Eastlake, OH | 246 | 123 | 3,500 | |||||
Tamarac | 1990-2001 | 50 | % | 50 | % | Willoughby, OH | 642 | 321 | 17,113 | |||||
Worth Street | 2003 | 50 | % | 50 | % | Manhattan, NY | 331 | 166 | 49,050 | |||||
Other | — | — | 1,090 | |||||||||||
Unconsolidated Apartment Communities Total | 9,389 | 4,307 | $ | 523,051 | ||||||||||
67
Real Estate Operating Portfolio as of December 31, 2015 - Residential Group - Apartments (continued)
Name | Date of Opening/ Acquisition/ Expansion | Legal Ownership (1) | Pro-Rata Ownership (2) | Location | Leasable Units (5) | Leasable Units at Pro-Rata % (5) | Nonrecourse Debt Pro-Rata Consolidation (3) (in thousands) | |||||||
Unconsolidated Subsidized Senior Housing Apartments | ||||||||||||||
Autumn Ridge Village | 2002 | 100 | % | 100 | % | Sterling Heights, MI | 251 | 251 | $ | 7,347 | ||||
Bowin Place | 1998 | 95 | % | 95 | % | Detroit, MI | 193 | 183 | 5,067 | |||||
Brookpark Place | 1976 | 100 | % | 100 | % | Wheeling, WV | 152 | 152 | 279 | |||||
Buckeye Towers | 1976 | 16 | % | 16 | % | New Boston, OH | 120 | 18 | 349 | |||||
Burton Place | 2000 | 90 | % | 90 | % | Burton, MI | 200 | 180 | 6,191 | |||||
Cambridge Towers | 2002 | 100 | % | 100 | % | Detroit, MI | 250 | 250 | 5,212 | |||||
Canton Towers | 1978 | 16 | % | 16 | % | Canton, OH | 199 | 31 | — | |||||
Carl D. Perkins | 2002 | 100 | % | 100 | % | Pikeville, KY | 150 | 150 | 4,502 | |||||
Casa Panorama | 1978 | 99 | % | 99 | % | Panorama City, CA | 154 | 152 | 1,193 | |||||
Citizen’s Plaza | 1981 | 9 | % | 50 | % | New Kensington, PA | 101 | 51 | 1,073 | |||||
Connellsville Towers | 1981 | 25 | % | 21 | % | Connellsville, PA | 111 | 24 | 685 | |||||
Coraopolis Towers | 2002 | 80 | % | 80 | % | Coraopolis, PA | 200 | 160 | 3,454 | |||||
Donora Towers | 2002 | 100 | % | 100 | % | Donora, PA | 103 | 103 | 2,378 | |||||
Farmington Place | 1980 | 100 | % | 100 | % | Farmington, MI | 153 | 153 | 5,419 | |||||
Fenimore Court | 1982 | 9 | % | 50 | % | Detroit, MI | 144 | 72 | 2,010 | |||||
Fort Lincoln II | 1979 | 45 | % | 45 | % | Washington, D.C. | 176 | 79 | 5,211 | |||||
Fort Lincoln III & IV | 1981 | 25 | % | 25 | % | Washington, D.C. | 306 | 76 | 6,993 | |||||
Frenchtown Place | 1975 | 17 | % | 100 | % | Monroe, MI | 151 | 151 | 1,532 | |||||
Glendora Gardens | 1983 | 2 | % | 46 | % | Glendora, CA | 105 | 48 | 3,665 | |||||
Grove | 2003 | 100 | % | 100 | % | Ontario, CA | 101 | 101 | 6,823 | |||||
John Sale Manor | 1977 | 7 | % | 7 | % | Xenia, OH | 118 | 8 | 240 | |||||
Lakeland Place | 1998 | 95 | % | 95 | % | Waterford, MI | 200 | 190 | 4,681 | |||||
Lima Towers | 1977 | 16 | % | 16 | % | Lima, OH | 200 | 31 | 530 | |||||
Miramar Towers | 1980 | 13 | % | 100 | % | Los Angeles, CA | 157 | 157 | 2,325 | |||||
Noble Towers | 1979 | 50 | % | 50 | % | Pittsburgh, PA | 133 | 67 | 1,639 | |||||
North Port Village | 1981 | 31 | % | 31 | % | Port Huron, MI | 251 | 77 | 1,846 | |||||
Oceanpointe Towers | 1980 | 13 | % | 100 | % | Long Branch, NJ | 151 | 151 | 12,804 | |||||
Park Place Towers | 1975 | 24 | % | 100 | % | Mt. Clemens, MI | 187 | 187 | 1,923 | |||||
Pine Grove Manor | 1973 | 19 | % | 100 | % | Muskegon Township, MI | 172 | 172 | 1,960 | |||||
Plymouth Square Village | 2003 | 100 | % | 100 | % | Detroit, MI | 280 | 280 | 5,928 | |||||
Potomac Heights Apartments | 1981 | 13 | % | 100 | % | Keyser, WV | 141 | 141 | 2,725 | |||||
Riverside Towers | 1977 | 10 | % | 100 | % | Coshocton, OH | 100 | 100 | 1,894 | |||||
Shippan Place | 1980 | 100 | % | 100 | % | Stamford, CT | 148 | 148 | 4,851 | |||||
St. Mary’s Villa | 2002 | 44 | % | 44 | % | Newark, NJ | 360 | 159 | 9,328 | |||||
The Springs | 1981 | 13 | % | 100 | % | La Mesa, CA | 129 | 129 | 3,079 | |||||
Tower 43 | 2002 | 100 | % | 100 | % | Kent, OH | 101 | 101 | 2,425 | |||||
Towne Centre Place | 1975 | 18 | % | 100 | % | Ypsilanti, MI | 170 | 170 | 1,717 | |||||
Village Center | 1983 | 100 | % | 100 | % | Detroit, MI | 254 | 254 | 1,745 | |||||
68
Real Estate Operating Portfolio as of December 31, 2015 - Residential Group - Apartments (continued)
Name | Date of Opening/ Acquisition/ Expansion | Legal Ownership (1) | Pro-Rata Ownership (2) | Location | Leasable Units (5) | Leasable Units at Pro-Rata % (5) | Nonrecourse Debt Pro-Rata Consolidation (3) (in thousands) | |||||||
Unconsolidated Subsidized Senior Housing Apartments (continued) | ||||||||||||||
Village Square | 1978 | 100 | % | 100 | % | Williamsville, NY | 100 | 100 | $ | 3,847 | ||||
Ziegler Place | 1978 | 100 | % | 100 | % | Livonia, MI | 141 | 141 | 4,070 | |||||
Unconsolidated Subsidized Senior Housing Apartments Total | 6,813 | 5,148 | $ | 138,940 | ||||||||||
Unconsolidated Apartments Total | 16,202 | 9,455 | $ | 661,991 | ||||||||||
Combined Apartments Total | 31,452 | 22,823 | $ | 1,860,075 | ||||||||||
Federally Subsidized Housing (Total of 4 Buildings) | 623 | |||||||||||||
Total Apartment Units at December 31, 2015 | 32,075 | |||||||||||||
Total Apartment Units at December 31, 2014 | 32,666 | |||||||||||||
69
Real Estate Portfolio as of December 31, 2015 - Residential Group - Military Housing
Name | Date of Opening/ Acquisition/ Expansion | Legal Ownership (1) | Pro-Rata Ownership (2) | Location | Leasable Units (5) | Nonrecourse Debt Pro-Rata Consolidation (3) (in thousands) | ||||
Unconsolidated Military Housing (7) | ||||||||||
Air Force Academy | 2007-2011 | 50% | 50% | Colorado Springs, CO | 427 | $ | 28,458 | |||
Marine Corp Base - Hawaii | 2007-2014 | 1% | ^ | Kaneohe, HI | 2,316 | — | ||||
Marines Region - Hawaii (Under Construction) | 2015-2018 | 1% | ^ | Honolulu, HI | 260 | — | ||||
Midwest Millington | 2008-2011 | 1% | ^ | Memphis, TN | 318 | — | ||||
Navy Midwest | 2006-2011 | 1% | ^ | Chicago, IL | 1,401 | — | ||||
Navy Region - Hawaii | 2005-2011 | 1% | ^ | Honolulu, HI | 4,472 | — | ||||
Pacific Northwest Communities | 2007-2011 | 20% | ^ | Seattle, WA | 3,077 | — | ||||
Pacific Northwest Communities - Phase II (Under Construction) | 2015-2018 | 20% | ^ | Seattle, WA | 367 | — | ||||
Southern Group: | ||||||||||
Arnold Air Force Base | 2011-2013 | 100% | ^^ | Tullahoma, TN | 22 | — | ||||
Joint Base Charleston | 2011-2013 | 100% | ^^ | Charleston, SC | 345 | — | ||||
Keesler Air Force Base | 2011-2012 | 100% | ^^ | Biloxi, MS | 1,184 | — | ||||
Shaw Air Force Base | 2011-2015 | 100% | ^^ | Sumter, SC | 630 | — | ||||
Unconsolidated Military Housing Total | 14,819 | $ | 28,458 | |||||||
Total Military Housing at December 31, 2015 | 14,819 | $ | 28,458 | |||||||
Total Military Housing at December 31, 2014 | 14,559 | $ | 28,712 | |||||||
(1) | Represents our actual equity ownership in the underlying property, rounded to the nearest whole percent. |
(2) | Represents the percentage of income or loss allocation expected to be received during the reporting period based on the entity's capital structure. Amounts differ from legal ownership due to various scenarios, including but not limited to our right to preferred returns on our initial or disproportionate equity fundings, various tax credits and tax related structures. (Rounded to the nearest whole percent.) |
(3) | Amounts are derived from the respective Pro-Rata balance sheet line item as of December 31, 2015 and 2014 and are reconciled to their GAAP equivalents in the Selected Financial Information section of this supplemental package. |
(4) | On January 29, 2016, we closed on the creation of a joint venture with QIC, in which QIC acquired 51% of our equity ownership of Westchester’s Ridge Hill. |
(5) | Represents 100% of the leasable units in the apartment community. Leasable units at Pro-Rata % represent the total leasable units multiplied by the Pro-Rata ownership percent. |
(6) | Represents 25% of 530 market rate units and 100% of 135 affordable units. |
(7) | On February 22, 2016, we completed the sale of all unconsolidated military housing entities. |
^ | Our share of residual cash flow ranges from 0-20% during the life cycle of the project. |
^^ | We do not share in any cash flow from operations. However, we are entitled to the return of our equity at the end of the 50-year lease term. |
70