Attached files
| file | filename |
|---|---|
| 8-K - 8-K - VEECO INSTRUMENTS INC | a16-4875_18k.htm |
| EX-99.1 - EX-99.1 - VEECO INSTRUMENTS INC | a16-4875_1ex99d1.htm |
Exhibit 99.2
Q4 2015 Conference Call Veeco Instruments Inc. February 22, 2016

Safe Harbor To the extent that this presentation discusses expectations or otherwise makes statements about the future, such statements are forward-looking and are subject to a number of risks and uncertainties that could cause actual results to differ materially from the statements made. These items include the risk factors discussed in the Business Description and Management's Discussion and Analysis sections of Veeco's Annual Report on Form 10-K for the year ended December 31, 2014 and subsequent Quarterly Reports on Form 10-Q and current reports on Form 8-K. Veeco does not undertake any obligation to update any forward-looking statements to reflect future events or circumstances after the date of such statements.
CEO Introduction John Peeler
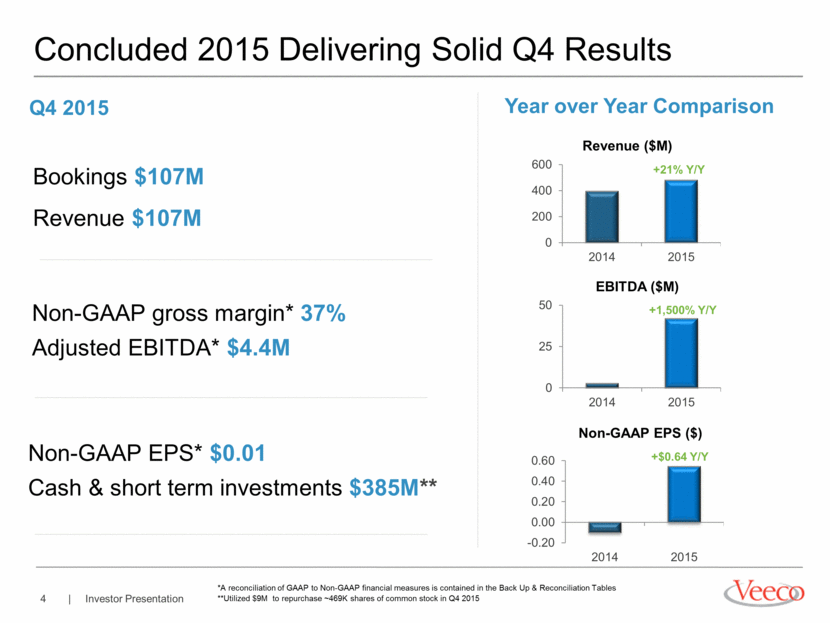
Concluded 2015 Delivering Solid Q4 Results *A reconciliation of GAAP to Non-GAAP financial measures is contained in the Back Up & Reconciliation Tables **Utilized $9M to repurchase ~469K shares of common stock in Q4 2015 +21% Y/Y +$0.64 Y/Y Revenue ($M) EBITDA ($M) Non-GAAP EPS ($) +1,500% Y/Y Bookings $107M Revenue $107M Non-GAAP gross margin* 37% Adjusted EBITDA* $4.4M Non-GAAP EPS* $0.01 Cash & short term investments $385M** Q4 2015 Year over Year Comparison
CFO Financial Review Sam Maheshwari
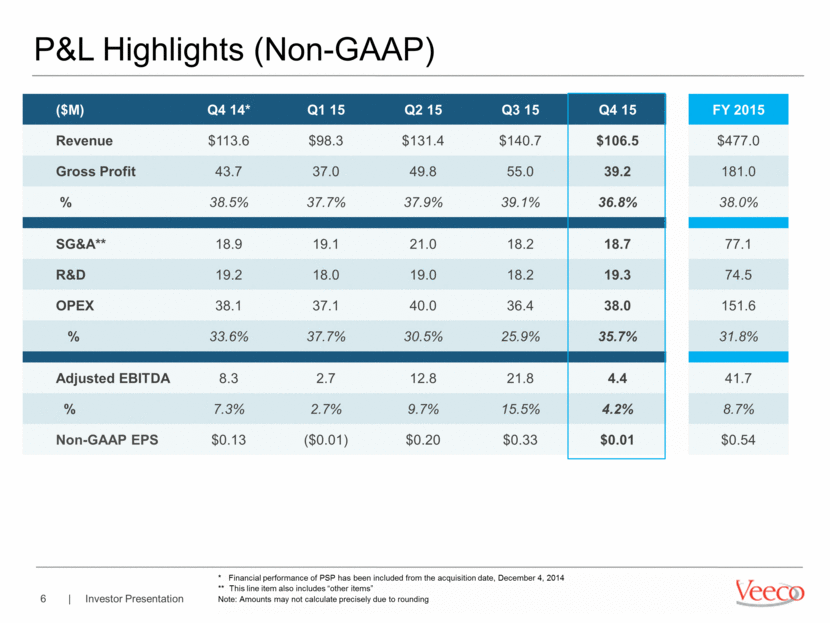
P&L Highlights (Non-GAAP) ($M) Q4 14* Q1 15 Q2 15 Q3 15 Q4 15 FY 2015 Revenue $113.6 $98.3 $131.4 $140.7 $106.5 $477.0 Gross Profit 43.7 37.0 49.8 55.0 39.2 181.0 % 38.5% 37.7% 37.9% 39.1% 36.8% 38.0% SG&A** 18.9 19.1 21.0 18.2 18.7 77.1 R&D 19.2 18.0 19.0 18.2 19.3 74.5 OPEX 38.1 37.1 40.0 36.4 38.0 151.6 % 33.6% 37.7% 30.5% 25.9% 35.7% 31.8% Adjusted EBITDA 8.3 2.7 12.8 21.8 4.4 41.7 % 7.3% 2.7% 9.7% 15.5% 4.2% 8.7% Non-GAAP EPS $0.13 ($0.01) $0.20 $0.33 $0.01 $0.54 * Financial performance of PSP has been included from the acquisition date, December 4, 2014 ** This line item also includes “other items” Note: Amounts may not calculate precisely due to rounding
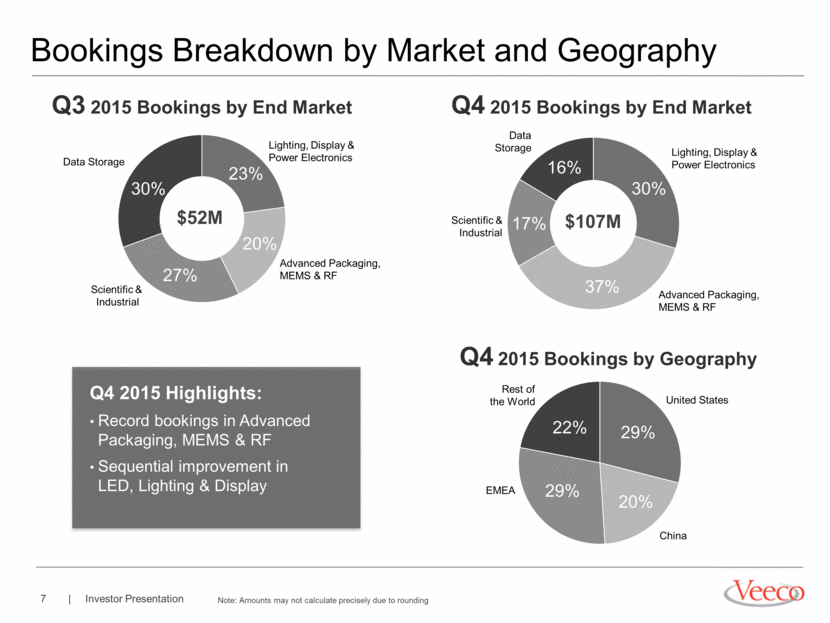
Bookings Breakdown by Market and Geography Advanced Packaging, MEMS & RF Data Storage Scientific & Industrial 17% 37% 16% 30% Q4 2015 Bookings by End Market Note: Amounts may not calculate precisely due to rounding Q4 2015 Highlights: Record bookings in Advanced Packaging, MEMS & RF Sequential improvement in LED, Lighting & Display Advanced Packaging, MEMS & RF Data Storage Scientific & Industrial 27% 20% 30% 23% Lighting, Display & Power Electronics Q3 2015 Bookings by End Market $107M 20% 29% 22% United States Rest of the World China 29% EMEA Q4 2015 Bookings by Geography Lighting, Display & Power Electronics $52M
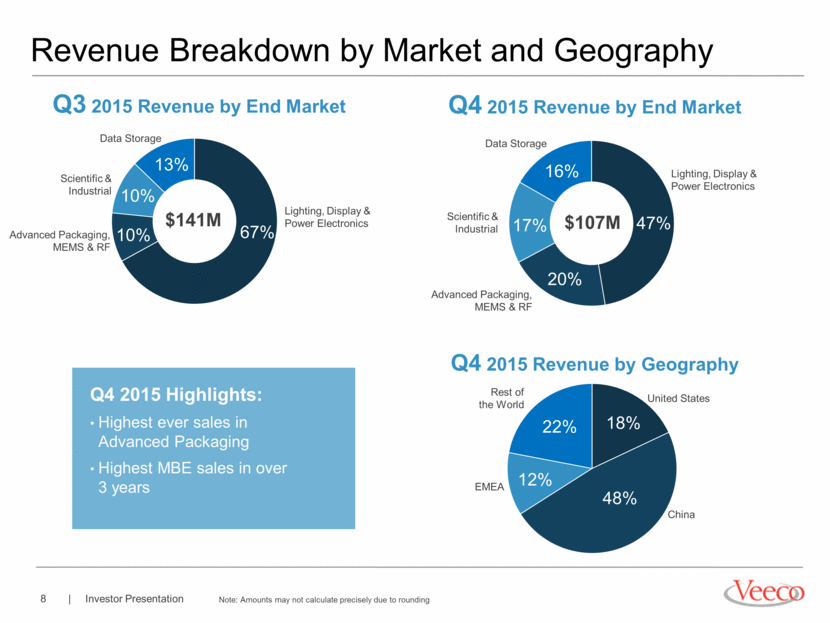
Revenue Breakdown by Market and Geography Note: Amounts may not calculate precisely due to rounding Advanced Packaging, MEMS & RF Data Storage Scientific & Industrial 10% 10% 13% 67% Lighting, Display & Power Electronics Q3 2015 Revenue by End Market Advanced Packaging, MEMS & RF Data Storage Scientific & Industrial 17% 20% 16% 47% Lighting, Display & Power Electronics Q4 2015 Revenue by End Market $107M 48% 18% 22% United States Rest of the World China 12% EMEA Q4 2015 Revenue by Geography Q4 2015 Highlights: Highest ever sales in Advanced Packaging Highest MBE sales in over 3 years $141M
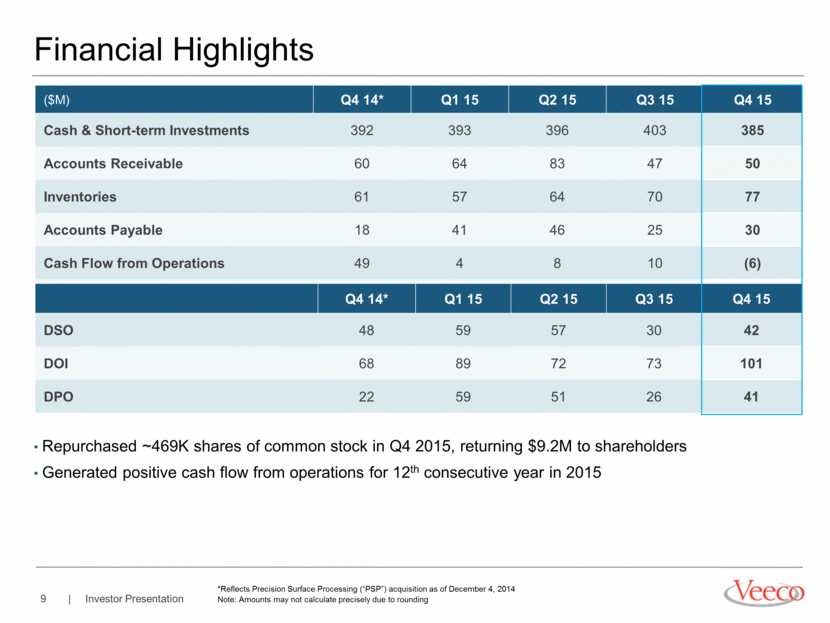
($M) Q4 14* Q1 15 Q2 15 Q3 15 Q4 15 Cash & Short-term Investments 392 393 396 403 385 Accounts Receivable 60 64 83 47 50 Inventories 61 57 64 70 77 Accounts Payable 18 41 46 25 30 Cash Flow from Operations 49 4 8 10 (6) Financial Highlights Q4 14* Q1 15 Q2 15 Q3 15 Q4 15 DSO 48 59 57 30 42 DOI 68 89 72 73 101 DPO 22 59 51 26 41 *Reflects Precision Surface Processing (“PSP”) acquisition as of December 4, 2014 Note: Amounts may not calculate precisely due to rounding Repurchased ~469K shares of common stock in Q4 2015, returning $9.2M to shareholders Generated positive cash flow from operations for 12th consecutive year in 2015
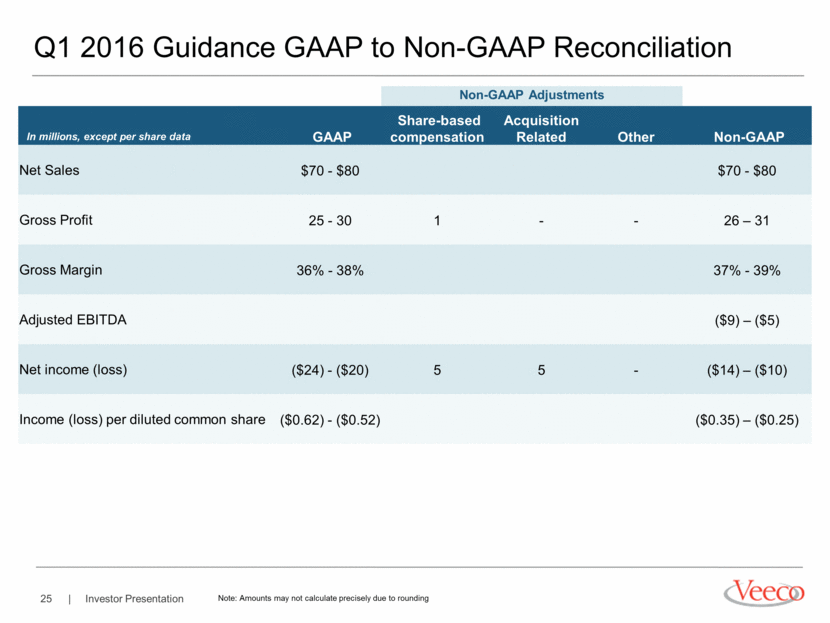
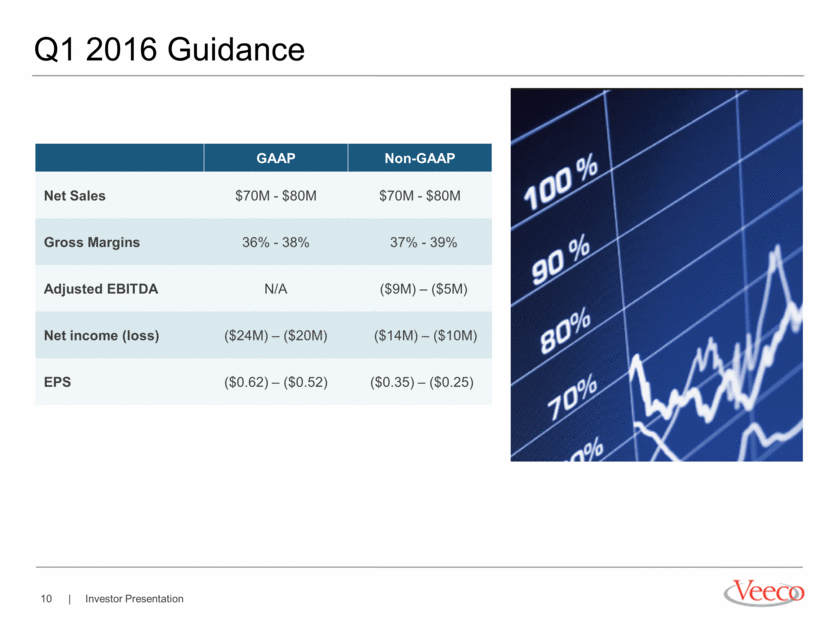
Q1 2016 Guidance GAAP Non-GAAP Net Sales $70M - $80M $70M - $80M Gross Margins 36% - 38% 37% - 39% Adjusted EBITDA N/A ($9M) – ($5M) Net income (loss) ($24M) – ($20M) ($14M) – ($10M) EPS ($0.62) – ($0.52) ($0.35) – ($0.25)
Business Update & Outlook

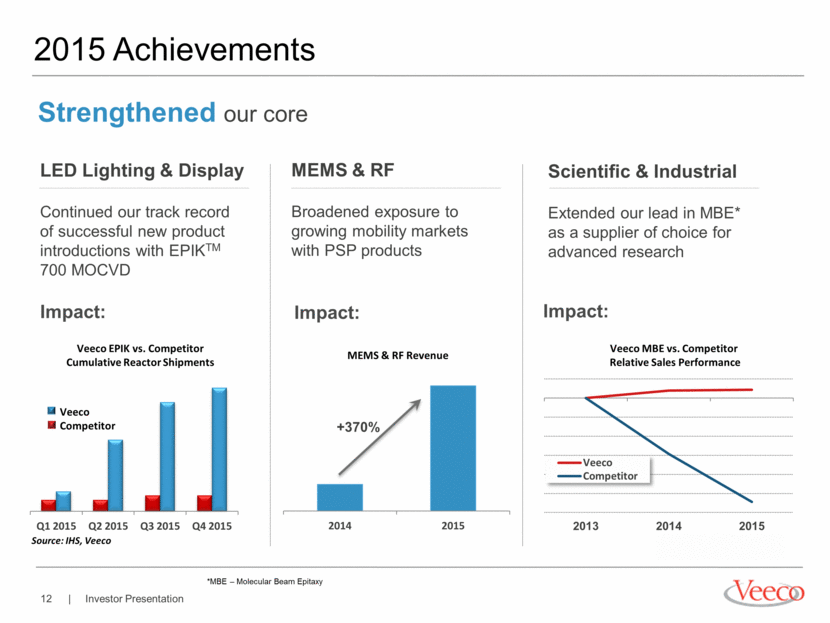
2015 Achievements LED Lighting & Display Continued our track record of successful new product introductions with EPIKTM 700 MOCVD Strengthened our core MEMS & RF Broadened exposure to growing mobility markets with PSP products Scientific & Industrial Extended our lead in MBE* as a supplier of choice for advanced research *MBE – Molecular Beam Epitaxy Impact: Impact: Impact: MEMS & RF Revenue Veeco EPIK vs. Competitor Cumulative Reactor Shipments Veeco Competitor Source: IHS, Veeco Veeco MBE vs. Competitor Relative Sales Performance 2014 2015 +370% Q1 2015 Q2 2015 Q3 2015 Q4 2015 2013 2014 2015 Veeco Competitor
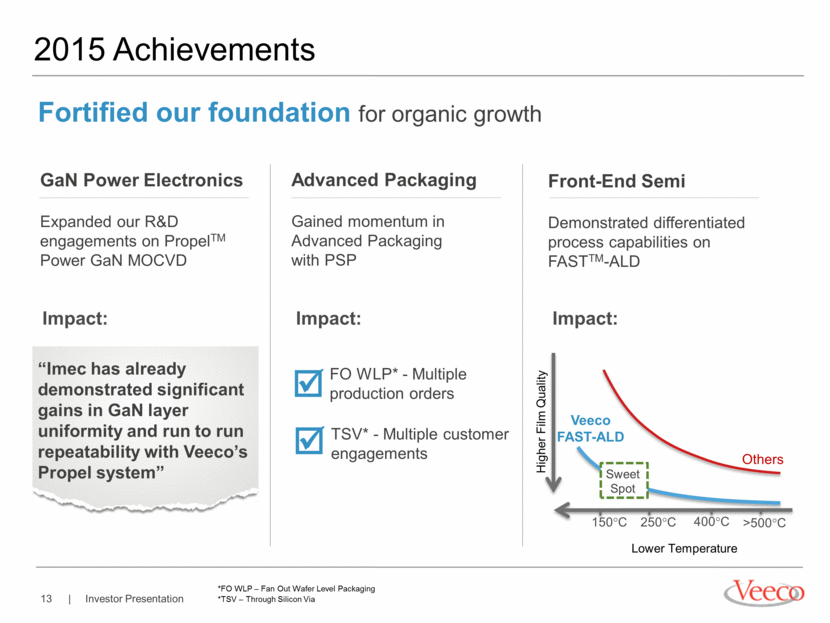
2015 Achievements GaN Power Electronics Expanded our R&D engagements on PropelTM Power GaN MOCVD Fortified our foundation for organic growth Advanced Packaging Gained momentum in Advanced Packaging with PSP Front-End Semi Demonstrated differentiated process capabilities on FASTTM-ALD FO WLP* - Multiple production orders TSV* - Multiple customer engagements 150C 250C 400C Veeco FAST-ALD Others >500C Higher Film Quality Lower Temperature *FO WLP – Fan Out Wafer Level Packaging *TSV – Through Silicon Via Sweet Spot Impact: Impact: Impact: “Imec has already demonstrated significant gains in GaN layer uniformity and run to run repeatability with Veeco’s Propel system”
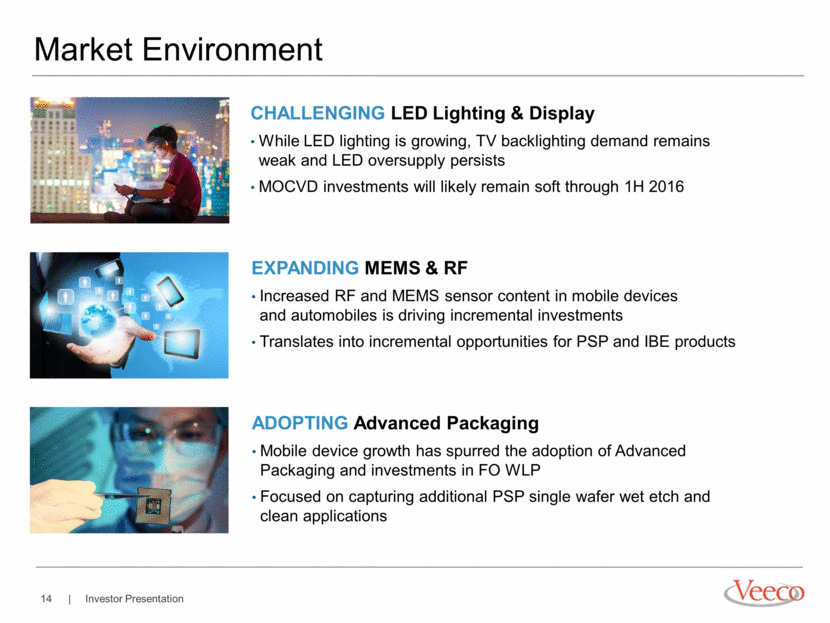
Market Environment CHALLENGING LED Lighting & Display While LED lighting is growing, TV backlighting demand remains weak and LED oversupply persists MOCVD investments will likely remain soft through 1H 2016 EXPANDING MEMS & RF Increased RF and MEMS sensor content in mobile devices and automobiles is driving incremental investments Translates into incremental opportunities for PSP and IBE products ADOPTING Advanced Packaging Mobile device growth has spurred the adoption of Advanced Packaging and investments in FO WLP Focused on capturing additional PSP single wafer wet etch and clean applications
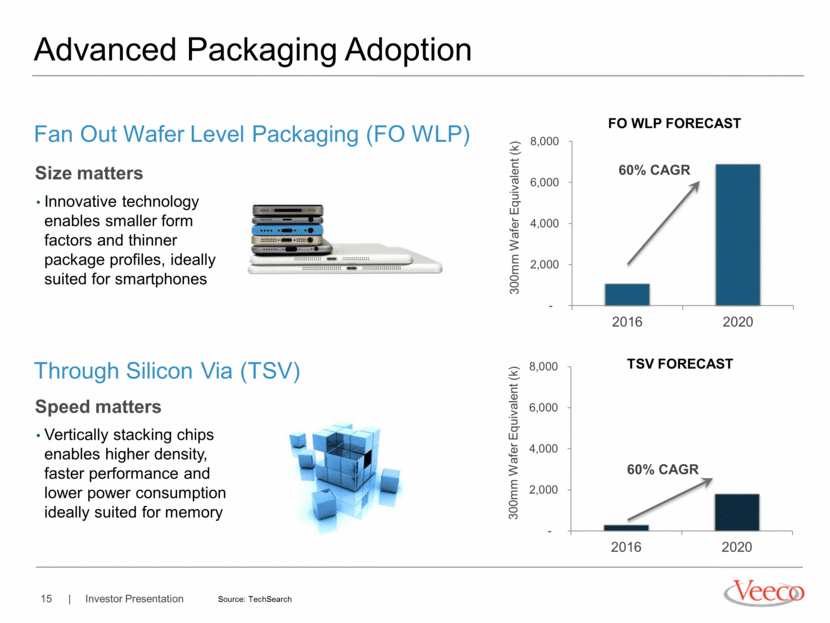
Advanced Packaging Adoption Fan Out Wafer Level Packaging (FO WLP) Through Silicon Via (TSV) 60% CAGR 60% CAGR FO WLP FORECAST TSV FORECAST Size matters Source: TechSearch Speed matters Innovative technology enables smaller form factors and thinner package profiles, ideally suited for smartphones Vertically stacking chips enables higher density, faster performance and lower power consumption ideally suited for memory - 2,000 4,000 6,000 8,000 2016 2020 300mm Wafer Equivalent (k) - 2,000 4,000 6,000 8,000 2016 2020 300mm Wafer Equivalent (k)
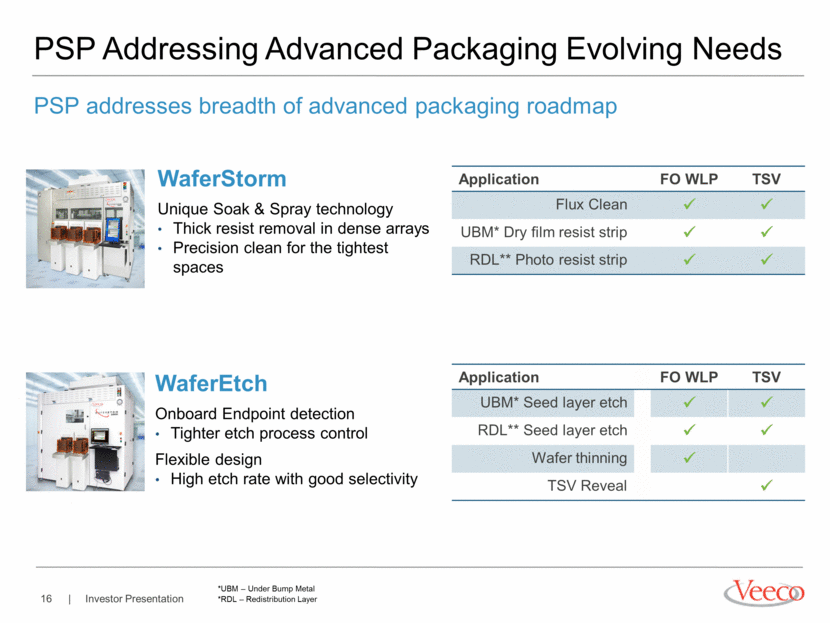
PSP Addressing Advanced Packaging Evolving Needs Application FO WLP TSV Flux Clean UBM* Dry film resist strip RDL** Photo resist strip Application FO WLP TSV UBM* Seed layer etch RDL** Seed layer etch Wafer thinning TSV Reveal WaferStorm Unique Soak & Spray technology Thick resist removal in dense arrays Precision clean for the tightest spaces PSP addresses breadth of advanced packaging roadmap WaferEtch Onboard Endpoint detection Tighter etch process control Flexible design High etch rate with good selectivity *UBM – Under Bump Metal *RDL – Redistribution Layer
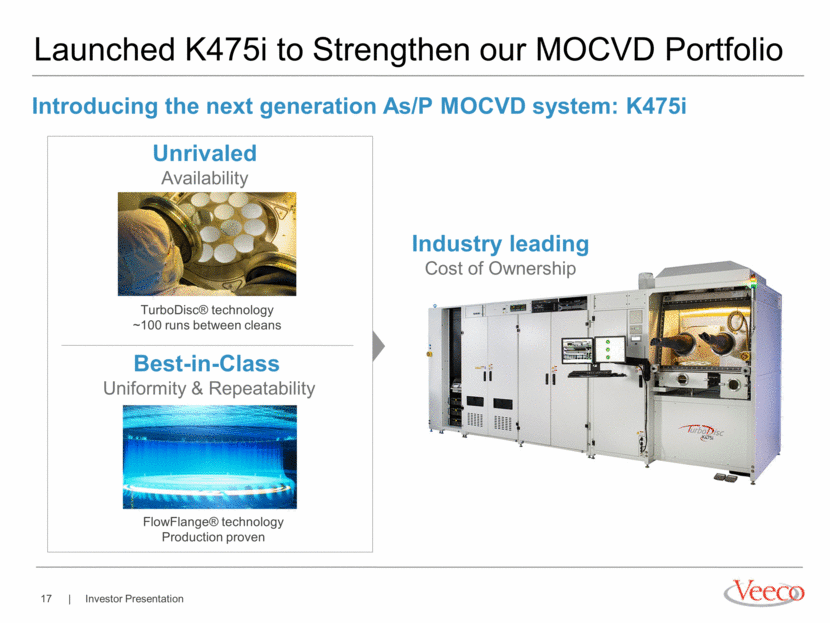
Introducing the next generation As/P MOCVD system: K475i Launched K475i to Strengthen our MOCVD Portfolio Unrivaled Availability TurboDisc® technology ~100 runs between cleans Industry leading Cost of Ownership FlowFlange® technology Production proven Best-in-Class Uniformity & Repeatability
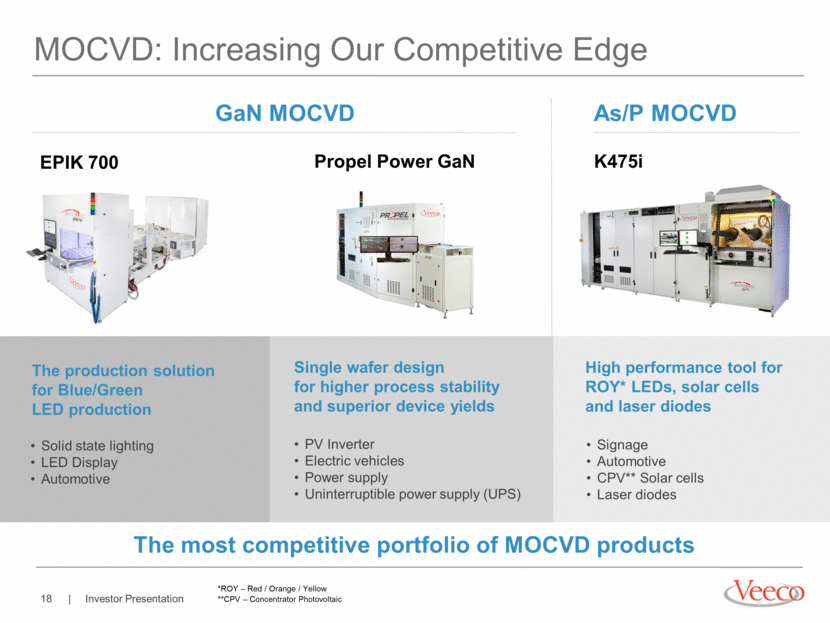
As/P MOCVD High performance tool for ROY* LEDs, solar cells and laser diodes MOCVD: Increasing Our Competitive Edge GaN MOCVD The production solution for Blue/Green LED production Single wafer design for higher process stability and superior device yields The most competitive portfolio of MOCVD products K475i EPIK 700 Propel Power GaN PV Inverter Electric vehicles Power supply Uninterruptible power supply (UPS) Signage Automotive CPV** Solar cells Laser diodes Solid state lighting LED Display Automotive *ROY – Red / Orange / Yellow **CPV – Concentrator Photovoltaic
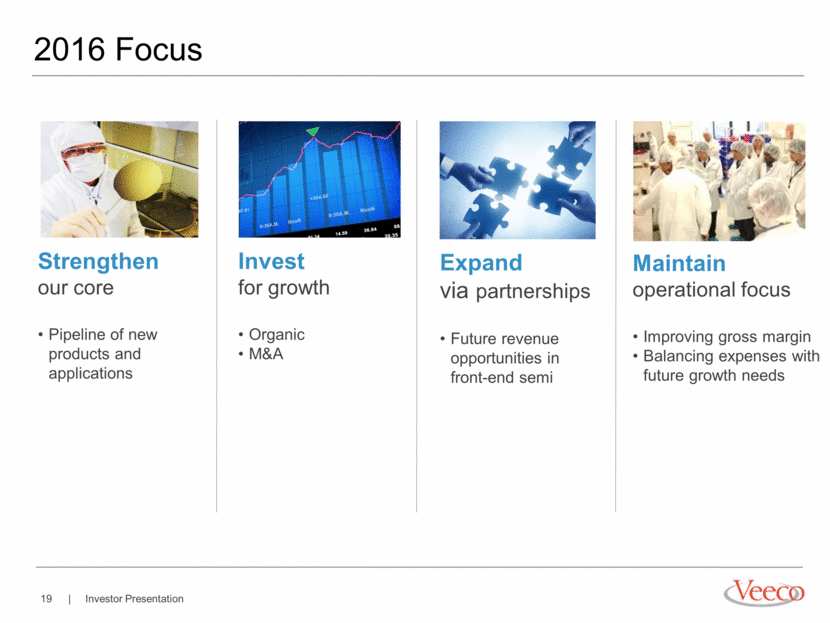
2016 Focus Strengthen our core Pipeline of new products and applications Invest for growth Organic M&A Expand via partnerships Future revenue opportunities in front-end semi Maintain operational focus Improving gross margin Balancing expenses with future growth needs
Q&A

Back Up & Reconciliation Tables
Note On Reconciliation Tables These tables include financial measures adjusted for the impact of certain items; these financial measures are therefore not calculated in accordance with U.S. generally accepted accounting principles (“GAAP”). These Non-GAAP financial measures exclude items such as: share-based compensation expense; non-recurring charges relating to restructuring initiatives, non-cash asset impairments, certain other non-operating gains and losses, and acquisition-related items such as one-time transaction costs, non-cash amortization of acquired intangible assets, incremental non-recurring compensation, and the stepped-up cost of sales associated with the purchase accounting of acquired inventory. These Non-GAAP financial measures may be different from Non-GAAP financial measures used by other companies. Non-GAAP financial measures should not be considered as a substitute for, or superior to, measures of financial performance prepared in accordance with GAAP. By excluding these items, Non-GAAP financial measures are intended to facilitate meaningful comparisons to historical operating results, competitors’ operating results, and estimates made by securities analysts. Management is evaluated on key performance metrics including adjusted EBITDA, which is used to determine management incentive compensation as well as to forecast future periods. These Non-GAAP financial measures may be useful to investors in allowing for greater transparency of supplemental information used by management in its financial and operational decision-making. In addition, similar Non-GAAP financial measures have historically been reported to investors; the inclusion of comparable numbers provides consistency in financial reporting. Investors are encouraged to review the reconciliation of the Non-GAAP financial measures used in Veeco’s news release to their most directly comparable GAAP financial measures.
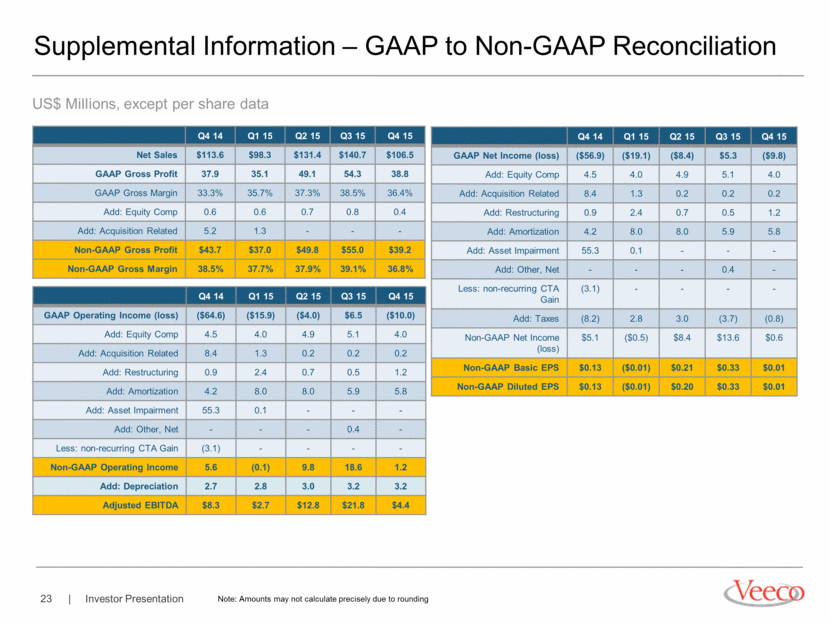
Supplemental Information – GAAP to Non-GAAP Reconciliation Q4 14 Q1 15 Q2 15 Q3 15 Q4 15 Net Sales $113.6 $98.3 $131.4 $140.7 $106.5 GAAP Gross Profit 37.9 35.1 49.1 54.3 38.8 GAAP Gross Margin 33.3% 35.7% 37.3% 38.5% 36.4% Add: Equity Comp 0.6 0.6 0.7 0.8 0.4 Add: Acquisition Related 5.2 1.3 - - - Non-GAAP Gross Profit $43.7 $37.0 $49.8 $55.0 $39.2 Non-GAAP Gross Margin 38.5% 37.7% 37.9% 39.1% 36.8% Q4 14 Q1 15 Q2 15 Q3 15 Q4 15 GAAP Operating Income (loss) ($64.6) ($15.9) ($4.0) $6.5 ($10.0) Add: Equity Comp 4.5 4.0 4.9 5.1 4.0 Add: Acquisition Related 8.4 1.3 0.2 0.2 0.2 Add: Restructuring 0.9 2.4 0.7 0.5 1.2 Add: Amortization 4.2 8.0 8.0 5.9 5.8 Add: Asset Impairment 55.3 0.1 - - - Add: Other, Net - - - 0.4 - Less: non-recurring CTA Gain (3.1) - - - - Non-GAAP Operating Income 5.6 (0.1) 9.8 18.6 1.2 Add: Depreciation 2.7 2.8 3.0 3.2 3.2 Adjusted EBITDA $8.3 $2.7 $12.8 $21.8 $4.4 Q4 14 Q1 15 Q2 15 Q3 15 Q4 15 GAAP Net Income (loss) ($56.9) ($19.1) ($8.4) $5.3 ($9.8) Add: Equity Comp 4.5 4.0 4.9 5.1 4.0 Add: Acquisition Related 8.4 1.3 0.2 0.2 0.2 Add: Restructuring 0.9 2.4 0.7 0.5 1.2 Add: Amortization 4.2 8.0 8.0 5.9 5.8 Add: Asset Impairment 55.3 0.1 - - - Add: Other, Net - - - 0.4 - Less: non-recurring CTA Gain (3.1) - - - - Add: Taxes (8.2) 2.8 3.0 (3.7) (0.8) Non-GAAP Net Income (loss) $5.1 ($0.5) $8.4 $13.6 $0.6 Non-GAAP Basic EPS $0.13 ($0.01) $0.21 $0.33 $0.01 Non-GAAP Diluted EPS $0.13 ($0.01) $0.20 $0.33 $0.01 Note: Amounts may not calculate precisely due to rounding US$ Millions, except per share data
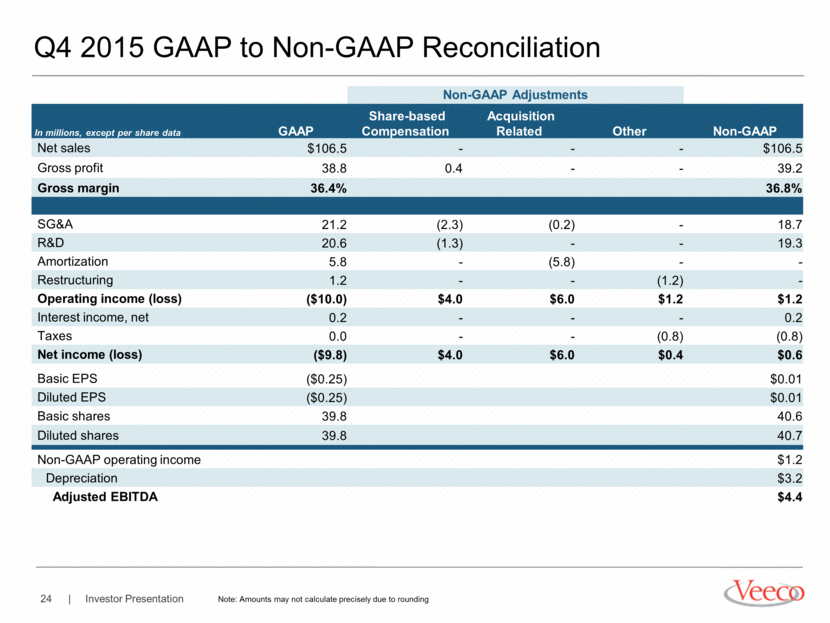
Q4 2015 GAAP to Non-GAAP Reconciliation Non-GAAP Adjustments In millions, except per share data GAAP Share-based Compensation Acquisition Related Other Non-GAAP Net sales $106.5 - - - $106.5 Gross profit 38.8 0.4 - - 39.2 Gross margin 36.4% 36.8% SG&A 21.2 (2.3) (0.2) - 18.7 R&D 20.6 (1.3) - - 19.3 Amortization 5.8 - (5.8) - - Restructuring 1.2 - - (1.2) - Operating income (loss) ($10.0) $4.0 $6.0 $1.2 $1.2 Interest income, net 0.2 - - - 0.2 Taxes 0.0 - - (0.8) (0.8) Net income (loss) ($9.8) $4.0 $6.0 $0.4 $0.6 Basic EPS ($0.25) $0.01 Diluted EPS ($0.25) $0.01 Basic shares 39.8 40.6 Diluted shares 39.8 40.7 Non-GAAP operating income $1.2 Depreciation $3.2 Adjusted EBITDA $4.4 Note: Amounts may not calculate precisely due to rounding
Q1 2016 Guidance GAAP to Non-GAAP Reconciliation Non-GAAP Adjustments In millions, except per share data GAAP Share-based compensation Acquisition Related Other Non-GAAP Net Sales $70 - $80 $70 - $80 Gross Profit 25 - 30 1 - - 26 – 31 Gross Margin 36% - 38% 37% - 39% Adjusted EBITDA ($9) – ($5) Net income (loss) ($24) - ($20) 5 5 - ($14) – ($10) Income (loss) per diluted common share ($0.62) - ($0.52) ($0.35) – ($0.25) Note: Amounts may not calculate precisely due to rounding