Attached files
| file | filename |
|---|---|
| 8-K - CHINA FUND INC | fp0018146_8k.htm |

Manager’s Commentary
Market Review
January 2016 was a painful start to the year for Chinese equities. On the back of the gloomy macro outlook for China, bearish sentiment was deepened by the two rounds of ‘circuit breakers’ in the China A-Share market. The new mechanism, although well-intended, helped to amplify market volatility and was abandoned immediately. On the currency front, the Renminbi’s (“RMB”) new target to track a basket of currencies led to speculation that China was initiating a big devaluation. Moreover, the recent sharp decline in foreign exchange reserves raised doubts about the central bank’s capability to defend the Renminbi. Weak economic data and unclear policy changes called the Chinese authorities into question, so it was not surprising that Chinese equities retreated further. The pressure spread into Hong Kong’s capital markets with interbank rates rising sharply as the Hong Kong Dollar (“HKD”) fell to the low end of its fixed trading band. The Taiwan stock market held up relatively well after the poor performance in 2015. Over the month, the MSCI Golden Dragon Index (the “benchmark index”) with 75% exposure in China and Hong Kong, returned -10% in US dollar (“USD”) terms.
Fund Review
In January, the Fund’s Net Asset Value (“NAV”) price underperformed the benchmark index by more than 3%. Over the month we saw a significant style reversal in the market, with previous outperforming sectors giving back some of their relative gains. For example ‘structural growth’ sectors such as life insurance, health care and environment engineering companies underperformed, whereas ‘value’ sectors such as energy and materials companies held up relatively well. With the portfolio’s focus on industries with structural growth, stock selection was weak over the month, where financials and IT were the main detractors. The top detractor was Ping An Insurance Group Co. of China Ltd., the second largest life insurance provider in China. We believe the company’s strong agency force will allow it to benefit from the increasing penetration of life insurance products in and rising demand for health insurance, driven by the rising living standards of Chinese consumers. However, near term performance pressure has come from the concerns of lower bond yields in China and the correction in the China A-share market, which will negatively impact the investment return of insurance companies. During the past few months, we have been trimming positions in the Chinese insurance sector, but will remain overweight in Ping An Insurance Group, Co. of China Ltd.
One of the top contributors this month was Sands China Ltd., a Macau-based gaming company. As is often the case, we initiated this contrarian position in November 2015 after its share price corrected by more than 50% from its peak. The company’s focus on mass market customers and a more diversified revenue base means it is likely to weather the downturn better than most competitors. During the wider equity market correction in January, Sands China Ltd. remained flat as the most recent data showed further evidence of stabilization in Macau’s gaming revenue. The dividend yield of around 7% should also provide a degree of downside support to the share price.
Key Transactions
In January, we added more to defensive names with a strong balance sheet, good cash flow and the ability to pay dividends. In terms of portfolio activity, we have added to the strongest China telecom stocks. We have also started to add back to the energy sector where we believe capital expenditure cuts will help to stabilize earnings and the fall in oil prices is now well discounted in the distressed valuations. In contrast, we have been trimming exposure to Chinese banks and life insurance companies.
Outlook
In the China equity space, the risk of further RMB weakness is currently the biggest fear for investors. We believe that following the change of currency regime from August 2015 there will be more two-way volatility than has historically been the case. We should also consider the RMB on a trade-weighted currency basis, not just against the USD, which is the government’s stated target. If the USD continues to remain strong, which may happen if the US Federal Reserve continues to hike rates, then the RMB will likely weaken further against the dollar. We do not believe that the HKD peg is under threat, however further HKD currency weakness is likely to result in higher local interest rates. This tighter monetary policy would be negative for Hong Kong asset prices, and we are cautious on the economic outlook and property prices in Hong Kong in the near term.
Valuations of many Chinese stocks, especially those listed in Hong Kong, are at exceptionally depressed levels. Given the very sentiment-led markets, they may move well beyond normal parameters. As stock pickers our focus is on blocking out much of the short term market ‘noise’ and taking opportunities to add to our conviction holdings at attractive valuations.
In Brief
Fund Data
|
Description
|
Seeks to achieve long-term capital appreciation
through investments in China companies.
|
|
Listing Date (NYSE)
|
July 10, 1992
|
|
Total Fund Assets (millions)
|
$243.0
|
|
Median Market Cap (in billions)
|
$8.3
|
|
Distribution Frequency
|
Annual
|
|
Management Firm
|
Allianz Global Investors U.S. LLC
|
|
Portfolio Management
|
Christina Chung, CFA, CMA Lead Portfolio Manager
|
Performance (US$ Returns)
(as of 1/31/16)
|
Fund
|
Benchmark1
|
|
|
One Month
|
-13.01%
|
-9.98%
|
|
Three Month
|
-14.66%
|
-13.58%
|
|
One Year
|
-19.09%
|
-18.55%
|
|
Three Year
|
0.07%
|
-2.15%
|
Net Asset Value / Market Price
|
Net Asset Value (NAV) / Market Price at Inception
|
$13.15 / $14.26
|
|
NAV / Market Price (as of 1/31/16)
|
$15.45 / $13.51
|
|
High / Low Ranges (52-Week)
|
|
|
High / Low NAV
|
$26.04 / $14.65
|
|
High / Low Market Price
|
$22.22 / $12.98
|
|
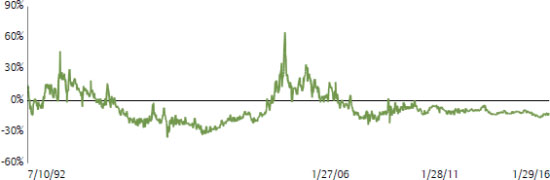
Premium/Discount to NAV (as of 1/31/16)
|
-12.56%
|
|
Fund Data (Common Shares)
|
|
|
Shares Outstanding
|
15,722,674
|
|
Average Daily Volume
|
50,792
|
|
Expense Ratio
|
1.34%
|
Fund Manager

Christina Chung, CFA, CMA
Lead Portfolio Manager
1. MSCI Golden Dragon Index.
The China Fund, Inc.
Investment Objective
The investment objective of the Fund is to achieve long-term capital appreciation. The Fund seeks to achieve its objective through investment in the equity securities of companies and other entities with significant assets, investments, production activities, trading or other business interests in China or which derive a significant part of their revenue from China.
The Fund has an operating policy that the Fund will invest at least 80% of its assets in China companies. For this purpose, ‘China companies’ are (i) companies for which the principal securities trading market is in China; (ii) companies for which the principal securities trading market is outside of China or in companies organized outside of China, that in both cases derive at least 50% of their revenues from goods or services sold or produced, or have a least 50% of their assets in China; or (iii) companies organized in China. Under the policy, China means the People’s Republic of China, including Hong Kong, and Taiwan. The Fund will provide its stockholders with at least 60 days’ prior notice of any change to this policy.
Returns For Periods Ending January 31, 2016*
|
1 Month
|
3 Month
|
YTD
|
1 Year
|
3 Year
|
5 Year
|
10 Year
|
Inception
|
|
|
NAV
|
-13.01%
|
-14.66%
|
-13.01%
|
-19.09%
|
0.07%
|
-1.58%
|
10.63%
|
9.50%
|
|
Market Price
|
-12.95%
|
-15.05%
|
-12.95%
|
-20.59%
|
-2.69%
|
-2.45%
|
7.75%
|
8.50%
|
|
MSCI Golden Dragon Index
|
-9.98%
|
-13.58%
|
-9.98%
|
-18.55%
|
-2.15%
|
-0.82%
|
5.37%
|
—
|
Calendar Year Returns
|
2008
|
2009
|
2010
|
2011
|
2012
|
2013
|
2014
|
2015
|
|
|
NAV
|
-46.95%
|
72.83%
|
27.26%
|
-24.37%
|
12.12%
|
18.31%
|
7.82%
|
-5.50%
|
|
Market Price
|
-40.65%
|
72.19%
|
23.60%
|
-27.51%
|
20.52%
|
12.70%
|
5.29%
|
-6.38%
|
|
MSCI Golden Dragon Index
|
-49.37%
|
67.12%
|
13.60%
|
-18.35%
|
22.65%
|
7.25%
|
8.06%
|
-7.12%
|
Past performance is not a guide to future returns.
|
*
|
Annualized for periods greater than one year.
|
Source: State Street Bank and Trust Company. Source for index data: MSCI as at January 31, 2016. Investment returns are historical and do not guarantee future results. Investment returns reflect changes in net asset value and market price per share during each period and assumes that dividends and capital gains distributions, if any, were reinvested. The net asset value (NAV) percentages are not an indication of the performance of a shareholder’s investment in the Fund, which is based on market price. NAV performance includes the deduction of management fees and other expenses. Market price performance does not include the deduction of brokerage commissions and other expenses of trading shares and would be lower had such commissions and expenses been deducted. It is not possible to invest directly in an index.
Premium/Discount
Sector Allocation
|
Fund
|
Benchmark1
|
|
|
Information Technology
|
29.89%
|
27.36%
|
|
Financials
|
25.14%
|
36.52%
|
|
Industrials
|
14.47%
|
6.99%
|
|
Consumer Discretionary
|
13.11%
|
6.43%
|
|
Telecom Services
|
4.46%
|
7.10%
|
|
Consumer Staples
|
3.86%
|
2.62%
|
|
Health Care
|
3.58%
|
1.19%
|
|
Energy
|
1.42%
|
3.78%
|
|
Materials
|
0.31%
|
3.00%
|
|
Utilities
|
0.00%
|
5.01%
|
|
Other assets & liabilities
|
3.75%
|
0.00%
|
Source: IDS GmbH - Analysis and Reporting Services, a subsidiary of Allianz SE.
Country Allocation
|
Fund
|
Benchmark1
|
|
|
China
|
75.56%
|
74.22%
|
|
Hong Kong Red Chips
|
24.90%
|
11.72%
|
|
Hong Kong ‘H’ shares
|
15.06%
|
23.13%
|
|
Equity linked securities (‘A’ shares)
|
3.63%
|
0.00%
|
|
China ‘A’ & ‘B’ shares
|
0.00%
|
0.22%
|
|
Other Hong Kong securities
|
31.97%
|
33.08%
|
|
Others
|
0.00%
|
6.07%
|
|
Taiwan
|
20.67%
|
25.78%
|
|
Other assets & liabilities
|
3.77%
|
0.00%
|
Top 10 Holdings
|
TAIWAN SEMIC CO LTD (Taiwan)
|
7.88%
|
|
PING AN INSURANCE (China)
|
5.92%
|
|
TENCENT HOLDINGS LTD (China)
|
5.81%
|
|
CHINA MERCHANTS BANK CO LTD (China)
|
4.87%
|
|
CHINA MOBILE LTD (China)
|
4.48%
|
|
DIGITAL CHINA HOLDINGS LTD (China)
|
3.99%
|
|
HONG KONG EXCHANGES AND CLEARING LTD (H.K.)
|
3.80%
|
|
QINGLING MOTORS CO LTD (China)
|
3.29%
|
|
CHINA EVERBRIGHT INTL (China)
|
3.15%
|
|
SUN HUNG KAI PROPERTIES LTD (H.K.)
|
3.04%
|
Portfolio Characteristics
|
Fund
|
Benchmark1
|
|
|
P/E Ratio
|
12.13
|
10.58
|
|
P/B Ratio
|
1.50
|
1.20
|
|
Issues in Portfolio
|
41
|
288
|
|
Foreign Holdings (%)
|
96.25
|
100.00
|
|
Other assets & liabilities (%)
|
3.75
|
0.00
|
|
Yield (%)
|
3.28
|
3.59
|
1. MSCI Golden Dragon Index.
The China Fund, Inc.
Distribution History (10 Year)
|
Declaration Date
|
Ex-dividend Date
|
Record Date
|
Payable Date
|
Distribution/
Share |
Income
|
Long-term
Capital Gain |
Short-term
Capital Gain |
|
12/8/06
|
12/19/06
|
12/21/06
|
12/29/06
|
$4.01170
|
$0.29960
|
$2.73090
|
$0.98120
|
|
12/7/07
|
12/19/07
|
12/21/07
|
1/25/08
|
$12.12000
|
$0.28000
|
$9.00000
|
$2.84000
|
|
12/8/08
|
12/22/08
|
12/24/08
|
1/23/09
|
$5.81740
|
$0.48130
|
$5.33610
|
—
|
|
12/9/09
|
12/22/09
|
12/24/09
|
12/29/09
|
$0.25570
|
$0.25570
|
—
|
—
|
|
12/8/10
|
12/21/10
|
12/24/10
|
12/29/10
|
$2.27420
|
$0.37460
|
$1.89960
|
—
|
|
12/8/11
|
12/21/11
|
12/23/11
|
12/29/11
|
$2.99640
|
$0.17420
|
$2.82220
|
—
|
|
12/10/12
|
12/20/12
|
12/24/12
|
12/28/12
|
$3.25170
|
$0.34730
|
$2.90440
|
—
|
|
12/13/13
|
12/19/13
|
12/23/13
|
12/27/13
|
$3.31400
|
$0.43870
|
$2.87530
|
—
|
|
12/8/14
|
12/18/14
|
12/22/14
|
1/5/15
|
$3.76510
|
$0.29820
|
$3.46690
|
—
|
|
12/16/15
|
12/23/15
|
12/28/15
|
1/6/16
|
$1.49580
|
$0.21330
|
$0.84620
|
$0.43630
|
Distribution/Share includes Income, Long-term Capital gains and Short-term Capital gains.
The China Fund NAV Performance of $10,000 since inception
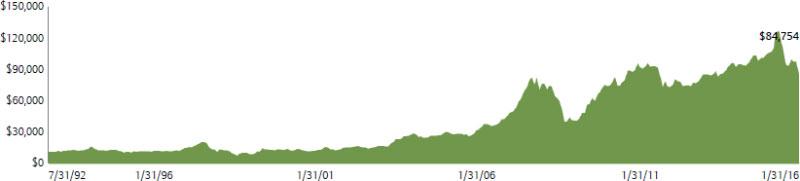
Past performance is not a guide to future returns.
Index Description
MSCI Golden Dragon Index
The MSCI Golden Dragon Index captures the equity market performance of large and mid cap China securities (H shares, B shares, Red-Chips and P-Chips) and non-domestic China securities listed in Hong Kong and Taiwan.
It is not possible to invest directly in an index.
The China Fund, Inc.
|
Portfolio in Full
|
|||||
|
Sector
|
Company
(exchange ticker) |
Market Price
|
Holding
|
Value US$
|
% of
net assets |
|
Information Technology
|
29.92
|
||||
|
TAIWAN SEMICONDUCTOR MANUFACTURING CO LTD
|
2330
|
143.00
|
4,461,000
|
19,135,298
|
7.88
|
|
TENCENT HOLDINGS LTD
|
700
|
144.90
|
757,500
|
14,093,068
|
5.81
|
|
DIGITAL CHINA HOLDINGS LTD
|
861
|
8.03
|
9,391,000
|
9,682,376
|
3.99
|
|
DELTA ELECTRONICS INC
|
2308
|
139.50
|
1,680,359
|
7,031,423
|
2.90
|
|
ADVANTECH CO LTD
|
2395
|
198.50
|
798,841
|
4,756,504
|
1.96
|
|
SEMICONDUCTOR MANUFACTURING INTERNATIONAL CORP
|
981
|
0.68
|
47,347,000
|
4,133,861
|
1.70
|
|
LARGAN PRECISION CO LTD
|
3008
|
2,375.00
|
41,000
|
2,920,885
|
1.20
|
|
BAIDU INC
|
BIDU
|
163.27
|
15,821
|
2,583,095
|
1.06
|
|
CATCHER TECHNOLOGY CO LTD
|
2474
|
244.50
|
304,000
|
2,229,561
|
0.92
|
|
ALIBABA GROUP HOLDING LTD
|
BABA
|
67.03
|
33,166
|
2,223,117
|
0.92
|
|
HERMES MICROVISION INC
|
3658
|
806.00
|
91,000
|
2,200,105
|
0.91
|
|
GOLDPAC GROUP LTD
|
3315
|
2.31
|
5,521,000
|
1,637,511
|
0.67
|
|
Financials
|
25.15
|
||||
|
PING AN INSURANCE GROUP CO OF CHINA LTD
|
2318
|
35.05
|
3,193,500
|
14,371,744
|
5.92
|
|
CHINA MERCHANTS BANK CO LTD
|
3968
|
14.92
|
6,170,000
|
11,819,756
|
4.87
|
|
HONG KONG EXCHANGES AND CLEARING LTD
|
388
|
170.90
|
420,600
|
9,229,239
|
3.80
|
|
SUN HUNG KAI PROPERTIES LTD
|
16
|
83.55
|
688,000
|
7,380,562
|
3.04
|
|
CHINA OVERSEAS LAND & INVESTMENT LTD
|
688
|
22.45
|
2,334,000
|
6,727,779
|
2.77
|
|
FUBON FINANCIAL HOLDING CO LTD
|
2881
|
36.45
|
4,270,000
|
4,668,661
|
1.92
|
|
CATHAY FINANCIAL HOLDING CO LTD
|
2882
|
36.10
|
3,462,000
|
3,748,877
|
1.54
|
|
HONGKONG LAND HOLDINGS LTD
|
H78
|
6.27
|
497,000
|
3,116,190
|
1.28
|
|
Industrials
|
14.48
|
||||
|
CHINA EVERBRIGHT INTERNATIONAL LTD
|
257
|
8.20
|
7,256,000
|
7,639,513
|
3.15
|
|
ZHUZHOU CSR TIMES ELECTRIC CO LTD
|
3898
|
39.65
|
1,392,500
|
7,089,130
|
2.92
|
|
BEIJING ENTERPRISES HOLDINGS LTD
|
392
|
38.90
|
1,281,000
|
6,398,133
|
2.64
|
|
CK HUTCHISON HOLDINGS LTD
|
1
|
96.50
|
457,500
|
5,668,563
|
2.34
|
|
CN STATE CONSTRUCTION INTERNATIONAL HOLDINGS LTD
|
3311
|
12.42
|
2,110,000
|
3,364,795
|
1.39
|
|
ZHENGZHOU YUTONG BUS CO A
|
600066
|
18.68
|
910,530
|
2,585,380
|
1.07
|
|
QINGDAO PORT INTERNATIONAL CO LTD
|
6198
|
2.85
|
6,596,000
|
2,413,682
|
0.99
|
|
Consumer Discretionary
|
13.12
|
||||
|
QINGLING MOTORS CO LTD
|
1122
|
2.15
|
28,960,000
|
7,994,505
|
3.29
|
|
LI & FUNG LTD
|
494
|
4.44
|
9,798,000
|
5,585,666
|
2.30
|
|
SANDS CHINA LTD
|
1928
|
26.75
|
1,452,400
|
4,988,438
|
2.05
|
|
CITIGROUP GLOBAL MARKETS HOLD
(exch. for CHINA CYTS TOURS HOLDIN)
|
N/A |
2.94
|
1,635,575
|
4,808,591
|
1.98
|
|
MERIDA INDUSTRY CO LTD
|
9914
|
146.50
|
805,000
|
3,537,533
|
1.46
|
|
CLSA GLOBAL MARKETS PTE LTD
(exch. for CHONG QING CHANGAN AUTO)
|
N/A |
2.25
|
739,970
|
1,664,193
|
0.69
|
|
CITIGROUP GLOBAL MARKETS HOLD
(exch. for CHONG QING CHANGAN AUTO)
|
N/A |
2.25
|
558,897
|
1,257,518
|
0.52
|
|
HSBC BANK PLC
(exch. for CHONG QING CHANGAN AUTO)
|
N/A
|
2.24
|
487,000
|
1,092,828
|
0.45
|
|
ZHONGSHENG GROUP HOLDINGS LTD
|
881
|
3.91
|
1,844,500
|
925,998
|
0.38
|
|
Telecom Services
|
4.48
|
||||
|
CHINA MOBILE LTD
|
941
|
86.00
|
984,000
|
10,865,459
|
4.48
|
|
Consumer Staples
|
3.87
|
||||
|
WANT WANT CHINA HOLDINGS LTD
|
151
|
5.09
|
9,531,000
|
6,228,892
|
2.57
|
|
HENGAN INTERNATIONAL GROUP CO LTD
|
1044
|
69.40
|
354,500
|
3,158,859
|
1.30
|
|
Health Care
|
3.57
|
||||
|
CSPC PHARMACEUTICAL GROUP LTD
|
1093
|
6.52
|
5,804,000
|
4,858,806
|
2.00
|
The China Fund, Inc.
|
Portfolio in Full
|
|||||
|
Sector
|
Company
(exchange ticker) |
Market Price
|
Holding
|
Value US$
|
% of
net assets |
|
3SBIO INC
|
1530
|
9.32
|
3,175,500
|
3,799,991
|
1.57
|
|
Energy
|
1.43
|
||||
|
CNOOC LTD
|
883
|
7.91
|
3,411,000
|
3,464,278
|
1.43
|
|
Materials
|
0.31
|
||||
|
TIANGONG INTERNATIONAL CO LTD
|
826
|
0.52
|
11,240,000
|
750,454
|
0.31
|
Source: State Street Bank and Trust Company, IDS GmbH - Analysis and Reporting Services, a subsidiary of Allianz SE.
Important Information:
Holdings are subject to change daily. The Fund seeks to achieve its objective through investment in the equity securities of companies and other entities with significant assets, investments, production activities, trading or other business interests in China or which derive a significant part of their revenue from China. Investing in non-U.S. securities entails additional risks, including political and economic risk and the risk of currency fluctuations, as well as lower liquidity. These risks, which can result in greater price volatility, will generally be enhanced in less diversified funds that concentrate investments in a particular geographic region.
The information contained herein has been obtained from sources believed to be reliable but Allianz Global Investors U.S. LLC and its affiliates do not warrant the information to be accurate, complete or reliable. The opinions expressed herein are subject to change at any time and without notice. Past performance is not indicative of future results. This material is not intended as an offer or solicitation for the purchase or sale of any financial instrument. Investors should consider the investment objectives, risks, charges and expenses of any mutual fund carefully before investing. This and other information is contained in the fund's annual and semiannual reports, proxy statement and other fund information, which may be obtained by contacting your financial advisor or visiting the fund's website at www.chinafundinc.com. This information is unaudited and is intended for informational purposes only. It is presented only to provide information on the Fund's holdings, performance and strategies. The Fund is a closed-end exchange traded management investment company. This material is presented only to provide information and is not intended for trading purposes. Closed-end funds, unlike open-end funds, are not continuously offered. After the initial public offering by a closed-end fund, its shares can be purchased and sold on the open market through a stock exchange, where shares may trade at a premium or a discount. The market price of holdings is subject to change daily.
P/E is a ratio of security price to earnings per share. Typically, an undervalued security is characterized by a low P/E ratio, while an overvalued security is characterized by a high P/E ratio. P/B is a ratio of the current stock price to the book value. This is used to identify undervalued stocks. Dividend yield is the annual percentage of return earned by an investor on a common or preferred stock. The average dividend yield is the dividend rate divided by current share price.
©2016 Allianz Global Investors Distributors LLC.
| Investment Products: Not FDIC Insured | May Lose Value | Not Bank Guaranteed |
FS-CHN-0116
|