Attached files
| file | filename |
|---|---|
| EX-21.1 - EX-21.1 - CAVIUM, INC. | cavm-ex211_9.htm |
| EX-32.1 - EX-32.1 - CAVIUM, INC. | cavm-ex321_6.htm |
| EX-31.2 - EX-31.2 - CAVIUM, INC. | cavm-ex312_7.htm |
| EX-23.1 - EX-23.1 - CAVIUM, INC. | cavm-ex231_8.htm |
| EX-31.1 - EX-31.1 - CAVIUM, INC. | cavm-ex311_10.htm |
UNITED STATES
SECURITIES AND EXCHANGE COMMISSION
Washington, D.C. 20549
FORM 10-K
(Mark One)
|
x |
ANNUAL REPORT PURSUANT TO SECTION 13 OR 15(d) OF THE SECURITIES EXCHANGE ACT OF 1934 |
For the year ended December 31, 2015
OR
|
¨ |
TRANSITION REPORT PURSUANT TO SECTION 13 OR 15 (d) OF THE SECURITIES EXCHANGE ACT OF 1934 |
For the transition period from to
Commission file number: 001-33435
CAVIUM, INC.
(Exact name of registrant as specified in its charter)
|
Delaware |
|
77-0558625 |
|
(State or other jurisdiction of incorporation or organization) |
|
(I.R.S. employer identification no.) |
2315 N. First Street
San Jose, CA 95131
(408) 943-7100
(Address of principal executive offices)
Securities registered pursuant to Section 12(b) of the Act:
|
Title of Each Class |
|
Name of Each Exchange on Which Registered |
|
Common Stock, $0.001 par value |
|
The NASDAQ Stock Market LLC |
Securities registered pursuant to Section 12(g) of the Act:
None
Indicate by check mark if the registrant is a well-known seasoned issuer, as defined in Rule 405 of the Securities Act. YES x NO ¨
Indicate by check mark if the registrant is not required to file reports pursuant to Section 13 or Section 15(d) of the Act. YES ¨ NO x
Indicate by check mark whether the registrant (1) has filed all reports required to be filed by Section 13 or 15(d) of the Securities Exchange Act of 1934 during the preceding 12 months (or for such shorter period that the registrant was required to file such reports), and (2) has been subject to such filing requirements for the past 90 days. YES x NO ¨
Indicate by check mark whether the registrant has submitted electronically and posted on its corporate Web site, if any, every Interactive Data File required to be submitted and posted pursuant to Rule 405 of Regulation S-T (§ 232.405 of this chapter) during the preceding 12 months (or for such shorter period that the registrant was required to submit and post such files). YES x NO ¨
Indicate by check mark if disclosure of delinquent filers pursuant to Item 405 of Regulation S-K is not contained herein and will not be contained, to the best of registrant’s knowledge, in definitive proxy or information statements incorporated by reference in Part III of this Form 10-K or any amendment to this Form 10-K. x
Indicate by check mark whether the registrant is a large accelerated filer, an accelerated filer, a non-accelerated filer, or a smaller reporting company. See the definitions of “large accelerated filer,” “accelerated filer” and “smaller reporting company” in Rule 12b-2 of the Exchange Act. (Check one):
|
Large accelerated filer x |
|
|
Accelerated filer |
¨ |
|
|
Non-accelerated filer |
¨ |
|
|
Smaller reporting company |
¨ |
(Do not check if a smaller reporting company)
Indicate by check mark whether the registrant is a shell company (as defined in Rule 12b-2 of the Exchange Act). YES ¨ NO x
As of June 30, 2015, the last business day of the registrant’s most recently completed second fiscal quarter, the aggregate market value of the voting stock held by non-affiliates was approximately $3.7 billion, based on the number of shares held by non-affiliates of the registrant, and based on the reported last sale price of common stock on The NASDAQ Global Select Market for such date. Excludes an aggregate of 1,347,027 shares of common stock held by officers and directors as of June 30, 2015. Exclusion of shares held by any of these persons should not be construed to indicate that such person possesses the power, direct or indirect, to direct or cause the direction of the management or policies of the registrant, or that such person is controlled by or under common control with the registrant.
Number of shares of common stock outstanding as of February 16, 2016: 57,299,071
Documents Incorporated by Reference: Portions of the Registrant’s definitive Proxy Statement for its 2016 Annual Meeting of Stockholders to be filed with the Securities and Exchange Commission not later than 120 days after the end of the fiscal year covered by this form 10-K are incorporated by reference in Part III of this Form 10-K.
ANNUAL REPORT ON FORM 10-K
FOR THE YEAR ENDED DECEMBER 31, 2015
TABLE OF CONTENTS
|
|
|
|
|
Page |
|
Item 1. |
|
|
3 |
|
|
Item 1A. |
|
|
10 |
|
|
Item 1B. |
|
|
26 |
|
|
Item 2. |
|
|
26 |
|
|
Item 3. |
|
|
26 |
|
|
Item 4. |
|
|
26 |
|
|
|
|
|
||
|
Item 5. |
|
|
27 |
|
|
Item 6. |
|
|
28 |
|
|
Item 7. |
|
Management’s Discussion and Analysis of Financial Condition and Results of Operations |
|
29 |
|
Item 7A. |
|
|
43 |
|
|
Item 8. |
|
|
44 |
|
|
Item 9. |
|
Changes in and Disagreements with Accountants on Accounting and Financial Disclosure |
|
71 |
|
Item 9A. |
|
|
71 |
|
|
Item 9B. |
|
|
72 |
|
|
|
|
|
||
|
Item 10. |
|
|
72 |
|
|
Item 11. |
|
|
73 |
|
|
Item 12. |
|
Securities Ownership of Certain Beneficial Owners and Management and Related Stockholder Matters |
|
73 |
|
Item 13. |
|
Certain Relationships and Related Transactions, and Director Independence |
|
73 |
|
Item 14. |
|
|
73 |
|
|
|
|
|
||
|
Item 15. |
|
|
73 |
|
2
The information in this Annual Report on Form 10-K contains forward-looking statements within the meaning of Section 27A of the Securities Act of 1933, as amended (“Securities Act”), and Section 21E of the Securities Exchange Act of 1934, as amended (“Exchange Act”), which are subject to the “safe harbor” created by those sections. Such statements are based upon our management’s beliefs and assumptions and on information currently available to our management. Any statements contained herein that are not statements of historical facts may be deemed to be forward-looking statements. For example, words such as “may,” “will,” “should,” “could,” “would,” “estimates,” “predicts,” “potential,” “continue,” “strategy,” “beliefs,” “anticipates,” “plans,” “expects,” “intends” and variations of such words and similar expressions are intended to identify forward-looking statements. These statements involve known and unknown risks, uncertainties and other factors, which may cause our actual results, performance, time frames or achievements to be materially different from any future results, performance, time frames or achievements expressed or implied by the forward-looking statements. These risks, uncertainties and other factors in this Annual Report on Form 10-K are discussed in greater detail under the heading “Risk Factors.” Given these risks, uncertainties and other factors, you should not place undue reliance on these forward-looking statements. These forward-looking statements represent our estimates and assumptions only as of the date of this filing. You should read this Annual Report on Form 10-K completely and with the understanding that our actual future results may be materially different from what we expect. We hereby qualify our forward-looking statements by these cautionary statements. Except as required by law, we assume no obligation to update these forward-looking statements publicly, or to update the reasons actual results could differ materially from those anticipated in these forward-looking statements, even if new information becomes available in the future.
Overview
We are a provider of highly integrated semiconductor processors that enable intelligent processing for wired and wireless networking, communications, storage, cloud, wireless, security, video and connected home and office applications. A range of our products also include a rich suite of embedded security protocols that enable unified threat management, or UTM, secure connectivity, network perimeter protection, and deep packet inspection, or DPI. We sell our products to providers of networking equipment that sell into the enterprise, datacenter, service provider, and broadband and consumer markets. In the enterprise market, our products are used in routers, switches, wireless local area networks, or WLAN, and UTM. In the datacenter market, our products are used in servers and server load balancers. In the service provider market in wired infrastructure our products are used in edge routers, cable modem termination system head-ends, and media gateways, and in wireless infrastructure in 3G/4G/5G base stations, radio network controllers, small cell, and evolved packet core nodes. In the broadband and consumer market our products are used in home gateways, wireless high-definition multimedia interface, or HDMI, WLAN, small office/home office, and UTM. Our products are systems on a chip, or SoCs, which incorporate single or multiple processor cores, a highly integrated architecture and customizable software that is based on a broad range of standard operating systems. We focus our resources on the design, sales and marketing of our products, and outsource the manufacturing of our products.
We have a broad portfolio of multi-core processors to deliver integrated and optimized hardware and software embedded solutions to the market. Our software and service revenue is primarily from the sale of software subscriptions of embedded Linux operating system, related development tools, application software stacks, support and professional services.
Industry Background
Traffic on the Internet, wireless networks and enterprise networks is rapidly increasing due to trends that include greater adoption of multimedia, video, smart-phones, internet protocol (IP) television (TV) and rich, interactive internet applications, voice over IP, or VoIP, video over broadband, file sharing, greater use of web-based cloud services and the proliferation of stored content accessed through networks. Enterprises, service providers and consumers are demanding networking and electronic equipment that can take advantage of these trends, and address the significant market opportunities and life-style changes that these new applications provide. As a result, there is growing pressure on providers of networking equipment, wireless, storage and electronic equipment to rapidly introduce new products with enhanced functionality while reducing their design and manufacturing costs. Providers of networking, wireless, storage and electronic equipment are increasingly seeking advanced processing solutions from third-party vendors to access the best available technology and reduce development costs. Internet delivery of video to the TV and mobile devices followed by cost effective, high-definition interactive video communications is expected to fuel the future growth of video traffic over the Internet.
3
The processing needs of advanced networking systems can be described in the context of the Open System Interconnection Model which divides network activities, equipment, and protocols into seven layers. According to this model, Layers 1 through 3 are the physical, data link and network layers, respectively, which provide the protocols to ensure the transmission of data between the source and destination regardless of the content and type of data processed. Traditionally, network infrastructure products have focused on Layer 1 through 3 products that route and switch data traffic based solely on the source and destination address contained in the packet header. Processors that provide Layer 1 through 3 solutions are widely available from many vendors. Layers 4 through 7 are the transport, session, presentation and application layers, which provide the protocols to enable the reliable end-to-end communication of application information. Intelligent processing generally takes place in Layers 4 through 7. To provide this intelligence, advanced networking systems must include processors that enable extensive inspection of the application and data content, or deep packet inspection, and make intelligent switching and routing decisions based upon that inspection. To address customer demands, providers of networking equipment must offer products that include functionality such as intelligent routing or switching of network traffic prioritized by application and data content, and security services. Processors required for Layer 4 through 7 processing are significantly more complex than processors that provide only Layer 1 through 3 solutions.
One of the major trends driving information technology spending today is the transformation of the data center to cloud computing, also known as “on-demand computing”. Cloud computing is a kind of internet-based computing, where shared resources, data and information are provided to computers and other devices on-demand. It is a model for enabling ubiquitous, on-demand access to a shared pool of configurable computing resources. Cloud computing and storage solutions provide users and enterprises with various capabilities to store and process their data in third-party data centers. Key trends driving this transformation includes the adoption of Software as a Service, or SaaS, Platform as a Service, or PaaS, and Infrastructure as a Service, or IaaS, enabled by software defined data center with virtualized on demand compute, software defined networking, or SDN, and software defined storage. The current data center market has generally been serviced with processors that are designed with “one size fits all” approach and are based on a legacy control plane architecture where many of the networking, storage, virtualization and security functions are implemented in software or additional chips leading to huge system and rack level inefficiencies specific to performance, latency, footprint, power and cost.
Products
OCTEON®, OCTEON Fusion-MTM, OCTEON XL®, LiquidIO®, LiquidSecurity TM, NITROX®, NEURON SearchTM, ThunderX®, XpliantTM and XPATM are trademarks or registered trademarks of Cavium, Inc.
We offer highly integrated semiconductors that provide single or multiple cores of processors, along with intelligent Layer 2 through 7 processing for enterprise network, data center, broadband and consumer, and access and service provider markets. All of our products are compatible with standards-based operating systems and general purpose software to enable ease of programming, and are supported by our ecosystem partners. Our MontaVista Software products offer commercial grade embedded Linux operating systems, development tools, application software stacks, support and services. Our software embedded Linux products provide a high quality operating system and productivity tools across a wide range of embedded processors that are sold by us.
Our OCTEON, OCTEON Plus, OCTEON II and OCTEON III multi-core MIPS64 processor families provide integrated Layer 4 through 7 data and security processing (with additional capabilities at Layers 2 and 3) at line speeds from 100Mbps to 100Gbps. These software-compatible processors, with 1 to 48 cnMIPS cores on a single chip, integrate next-generation networking I/Os along with advanced security, storage, and application hardware acceleration, offering programmability for the Layer 2 through Layer 7 processing requirements of intelligent networks. The OCTEON processors are targeted for use in a wide variety of original equipment manufacturer, or OEM, networking and storage equipment, including routers, switches, UTM appliances, content-aware switches, application-aware gateways, triple-play gateways, WLAN and 3G/4G/5G access and aggregation devices, storage arrays, storage networking equipment, servers, and intelligent network interface controllers. The OCTEON product family provides a broad range of product lines based upon the distinct performance, feature, and cost requirements of the target equipment. All OCTEON processors are software compatible and supported by industry-standard software tool chains and operating systems. Various product options are available within each OCTEON family to suit the specific needs of each individual application.
Our NITROX processor family offers stand-alone security processors that provide the functionality required for Layer 3 to Layer 5 secure communication in a single chip. This single chip, custom-designed processors provide complete security protocol processing, encryption, authentication and compression algorithms to reduce the load on the system processor and increase total system throughput. NITROX V, which is a 144 core processor family, delivers security and compression processors for cloud computing, application delivery and wide area network optimization at up to 50 Gigabits per second data rates and up to 150,000 elliptic curve cryptography, or ECC, transactions per second.
4
The NEURON search processor family targets a wide range of high performance, Layer 2 to Layer 4 network search applications in enterprise and service provider infrastructure equipment. This product family supports both IP versions 4 to 6 rules and delivers 100 million to over 1.6 billion searches per second with low latency. The NEURON search family delivers up to four times the capacity per chip of existing 40 Megabit Ternary Content-Addressable Memories, or TCAMs, enabling the replacement of four TCAM chips with one NEURON chip.
Our OCTEON Fusion-M family of wireless baseband processors is a highly scalable product family supporting enterprise small cells, high capacity outdoor picocells all the way up to multi-sector macrocells for multiple wireless protocols. The OCTEON Fusion-M processors are single chip solutions (supporting Layer 1 to 7) that target next generation radio networks including 3GPP LTE Release 11/12. The key features include highly optimized full 64 bit MIPS processor cores, a highly efficient caching subsystem, high memory bandwidth Very Long Instruction Word, or VLIW, digital signal processing engines along with a host of hardware accelerators for the wireless modem pipeline, network processing and traffic shaping. Additionally, multiple OCTEON Fusion-M chips can be cascaded for even denser deployments or higher order multiple-input and multiple-output, or MIMO. The OCTEON Fusion-M family is designed to allow system OEM and operators to build next generation networks in both macrocell and Cloud-RAN deployments. The architecture allows the implementation of any of the popular Centralized Radio Access Network, or CRAN splits, including MAC-PHY, RLC and CPRI and working in conjunction with standard commercial off-the-shelf systems, such as Cavium’s ThunderX processor, while retaining the flexibility to evolve into the new 5G standard.
Our ThunderX processor family are highly integrated, multi-core SoC processors that incorporate highly optimized, full custom cores based on 64-bit ARMv8 instruction set architecture into SoC. ThunderX products provide a scalable family of 64-bit ARMv8 processors incorporated into a highly differentiated SoC architecture optimized for cloud and datacenter applications. The ThunderX product line includes four workload optimized families targeting cloud compute, secure compute, cloud storage/big data and networking/network functions virtualization workloads.
LiquidIO Server Adapter family is a standard server compliant half-height Peripheral Component Interconnect Express, or PCI Express, form-factor, providing a high-performance, general-purpose programmable adapter platform that enables cloud service providers to offload any functionality in the data center. This product family enables data centers to rapidly deploy high performance SDN applications for both installed and new infrastructure while enhancing server utilization, response times and network agility. The LiquidIO Server Adapter family is supported by a feature rich software development kit that allows customers and partners to develop high performance SDN applications with packet processing, tunneling, quality of service, security and metering.
The LiquidSecurity product family is a high performance hardware based transaction security solution for cloud data centers, enterprise, government organizations and ecommerce applications. It addresses the high performance security requirements for private key management and administration while also addressing elastic performance per virtual / network domain for the virtualized cloud environment. This family is available as a payment card industry adapter with complete software or as a standalone appliance providing 35,000 RSA operations/second and 50,000 key store divisible over up to 32 partitioned Federal Information Processing Standards, or FIPS, 140-2 level 3 high security modules.
Our Xpliant family of products provide high performance, high density switch silicon that targets a broad range of switching applications for the data center, cloud, service provider and enterprise markets. Xpliant Packet Architecture, or XPA, allows programing of switch packet processing elements. It enables various network switching protocols with a switch. As new protocols are required, the switch can be updated by software to add support for these new protocols, including changes to parsing, lookups, traffic scheduling, packet modification, scheduling and traffic monitoring.
Our MontaVista software products include embedded Linux operating systems, support, development tools and professional services. We offer customized professional services that help our customers build feature rich products using our processor and Linux expertise. The MontaVista Linux Carrier Grade Edition 7, or CGE 7, is a multicore resource management architecture that will allow multiple embedded technologies to run side-by-side in a virtualized environment. The MontaVista virtualization platform is based entirely on Linux and includes Linux Containers and Kernel-based Virtual Machine virtualization as a Real-Time Operating System-like Bare Metal Engine and implementation. MontaVista Software continues to implement and support CGE 7 across multiple architectures and semiconductor platforms.
Customers
We primarily sell our products to providers of networking, wireless, storage and consumer electronic equipment, either directly or through contract manufacturing organizations and distributors. By providing comprehensive systems-level products along with our ecosystem partners, we provide our customers with products that empower their next-generation networking systems more quickly and at lower cost than other alternatives.
5
We currently rely, and expect to continue to rely, on a limited number of customers for a significant portion of our net revenue. We received an aggregate of approximately 55.3%, 57.4% and 50.3% of our net revenue from our top five customers in 2015, 2014 and 2013, respectively. Cisco Systems, Inc., Nokia Solutions and Networks and Amazon.com, Inc., together accounted for 42.9% and 44.4% of our net revenue in 2015 and 2014, respectively, and Cisco Systems, Inc., accounted for 18.6% of our net revenue in 2013. No other customer accounted for more than 10% of our net revenue in 2015, 2014 and 2013. For information regarding our revenue from external customers, net loss attributable to the Company and total assets, see our Consolidated Financial Statements in Item 8 of this Annual Report.
Sales and Marketing
We currently sell our products through our direct sales and applications support organization to providers of networking equipment, original design manufacturers and contract electronics manufacturers, as well as through arrangements with distributors that fulfill third-party orders for our products.
We work directly with our customers’ system designers to create demand for our products by providing them with application-specific product information for their system design, engineering and procurement groups. Our technical marketing, sales and field application engineers actively engage potential customers during their design processes to introduce them to our product capabilities and target applications. We typically undertake a multi-month sales and development process with our customer system designers and management. If successful, this process culminates in a customer decision to use our product in their system, which we refer to as a design win. Volume production can begin from six months to three years after the design win depending on the complexity of our customer’s product and other factors. Once one of our products is incorporated into a customer’s design, it is likely to be used for the life cycle of the customer’s product. We believe this to be the case because a redesign would generally be time consuming and expensive.
Manufacturing
We use third-party foundries and assembly and test contractors to manufacture, assemble and test our semiconductor products. This outsourced manufacturing approach allows us to focus our resources on the design, sales and marketing of our products. Our foundries are responsible for procurement of the raw materials used in the production of our products. Our engineers work closely with our foundries and other contractors to increase yields, lower manufacturing costs and improve quality.
Integrated Circuit Fabrication. Our integrated circuits are fabricated using complementary metal-oxide semiconductor processes, which provide greater flexibility to engage independent foundries to manufacture our integrated circuits. By outsourcing manufacturing, we are able to avoid the cost associated with owning and operating our own manufacturing facility, which would not be feasible for a company at our stage of development. We currently outsource a substantial percentage of our integrated circuit manufacturing to Samsung Electronics, or Samsung, with the remaining manufacturing outsourced to Taiwan Semiconductor Manufacturing Company, or TSMC and GlobalFoundries. We work closely with Samsung, TSMC and GlobalFoundries to forecast on a monthly basis our manufacturing capacity requirements. Our integrated circuits are currently fabricated in several advanced, sub-micron manufacturing processes. Because finer manufacturing processes lead to enhanced performance, smaller size and lower power requirements, we continually evaluate the benefits and feasibility of migrating to smaller geometry process technology to reduce cost and improve performance.
Assembly and Test. Our products are shipped from our third-party foundries to third-party assembly and test facilities where they are assembled into finished integrated circuit packages and tested. We outsource all product packaging and substantially all testing requirements for these products to several assembly and test subcontractors, including ASE Electronics in Taiwan, Malaysia and Singapore, as well as ISE Labs, Inc., in the United States. Our products are designed to use standard packages and to be tested with widely available test equipment.
Quality Assurance. We have implemented significant quality assurance and test procedures to assure high levels of product quality for our customers. Our designs are subjected to extensive circuit simulation under extreme conditions of temperature, voltage and processing before being committed to manufacture. We have completed and have been awarded ISO 9001 certification and ISO 9001:2000 certification. In addition, all of our independent foundries and assembly and test subcontractors have been awarded ISO 9001 certification.
6
We believe that our future success depends on our ability to introduce enhancements to our existing products and to develop new products for both existing and new markets. Our research and development efforts are directed largely to the development of additional high-performance multi-core microprocessor semiconductors. We are also focused on incorporating functions currently provided by stand-alone semiconductors into our products. We have assembled a team of highly skilled semiconductor and embedded software design engineers who have strong design expertise in high performance multi-core microprocessor design, along with embedded software, security and networking expertise. Our engineering design teams are located in San Jose, California; Marlborough, Massachusetts; Beijing, China; and Hyderabad and Bangalore, India. Research and development expense was $203.8 million, $171.7 million and $134.6 million in 2015, 2014 and 2013, respectively.
Business Combinations, Investment and Divestitures
In December 2009, we acquired MontaVista Software, Inc. This acquisition complements our broad portfolio of multi-core processors to deliver integrated and optimized embedded solutions to the market.
In January 2011, we completed the acquisition of substantially all of the assets and assumed certain liabilities of Wavesat Inc. This acquisition added multicore wireless digital system processing to our embedded processor product line.
In March 2011, we completed the acquisition of substantially all of the assets and assumed certain liabilities of Celestial Semiconductor, Ltd. With the acquisition of Celestial Semiconductor, we added capabilities to enable a processor family targeted for the large and growing market of converged media, gateway and wireless display applications.
In September 2012, we completed the sale of certain consumer product assets to a third party company. The consumer product assets that were sold originated from the acquisition of Star Semiconductor Corporation in fiscal year 2008 that we further developed.
In January 2013, we completed the sale of certain assets to a third-party company. The assets that were sold originated from the acquisition of MontaVista Software, Inc. in fiscal year 2009.
In April 2015, we completed the acquisition of Xpliant, Inc. This acquisition provides high performance, high density switch silicon that targets a broad range of switching applications for the data center, cloud service provider and enterprise markets.
For more detailed discussions on these most recent business combinations and divestitures, see Note 5 of Notes to Consolidated Financial Statements in Item 8 of this Annual Report, incorporated herein by reference.
Intellectual Property
Our success depends in part upon our ability to protect our core technology and intellectual property. To accomplish this, we rely on a combination of intellectual property rights, including patents, trade secrets, copyrights and trademarks, and contractual protections.
Including patents from our acquisitions, we have been issued 120 patents in the United States and 47 patents in foreign countries and have an additional 311 patent applications pending in the United States and 219 patent applications pending in foreign countries as of December 31, 2015. The issued patents in the United States expire in the years beginning in 2018 through 2034. The issued foreign patents expire in the years beginning in 2022 through 2032. Our issued patents and pending patent applications relate to security processors, multi-core microprocessor processing and other processing concepts. We focus our patent efforts in the United States, and, when justified by cost and strategic importance, we file corresponding foreign patent applications in strategic jurisdictions within Asia and Europe. Our patent strategy is designed to provide a balance between the need for coverage in our strategic markets and the need to maintain costs at a reasonable level. We believe our issued patents and patent applications, to the extent the applications are issued, may be used defensively by us in the event of future intellectual property claims.
In addition to our own intellectual property, we also rely on third-party technologies for the development of our products. We license certain technology from Imagination Technologies, LLC (which acquired MIPS Technologies, Inc.) and ARM Holdings PLC, pursuant to license agreements wherein we were granted a non-exclusive, worldwide license to MIPS and ARM microprocessor core technologies to develop, implement and use in our products.
We obtained a United States registration for each of our marks, including C circle and design, cnMIPS, ECONA, LiquidIO, Nitrox, Octeon, Octeon XL, ThunderX, Security Everywhere, Wavesat, wirelessdisplay.com, wireless display logo and WiVu. We also have a license from Imagination Technologies, LLC to use MIPS by Imagination and certain other Imagination Technologies’ trademarks and from ARM Holdings PLC to use certain ARM trademarks.
7
In addition, we generally control access to and use of our proprietary software and other confidential information through the use of internal and external controls, including contractual protections with employees, contractors, customers and partners. We rely in part on United States and international copyright laws to protect our software. All employees and consultants are required to execute confidentiality agreements in connection with their employment and consulting relationships with us. We also require them to agree to disclose and assign to us all inventions conceived or made in connection with the employment or consulting relationship. We cannot provide any assurance that employees and consultants will abide by the confidentiality or invention assignment terms of their agreements. Despite measures taken to protect our intellectual property, unauthorized parties may copy aspects of our products or obtain and use information that we regard as proprietary.
The semiconductor industry is characterized by the existence of a large number of patents, trademarks and copyrights and by frequent litigation based on allegations of infringement or other violations of intellectual property rights. We expect that the potential for infringement claims against us may further increase as the number of products and competitors in our market increase. Litigation in this industry is often protracted and expensive. Questions of infringement in the semiconductor industry involve highly technical and subjective analyses. In addition, litigation may become necessary in the future to enforce our granted patents and other intellectual property rights, to protect our trade secrets, to determine the validity and scope of the proprietary rights of others, or to defend against claims of infringement or invalidity, and we may not prevail in any future litigation. The results of any litigation are inherently uncertain. Any successful infringement claim or litigation against us could have a significant adverse impact on our business.
We are not currently a party to any material legal proceedings related to intellectual property, which, if determined adversely to us, would individually or in the aggregate have a material adverse effect on our business, operating results, financial condition or cash flows.
Competition
We compete with numerous domestic and international semiconductor companies, many of which have greater financial and other resources with which to pursue marketing, technology development, product design, manufacturing, quality, sales and distribution of their products. Our ability to compete effectively depends on defining, designing and regularly introducing new products that anticipate the processing and integration needs of our customers’ next-generation products and applications.
In the enterprise, datacenter, service provider, and broadband and consumer markets, we consider our primary competitors to be other companies that provide processor products to one or more of our markets, including Freescale Semiconductor, Inc., which was acquired by NXP Semiconductors, Intel Corporation, Broadcom Limited, Marvell Technology Group Ltd., Applied Micro Circuits Corporation, Qualcomm Incorporated, and Advanced Micro Devices, Inc.
In the embedded commercial Linux operating system and professional services markets, we consider the primary competitors for our software products to be Wind River Systems, Inc., a subsidiary of Intel Corporation, and, to a lesser extent, Canonical Ltd. and Mentor Graphics Corporation.
Our competitors include public companies with broader product lines, a large installed base of customers and greater resources compared to us. We expect continued competition from existing suppliers as well as from potential new entrants into our markets. Our ability to compete depends on a number of factors, including our success in identifying new and emerging markets, applications and technologies and developing products for these markets; our products’ performance and cost effectiveness relative to that of our competitors’; our ability to deliver products in large volume on a timely basis at a competitive price; our success in utilizing new propriety technologies to offer products and features not previously available in the marketplace; our ability to recruit good talent, including design and application engineers; and our ability to protect our intellectual property.
Backlog
Sales of our products are generally made pursuant to purchase orders. We typically include in backlog only those customer orders for which we have accepted purchase orders and which we expect to ship within the next 12 months. Since orders constituting our current backlog are subject to changes in delivery schedules or cancellation with limited or no penalties, we believe that the amount of our backlog is not necessarily an accurate indication of our future revenues.
Geographic and Other Financial Information
For geographic financial information and net revenue by markets, see “Note 11. Segment and Geographical Information” in Item 8 of this Annual Report, which is incorporated herein by reference. For information regarding our net revenue from external customers, net loss attributable to the Company and total assets, see our Consolidated Financial Statements in Item 8 of this Annual Report.
8
For risks attendant to our foreign operations, see the risks set forth in Item 1A below, including, but not limited to, “Some of our operations and a significant portion of our customers and contract manufacturers are located outside of the United States, which subjects us to additional risks, including increased complexity and costs of managing international operations and geopolitical instability,” “We are subject to governmental export and import controls that may adversely affect our business,” and “Our failure to protect our intellectual property rights adequately could impair our ability to compete effectively or to defend ourselves from litigation, which could harm our business, financial condition and results of operations.”
Net Revenue by Reportable Segment
Our consolidated net revenue for 2015, 2014 and 2013 amounted to $412.7 million, $373.0 million and $304.0 million, respectively. We operate as one reportable segment.
Employees
As of December 31, 2015, we had 1,005 regular employees located in the United States, India and other countries in Asia and Europe, which was comprised of: 47 employees in manufacturing and direct service operations, 774 in engineering, research and development, and 184 in sales, marketing and administrative. None of our employees is represented by a labor union and we consider current employee relations to be good.
Executive Officers of the Registrant
The following sets forth certain information regarding our executive officers as of February 22, 2016:
|
Name |
|
Age |
|
Position |
|
Syed B. Ali |
|
57 |
|
President, Chief Executive Officer, Director and Chairman of the Board of Directors |
|
Arthur D. Chadwick |
|
59 |
|
Vice President of Finance and Administration and Chief Financial Officer |
|
Anil Jain |
|
59 |
|
Corporate Vice President, IC Engineering |
|
Vincent P. Pangrazio |
|
52 |
|
Senior Vice President, General Counsel and Corporate Secretary |
Syed B. Ali is one of our founders and has served as our President, Chief Executive Officer and Chairman of the Board of Directors since the inception of Cavium in 2000. From 1998 to 2000, Mr. Ali was Vice President of Marketing and Sales at Malleable Technologies, a communication chip company of which he was a founding management team member. Malleable Technologies was acquired by PMC Sierra, Inc., a communication IC company in 2000. From 1994 to 1998, Mr. Ali was an Executive Director at Samsung Electronics. Prior to that, he had various positions at Wafer Scale Integration, a division of SGS-Thompson, Tandem Computer, and American Microsystems. He received a BE (Electrical Engineering) from Osmania University, in Hyderabad, India and an MSE from the University of Michigan.
Arthur D. Chadwick has served as our Vice President of Finance and Administration and Chief Financial Officer since December 2004. Prior to joining us, from 1989 to 2004, Mr. Chadwick served as the Senior Vice President of Finance and Administration and Chief Financial Officer at Pinnacle Systems, a provider of digital video processing solutions. From 1979 through 1989, Mr. Chadwick served in various financial and management roles at American Microsystems, Austrian Microsystems, Gould Semiconductor and AMI-Philippines. Mr. Chadwick received a BS degree in Mathematics and an MBA in Finance, both from the University of Michigan.
Anil K. Jain has served as our Corporate Vice President of IC Engineering since January 2001, and is a founding management team member. Prior to joining us, from 1998 to 2000 he was at Compaq Computer, a computer manufacturer. From 1980 to 1998, Mr. Jain served at Digital Equipment Corporation, or DEC, as Senior Consulting Engineer when DEC was acquired by Compaq Computer. He received a BS degree in Electrical Engineering from Punjab Engineering College in Chandigarh, India, and an MSEE from the University of Cincinnati.
Vincent P. Pangrazio has served as our Senior Vice President and General Counsel since March 2011. He was appointed as the Corporate Secretary in 2013. Prior to joining us, from 2000 to 2011, Mr. Pangrazio was a partner in the business department at the law firm of Cooley LLP. From 1999 to 2000, Mr. Pangrazio served as Vice President and General Counsel for Women.com Networks, Inc., a network online site featuring content and services for women. From 1993 to 1999, Mr. Pangrazio was an associate in the business department at Cooley LLP. From 1985 to 1993, Mr. Pangrazio worked as an electrical engineer for the Los Angeles Department of Water and Power in the areas of power generation and distribution. Mr. Pangrazio received a BS degree in Electrical Engineering from Loyola Marymount University and received his J.D. degree from Loyola Law School.
9
We were incorporated in California in November 2000 and reincorporated in Delaware in February 2007. Our principal offices are located at 2315 N. First Street, San Jose, California 95131, and our telephone number is (408) 943-7100. Our Web site address is www.cavium.com. Information found on, or accessible through, our Web site is not a part of, and is not incorporated into, this Annual Report on Form 10-K. Unless the context requires otherwise, references in this Annual Report on Form 10-K to “the company,” “we,” “us” and “our” refer to Cavium, Inc. and its wholly-owned subsidiaries on a consolidated basis.
Available Information
We file electronically with the United States Securities and Exchange Commission, or SEC, our annual reports on Form 10-K, quarterly reports on Form 10-Q, current reports on Form 8-K, and amendments to those reports filed or furnished pursuant to Section 13(a) or 15(d) of the Securities Exchange Act of 1934. We make available on our website at http://www.cavium.com, free of charge, copies of these reports as soon as reasonably practicable after filing these reports with, or furnishing them to, the SEC.
The following risks and uncertainties may have a material adverse effect on our business, financial condition or results of operations. Investors should carefully consider the risks described below before making an investment decision. The risks described below are not the only ones we face. Additional risks not presently known to us or that we currently believe are immaterial may also significantly impair our business operations. Our business could be harmed by any of these risks. The trading price of our common stock could decline due to any of these risks, and investors may lose all or part of their investment.
Risks Related to Our Business and Industry
We have a limited history of profitability, and we may not achieve or sustain profitability in the future, on a quarterly or annual basis.
We have a history of losses during certain quarterly or annual periods since our incorporation. We incurred a net loss of $17.1 million for the year ended December 31, 2015. As of December 31, 2015, our accumulated deficit was $189.4 million. We expect to make significant expenditures related to the development of our products and expansion of our business, including research and development and sales and administrative expenses. Additionally, we may encounter unforeseen difficulties, complications, product delays and other unknown factors that may require additional expenditures. As a result of these expenditures, we may not generate sufficient revenue to achieve profitability. Our revenue growth trend in 2013, 2014 and 2015 may not be sustainable, and accordingly, we may incur losses in the future.
We expect our operating results to fluctuate, which could adversely affect the price of our common stock.
We expect our revenues and expense levels to vary in the future, making it difficult to predict our future operating results. In particular, we experience variability in demand for our products as our customers manage their product introduction dates and their inventories. Given the current global economic uncertainty, the demand for our products may be more varied and difficult to ascertain in a timely and efficient manner.
Factors that could cause our results to fluctuate include, among other things:
|
|
· |
fluctuations in demand, sales cycles, product mix and prices for our products; |
|
|
· |
the variability in lead time between the time when a customer begins to design in one of our products and the time when the customer’s end system goes into production and they begin purchasing our products; |
|
|
· |
the forecasting, scheduling, rescheduling or cancellation of orders by our customers; |
|
|
· |
the timing of our new product introductions; |
|
|
· |
our dependence on a few significant customers, which may vary the size of their orders; |
|
|
· |
our ability to retain, recruit and hire key executives, technical personnel and other employees in the positions and numbers, and with the experience and capabilities that we need; |
|
|
· |
our ability to successfully define, design and release new products in a timely manner that meet our customers’ needs; |
|
|
· |
changes in manufacturing costs, including wafer, test and assembly costs, mask costs, manufacturing yields and product quality and reliability; |
|
|
· |
the timing and availability of adequate manufacturing capacity from our manufacturing suppliers; |
10
|
|
· |
any mergers, acquisitions or divestitures of assets undertaken by us; |
|
|
· |
future accounting pronouncements and changes in accounting policies; |
|
|
· |
the timing of recognition of non-recurring engineering credits. From time to time, we enter into research and development collaboration agreements with certain customers. Subject to the terms of the agreements, the consideration is recognized as a credit to our research and development expenses. The timing of the recognition of such credit may be subject to certain milestones specified in the agreement. |
|
|
· |
volatility in our stock price, which may lead to higher stock compensation expenses; |
|
|
· |
general economic and political conditions in the countries in which we operate or our products are sold or used; |
|
|
· |
costs associated with litigation, especially related to intellectual property; and |
|
|
· |
productivity and growth of our sales and marketing force. |
Unfavorable changes in any of the above factors, most of which are beyond our control, could significantly harm our business and results of operations, and therefore our stock price.
We may have difficulty accurately predicting our future revenues for the purpose of appropriately budgeting and adjusting our expenses, which could adversely affect our operating results.
The dynamic and rapidly evolving market in which we sell our products, our dependence on a limited number of customers, as well as numerous other factors beyond our control, including general market conditions, impede our ability to forecast quarterly and annual revenues accurately. As a result, we could experience budgeting and cash flow management problems, unexpected fluctuations in our results of operations and other difficulties, any of which could make it difficult for us to attain and maintain profitability and could increase the volatility of the market price of our common stock.
We face intense competition and expect competition to increase in the future, which could reduce our revenues, gross margin and/or customer base.
The market for our products is highly competitive and we expect competition to intensify in the future. This competition could make it more difficult for us to sell our products, and result in increased pricing pressure, reduced profit margins, increased sales and marketing expenses and failure to increase, or the loss of, market share or expected market share, any of which would likely seriously harm our business, operating results and financial condition. For instance, semiconductor products have a history of declining prices as the cost of production is reduced. However, if market prices decrease faster than product costs, gross and operating margins can be adversely affected. In the enterprise, datacenter, service provider, and broadband and consumer markets, we consider our primary competitors to be other companies that provide processor products to one or more of our markets, including Freescale Semiconductor, Inc., which was acquired by NXP Semiconductor, Intel Corporation, Broadcom Limited, Marvell Technology Group Ltd., Applied Micro Circuits Corporation, Qualcomm Incorporated, and Advanced Micro Devices, Inc.
A few of our current competitors operate their own fabrication facilities and have, and some of our potential competitors could have, longer operating histories, greater name recognition, larger customer bases and significantly greater financial, technical, sales, marketing and other resources than we have. Potential customers may prefer to purchase from their existing suppliers rather than a new supplier regardless of product performance or features.
In the embedded commercial Linux operating system and professional services markets, we consider the primary competitors for our software products to be Wind River Systems, Inc., a subsidiary of Intel Corporation, and, to a lesser extent, Canonical Ltd. and Mentor Graphics Corporation.
We expect increased competition from other established and emerging companies both domestically and internationally. Our current and potential competitors may also establish cooperative relationships among themselves or with third parties. If so, new competitors or alliances that include our competitors may emerge that could acquire significant market share. In the future, further development by our competitors, and development by our potential competitors, could cause our products to become obsolete. Our ability to compete depends on a number of factors, including:
|
|
· |
our success in identifying new and emerging markets, applications and technologies and developing products for these markets; |
|
|
· |
our products’ performance and cost effectiveness relative to that of our competitors’ products; |
|
|
· |
our ability to deliver products in large volume on a timely basis at a competitive price; |
11
|
|
· |
our success in utilizing new and proprietary technologies to offer products and features previously not available in the marketplace; |
|
|
· |
our ability to recruit design and application engineers and sales and marketing personnel; and |
|
|
· |
our ability to protect our intellectual property. |
In addition, we cannot assure you that existing customers or potential customers will not develop their own products, purchase competitive products or acquire companies that use alternative methods to enable networking, communication or security applications to facilitate network-aware processing in their systems. Any of these competitive threats, alone or in combination with others, could seriously harm our business, operating results and financial condition.
Our customers may cancel their orders, change production quantities or delay production, and if we fail to forecast demand for our products accurately, we may incur product shortages, delays in product shipments or excess or insufficient product inventory.
We generally do not obtain firm, long-term purchase commitments from our customers. Because production lead times often exceed the amount of time required to fulfill orders, we often must build in advance of orders, relying on an imperfect demand forecast to project volumes and product mix.
Our demand forecast accuracy can be adversely affected by a number of factors, including inaccurate forecasting by our customers, changes in market conditions, adverse changes in our product order mix and demand for our customers’ products. Even after an order is received, our customers may cancel these orders or request a decrease in production quantities. Any such cancellation or decrease subjects us to a number of risks, most notably that our projected sales will not materialize on schedule or at all, leading to unanticipated revenue shortfalls and excess or obsolete inventory which we may be unable to sell to other customers. Alternatively, if we project customer requirements to be less than the demand that materializes, we may not build enough products, which could lead to delays in product shipments and lost sales opportunities in the near term, as well as force our customers to identify alternative sources, which could affect our ongoing relationships with these customers. In the past, we have had customers dramatically increase their requested production quantities with little or no advance notice. Either underestimating or overestimating demand could lead to insufficient, excess or obsolete inventory, which could harm our operating results, cash flow and financial condition, as well as our relationships with our customers.
We receive a substantial portion of our revenues from a limited number of customers, and the loss of, or a significant reduction in, orders from one or a few of our major customers would adversely affect our operations and financial condition.
We receive a substantial portion of our revenues from a limited number of customers. We received an aggregate of approximately 55.3%, 57.4% and 50.3% of our net revenue from our top five customers in 2015, 2014 and 2013, respectively. Three customers together accounted for 42.9% and 44.4% of our net revenue in 2015 and 2014, respectively, and one customer accounted for 18.6% of our net revenue in 2013. No other customer accounted for more than 10% of our net revenue in 2015, 2014 and 2013. We anticipate that we will continue to be dependent on a limited number of customers for a significant portion of our revenues in the immediate future and that the portion of our revenues attributable to some of these customers may increase in the future. However, we may not be able to maintain or increase sales to some of our top customers for a variety of reasons, including the following:
|
|
· |
our agreements with our customers do not require them to purchase a minimum quantity of our products; |
|
|
· |
some of our customers can stop incorporating our products into their own products with limited notice to us and suffer little or no penalty; and |
|
|
· |
many of our customers have pre-existing or concurrent relationships with our current or potential competitors that may affect the customers’ decisions to purchase our products. |
In the past, we have relied in significant part on our relationships with customers that are technology leaders in our target markets. We intend to continue expanding these relationships and forming new relationships but we cannot assure you that we will be able to do so. These relationships often require us to develop new products that may involve significant technological challenges. Our customers frequently place considerable pressure on us to meet their tight development schedules. Accordingly, we may need to devote a substantial amount of our resources to our relationships, which could detract from or delay our completion of other important development projects. Delays in development could impair our relationships with our other large customers and negatively impact sales of the products under development. Moreover, it is possible that our customers may develop their own product or adopt a competitor’s solution for products that they currently buy from us. If that happens, our sales would decline and our business, financial condition and results of operations could be materially and adversely affected.
12
In addition, our relationships with some customers may also deter other potential customers who compete with these customers from buying our products. To attract new customers or retain existing customers, we may offer some customers favorable prices on our products. In that event, our average selling prices and gross margins would decline. The loss of a key customer, a reduction in sales to any key customer or our inability to attract new significant customers could seriously impact our revenue and materially and adversely affect our business, financial condition, and results of operations.
We may be unsuccessful in developing and selling new products or in penetrating new markets.
We operate in a dynamic environment characterized by rapidly changing technologies and industry standards and technological obsolescence. Our competitiveness and future success depend on our ability to design, develop, manufacture, assemble, test, market and support new products and enhancements on a timely and cost effective basis. A fundamental shift in technologies in any of our product markets could harm our competitive position within these markets. Our failure to anticipate these shifts, to develop new technologies or to react to changes in existing technologies could materially delay our development of new products, which could result in product obsolescence, decreased revenues and a loss of design wins to our competitors. The success of a new product depends on accurate forecasts of long-term market demand and future technological developments, as well as a variety of specific implementation factors, including:
|
|
· |
timely and efficient completion of process design and transfer to manufacturing, assembly and test processes; |
|
|
· |
the quality, performance and reliability of the product; and |
|
|
· |
effective marketing, sales and service. |
If we fail to introduce new products that meet the demand of our customers or penetrate new markets in which we expend significant resources, our revenues will likely decrease over time and our financial condition could suffer. Additionally, if we concentrate resources on a new market that does not prove profitable or sustainable, our financial condition could decline.
The average selling prices of products in our markets have historically decreased over time and will likely do so in the future, which could harm our revenues and gross profits.
Average selling prices of semiconductor products in the markets we serve have historically decreased over time. Our gross profits and financial results will suffer if we are unable to offset any reductions in our average selling prices by reducing our costs, developing new or enhanced products on a timely basis with higher selling prices or gross profits, or increasing our sales volumes. Additionally, because we do not operate our own manufacturing, assembly or testing facilities, we may not be able to reduce our costs as rapidly as companies that operate their own facilities, and our costs may even increase, which could also reduce our margins.
Fluctuations in the mix of products sold may adversely affect our financial results.
Because of the wide price differences among our processors, the mix and types of performance capabilities of processors sold affect the average selling price of our products and have a substantial impact on our revenue. Generally, sales of higher performance products have higher gross margins than sales of lower performance products. We currently offer both higher and lower performance products in a number of our different product families. If the sales mix shifts towards lower performance, lower margin products, our overall gross margins will be negatively affected. Fluctuations in the mix and types of our products may also affect the extent to which we are able to recover our fixed costs and investments that are associated with a particular product, and as a result can negatively impact our financial results.
Adverse changes in general economic or political conditions in any of the major countries in which we do business could adversely affect our operating results.
As our business has grown to both customers located in the United States as well as customers located outside of the United States, we have become increasingly subject to the risks arising from adverse changes in both the domestic and global economic and political conditions. If economic growth in the United States and other countries’ economies continues to slow, the demand for our customer’s products could decline, which would then decrease demand for our products. Furthermore, if economic conditions in the countries into which our customers sell their products continue to deteriorate, some of our customers may decide to postpone or delay some of their development programs, which would then delay their need to purchase our products. This could result in a reduction in sales of our products or in a reduction in the growth of our product sales. Any of these events would likely harm investors’ view of our business, financial condition, and results of operations.
13
The semiconductor and communications industries have historically experienced significant fluctuations with prolonged downturns, which could impact our operating results, financial condition and cash flows
The semiconductor industry has historically exhibited cyclical behavior, which at various times has included significant downturns in customer demand, including in late 2008 through 2009. Because a significant portion of our expenses is fixed in the near term or is incurred in advance of anticipated sales, we may not be able to decrease our expenses rapidly enough to offset any unanticipated shortfall in revenues. If this situation were to occur, it could adversely affect our operating results, cash flow and financial condition. Furthermore, the semiconductor industry has periodically experienced periods of increased demand and production constraints. If this happens in the future, we may not be able to produce sufficient quantities of our products to meet the increased demand. We may also have difficulty in obtaining sufficient wafer, assembly and test resources from our subcontract manufacturers. Any factor adversely affecting the semiconductor industry in general, or the particular segments of the industry that our products target, may adversely affect our ability to generate revenue and could negatively impact our operating results.
The communications industry has, in the past, experienced pronounced downturns, and these cycles may continue in the future. To respond to a downturn, many networking equipment providers may slow their research and development activities, cancel or delay new product development, reduce their inventories and take a cautious approach to acquiring our products, which would have a significant negative impact on our business. If this situation were to occur, it could adversely affect our operating results, cash flow and financial condition. In the future, any of these trends may also cause our operating results to fluctuate significantly from year to year, which may increase the volatility of the price of our stock.
Our products must meet exact specifications, and defects and failures may occur, which may cause customers to return or stop buying our products.
Our customers generally establish demanding specifications for quality, performance and reliability that our products must meet. However, our products are highly complex and may contain defects and failures when they are first introduced or as new versions are released. If defects and failures occur in our products during or after the design phase, we could experience lost revenues, increased costs, including warranty expense and costs associated with customer support, delays in or cancellations or rescheduling of orders or shipments, product returns or discounts, diversion of management resources or damage to our reputation and brand equity, and in some cases consequential damages, any of which would harm our operating results. In addition, delays in our ability to fill product orders as a result of quality control issues may negatively impact our relationship with our customers.
We rely on our customers to design our products into their systems, and the nature of the design process requires us to incur expenses prior to customer commitments to use our products or recognizing revenues associated with those expenses which may adversely affect our financial results.
One of our primary focuses is on winning competitive bid selection processes, known as “design wins,” to develop products for use in our customers’ products. We devote significant time and resources in working with our customers’ system designers to understand their future needs and to provide products that we believe will meet those needs and these bid selection processes can be lengthy. If a customer’s system designer initially chooses a competitor’s product, it becomes significantly more difficult for us to sell our products for use in that system because changing suppliers can involve significant cost, time, effort and risk for our customers. Thus, our failure to win a competitive bid can result in our foregoing revenues from a given customer’s product line for the life of that product. In addition, design opportunities may be infrequent or may be delayed. Our ability to compete in the future will depend, in large part, on our ability to design products to ensure compliance with our customers’ and potential customers’ specifications. We expect to invest significant time and resources and to incur significant expenses to design our products to ensure compliance with relevant specifications.
We often incur significant expenditures in the development of a new product without any assurance that our customers’ system designers will select our product for use in their applications. We often are required to anticipate which product designs will generate demand in advance of our customers expressly indicating a need for that particular design. Even if our customers’ system designers select our products, a substantial period of time will elapse before we generate revenues related to the significant expenses we have incurred.
The reasons for this delay generally include the following elements of our product sales and development cycle timeline and related influences:
|
|
· |
our customers usually require a comprehensive technical evaluation of our products before they incorporate them into their designs; |
|
|
· |
it can take from six months to three years from the time our products are selected to commence commercial shipments; and |
|
|
· |
our customers may experience changed market conditions or product development issues. |
14
The resources devoted to product development and sales and marketing may not generate material revenue for us, and from time to time, we may need to write off excess and obsolete inventory if we have produced product in anticipation of expected demand. We may spend resources on the development of products that our customers may not adopt. If we incur significant expenses and investments in inventory in the future that we are not able to recover, and we are not able to compensate for those expenses, our operating results could be adversely affected. In addition, if we sell our products at reduced prices in anticipation of cost reductions but still hold higher cost products in inventory, our operating results would be harmed.
Additionally, even if system designers use our products in their systems, we cannot assure you that these systems will be commercially successful or that we will receive significant revenue from the sales of processors for those systems. As a result, we may be unable to accurately forecast the volume and timing of our orders and revenues associated with any new product introductions.
In the event one of our distributor arrangements terminates, it could lead to a loss of revenues and possible product returns.
A portion of our sales is made through third-party distribution agreements. Termination of a distributor relationship, either by us or by the distributor, could result in a temporary loss of revenues until a replacement distributor can be established to service the affected end-user customers, or a permanent loss of revenues if no replacement can be established. We may not be successful in finding suitable alternative distributors on satisfactory terms or at all and this could adversely affect our ability to sell in some locations or to some end-user customers. Additionally, if we terminate our relationship with a distributor, we may be obligated to repurchase unsold products. We record a reserve for estimated returns and price credits. If actual returns and credits exceed our estimates, our operating results could be harmed.
Our acquisition, disposition and investment strategies may result in unanticipated accounting charges or otherwise adversely affect our business, financial condition and results of operations.
Since May 2008, we have acquired three companies and acquired assets of, and assumed liabilities of, five other companies. We expect that we will in the future continue to acquire companies or assets of companies or invest in third-party companies that we believe to be complementary to our business, including for the purpose of expanding our new product design capacity, introducing new design, market or application skills or enhancing and expanding our existing product lines. In connection with any such future acquisitions or investments, we may need to use a significant portion of our available cash, issue additional equity securities that would dilute current stockholders’ percentage ownership and incur substantial debt or contingent liabilities. In addition, we may incur higher operating costs following an acquisition. These actions could adversely impact our operating results and the market price of our common stock. In addition, acquisitions of companies exposes us to risks, including:
|
|
· |
difficulties may occur in assimilating and integrating the operations, personnel, technologies, and products of acquired companies or businesses; |
|
|
· |
key personnel of an acquired company may decide not to work for us; |
|
|
· |
to the extent we acquire a company with existing products; those products may have lower gross margins than our customary products, which could adversely affect our gross margin and operating results; |
|
|
· |
if an acquired company also has inventory that we assume, we will be required to write up the carrying value of that inventory to fair value, and when that inventory is sold, the gross margins for those products will be reduced and our gross margins for that period would be negatively affected; and |
|
|
· |
the purchase price of any acquired businesses may exceed the current fair values of the net tangible assets of the acquired businesses, in which case we would be required to record material amounts of goodwill, and acquired in-process research and development charges and other intangible assets, which could result in significant impairment and acquired in-process research and development charges and amortization expense in future periods, which charges, in addition to the results of operations of the acquired businesses and potential restructuring costs associated with an acquisition, could have a material adverse effect on our business, financial condition and results of operations. We cannot forecast the number, timing or size of future acquisitions, or the effect that any acquisitions might have on our operating or financial results. |
We rely on our ecosystem partners to enhance our product offerings and our inability to continue to develop or maintain these relationships in the future would harm our ability to remain competitive.
We have developed relationships with third parties, which we refer to as ecosystem partners, which provide operating systems, tool support, reference designs and other services designed for specific uses with our SoCs. We believe that these relationships enhance our customers’ ability to get their products to market quickly. If we are unable to continue to develop or maintain these relationships, we may not be able to enhance our customers’ ability to commercialize their products in a timely fashion and our ability to remain competitive would be harmed, which would negatively impact our ability to generate revenue and our operating results.
15
The loss of any of our key personnel could seriously harm our business, and our failure to attract or retain specialized technical, management or sales and marketing talent could impair our ability to grow our business.
We believe our future success will depend in large part upon our ability to attract, retain and motivate highly skilled managerial, engineering, sales and marketing personnel. The loss of any key employees or the inability to attract, retain or motivate qualified personnel, including engineers and sales and marketing personnel could delay the development and introduction of, and harm our ability to sell our products which would materially and adversely affect our business, financial condition and results of operations. For instance, if any of these individuals were to leave our company unexpectedly, we could face substantial difficulty in hiring qualified successors and could experience a loss in productivity during the search for and while any successor is integrated into our business and operations.
There is currently a shortage of qualified technical personnel with significant experience in the design, development, manufacturing, marketing and sales of integrated circuits. In particular, there is a shortage of engineers who are familiar with the intricacies of the design and manufacture of multi-core networking processors, and competition for these engineers is intense. Our key technical personnel represent a significant asset and serve as the source of our technological and product innovations. We may not be successful in attracting, retaining and motivating sufficient numbers of technical personnel to support our anticipated growth.
To date, we have relied primarily on our direct marketing and sales force to drive new customer design wins and to sell our products. Because we are looking to expand our customer base and grow our sales to existing customers, we will need to hire additional qualified sales personnel in the near term and beyond if we are to achieve revenue growth. The competition for qualified marketing and sales personnel in our industry, and particularly in Silicon Valley, is very intense. If we are unable to hire, train, deploy and manage qualified sales personnel in a timely manner, our ability to grow our business will be impaired. In addition, if we are unable to retain our existing sales personnel, our ability to maintain or grow our current level of revenues will be adversely affected. Further, if we are unable to integrate and retain personnel acquired through our various acquisitions, we may not be able to fully capitalize on such acquisitions.
We rely on stock-based awards as one means for recruiting, motivating and retaining highly skilled talent. If the value of the stock awards does not appreciate as measured by the performance of the price of our common stock or if our share-based compensation otherwise ceases to be viewed as a valuable benefit, our ability to attract, retain, and motivate employees could be weakened, which could harm our business, financial condition and results of operations.
Some of our operations and a significant portion of our customers and contract manufacturers are located outside of the United States, which subjects us to additional risks, including increased complexity and costs of managing international operations and geopolitical instability.
We have international sales offices and research and development facilities and we conduct, and expect to continue to conduct, a significant amount of our business with companies located outside the United States, particularly in Asia and Europe. Even customers based in the United States often use contract manufacturers based in Asia to manufacture their systems, and it is the contract manufacturers that purchase products directly from us. As a result of our international focus, we face numerous challenges, including:
|
|
· |
increased complexity and costs of managing international operations; |
|
|
· |
longer and more difficult collection of receivables; |
|
|
· |
difficulties in enforcing contracts generally; |
|
|
· |
geopolitical and economic instability and military conflicts; |
|
|
· |
limited protection of our intellectual property and other assets; |
|
|
· |
compliance with local laws and regulations and unanticipated changes in local laws and regulations, including tax laws and regulations; |
|
|
· |
trade and foreign exchange restrictions and higher tariffs; |
|
|
· |
travel restrictions; |
|
|
· |
timing and availability of import and export licenses and other governmental approvals, permits and licenses, including export classification requirements; |
|
|
· |
foreign currency exchange fluctuations relating to our international operating activities; |
|
|
· |
transportation delays and limited local infrastructure and disruptions, such as large scale outages or interruptions of service from utilities or telecommunications providers; |
|
|
· |
difficulties in staffing international operations; |
|
|
· |
heightened risk of terrorism; |
16
|
|
· |
differing employment practices and labor issues; |
|
|
· |
regional health issues and natural disasters; and |
|
|
· |
work stoppages. |
We are subject to governmental export and import controls that may adversely affect our business.
We and our customers are subject to various import and export laws and regulations. Government export regulations apply to the encryption or other features contained in some of our products. Although our processes and procedures are designed to maintain compliance, we cannot assure you that we have been or will be at all times in complete compliance with these laws and regulations. On January 30, 2015, we submitted an initial notification of a voluntary self-disclosure to the U.S. Department of Commerce, Bureau of Industry and Security, or BIS. The notification reported our discovery that hardware and software, with encryption functionality, may have been exported without the required BIS export license. With the assistance of outside counsel, we conducted a review of past export transactions during the past five years, and on July 17, 2015, we reported our findings in a full voluntary self-disclosure to BIS. The findings reported that we exported certain encryption hardware and software to fifteen government end-users in the People’s Republic of China, Taiwan, Hong Kong, Singapore, India and South Korea, as well as one party on BIS' entity list, without the required BIS export license. The aggregate billings for the reported exports were approximately $0.5 million. The disclosure also addressed our remedial and corrective actions. BIS is reviewing our voluntary self-disclosure and we are cooperating fully with BIS. Violations of the export control laws may result in civil, administrative or criminal fines or penalties, loss of export privileges, debarment or a combination of these penalties. At this time we are unable to determine the outcome of the government’s investigation or its possible effect on the Company.
If we fail to receive licenses or otherwise comply with import and export laws and regulations, we may be unable to manufacture the affected products at foreign foundries or ship these products to some customers, or we may incur penalties or fines and civil and criminal liabilities or other sanctions. In addition, changes in import or export laws and regulations may create delays in the introduction of our products in international markets, prevent our customers with international operations from deploying our products or cause decreased use of our products by customers with international operations, each of which would adversely affect our business and results of operations.
New regulations related to “conflict minerals” may force us to incur additional expenses, may make our supply chain more complex and may result in damage to our reputation with customers.
Pursuant to the Dodd-Frank Wall Street Reform and Consumer Protection Act of 2010, or the Dodd-Frank Act, the Securities and Exchange Commission has adopted new requirements for companies that use certain minerals and metals, known as conflict minerals, in their products, whether or not these products are manufactured by third parties. These requirements will require companies to diligence, disclose and report whether or not such minerals originate from the Democratic Republic of Congo and adjoining countries. The implementation of these new requirements could adversely affect the sourcing, availability and pricing of minerals used in the manufacture of semiconductor devices, including our products. In addition, we will incur additional costs to comply with the disclosure requirements, including costs related to determining the source of any of the relevant minerals and metals used in our products. Since our supply chain is complex, we may not be able to sufficiently verify the origins for these minerals and metals used in our products through the due diligence procedures that we implement, which may harm our reputation. In such event, we may also face difficulties in satisfying customers who require that all of the components of our products are certified as conflict mineral free. We filed our first and second form SD with the SEC on May 30, 2014 and May 29, 2015, respectively.
We outsource our wafer fabrication, assembly, testing, warehousing and shipping operations to third parties, and rely on these parties to produce and deliver our products according to requested demands in specification, quantity, cost and time.
We rely on third parties for substantially all of our manufacturing operations, including wafer fabrication, assembly, testing, warehousing and shipping. We depend on these parties to supply us with material of a requested quantity in a timely manner that meets our standards for yield, cost and manufacturing quality. We do not have any long-term supply agreements with our manufacturing suppliers. Any problems with our manufacturing supply chain could adversely impact our ability to ship our products to our customers on time and in the quantity required, which in turn could cause an unanticipated decline in our sales and possibly damage our customer relationships.
17
The fabrication of integrated circuits is a complex and technically demanding process. Our foundries could, from time to time, experience manufacturing defects and reduced manufacturing yields. Changes in manufacturing processes or the inadvertent use of defective or contaminated materials by our foundries could result in lower than anticipated manufacturing yields or unacceptable performance. Many of these problems are difficult to detect at an early stage of the manufacturing process and may be time consuming and expensive to correct. In addition, our manufacturing processes with our foundries are unique and not within the customary manufacturing processes of these foundries, which may lead to manufacturing defects, reduced manufacturing yields and/or increases in manufacturing costs.
Poor yields from our foundries, or defects, integration issues or other performance problems in our products could cause us significant customer relations and business reputation problems, harm our financial results and result in financial or other damages to our customers. Our customers could also seek damages from us for their losses. A product liability claim brought against us, even if unsuccessful, would likely be time consuming and costly to defend.
In addition, a significant portion of our sales are to customers that practice just-in-time order management from their suppliers, which gives us a very limited amount of time in which to process and complete these orders. As a result, delays in our production or shipping by the parties to whom we outsource these functions could reduce our sales, damage our customer relationships and damage our reputation in the marketplace, any of which could harm our business, financial condition and results of operations.
Our products are manufactured at a limited number of locations and if we experience manufacturing problems at a particular location, we could experience a delay in obtaining our manufactured products, which could harm our business and reputation.
Although we use several independent foundries to manufacture substantially all of our semiconductor products, most of our components are not manufactured at more than one foundry at any given time, and our products typically are designed to be manufactured in a specific process at only one of these foundries. Accordingly, if one of our foundries is unable to provide us with components as needed, we could experience significant delays in securing sufficient supplies of those components from other sources. Converting or transferring manufacturing from a primary location or supplier to a backup fabrication facility could be expensive and could take one to two quarters. During such a transition, we would be required to meet customer demand from our then-existing inventory, as well as any partially finished goods that can be modified to the required product specifications. We do not seek to maintain sufficient inventory to address a lengthy transition period because we believe it is uneconomical to keep more than minimal inventory on hand. As a result, we may not be able to meet customer needs during such a transition, which could delay shipments, cause a production delay or stoppage for our customers, result in a decline in our sales and damage our customer relationships. We cannot assure you that any of our existing or new foundries will be able to produce integrated circuits with acceptable manufacturing yields, or that our foundries will be able to deliver enough semiconductor devices to us on a timely basis, or at reasonable prices. These and other related factors could impair our ability to meet our customers’ needs and have a material and adverse effect on our operating results.
If we experience delays or loss of manufacturing availability when demand is high, we would experience a delay in obtaining our manufactured products, which could harm our business and reputation.
We have no long-term supply contracts with the foundries with which we work. Availability of foundry capacity has in the recent past been reduced due to strong demand. The ability of each foundry to provide us with semiconductor devices is limited by its available capacity and existing obligations. Foundry capacity may not be available when we need it or at reasonable prices which could cause us to be unable to meet customer needs, delay shipments, because a production delay or stoppage for our customers, result in a decline in our sales and harm our financial results. Further, some of our competitors may be better financed than we are, may have long-term agreements with our main foundries and may induce our foundries to reallocate capacity to those customers. This reallocation could impair our ability to secure the supply of components that we need.
To secure sufficient foundry capacity when demand is high and mitigate the risks described in the foregoing paragraph, we may enter into various arrangements with suppliers that could be costly and harm our operating results, such as nonrefundable deposits with or loans to foundries in exchange for capacity commitments and contracts that commit us to purchase specified quantities of integrated circuits over extended periods. We may not be able to make any such arrangement in a timely fashion or at all, and any arrangements may be costly, reduce our financial flexibility, and not be on terms favorable to us. Moreover, if we are able to secure foundry capacity, we may be obligated to use all of that capacity or incur penalties. These penalties may be expensive and could harm our financial results.
18
Any increase in the manufacturing cost of our products could reduce our gross margins and operating profit.
The semiconductor business experiences ongoing competitive pricing pressure from customers and competitors. Accordingly, any increase in the cost of our products, whether by adverse purchase price variances or adverse manufacturing cost variances, may not be able to be passed on to our customers and we may experience reduced gross margins and operating profit. We do not have any long-term supply agreements with our manufacturing suppliers and we typically negotiate pricing on a purchase order by purchase order basis. Consequently, we may not be able to obtain price reductions or anticipate or prevent future price increases from our suppliers.
Our failure to protect our intellectual property rights adequately could impair our ability to compete effectively or to defend ourselves from litigation, which could harm our business, financial condition and results of operations.
We rely primarily on patent, copyright, trademark and trade secret laws, as well as confidentiality and nondisclosure agreements and other methods, to protect our proprietary technologies and know-how.
The failure of our patents and other intellectual property protections to adequately protect our technology might make it easier for our competitors to offer similar products or technologies, which would harm our business. Including patents from our acquisitions, we have been issued 120 patents in the United States and 47 patents in foreign countries and have an additional 311 patent applications pending in the United States and 219 patent applications pending in foreign countries as of December 31, 2015. Even if the pending patent applications are granted, the rights granted to us may not be meaningful or provide us with any commercial advantage. For example, these patents could be opposed, contested, circumvented or designed around by our competitors or be declared invalid or unenforceable in judicial or administrative proceedings. Our foreign patent protection is generally not as comprehensive as our U.S. patent protection and may not protect our intellectual property in some countries where our products are shipped, sold or may be sold in the future. Many U.S.-based companies have encountered substantial intellectual property infringement in foreign countries, including countries where we sell products. Even if foreign patents are granted, effective enforcement in foreign countries may not be available.
We enter into confidentiality agreements with our employees, consultants and strategic partners. We also control access to and distribution of our technologies, documentation and other proprietary information. However, internal or external parties may copy, disclose, obtain or use our proprietary information without our authorization. Further, current or former employees or third parties may attempt to misappropriate our proprietary information.
Monitoring unauthorized use of our intellectual property and the intellectual property of our customers and strategic partners is difficult and costly. It is possible that unauthorized use of our intellectual property may have occurred or may occur without our knowledge. We cannot assure you that the steps we have taken will prevent unauthorized use of our intellectual property.
Our failure to effectively protect our intellectual property could reduce the value of our technology in licensing arrangements or in cross-licensing negotiations, and could harm our business, financial condition, and results of operations. We may in the future need to initiate infringement claims or litigation to defend or enforce our intellectual property rights. Litigation, whether we are a plaintiff or a defendant, can be expensive, time consuming and may divert the efforts of our technical staff and managerial personnel, which could harm our business, whether or not such litigation results in a determination favorable to us.
A breach of our security systems may have a material adverse effect on our business.
Our security systems are designed to maintain the physical security of our facilities and protect our customers’, suppliers’ and employees’ confidential information. However, we are also dependent on a number of third-party “cloud-based” service providers of critical corporate infrastructure services relating to, among other things, human resources, electronic communication services and some finance functions, and we are, of necessity, dependent on the security systems of these providers. Accidental or willful security breaches or other unauthorized access by third parties to our facilities, our information systems or the systems of our cloud-based service providers or the existence of computer viruses in our or their data or software could expose us to a risk of information loss and misappropriation of proprietary and confidential information. Any theft or misuse of this information could result in, among other things, unfavorable publicity, damage to our reputation, disclosure of our intellectual property and/ or confidential customer, supplier or employee data, difficulty in marketing our products, allegations by our customers that we have not performed our contractual obligations, litigation by affected parties and possible financial obligations for liabilities and damages related to the theft or misuse of this information, any of which could have a material adverse effect on our business, profitability and financial condition. Since the techniques used to obtain unauthorized access or to sabotage systems change frequently and are often not recognized until launched against a target, we may be unable to anticipate these techniques or to implement adequate preventative measures.
19
Assertions by third parties of infringement by us of their intellectual property rights could result in significant costs and cause our operating results to suffer.
The semiconductor industry is characterized by vigorous protection and pursuit of intellectual property rights and positions, which has resulted in protracted and expensive litigation for many companies. From time to time we receive communications that allege we have infringed specified patents, trade secrets or other intellectual property rights owned by others. Any of these allegations, regardless of merit, could cause us to incur significant costs in responding to, defending and resolving these allegations. Any lawsuits resulting from these allegations could subject us to significant liability for damages and invalidate our proprietary rights. Any potential intellectual property litigation also could force us to do one or more of the following:
|
|
· |
stop selling products or using technology that contain the allegedly infringing intellectual property; |
|
|
· |
lose the opportunity to license our technology to others or to collect royalty payments based upon successful protection and assertion of our intellectual property against others; |
|
|
· |
incur significant legal expenses; |
|
|
· |
pay substantial damages to a third-party if we are found to be infringing; |
|
|
· |
redesign those products that contain the allegedly infringing intellectual property; or |
|
|
· |
attempt to obtain a license to the relevant intellectual property from third parties, which may not be available on reasonable terms or at all. |
Any significant impairment of our intellectual property rights from any litigation we face could harm our business and our ability to compete.
Our customers have in the past and may in the future also become the target of allegations of infringement or litigation relating to the patent and other intellectual property rights of others. This could trigger technical support and indemnification obligations in some of our licenses or customer agreements. These obligations could result in substantial expenses, including the payment by us of costs and damages relating to claims of intellectual property infringement. In addition to the time and expense required for us to provide support or indemnification to our customers, litigation could disrupt the businesses of our customers, which in turn could hurt our relationships with our customers and cause the sale of our products to decrease. We cannot assure you that claims for indemnification will not be made or that if made, the claims would not have a material adverse effect on our business, operating results or financial conditions.
If we do not manage the risks associated with our large professional service contracts properly, our revenue and customer base could be adversely affected.
The pricing and other terms of some of our larger professional services agreements require us to make estimates and assumptions at the time we enter into these contracts that could differ from actual results. Any increased or unexpected costs or unanticipated delays in connection with the performance of these engagements, including delays caused by factors outside our control, could make these agreements less profitable or unprofitable, which would have an adverse effect on the profit margin of our software and services business and adversely affect our operating results. In addition, changes in costs or a delay in connection with the performance of our large professional service agreements may harm our relationships with these customers.
Our software and licenses revenues are derived mainly from subscription-based software licenses and we are dependent upon the ability of our customers to develop and penetrate new markets successfully, and to develop new products for existing markets.
Our subscription-based license revenues depend both upon our ability to successfully negotiate license agreements with our customers and, in turn, upon our customers’ successful commercialization of their underlying products. As our open source business grows, we may not be able to rely on receiving per unit fees from our customers. For our open source business, we may instead need to rely on other fees to compensate for the subscription-based license fees that we have traditionally received for our proprietary products. Also, we derive significant revenues from customers that develop products in highly competitive and technologically complex markets such as the internet infrastructure, server and storage, digital consumer, aerospace and defense, industrial control, medical equipment, gaming, and office automation. If these customers sell fewer products or otherwise face significant economic difficulties, particularly in the current global economic recession, our software and license revenues may decline.
20
If we fail to maintain an effective system of internal controls, we may not be able to accurately report our financial results or prevent fraud.
Effective internal controls are necessary for us to provide reliable financial reports and effectively prevent fraud. Any inability to provide reliable financial reports or prevent fraud could harm our business. The Sarbanes-Oxley Act of 2002 requires management and our independent registered public accounting firm to evaluate and assess the effectiveness of our internal control over financial reporting. These Sarbanes-Oxley Act requirements may be modified, supplemented or amended from time to time. Implementing these changes may take a significant amount of time and may require specific compliance training of our personnel. In the future, we may discover areas of our internal controls that need improvement. If our independent registered public accounting firm or we discover a material weakness, the disclosure of that fact, even if quickly remediated, could reduce the market’s confidence in our financial statements and harm our stock price. We may not be able to effectively and timely implement necessary control changes and employee training to ensure continued compliance with the Sarbanes-Oxley Act and other regulatory and reporting requirements. Our rapid growth in recent years, including through numerous acquisitions and our possible future expansion through acquisitions, present challenges to maintain the internal control and disclosure control standards applicable to public companies. If we fail to maintain effective internal controls, we could be subject to regulatory scrutiny and sanctions and investors could lose confidence in the accuracy and completeness of our financial reports.
We rely on third-party technologies for the development of our products and our inability to use these technologies in the future would harm our ability to remain competitive.
We rely on third parties for technologies that are integrated into our products, such as wafer fabrication and assembly and test technologies used by our contract manufacturers, as well as licensed MIPS and ARM architecture technologies. If we are unable to continue to use or license these technologies on reasonable terms, or if these technologies fail to operate properly, we may not be able to secure alternatives in a timely manner and our ability to remain competitive would be harmed, which could harm our business, financial condition and results of operations. In addition, if we are unable to successfully license technology from third parties to develop future products, we may not be able to develop such products in a timely manner or at all.
Our open source business could be seriously harmed by the outcome of lawsuits challenging the use and distribution of Linux-based software products.
We rely on Linux system software as the basis of our software products. Several lawsuits have been filed challenging the right to use and/or distribute Linux system software and software applications based on Linux. Although we are not a party to or directly involved in any of the lawsuits relating to Linux, we expect that further lawsuits could be filed against Linux in the future which would challenge the use and distribution of our Linux-based software products. It is impossible to estimate or anticipate all of the financial or other impacts the results of these litigation matters could have on our business. Success by a plaintiff in one or more of these lawsuits could have a material adverse effect on our open source business.
Legal uncertainty surrounding the use and distribution of open source software may cause the market for Linux-based products to disappear, fail to further develop or fail to develop at a rate sufficient to sustain our business.
The majority of our open source software products are licensed from third parties under the General Public License, or GPL, and similar open source licenses. There remains some significant confusion among our customers about the scope of their obligations and rights with respect to using and distributing Linux-based products. One element of this confusion is whether the GPL and other open source licenses require customers to (i) make all of the source code for their products available to the public, and/or (ii) license all of the code underlying such products under an open source license. There is little or no legal precedent for interpreting the terms of the GPL and similar open source licenses, including the determination of which types of programs or products would be considered derived works and thus potentially subject to the terms of such open source licenses. If this confusion remains, increases or is prolonged by litigation, the market for Linux-based products may disappear, fail to further develop or fail to develop at a rate sufficient to sustain our open source business.
Our open source business depends on Linux developers to continue to improve Linux and Linux-based applications that are incorporated into our open source products.
Our ability to release major upgrades of MontaVista Linux is largely dependent upon the release of new versions of the Linux kernel. The Linux kernel is the heart of the Linux system software. Linus Torvalds and a small group of engineers are primarily responsible for the development, evolution and maintenance of the Linux kernel. In addition, other individuals and small groups of developers are largely responsible for Linux programs tailored to specific tasks or computer architectures. If Mr. Torvalds or other key developers fail to further develop the Linux kernel or other programs on which we rely, we will need to either develop them ourselves or rely on another party for development. This development effort could be costly and time consuming, and could delay or entirely prevent our open source product release and upgrade schedule.
21
We may be unsuccessful in marketing our open source products because we encounter widespread negative perceptions about Linux and open source software in general.
Some people still incorrectly believe that anyone who writes a software program that runs on Linux will necessarily need to publicly disclose the source code for that software. If a potential customer believes their source code will need to be made public if they use our open source product, they may be less likely to purchase our open source product. We devote substantial time and attention helping potential customers understand the legal implications of using our open source products, including that fact that in most instances, applications developed to run on Linux may be distributed under a proprietary license. In many cases, we are required to address these issues at different levels across an organization (such as at the engineering, managerial and executive levels), which can be very time consuming. We are sometimes unsuccessful at convincing a potential customer that using Linux-based system software will not have negative consequences for that customer. Furthermore, many potential customers believe that they should not be required to pay for our open source products, since our open-source products are based on open source (also sometimes called “free”) software. They believe that open source products are all publicly available at no charge. There is also the misconception that distributors of Linux software cannot offer warranties or indemnifications with respect to Linux software. Each of these customers’ fears or misperceptions could cause us to lose potential orders or cause our customers to delay purchase decisions, which could significantly lengthen our sales cycle. These misperceptions could cause the market for Linux-based products to disappear, fail to further develop, or fail to develop at a rate sufficient to sustain our open source business.
Our open source software may contain errors or defects that could delay introduction of new products, result in costly remedial expenditures or cause disputes with customers.
Most of the open source software that we sell and distribute is developed by third parties with whom we have no business relationship, including thousands of individual software programmers. To successfully release our open source products, we must assemble and test software developed by thousands of disparate sources. Despite our efforts, errors have been and may continue to be found in our open source products. If errors are discovered, we may not be able to successfully correct them in a timely manner or at all. Errors and failures in our open source products could result in a loss of, or delay in, market acceptance of our open-source products and could damage our reputation and our ability to convince commercial users of the benefits of Linux-based systems software and other open source software products. In addition, we may need to make significant expenditures of capital resources to reduce errors and failures.
We face intense competition related to our open source products, and expect competition to increase in the future, which could reduce our open source-related revenue and customer base.
The market for Linux-based systems software is highly competitive, and we expect competition to intensify in the future. We consider the primary competitors for our MontaVista software products to be Wind River Systems, Inc., a subsidiary of Intel Corporation and, to a lesser extent, Canonical Ltd. and Mentor Graphics Corporation. In addition, potential customers for our open source products may believe that they can build their own open source product cheaper or more efficiently than purchasing our products.
In addition to competitors in the business of distributing a commercial Linux-based operating system, we face competition from some hardware companies who offer Linux-based operating systems and related software components at little or no charge. We also face competition from Linux-based software distributions provided by new and emerging consortiums and software stacks such as Linaro and Android. And because, apart from such hardware vendors and consortiums, there is a large Linux code base generally available at no charge, certain customers or potential customers have made, and will continue to make, efforts to develop their own Linux-based operating system without purchasing or otherwise obtaining it from a third-party vendor. To the extent that the quality and availability of non-commercial Linux-based operating system software continues to improve, it could have a material adverse effect on our ability to sell open source software.
Our third-party contractors are concentrated primarily in Asia, an area subject to earthquake and other risks. Any disruption to the operations of these contractors could cause significant delays in the production or shipment of our products.
Substantially all of our products are manufactured by third-party contractors located in Taiwan and to a lesser extent manufactured by third-party contractors located in Japan, Malaysia and Korea. The risk of an earthquake in any of those countries or elsewhere in Asia is significant due to the proximity of major earthquake fault lines to the facilities of our foundries and assembly and test subcontractors. For example, several major earthquakes have occurred in Taiwan and Japan since our incorporation in 2000, the most recent being the major earthquake and tsunami that occurred in March 2011 in Japan. Although our third-party contractors did not suffer any significant damage as a result of these most recent earthquakes, the occurrence of additional earthquakes, other natural disasters or other events causing closures could result in the disruption of our foundry or assembly and test capacity. Any disruption resulting from such events could cause significant delays in the production or shipment of our products until we are able to shift our manufacturing, assembling or testing from the affected contractor to another third-party vendor. We may not be able to obtain alternate capacity on favorable terms, if at all.
22
We may experience difficulties in transitioning to new wafer fabrication process technologies or in achieving higher levels of design integration, which may result in reduced manufacturing yields, delays in product deliveries and increased expenses.
To remain competitive, we expect to continue to transition our semiconductor products to increasingly smaller line width geometries. This transition requires us to modify our designs to work with the manufacturing processes of our foundries. We periodically evaluate the benefits, on a product-by-product basis, of migrating to new process technologies to reduce cost and improve performance. We may face difficulties, delays and expenses as we continue to transition our products to new processes. We are dependent on our relationships with our foundry contractors to transition to new processes successfully. We cannot assure you that the foundries that we use will be able to effectively manage the transition or that we will be able to maintain our existing foundry relationships or develop new ones. If any of our foundry contractors or we experience significant delays in this transition or fail to efficiently implement this transition, we could experience reduced manufacturing yields, delays in product deliveries and increased expenses, all of which could harm our relationships with our customers and our results of operations. As new processes become more prevalent, we expect to continue to integrate greater levels of functionality, as well as customer and third-party intellectual property, into our products. However, we may not be able to achieve higher levels of design integration or deliver new integrated products on a timely basis.
We may need to raise additional capital, which might not be available or which, if available, may be on terms that are not favorable to use.
We believe our existing cash and cash equivalent balances and cash expected to be generated from our operations will be sufficient to meet our working capital, capital expenditures and other needs for at least the next 12 months. In the future, we may seek to raise additional funds, and we cannot be certain that we will be able to obtain additional financing on favorable terms, if at all. If we issue equity securities to raise additional funds, the ownership percentage of our stockholders would be reduced, and the new equity securities may have rights, preferences or privileges senior to those of existing holders of our common stock. If we borrow money, we may incur significant interest charges, which could harm our profitability. Holders of debt would also have rights, preferences or privileges senior to those of existing holders of our common stock. If we cannot raise needed funds on acceptable terms, we may not be able to develop or enhance our products, take advantage of future opportunities or respond to competitive pressures or unanticipated requirements, which could harm our business, operating results and financial condition.
We may incur impairments to goodwill or long-lived assets.
We review our long-lived assets, including goodwill and other intangible assets, for impairment annually in the fourth quarter or whenever events or changes in circumstances indicate that the carrying amount of these assets may not be recoverable. Significant negative industry or economic trends, including a significant decline in the market price of our common stock, reduced estimates of future cash flows for our reporting units or disruptions to our business could lead to an impairment charge of our long-lived assets, including goodwill and other intangible assets.
Our valuation methodology for assessing impairment requires management to make judgments and assumptions based on historical experience and to rely heavily on projections of future operating performance. If our actual results, or the plans and estimates used in future impairment analyses are lower than the original estimates used to assess the recoverability of these assets, we could incur additional impairment charges. We operate in highly competitive environments and projections of future operating results and cash flows may vary significantly from results. Additionally, if our analysis results in impairment to our goodwill, we may be required to record a charge to earnings in our financial statements during a period in which such impairment is determined to exist, which may negatively impact our business, financial condition and results of operations.
The complexity of accounting regulations and related interpretations and policies, particularly those related to revenue recognition, could materially affect our financial results for a given period.
Although we use standardized agreements designed to meet current revenue recognition criteria under generally accepted accounting principles, we might negotiate and revise terms and conditions of these standardized agreements, particularly in multi-element license and services transactions. As we increase our transactions to more complex multi-element transactions, negotiation of mutually acceptable terms and conditions may require us to defer recognition of revenue on such licenses. We believe that we are in compliance with the guidance as provided under multiple element arrangements; however, bigger and more complex, multi-element transactions may require additional accounting analysis to account for them accurately. Errors in such analysis in any period could lead to unanticipated changes in our revenue accounting practices and may affect the timing of revenue recognition, which could adversely affect our financial results. If we later discover that we have interpreted and applied revenue recognition rules differently than prescribed by generally accepted accounting principles in the U.S., we could be required to devote significant management resources, and incur the expense associated with an audit, restatement or other examination of our financial statements.
23
Our future effective tax rates could be affected by the allocation of our income among different geographic regions, which could affect our future operating results, financial condition and cash flows.
As a global company, we are subject to taxation in the United States and various other countries and states. Significant judgment is required to determine and estimate worldwide tax liabilities. We may further expand our international operations and staff to better support our international markets. As a result, we anticipate that our consolidated pre-tax income will be subject to tax at relatively lower tax rates when compared to the United States federal statutory tax rate. Further, because we have established valuation allowance against our deferred tax assets in the United States, combined with lower foreign tax rates, our effective income tax rate is expected to be lower than the United States federal statutory rate. Our future effective income tax rates could be adversely affected if tax authorities were to successfully challenge our international tax structure or if the relative mix of United States and international income changes for any reason, or United States or foreign tax laws were to change. Accordingly, there can be no assurance that our income tax rate will continue to be less than the United States federal statutory rate.
Any significant change in our future effective tax rates could adversely impact our consolidated financial position, results of operations and cash flows. Our future effective tax rates may be adversely affected by a number of factors including:
|
|
· |
changes in tax laws in the countries in which we operate or the interpretation of such laws including the Base Erosion Profit Shifting, or BEPS, project being conducted by the Organization for Economic Co-operation and Development and the appeal of the U.S. tax court’s recent opinion on the exclusion of stock compensation expense in inter-company cost sharing arrangement; |
|
|
· |
increase in expenses not deductible for tax purposes; |
|
|
· |
changes in share-based compensation expense; |
|
|
· |
change in the mix of income among different taxing jurisdictions; |
|
|
· |
audit examinations with adverse outcomes; |
|
|
· |
changes in generally accepted accounting principles; and |
|
|
· |
our ability to use tax attributes such as research and development tax credits and net operating losses. |
Although we reserve for uncertain tax positions, including related penalties and interest, the amounts ultimately paid upon resolution of audits could be materially different from the amounts previously included in our income tax expense and therefore could have a material impact on our tax provision, net income and cash flows. In the event that actual results differ from these estimates or we adjust these estimates in future periods, we may need to record additional income tax expense or establish an additional valuation allowance, which could materially impact our financial position and results of operations. (See Note 9 of the Notes to Consolidated Financial Statements).
Changes in valuation allowance of deferred tax assets may affect our future operating results
We record a valuation allowance to reduce our net deferred tax assets to the amount that we believe is more-likely-than-not to be realized. In assessing the need for a valuation allowance, we consider historical levels of income, expectations and risks associated with estimates of future taxable income. We periodically evaluate our deferred tax asset balance for realizability. To the extent we believe it is more-likely-than-not that some portion of our deferred tax assets will not be realized, we will increase the valuation allowance against the deferred tax assets. Realization of our deferred tax assets is dependent primarily upon future taxable income in related tax jurisdictions. If our assumptions and consequently our estimates change in the future, the valuation allowances may be increased or decreased, resulting in a respective increase or decrease in income tax expense.
Risks Related to our Common Stock
The market price of our common stock may be volatile, which could cause the value of your investment to decline.
The trading prices of the securities of technology companies have been highly volatile. Further, our common stock has a limited trading history. Since our initial public offering in May 2007 through December 2015, our stock price has fluctuated from a low of $7.61 to a high of $76.38. We cannot predict the extent to which the trading market will continue to develop or how liquid the market may become. The trading price of our common stock is therefore likely to be highly volatile and could be subject to wide fluctuations in price in response to various factors, some of which are beyond our control. These factors include:
|
|
· |
quarterly variations in our results of operations or those of our competitors; |
|
|
· |
general economic conditions and slow or negative growth of related markets; |
|
|
· |
announcements by us or our competitors of design wins, acquisitions, new products, significant contracts, commercial relationships or capital commitments; |
24
|
|
· |
commencement of, or our involvement in, litigation; |
|
|
· |
disruption to our operations; |
|
|
· |
the emergence of new sales channels in which we are unable to compete effectively; |
|
|
· |
any major change in our board of directors or management; |
|
|
· |
changes in financial estimates including our ability to meet our future revenue and operating profit or loss projections; |
|
|
· |
changes in governmental regulations; and |
|
|
· |
changes in earnings estimates or recommendations by securities analysts. |
Furthermore, the stock market in general, and the market for semiconductor and other technology companies in particular, have experienced price and volume fluctuations that have often been unrelated or disproportionate to the operating performance of those companies. These broad market and industry factors may seriously harm the market price of our common stock, regardless of our actual operating performance. These trading price fluctuations may also make it more difficult for us to use our common stock as a means to make acquisitions or to use options to purchase our common stock to attract and retain employees. In addition, in the past, following periods of volatility in the overall market and the market price of a company’s securities, securities class action litigation has often been instituted against these companies. This litigation, if instituted against us, could result in substantial costs and a diversion of our management’s attention and resources.
Delaware law and our amended and restated certificate of incorporation and bylaws contain provisions that could delay or discourage takeover attempts that stockholders may consider favorable.
Provisions in our amended and restated certificate of incorporation and bylaws may have the effect of delaying or preventing a change of control or changes in our management. These provisions include the following:
|
|
· |
the division of our board of directors into three classes; |
|
|
· |
the right of the board of directors to elect a director to fill a vacancy created by the expansion of the board of directors or due to the resignation or departure of an existing board member; |
|
|
· |
the prohibition of cumulative voting in the election of directors, which would otherwise allow less than a majority of stockholders to elect director candidates; |
|
|
· |
the requirement for the advance notice of nominations for election to the board of directors or for proposing matters that can be acted upon at a stockholders’ meeting; |
|
|
· |
the ability of our board of directors to alter our bylaws without obtaining stockholder approval; |
|
|
· |
the ability of the board of directors to issue, without stockholder approval, up to 10,000,000 shares of preferred stock with terms set by the board of directors, which rights could be senior to those of our common stock; |
|
|
· |
the elimination of the rights of stockholders to call a special meeting of stockholders and to take action by written consent in lieu of a meeting; |
|
|
· |
the required approval of at least 66 2/3% of the shares entitled to vote at an election of directors to adopt, amend or repeal our bylaws or repeal the provisions of our amended and restated certificate of incorporation regarding the election and removal of directors and the inability of stockholders to take action by written consent in lieu of a meeting; and |
|
|
· |
the required approval of at least a majority of the shares entitled to vote at an election of directors to remove directors without cause. |
In addition, because we are incorporated in Delaware, we are governed by the provisions of Section 203 of the Delaware General Corporation Law. These provisions may prohibit large stockholders, particularly those owning 15% or more of our outstanding voting stock, from merging or combining with us. These provisions in our amended and restated certificate of incorporation and bylaws and under Delaware law could discourage potential takeover attempts, could reduce the price that investors are willing to pay for shares of our common stock in the future and could potentially result in the market price being lower than they would without these provisions.
25
Item 1B. Unresolved Staff Comments
Not applicable.
Our principal executive office is located in a leased facility in San Jose, California, consisting of approximately 224,300 square feet of office space under lease that expires in October 2022. This facility accommodates our principal software engineering, sales, marketing, operations and finance and administrative activities.
We also currently occupy a space in Marlborough, Massachusetts, consisting of approximately 97,200 square feet of office space under a lease that expires in November 2021. This accommodates a portion of our product design team. Internationally, we lease offices in Hyderabad and Bangalore, India pursuant to leases agreements, which accommodate a portion of our product design team. In addition, we lease office spaces that are not considered principal offices in Shanghai and Beijing, China; Hsin-Chu, Taiwan; Singapore; and Madrid, Spain, which accommodate our product design teams, as well as other operations and administrative activities.
We do not own any real property. We believe that our leased facilities are adequate to meet our current needs and that additional facilities are available for lease to meet future needs.
From time to time, we may be involved in legal proceedings arising in the ordinary course of our business. As of the date of this Annual Report on Form 10-K, we are not currently a party to any legal proceedings the outcome of which, if determined adversely to us, would individually or in the aggregate have a material adverse effect on our business, operating results, financial condition or cash flows.
Item 4. Mine Safety Disclosure
Not applicable.
26
Item 5. Market for Registrant’s Common Equity, Related Stockholder Matters and Issuer Purchases of Equity Securities
Market Information for Common Stock
Our common stock has been quoted on The NASDAQ Global Select Market under the symbol “CAVM” since our initial public offering on May 2, 2007. Prior to that time, there was no public market for our common stock. As of February 16, 2016, there were approximately 36 holders of record (not including beneficial holders of stock held in street names) of our common stock.
The following table sets forth for the indicated periods the high and low closing sales prices of our common stock as reported by The NASDAQ Global Select Market.
|
|
|
2015 |
|
|
2014 |
|
|
2013 |
|
|||||||||||||||
|
|
|
High |
|
|
Low |
|
|
High |
|
|
Low |
|
|
High |
|
|
Low |
|
||||||
|
Fourth quarter |
|
$ |
73.40 |
|
|
$ |
61.26 |
|
|
$ |
63.45 |
|
|
$ |
39.34 |
|
|
$ |
41.79 |
|
|
$ |
33.34 |
|
|
Third quarter |
|
|
74.03 |
|
|
|
57.98 |
|
|
|
56.18 |
|
|
|
44.28 |
|
|
|
41.20 |
|
|
|
34.99 |
|
|
Second quarter |
|
|
76.38 |
|
|
|
63.55 |
|
|
|
52.87 |
|
|
|
40.64 |
|
|
|
37.82 |
|
|
|
29.60 |
|
|
First quarter |
|
|
73.81 |
|
|
|
57.16 |
|
|
|
46.44 |
|
|
|
32.63 |
|
|
|
39.39 |
|
|
|
30.96 |
|
Dividend Policy
We have never paid any cash dividends on our common stock. Our board of directors currently intends to retain any future earnings to support operations and to finance the growth and development of our business and does not intend to pay cash dividends on our common stock for the foreseeable future. Any future determination related to our dividend policy will be made at the discretion of our board.
Stock Performance Graph(1)
The following line graph compares the yearly percentage change in the cumulative total stockholder return on our common stock against the total cumulative return of (i) the NASDAQ Composite Index and (ii) Standard and Poors, or S&P, Semiconductor Select Industry Index for the last five years. This graph assumes the investment of $100,000 on December 31, 2010, in our common stock or indexes and assumes the reinvestment of dividends, if any. The stockholder return shown in the graph below is not necessarily indicative of, nor is it intended to forecast, the potential future performance of our common stock, and we do not make or endorse any predictions as to future stockholder returns.
COMPARISON OF 5 YEAR CUMULATIVE TOTAL RETURN
Among Cavium, Inc., the Nasdaq Composite Index,
and the S&P Semiconductors Index
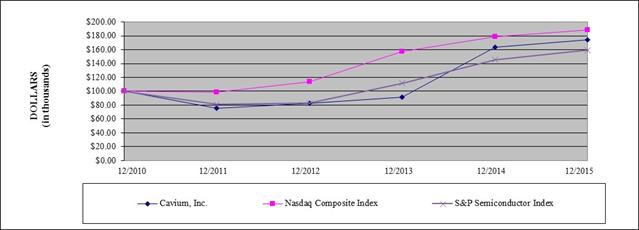
27
|
|
12/31/2011 |
|
|
12/31/2012 |
|
|
12/31/2013 |
|
|
12/31/2014 |
|
|
12/31/2015 |
|
||||||
|
|
|
(in thousands) |
|
|||||||||||||||||
|
Cavium, Inc. |
|
$ |
75.45 |
|
|
$ |
82.83 |
|
|
$ |
91.59 |
|
|
$ |
164.07 |
|
|
$ |
174.39 |
|
|
Nasdaq Composite Index |
|
|
98.20 |
|
|
|
113.82 |
|
|
|
157.44 |
|
|
|
178.53 |
|
|
|
188.75 |
|
|
S&P Semiconductor Index |
|
|
81.06 |
|
|
|
82.62 |
|
|
|
111.84 |
|
|
|
145.69 |
|
|
|
159.44 |
|
|
(1) |
This Section is not “soliciting material,” is not deemed “filed” with the SEC and is not to be incorporated by reference in any filing of Cavium under the Securities Act of 1933, as amended, or the Securities Exchange Act of 1934 Act, as amended, whether made before or after the date hereof and irrespective of any general incorporation language in any such filing. |
Item 6. Selected Financial Data
The following selected consolidated financial data should be read in conjunction with our audited consolidated financial statements and related notes thereto and with “Management’s Discussion and Analysis of Financial Condition and Results of Operations” section and other financial information included elsewhere in this Annual Report on Form 10-K. The consolidated statements of operations data for each of the years ended December 31, 2015, 2014 and 2013, and the summary consolidated balance sheet data as of December 31, 2015 and 2014, are derived from our audited consolidated financial statements included elsewhere in this Annual Report on Form 10-K. The consolidated statements of operations data for the years ended December 31, 2012 and 2011, and the summary consolidated balance sheet data as of December 31, 2013, 2012 and 2011, are derived from audited consolidated financial statements which are not included in this Annual Report on Form 10-K. Our historical results are not necessarily indicative of the results to be expected in any future period.
|
|
|
Year Ended December 31, |
|
|||||||||||||||||
|
|
|
2015 |
|
|
2014 |
|
|
2013 |
|
|
2012 |
|
|
2011 |
|
|||||
|
|
|
(in thousands, except per share data) |
|
|||||||||||||||||
|
Consolidated Statements of Operations Data: |
|
|
|
|
|
|
|
|
|
|
|
|
|
|
|
|
|
|
|
|
|
Net revenue |
|
$ |
412,744 |
|
|
$ |
372,978 |
|
|
$ |
303,993 |
|
|
$ |
235,480 |
|
|
$ |
259,205 |
|
|
Cost of revenue |
|
|
143,767 |
|
|
|
138,359 |
|
|
|
114,679 |
|
|
|
102,602 |
|
|
|
104,281 |
|
|
Gross profit |
|
|
268,977 |
|
|
|
234,619 |
|
|
|
189,314 |
|
|
|
132,878 |
|
|
|
154,924 |
|
|
Operating expenses: |
|
|
|
|
|
|
|
|
|
|
|
|
|
|
|
|
|
|
|
|
|
Research and development |
|
|
203,778 |
|
|
|
171,690 |
|
|
|
134,596 |
|
|
|
109,943 |
|
|
|
92,197 |
|
|
Sales, general and administrative |
|
|
78,926 |
|
|
|
70,404 |
|
|
|
64,088 |
|
|
|
71,794 |
|
|
|
66,771 |
|
|
Goodwill impairment |
|
|
- |
|
|
|
- |
|
|
|
- |
|
|
|
27,680 |
|
|
|
- |
|
|
Total operating expenses |
|
|
282,704 |
|
|
|
242,094 |
|
|
|
198,684 |
|
|
|
209,417 |
|
|
|
158,968 |
|
|
Loss from operations |
|
|
(13,727 |
) |
|
|
(7,475 |
) |
|
|
(9,370 |
) |
|
|
(76,539 |
) |
|
|
(4,044 |
) |
|
Other expense, net: |
|
|
|
|
|
|
|
|
|
|
|
|
|
|
|
|
|
|
|
|
|
Interest expense |
|
|
(1,241 |
) |
|
|
(1,472 |
) |
|
|
(1,502 |
) |
|
|
(646 |
) |
|
|
(229 |
) |
|
Change in estimated fair value of notes payable and other |
|
|
- |
|
|
|
(14,888 |
) |
|
|
- |
|
|
|
- |
|
|
|
- |
|
|
Other, net |
|
|
(410 |
) |
|
|
(347 |
) |
|
|
(879 |
) |
|
|
(157 |
) |
|
|
(179 |
) |
|
Total other expense, net |
|
|
(1,651 |
) |
|
|
(16,707 |
) |
|
|
(2,381 |
) |
|
|
(803 |
) |
|
|
(408 |
) |
|
Loss before income taxes |
|
|
(15,378 |
) |
|
|
(24,182 |
) |
|
|
(11,751 |
) |
|
|
(77,342 |
) |
|
|
(4,452 |
) |
|
Provision for (benefit from) income taxes |
|
|
1,682 |
|
|
|
1,633 |
|
|
|
1,937 |
|
|
|
36,321 |
|
|
|
(4,485 |
) |
|
Net income (loss) |
|
|
(17,060 |
) |
|
|
(25,815 |
) |
|
|
(13,688 |
) |
|
|
(113,663 |
) |
|
|
33 |
|
|
Net loss attributable to non-controlling interest |
|
|
- |
|
|
|
(10,520 |
) |
|
|
(10,723 |
) |
|
|
(1,031 |
) |
|
|
- |
|
|
Net income (loss) attributable to the Company |
|
$ |
(17,060 |
) |
|
$ |
(15,295 |
) |
|
$ |
(2,965 |
) |
|
$ |
(112,632 |
) |
|
$ |
33 |
|
|
|
|
|
|
|
|
|
|
|
|
|
|
|
|
|
|
|
|
|
|
|
|
Earnings per share attributable to the Company: |
|
|
|
|
|
|
|
|
|
|
|
|
|
|
|
|
|
|
|
|
|
Net income (loss) per common share, basic |
|
$ |
(0.31 |
) |
|
$ |
(0.29 |
) |
|
$ |
(0.06 |
) |
|
$ |
(2.26 |
) |
|
$ |
0.00 |
|
|
Shares used in computing basic net income (loss) per common share |
|
|
55,589 |
|
|
|
53,451 |
|
|
|
51,596 |
|
|
|
49,886 |
|
|
|
48,311 |
|
|
Net income (loss) per common share, diluted |
|
$ |
(0.31 |
) |
|
$ |
(0.29 |
) |
|
$ |
(0.06 |
) |
|
$ |
(2.26 |
) |
|
$ |
0.00 |
|
|
Shares used in computing diluted net income (loss) per common share |
|
|
55,589 |
|
|
|
53,451 |
|
|
|
51,596 |
|
|
|
49,886 |
|
|
|
50,771 |
|
28
|
|
As of December 31, |
|
||||||||||||||||||
|
|
|
2015 |
|
|
2014 |
|
|
2013 |
|
|
2012 |
|
|
2011 |
|
|||||
|
|
|
(in thousands, except per share data) |
|
|||||||||||||||||
|
Consolidated Balance Sheet Data: |
|
|
|
|
|
|
|
|
|
|
|
|
|
|
|
|
|
|
|
|
|
Cash and cash equivalents |
|
$ |
134,646 |
|
|
$ |
131,718 |
|
|
$ |
127,763 |
|
|
$ |
76,784 |
|
|
$ |
63,225 |
|
|
Working capital |
|
|
196,772 |
|
|
|
177,453 |
|
|
|
151,071 |
|
|
|
109,682 |
|
|
|
111,427 |
|
|
Total assets |
|
|
433,993 |
|
|
|
408,860 |
|
|
|
367,985 |
|
|
|
331,504 |
|
|
|
360,257 |
|
|
|
|
|
|
|
|
|
|
|
|
|
|
|
|
|
|
|
|
|
|
|
|
Capital lease and technology license obligations |
|
|
30,466 |
|
|
|
45,896 |
|
|
|
33,395 |
|
|
|
41,332 |
|
|
|
7,104 |
|
|
Notes payable and other |
|
|
- |
|
|
|
- |
|
|
|
13,512 |
|
|
|
5,012 |
|
|
|
- |
|
|
Other non-current liabilities |
|
|
6,379 |
|
|
|
5,767 |
|
|
|
4,275 |
|
|
|
4,391 |
|
|
|
8,708 |
|
|
Common stock and additional paid-in capital |
|
|
543,312 |
|
|
|
489,035 |
|
|
|
443,641 |
|
|
|
398,184 |
|
|
|
352,153 |
|
|
Total stockholders’ equity attributable to the Company |
|
|
353,900 |
|
|
|
316,683 |
|
|
|
286,584 |
|
|
|
244,092 |
|
|
|
310,693 |
|
The selected consolidated financial data presents financial information in the relevant periods of our business combinations and divestitures. See Note 5 of Notes to Consolidated Financial Statements for further discussions of our recent business combinations and divestitures.
Item 7. Management’s Discussion and Analysis of Financial Condition and Results of Operations
The following discussion should be read in conjunction with the Consolidated Financial Statements and the related notes that appear elsewhere in the document.
The information in this Item 7, as well as in other sections of this Annual Report on Form 10-K, contains forward-looking statements that are subject to risks and uncertainties. In some cases, you can identify forward-looking statements by terms such as “may,” “will,” “should,” “could,” “would,” “estimate,” “project,” “predict,” “potential,” “continue,” “strategy,” “believe,” “anticipate,” “plan,” “expect,” “intend” and similar expressions intended to identify forward-looking statements. See the section entitled “Forward Looking Statements” at the beginning of this Form 10-K for information you should consider when reading these forward-looking statements.
OCTEON®, OCTEON Fusion-MTM, OCTEON XL®, LiquidIO®, LiquidSecurity TM, NITROX®, NEURON SearchTM, ThunderX®, XpliantTM and XPATM are trademarks or registered trademarks of Cavium, Inc.
29
We are a provider of highly integrated semiconductor processors that enable intelligent processing for networking, communications, storage, wireless, security, video and connected home and office applications. We sell our products to providers of networking equipment that sell into the enterprise, datacenter, service provider, and broadband and consumer markets. Our products are systems on a chip, or SoCs, which incorporate single or multiple processor cores, a highly integrated architecture and customizable software that is based on a broad range of standard operating systems. We focus our resources on the design, sales and marketing of our products, and outsource the manufacturing of our products. The following summarizes our product timeline introduction:
|
Timeline |
|
History |
|
2000 through 2003 |
· |
We were incorporated and commenced product development. |
|
|
· |
We began shipping NITROX security processors commercially. |
|
2004 |
· |
We introduced and commenced commercial shipments of NITROX Soho. |
|
2006 |
· |
We commenced our first commercial shipments of OCTEON multi-core processors. |
|
2007 |
· |
We introduced our new line of OCTEON based storage services processors designed to address the specific needs in the storage market, as well as other new products in the OCTEON and NITROX families. |
|
2008 |
· |
We expanded our OCTEON and NITROX product families with new products including wireless services processors to address the needs for wireless infrastructure equipment. |
|
2009 |
· |
We announced the OCTEON II Internet Application Processor, or IAP, family multi-core MIPS64 processors. |
|
|
· |
We acquired MontaVista Software, Inc. in December 2009. This acquisition complemented our broad portfolio of multi-core processors to deliver integrated and optimized embedded solutions to the market. |
|
2010 |
· |
We announced the next generation NITROX III, a processor family with 16 to 64-cores that delivers security and compression processors for application delivery, cloud computing and wide area network optimization. |
|
2011 |
· |
We introduced NEURON, a new search processor product family that targets a wide range of high performance, L2-L4 network search applications in enterprise and service provider infrastructure equipment. |
|
|
· |
We also introduced another new product family, the OCTEON Fusion, a single chip SoCs with up to 6x MIPS64 cores and up to 8x LTE/3G baseband DSP cores which enable macro base station class features for small cell base stations. |
|
2012 |
· |
We introduced OCTEON III, Cavium’s 48-core 2.5GHz multi-core processor family that can deliver up to 100Gbps of application processing, up to 120GHz of 64-bit compute processing per chip and can be connected in multi-chip configurations. |
|
|
· |
We announced Project Thunder, the development of a new family of 64-bit ARMv8 scalable multi-core processors for cloud and datacenter applications. |
|
2013 |
· |
We introduced the LiquidIO family of 10 Gigabit Server Adapters which provide high-performance, programmable adapter platform to enable software defined networks for cloud service providers and datacenters. |
|
2014 |
· |
We introduced the ThunderX family of 64-bit ARMv8 processors incorporated into a highly differentiated SoC architecture optimized for cloud and datacenter applications. |
|
2015 |
· |
We introduced Octeon Fusion-M, a family of single chip solutions for next generation macrocell base stations and smart radio heads. |
|
|
· |
We introduced LiquidSecurity, a high performance hardware based transaction security solution for cloud data centers, enterprise, government organizations and ecommerce applications. |
|
|
· |
We introduced Nitrox V, a processor family with up to 288 cores for security in the enterprise and virtualized cloud data centers. |
30
The following summarizes our acquisitions in the last five years:
|
|
· |
We acquired Celestial Systems, Inc. in October 2010. With the acquisition of Celestial Systems, we gained additional professional services such as Digital Media product development and Android commercialization and support. |
|
|
· |
We completed the acquisition of substantially all of the assets and assumed certain liabilities of Wavesat Inc. in January 2011. This acquisition added multicore wireless digital system processing to our embedded processor product line. |
|
|
· |
We completed the acquisition of substantially all of the assets and assumed certain liabilities of Celestial Semiconductor, Ltd. in March 2011. With the acquisition of Celestial Semiconductor, we added capabilities to enable a processor family targeted for the large and growing market of converged media, gateway and wireless display applications. |
|
|
· |
We completed the acquisition of Xpliant, Inc. in April 2015. This acquisition provided high performance, high density switch silicon that targets a broad range of switching applications for the data center, cloud service provider and enterprise markets. |
Since inception, we have invested heavily in new product development and our net revenue has grown from $7.4 million in 2004 to $412.7 million in 2015. We expect sales of our products for use in the enterprise, data center and service provider markets to continue to represent a significant portion of our revenue in the foreseeable future, and also expect some growth in the broadband market.
We primarily sell our products to original equipment manufacturers, or OEMs, either directly or through their contract manufacturers. Contract manufacturers purchase our products only when an OEM incorporates our product into the OEM’s product, not as commercial off-the-shelf products. Our customers’ products are complex and require significant time to define, design and ramp to volume production. Accordingly, our sales cycle is long. This cycle begins with our technical marketing, sales and field application engineers engaging with our customers’ system designers and management, which is typically a multi-month process. If we are successful, a customer will decide to incorporate our product in its product, which we refer to as a design win. Because the sales cycles for our products are long, we incur expenses to develop and sell our products, regardless of whether we achieve the design win and well in advance of generating revenue, if any, from those expenditures. We do not have long-term purchase commitments from any of our customers, as sales of our products are generally made under individual purchase orders. However, once one of our products is incorporated into a customer’s design, it is likely to remain designed in for the life cycle of the product. We believe this to be the case because a redesign would generally be time consuming and expensive. We have experienced revenue growth due to an increase in the number of our products, an expansion of our customer base, an increase in the number of average design wins within any one customer and an increase in the average revenue per design win.
We also earn revenue from the sale of software subscriptions of embedded Linux operating system, related development tools, support and professional services. The net revenue for our software and services operations is primarily derived from the sale of time-based software licenses, software maintenance and support, and from professional services arrangements and training.
Key Business Metrics
Design Wins. We closely monitor design wins by customer and end market on a periodic basis. We consider design wins to be a key ingredient in our future success, although the revenue generated by each design win can vary significantly. Our long-term sales expectations are based on internal forecasts from specific customer design wins based upon the expected time to market for end customer products deploying our products and associated revenue potential.
Pricing and Margins. Pricing and margins depend on the features of the products we provide to our customers. In general, products with more complex configurations and higher performance tend to be priced higher and have higher gross margins. These configurations tend to be used in high performance applications that are focused on the enterprise network, data center, and access and service provider markets. We tend to experience price decreases over the life cycle of our products, which can vary by market and application.
Sales Volume. A typical design win can generate a wide range of sales volumes for our products, depending on the end market demand for our customers’ products. This can depend on several factors, including the reputation, market penetration, the size of the end market that the product addresses, and the marketing and sales effectiveness of our customer. In general, our customers with greater market penetration and better branding tend to develop products that generate larger volumes over the product life cycle. In addition, some markets generate large volumes if the end market product is adopted by the mass market.
31
Customer Product Life Cycle. We typically commence commercial shipments from six months to three years following a design win. Once our product is in production, revenue from a particular customer may continue for several years. We estimate our customers’ product life cycles based on the customer, type of product and end market. In general, products that go into the enterprise network and data center take longer to reach volume production but tend to have longer lives. Products for other markets, such as broadband and consumer, tend to ramp relatively quickly, but generally have shorter life cycles. We estimate these life cycles based on our management’s experience with network equipment providers and data centers as well as the semiconductor market as a whole.
Critical Accounting Policies and Estimates
Our management’s discussion and analysis of our financial condition and results of operations is based on our consolidated financial statements, which have been prepared in accordance with United States generally accepted accounting principles, or GAAP. These accounting principles require us to make certain estimates and judgments that can affect the reported amounts of assets and liabilities as of the dates of the consolidated financial statements, the disclosure of contingencies as of the dates of the consolidated financial statements, and the reported amounts of revenue and expenses during the periods presented. We base our estimates on historical experience and on various other assumptions that we believe to be reasonable under the circumstances, the results of which form the basis for making judgments about the carrying values of assets and liabilities. If actual results or events differ materially from those contemplated by us in making these estimates, our reported financial condition and results of operations for future periods could be materially affected. See “Risk Factors” for certain matters that may affect our future financial condition or results of operations.
An accounting policy is deemed to be critical if it requires an accounting estimate to be made based on assumptions about matters that are uncertain at the time the estimate is made, if different estimates reasonably could have been used, or if the changes in estimate that are reasonably likely to occur could materially impact the financial statements. Our management has discussed the development, selection and disclosure of these estimates with the Audit Committee of our Board of Directors. See Note 1 of Notes to Consolidated Financial Statements for a more comprehensive discussion of our significant accounting policies. We believe the following critical accounting policies reflect significant judgments and estimates used in the preparation of our consolidated financial statements:
|
|
· |
revenue recognition; |
|
|
· |
stock-based compensation; |
|
|
· |
inventory valuation; |
|
|
· |
accounting for income taxes; |
|
|
· |
mask costs; |
|
|
· |
business combinations; and |
|
|
· |
valuation of goodwill and intangible assets. |
Revenue Recognition
We primarily derive our revenue from sales of semiconductor products to OEMs, or through OEM’s contract manufacturers or distributors. To a lesser extent, we also derive revenue from licensing software and related maintenance and support and from professional service arrangements.
We recognizes revenue when (i) persuasive evidence of a binding arrangement exists; (ii) delivery has occurred or service has been rendered; (iii) the price is deemed fixed or determinable and free of contingencies and significant uncertainties; and (iv) collectibility is reasonably assured. We record a reduction in revenue for provision for estimated sales returns in the same period the related revenues are recorded. These estimates are based on historical patterns of return, analysis of credit memo data and other known factors at the time. Revenue is recognized upon shipment to distributors with limited rights of returns and price protection if we conclude it can reasonably estimate the credit for returns and price adjustments issuable. We record an estimated allowance, at the time of shipment, based on our historical patterns of returns and pricing credit of sales recognized upon shipment. Credits issued to distributors or other customers have historically not been material. The inventory at these distributors at the end of the period may fluctuate from time to time mainly due to the OEM production ramps and/or new customer demands.
32
Software arrangements typically include time-based licenses for 12 months with related support. We do not sell support separately, therefore, revenue from software arrangements is recognized ratably over the support period. The software arrangement may also include professional services, and these services may be purchased separately. Professional services engagements are billed on either a fixed-fee or time-and-materials basis. For fixed-fee arrangements, professional services revenue is recognized under the proportional performance method, with the associated costs included in cost of revenue. We estimate the proportional performance of the arrangements based on an analysis of progress toward completion. We periodically evaluate the actual status of each project to ensure that the estimates to complete each contract remain accurate, and a loss is recognized when the total estimated project cost exceeds project revenue. If the amount billed exceeds the amount of revenue recognized, the excess amount is recorded as deferred revenue. Revenue recognized in any period is dependent on progress toward completion of projects in progress. To the extent we are unable to estimate the proportional performance, revenue is recognized on a completed performance basis. Revenue for time-and-materials engagements is recognized as the effort is incurred.
Stock-Based Compensation
We apply the fair value recognition provisions of stock-based compensation. Stock-based compensation expense is measured at the grant date based on the fair value of the award and is recognized as compensation expense net of an estimated forfeiture rate over the vesting period. We use the Black-Scholes option-pricing model to determine the fair value of stock options, which require various subjective assumptions, such as expected volatility, expected term and the risk-free interest rates. Our stock price volatility assumption is estimated using our historical stock price volatility. We use the simplified method as permitted by the provisions on stock-based compensation to estimate the expected term since we do not have sufficient history of weighted average period from the date of grant to exercise, cancellation, or expiration. The risk free interest rate is based on the implied yield currently available on U.S. Treasury securities with an equivalent remaining term. The assumptions used in calculating the fair value of stock-based awards represent management’s best estimates and judgment.
For all restricted stock unit, or RSU, grants other than RSU grants with market condition, the fair value of the RSU grant is based on the market price of our common stock on the date of grant. For performance-based RSU grants, we evaluate the probability of achieving the milestones for each of the outstanding performance-based RSU grants at each reporting period and update the related stock-based compensation expense. The fair value of market-based RSUs is determined using the Monte Carlo simulation method which takes into account multiple input variables that determine the probability of satisfying the market conditions stipulated in the award. This method requires the input of assumptions, including the expected volatility of our common stock, and a risk-free interest rate, similar to assumptions used in determining the fair value of the stock option grants discussed above. The grant date fair value of RSUs, less estimated forfeitures, is recorded on a straight-line basis, over the vesting period.
Inventory Valuation
Inventories are stated at the lower of cost (determined using the first-in, first-out method), or market value (estimated net realizable value). We write down excess and obsolete inventory based on its age and forecasted demand, generally over a 12 month period, though for some long lived products we forecast using a longer time period which could extend 24 to 30 months. Demand is impacted by market and economic conditions, technology advances, new product introductions and changes in strategic direction which requires management to make estimates that may include uncertain elements. In addition, our industry is characterized by rapid technological change, frequent new product development and rapid product obsolescence that could result in an increase in the amount of obsolete inventory quantities on hand. Additionally, our estimates of future product demand may prove to be inaccurate, in which case we may have understated or overstated the provision required for excess and obsolete inventory. In the future, if our inventory is determined to be overvalued, we would be required to recognize such costs in our cost of goods sold at the time of such determination. Likewise, if our inventory is determined to be undervalued, we may have over-reported our cost of goods sold in previous periods and would be required to recognize additional gross margin at the time the related inventory is sold. Therefore, although we make every effort to ensure the accuracy of our forecasts of future product demand, any significant unanticipated changes in demand or technological developments could have a significant impact on the value of our inventory and our results of operations.
Accounting for Income Taxes
We account for income taxes under the asset and liability approach. Under this method, deferred tax assets, including those related to tax loss carryforwards and credits, and liabilities are determined based on the differences between the financial statement and tax bases of assets and liabilities using enacted tax rates in effect for the year in which the differences are expected to reverse. We recognize uncertain tax positions when it meets a more-likely-than-not threshold. We recognize potential accrued interest and penalties related to unrecognized tax benefits as income tax expense.
33
A valuation allowance is recorded to reduce deferred tax assets when management cannot conclude that it is more-likely-than-not that the net deferred tax asset will be recovered. The valuation allowance is determined by assessing both positive and negative evidence to determine whether it is more-likely-than-not that deferred tax assets are recoverable; such assessment is required on a jurisdiction-by-jurisdiction basis. Significant judgment is required in determining whether the valuation allowance should be recorded against deferred tax assets. In assessing the need for valuation allowance, we consider all available evidence including past operating results and estimates of future taxable income. Since 2012, we assessed that it is more-likely-than-not that we will not realize our federal and state deferred tax assets based on the absence of sufficient positive objective evidence that we would generate sufficient taxable income in our United States tax jurisdiction to realize the deferred tax assets. Accordingly, we recorded a valuation allowance on our federal and state deferred tax assets. We periodically evaluate the realizability of our net deferred tax assets based on all available evidence, both positive and negative. The realization of net deferred tax assets is dependent on our ability to generate sufficient future taxable income during periods prior to the expiration of tax attributes to fully utilize these assets. We weighed both positive and negative evidence and determined that there is a continued need for a valuation allowance as we are in a cumulative loss position over the previous three years, which is considered significant negative evidence. As such, we have not changed our judgment regarding the need for a full valuation allowance on our federal and state deferred tax assets as of December 31, 2015. However, continued improvement in our operating results, conditioned on successfully generating increased revenue and managing costs, and the U.S. tax court’s recent opinion to exclude stock compensation expense in the inter-company cost sharing arrangement, if reversed, could lead to reversal of substantially all of the valuation allowance on our federal and state deferred tax assets. Until such time, consumption of tax attributes to offset profits will reduce the overall level of deferred tax assets subject to valuation allowance. Should we determine that we would be able to realize our remaining deferred tax assets in the foreseeable future, an adjustment to our remaining deferred tax assets would cause a material increase to net income in the period such determination is made.
Our provision for income taxes for 2015, 2014 and 2013 was primarily related to earnings in foreign jurisdictions and foreign tax rate differential. In the future, we may expand our international operations and staff to better support our expansion into international markets. Our foreign subsidiaries have licensed certain rights to the existing intellectual property and intellectual property that will be developed or licensed in the future. As a result of these anticipated changes and an expanding customer base in Asia, we expect that an increasing percentage of our consolidated pre-tax income will be derived from, and reinvested in, our Asian operations. We anticipate that this pre-tax income will be subject to foreign tax at relatively lower tax rates when compared to the United States federal statutory tax rate. Further, because we established a valuation allowance against our deferred tax assets in the United States, combined with lower foreign tax rates, our effective income tax rate is expected to be lower than the United States federal statutory rate.
Mask Costs
We incur costs for the fabrication of masks used by our contract manufacturers to manufacture wafers that incorporate our products. We capitalize the costs of fabrication masks that are reasonably expected to be used during production manufacturing. These amounts are included within property and equipment and are depreciated over a period of 12 to 24 months to cost of revenue. If we do not reasonably expect to use the fabrication mask during production manufacturing, we expense the related mask costs to research and development in the period in which such determination is made.
Business Combinations
We account for business combinations using the purchase method of accounting. We determine the recognition of intangible assets based on the following criteria: (i) the intangible asset arises from contractual or other rights; or (ii) the intangible is separable or divisible from the acquired entity and capable of being sold, transferred, licensed, returned or exchanged. In accordance with the guidance provided under business combinations, we allocate the purchase price of business combinations to the tangible assets, liabilities and intangible assets acquired, including in-process research and development, or IPR&D, based on their estimated fair values. We record the excess purchase price over those fair values as goodwill. Management’s valuation of acquired net assets requires significant estimates, especially with respect to intangible assets. Critical estimates in valuing certain intangible assets includes future expected cash flows from customer contracts, customer lists, and distribution agreements and acquired developed technologies, expected costs to develop IPR&D into commercially viable products, estimated cash flows from projects when completed and discount rates. Other estimates associated with the accounting for acquisitions may change as additional information becomes available regarding the assets acquired and liabilities assumed. We expense acquisition-related costs, including advisory, legal, accounting, valuation and other costs, in the periods in which the costs are incurred. The results of operations of acquired businesses are included in the consolidated financial statements from the acquisition date.
34
Valuation of Goodwill and Intangible Assets
Goodwill is measured as the excess of the cost of an acquisition over the sum of the amounts assigned to tangible and identifiable intangible assets and liabilities assumed. We evaluate goodwill for impairment at our single reporting unit level at least on an annual basis in the fourth quarter of the calendar year or whenever events and changes in circumstances suggest that the carrying amount may not be recoverable from its estimated future cash flows. We perform qualitative assessment to determine if any events have occurred or circumstances exist that would indicate that it is more-likely-than-not that a goodwill impairment exists. The qualitative factors include, but are not limited to: (a) macroeconomic conditions; (b) industry and market considerations; (c) overall financial performance; (d) a significant adverse change in legal factors or in the business climate; (e) an adverse action or assessment by a regulator; (f) relevant entity-specific events including changes in management, strategy or customers; (g) a more-likely-than-not expectation of sale or disposal of a reporting unit or a significant portion thereof; or (h) sustained decrease in share price.
If any indicators exist based on the qualitative analysis that it is more-likely-than-not that a goodwill impairment exists, the quantitative test is required. Otherwise, no further testing is required. For quantitative analysis, we use a two-step impairment test to identify potential goodwill impairment and measure the amount of the goodwill impairment loss to be recognized. In the first step, we compare the fair value of our single reporting unit to its carrying value to determine if the goodwill is impaired. If the fair value of the reporting unit exceeds the carrying value of the net assets assigned to that unit, then goodwill is not impaired and no further testing is required. If the carrying value of the net assets assigned to the reporting unit were to exceed its fair value, we perform the second step to determine the implied fair value of the reporting unit’s goodwill and record an impairment loss for an amount equal to the difference between the implied fair value and the carrying value of the goodwill. Determining the fair value of a reporting unit is judgmental in nature and requires the use of significant estimates and assumptions.
We also perform an impairment review of finite-lived intangible assets whenever events or changes in business circumstances indicate the carrying amount of the assets (or asset group) may not be fully recoverable. Whenever events or changes in circumstances suggest that the carrying amount of the finite-lived intangible assets may not be recoverable, we estimate the future cash flows expected to be generated by the asset (or asset group) from its use or eventual disposition. If the sum of the expected future undiscounted cash flows is less than the carrying amount of the assets (or asset group), we recognize an impairment loss based on the excess of the carrying amount over the fair value of the assets. Significant management judgment is required in the grouping of assets and forecasts of future operating results that are used in the impairment analysis. If our actual results, or the plans and estimates used in future impairment analyses are lower than the original estimates used to assess the recoverability of these assets, we could incur material impairment charges.
Results of Operations
Our net revenue, cost of revenue, gross profit and gross margin for the periods presented were:
|
|
|
Year Ended December 31, |
|
|||||||||
|
|
|
2015 |
|
|
2014 |
|
|
2013 |
|
|||
|
|
|
(in thousands) |
|
|||||||||
|
Net revenue |
|
$ |
412,744 |
|
|
$ |
372,978 |
|
|
$ |
303,993 |
|
|
Cost of revenue |
|
|
143,767 |
|
|
|
138,359 |
|
|
|
114,679 |
|
|
Gross Profit |
|
$ |
268,977 |
|
|
$ |
234,619 |
|
|
$ |
189,314 |
|
|
Gross Margin |
|
|
65.2 |
% |
|
|
62.9 |
% |
|
|
62.3 |
% |
Net Revenue. Our net revenue consists primarily of sales of our semiconductor products to providers of networking equipment and their contract manufacturers and distributors. Initial sales of our products for a new design are usually made directly to providers of networking equipment as they design and develop their product. Once their design enters production, they often outsource their manufacturing to contract manufacturers that purchase our products directly from us or from our distributors. We price our products based on market and competitive conditions and periodically reduce the price of our products, as market and competitive conditions change, and as manufacturing costs are reduced. We do not experience different margins on direct sales to providers of networking equipment and indirect sales through contract manufacturers because in all cases we negotiate product pricing directly with the providers of networking equipment. To date, substantially all of our revenue has been denominated in U.S. dollars.
Three customers together accounted for 42.9% and 44.4% of our net revenue for 2015 and 2014, respectively, and one customer accounted for 18.6% of our net revenue for 2013. No other customer accounted for more than 10% of our net revenue for 2015, 2014 and 2013.
35
Revenue and costs relating to sales to distributors are deferred if we grant more than limited rights of returns and price credits or if we cannot reasonably estimate the level of returns and credits issuable. We had an agreement with a distributor to distribute our products primarily in the United States. Given the terms of the distribution agreement, for sales to this distributor, we deferred revenue and costs until products were sold to our end customers. Revenue recognition depended on notification from this distributor that product had been sold to its end customers. We terminated the distribution agreement with this distributor effective May 2014. For 2014 and 2013, 1.5% and 6.4%, respectively, of our net revenue was from products sold by this distributor.
We use distributors to support some of our sales logistics including importation and credit management. Total net revenue through distributors, other than the distributor discussed above, accounted for 29.6%, 27.7% and 28.6% of our net revenue for 2015, 2014 and 2013, respectively. The inventory at these distributors at the end of the period may fluctuate from time to time mainly due to the OEM production ramps or new customer demands. While we have purchase agreements with our distributors, the distributors do not have long-term contracts with any of the equipment providers. Our distributor agreements limit the distributor’s ability to return product up to a portion of purchases in the preceding quarter. Given our experience, along with our distributors’ limited contractual return rights, we believe we can reasonably estimate expected returns from our distributors. Accordingly, we recognize sales through distributors at the time of shipment, reduced by our estimate of expected returns.
Our net revenue by markets for the periods presented was as follows:
|
|
Year Ended December 31, |
|
|||||||||
|
|
2015 |
|
|
2014 |
|
|
2013 |
|
|||
|
|
(in thousands) |
|
|||||||||
|
Enterprise network, data center and access and service provider markets |
$ |
377,809 |
|
|
$ |
341,056 |
|
|
$ |
259,860 |
|
|
Broadband and consumer markets |
|
34,935 |
|
|
|
31,922 |
|
|
|
44,133 |
|
|
|
$ |
412,744 |
|
|
$ |
372,978 |
|
|
$ |
303,993 |
|
The following table is based on the geographic location of our customers including the original equipment manufacturers, contract manufacturers or the distributors who purchased our products and services. For sales to our distributors, their geographic location may be different from the geographic locations of the ultimate end customers. Net revenue by geography for the periods presented was as follows:
|
|
Year Ended December 31, |
|
|||||||||
|
|
2015 |
|
|
2014 |
|
|
2013 |
|
|||
|
|
(in thousands) |
|
|||||||||
|
United States |
$ |
128,431 |
|
|
$ |
111,997 |
|
|
$ |
90,537 |
|
|
China |
|
100,980 |
|
|
|
93,045 |
|
|
|
77,965 |
|
|
Mexico |
|
34,452 |
|
|
|
27,184 |
|
|
|
22,572 |
|
|
Korea |
|
28,578 |
|
|
|
28,665 |
|
|
|
30,003 |
|
|
Taiwan |
|
34,533 |
|
|
|
29,229 |
|
|
|
26,023 |
|
|
Finland |
|
38,283 |
|
|
|
44,976 |
|
|
|
17,767 |
|
|
Germany |
|
13,272 |
|
|
|
10,335 |
|
|
|
5,947 |
|
|
Other countries |
|
34,215 |
|
|
|
27,547 |
|
|
|
33,179 |
|
|
Total |
$ |
412,744 |
|
|
$ |
372,978 |
|
|
$ |
303,993 |
|
Cost of Revenue and Gross Margin. We outsource wafer fabrication, assembly and test functions of our products. A significant portion of our cost of revenue consists of payments for the purchase of wafers and for assembly and test services, amortization related to capitalized mask costs and amortization of acquired intangibles. To a lesser extent, cost of revenue includes expenses relating to our internal operations that manage our contractors, stock-based compensation, the cost of shipping and logistics, royalties, inventory valuation expenses for excess and obsolete inventories, warranty costs and changes in product cost due to changes in sort, assembly and test yields. In general, our cost of revenue associated with a particular product declines over time as a result of yield improvements, primarily associated with design and test enhancements.
36
We use third-party foundries and assembly and test contractors, which are primarily located in Asia, to manufacture, assemble and test our semiconductor products. We currently outsource a substantial percentage of our integrated circuit manufacturing to Samsung, with the remaining manufacturing outsourced to TSMC and GlobalFoundries. We also outsource the sort, assembly, final testing and other processing of our product to third-party contractors, primarily ASE Electronics in Taiwan, Malaysia and Singapore, as well as ISE Labs, Inc., in the United States. We negotiate wafer fabrication on a purchase order basis. There are no long-term agreements with any of these third-party contractors. A significant disruption in the operations of one or more of these third-party contractors would impact the production of our products for a substantial period of time, which could have a material adverse effect on our business, financial condition and results of operations.
We also incur costs for the fabrication of masks used by our contract manufacturers to manufacture wafers that incorporate our products. During 2015, 2014 and 2013, we capitalized $8.9 million, $5.9 million and $3.6 million, respectively, of mask costs. As our product processes continue to mature and as we develop more history and experience, we expect to capitalize most or all of our mask costs in the future. We amortize the cost of fabrication masks that we reasonably expect to use for production manufacturing over a 12 to 24 month period. Total amortized expenses for the masks included in cost of revenue were $4.9 million, $2.6 million and $4.5 million for 2015, 2014 and 2013, respectively. The unamortized balance of capitalized mask costs at end of 2015 and 2014 was $9.6 million and $5.6 million, respectively.
Our gross margin has been and will continue to be affected by a variety of factors, including the product mix, average sales prices of our products, the amortization expense associated with the acquired intangible assets, the timing of cost reductions for fabricated wafers and assembly and test service costs, inventory valuation charges, the cost of fabrication masks that are capitalized and amortized, and the timing and changes in sort, assembly and test yields. Overall gross margin is impacted by the mix between higher performance, higher margin products and services and lower performance, lower margin products and services. In addition, we typically experience lower yields and higher associated costs on new products, which improve as production volumes increase.
Research and Development Expenses. Research and development expenses primarily include personnel costs, engineering design development software and hardware tools, allocated facilities expenses and depreciation of equipment used in research and development and stock-based compensation. We expect research and development expenses to continue to increase in total dollars to support the development of new products and improvement of existing products. Additionally, as a percentage of revenue, these costs fluctuate from one period to another. Total research and development expenses for the periods presented were:
|
|
|
Year Ended December 31, |
|
|||||||||
|
|
|
2015 |
|
|
2014 |
|
|
2013 |
|
|||
|
|
|
(in thousands) |
|
|||||||||
|
Research and development expenses |
|
$ |
203,778 |
|
|
$ |
171,690 |
|
|
$ |
134,596 |
|
|
Percent of total net revenue |
|
|
49.4 |
% |
|
|
46.0 |
% |
|
|
44.3 |
% |
Sales, General and Administrative Expenses. Sales, general and administrative expenses primarily include personnel costs, accounting and legal fees, information systems, sales commissions, trade shows, marketing programs, depreciation, allocated facilities expenses and stock-based compensation. We expect sales, general and administrative expenses to increase in absolute dollars to support our growing sales and marketing activities resulting from our expanded product portfolio. Total sales, general and administrative costs for the periods presented were:
|
|
|
Year Ended December 31, |
|
|||||||||
|
|
|
2015 |
|
|
2014 |
|
|
2013 |
|
|||
|
|
|
(in thousands) |
|
|||||||||
|
Sales, general and administrative expenses |
|
$ |
78,926 |
|
|
$ |
70,404 |
|
|
$ |
64,088 |
|
|
Percent of total net revenue |
|
|
19.1 |
% |
|
|
18.9 |
% |
|
|
21.1 |
% |
37
Other expense, net. Other expense, net primarily includes change in estimated fair value of notes payable and other, interest expense associated with capital lease and technology license obligations, interest expense associated with the notes payable, interest income on cash and cash equivalents and foreign currency gains and losses. Total other expense, net for the periods presented was:
|
|
|
Year Ended December 31, |
|
|||||||||
|
|
|
2015 |
|
|
2014 |
|
|
2013 |
|
|||
|
|
|
(in thousands) |
|
|||||||||
|
Interest expense |
|
$ |
(1,241 |
) |
|
$ |
(1,472 |
) |
|
$ |
(1,502 |
) |
|
Change in estimated fair value of notes payable and other |
|
|
- |
|
|
|
(14,888 |
) |
|
|
- |
|
|
Other, net |
|
|
(410 |
) |
|
|
(347 |
) |
|
|
(879 |
) |
|
Total other expense, net |
|
$ |
(1,651 |
) |
|
$ |
(16,707 |
) |
|
$ |
(2,381 |
) |
Provision for Income Taxes. The provision for income taxes and the effective tax rates for the periods presented were:
|
|
|
Year Ended December 31, |
|
|||||||||
|
|
|
2015 |
|
|
2014 |
|
|
2013 |
|
|||
|
|
|
(in thousands) |
|
|||||||||
|
Loss before income taxes |
|
$ |
(15,378 |
) |
|
$ |
(24,182 |
) |
|
$ |
(11,751 |
) |
|
Provision for income taxes |
|
|
1,682 |
|
|
|
1,633 |
|
|
|
1,937 |
|
|
Effective tax rate |
|
|
(10.9 |
)% |
|
|
(6.8 |
)% |
|
|
(16.5 |
)% |
Fiscal 2015 Compared to Fiscal 2014
Net Revenue. Our net revenue in 2015 increased by $39.8 million or 10.7% compared to 2014. The increase in net revenue was attributable mainly to the increase in sales in our enterprise network; data center and access and service provider markets, combined of $36.8 million and an increase in sales in our broadband and consumer market of $3.0 million. The overall increase in sales in our enterprise network; data center; and access and service provider markets and in our broadband and consumer market was mainly due to the fluctuation in demand for our products in those respective markets as a result of the timing of our customers’ volume production of our design wins.
Cost of revenue and Gross Margin. Cost of revenue increased in 2015 by $5.4 million or 3.9% compared to 2014 primarily due to the increase in net revenue. Gross margin increased by 2.3 percentage points from 62.9% in 2014 to 65.2% in 2015. The increase in gross margin was mainly due to a small shift of product sales mix to higher performance products and due to certain inventory write-downs in 2014. Higher performance products yield higher gross margins compared to our lower performance products. The increase in gross margin in 2015 compared to 2014 as discussed above was partially offset by the write-off made in 2015 of a mask that is no longer used.
Research and Development Expenses. Research and development expenses increased by $32.1 million or 18.7% in 2015 compared to 2014. The increase in research and development expenses was partly due to the increase in salaries and employee benefits of $9.1 million as a result of the increase in research and development headcount and increase in salary base rates. Depreciation and amortization expense increased by $9.3 million due to additional property and equipment and intangible assets acquired for research and development. Facilities expense, design tools and other miscellaneous research and development increased by $8.7 million as a result of the increase in research and development activities to support the development of our new products including those relating to Xpliant. Outsourced engineering services increased by $7.4 million mainly due to the timing of research and development work for Xpliant and for our new product families. In 2015, Xpliant acquired manufacturing rights from a third party vendor amounting to $7.5 million which was recorded as research and development expense. The increases as discussed above were partially offset by the decrease in stock-based compensation and related taxes of $2.9 million mainly due to certain RSU grants in 2014 pursuant to the merger agreement with Xpliant, partially offset by the increase in stock-based compensation resulting from the increase in research and development headcount. Further, in 2015, we recorded credits resulting from our research and development collaboration agreement with a customer. Research and development headcount was 774 at end of 2015 compared to 700 at end of 2014.
38
Sales, General and Administrative Expenses. Sales, general and administrative expenses increased by $8.5 million or 12.1% in 2015 compared to 2014. The increase in sales, general and administrative expenses was partly due to increase in salaries and employee benefits of $1.9 million as a result of the increase in sales, general and administrative headcount throughout the year and increase in salary base rates. Facilities, marketing and other miscellaneous sales, general and administrative expenses, combined increased by $4.7 million as a result of an increase in facilities and increase in marketing and sales related activities. Outside services increased by $1.9 million mainly due to increased legal services for intellectual property related matters. Sales, general and administrative headcount was 184 at end of 2015 compared to 187 at end of 2014.
Other Expense, Net. Other expense, net, decreased by $15.1 million in 2015 compared to 2014. The decrease was mainly due to the recognition of the change in the estimated fair value of notes payable and other of $14.9 million in 2014. See Note 5 of Notes to Consolidated Financial Statements for more detailed discussion. In addition, interest expense associated with capital lease and technology license obligations and notes payable decreased.
Provision for Income Taxes. The provision for income taxes slightly increased in 2015 compared to 2014. The increase was mainly due to the increase in foreign income taxes, partially offset by the decrease in U.S. deferred income taxes related to the indefinite lived intangible assets. The difference between the provision for income taxes that would be derived by applying the statutory rate to our loss before income taxes and the provision for income taxes recorded in 2015 and 2014 was primarily attributable to the valuation allowance, the difference in foreign tax rates and deferred tax liability related to the indefinite lived intangible assets.
Fiscal 2014 Compared to Fiscal 2013
Net Revenue. Our net revenue in 2014 increased by $69.0 million or 22.7% compared to 2013. The increase in net revenue was attributable mainly to the increase in sales in our enterprise network; data center and access and service provider markets, combined of $81.2 million which was partially offset by the decrease in sales in our broadband and consumer market of $12.2 million. The overall increase in sales in our enterprise network; data center; and access and service provider markets was mainly due to the fluctuation in demand for our products in those respective markets as a result of the timing of our customers’ volume production of our design wins. The decrease in sales of our broadband and consumer market was mainly due to our lesser focus on certain consumer product markets and the decrease in demand for our products in those respective markets.
Cost of revenue and Gross Margin. Cost of revenue increased in 2014 by $23.7 million or 20.6% compared to 2013 primarily due to the increase in net revenue. Gross margin increased by 0.6 percentage point from 62.3% in 2013 to 62.9% in 2014. The increase in gross margin in 2014 compared 2013 was mainly due to the inventory write-down of $3.9 million in 2013 associated with discontinued consumer products. This was partially offset by the inventory write-down of $1.7 million in 2014 associated with the decrease in projected shipments of our consumer products and the small shift of product sales mix of our higher and lower performance products. Higher performance products yields higher gross margins compared to our lower performance products.
Research and Development Expenses. Research and development expenses increased by $37.1 million or 27.6% in 2014 compared to 2013. The increase was partly due to increase in salaries and employee benefits of $15.6 million mainly due to the increase in research and development headcount. Stock-based compensation and related taxes increased by $15.0 million resulting from RSU grants pursuant to the merger agreement with Xpliant in 2014, higher option and RSU grants due to other increase in research and development headcount and higher grant date fair value of the new option and RSU grants. Facilities expense, design tools and other miscellaneous research and development increased by $6.6 million in 2014 compared to 2013 as a result of the increase in research and development activities to support the development of our new products. Research and development headcount was 700 at end of 2014 compared to 615 at end of 2013.
Sales, General and Administrative Expenses. Sales, general and administrative expenses increased by $6.3 million or 9.9% in 2014 compared to 2013. The increase was mainly due to higher stock-based compensation and related taxes of $4.4 million resulting from RSU grants pursuant to the merger agreement with Xpliant, higher option and RSU grants due to increase in sales, general and administrative headcount and higher grant date fair value of the new option and RSU grants. Salaries and employee benefits increased by $2.6 million, and facilities expense and other miscellaneous sales, general and administrative expenses, combined increased by $1.0 million mainly due to the increase in headcount. Outside services increased by $2.4 mainly due to increase in legal services related to acquisition and intellectual property related matters. In the first quarter of 2013, we recorded a credit of $0.7 million associated with the gain on sale of held for sale assets. The above increases was partially offset by decrease in depreciation expense of $3.5 million due to the acceleration of amortization of certain acquired intangible asset in 2013. In addition, there was a one-time charge to sales, general and administrative expenses in 2013 related to a contractual settlement to a customer of approximately $1.3 million. Sales, general and administrative headcount was 187 at end of 2014 compared to 161 at end of 2013.
39
Other Expense, Net. Other expense, net, increased by $14.3 million in 2014 compared to 2013. The increase was mainly due to the recognition of the change in the estimated fair value of notes payable and other of $14.9 million in 2014. The significant change in the estimated fair value of notes payable and other resulted from the change in the probability assumption used in the fair value measurement. See Note 5 of Notes to Consolidated Financial Statements for more detailed discussions. The increases were partially offset by other, net which consists mainly of net foreign exchange gains in 2014 compared to net foreign exchange losses in 2013.
Provision for Income Taxes. The provision for income taxes decreased by $0.3 million in 2014 compared to 2013. The decrease was mainly due to the decrease in foreign income taxes and U.S. deferred income taxes related to the indefinite lived intangibles. The difference between the provision for or benefit from income taxes that would be derived by applying the statutory rate to our loss before income taxes and the provision for income taxes recorded for 2014 and 2013 was primarily attributable to the valuation allowance, the difference in foreign tax rates and indefinite lived intangible related deferred tax liability.
Liquidity and Capital Resources
As of December 31, 2015, we had cash and cash equivalents of $134.6 million and net accounts receivable of $68.7 million. This compares to cash and cash equivalents of $131.7 million and net accounts receivable of $48.2 million at December 31, 2014.
Following is a summary of our working capital and cash and cash equivalents as of the periods presented:
|
|
|
As of December 31, |
|
|||||
|
|
|
2015 |
|
|
2014 |
|
||
|
|
|
(in thousands) |
|
|||||
|
Working capital |
|
$ |
196,772 |
|
|
$ |
177,453 |
|
|
Cash and cash equivalents |
|
|
134,646 |
|
|
|
131,718 |
|
Following is a summary of our cash flows from operating activities, investing activities and financing activities for the periods presented:
|
|
|
Year Ended December 31, |
|
|||||||||
|
|
|
2015 |
|
|
2014 |
|
|
2013 |
|
|||
|
|
|
(in thousands) |
|
|||||||||
|
Net cash provided by operating activities |
|
$ |
57,849 |
|
|
$ |
60,614 |
|
|
$ |
55,834 |
|
|
Net cash used in investing activities |
|
|
(44,496 |
) |
|
|
(24,913 |
) |
|
|
(8,289 |
) |
|
Net cash provided by (used in) financing activities |
|
|
(10,425 |
) |
|
|
(31,746 |
) |
|
|
3,434 |
|
Cash Flows from Operating Activities
Net cash flows from operating activities decreased by $2.8 million from net cash provided by operating activities of $60.6 million in 2014 compared to $57.8 million in 2015. Total cash inflow from operations after adjustment of non-cash items in 2015 and 2014 were $74.1 million and $74.9 million, respectively. The decrease was mainly due to higher expenses of Xpliant, partially offset by higher income from operations resulting from higher revenue. Changes in assets and liabilities resulted in net cash outflow of $16.2 million in 2015 compared to $14.3 million in 2014. The significant changes in assets and liabilities in 2015 were higher accounts receivable resulting from higher revenue and lower inventories due to timing of inventory build-up and improved inventory management. The significant changes in assets and liabilities in 2014 were higher inventories due to the timing of inventory build-up in anticipation of an increase in demand for our products, higher accounts payable due to the timing of payments to the vendors and higher accounts receivable resulting from higher revenue and timing of collections from customers.
Net cash flows from operating activities increased by $4.8 million from $55.8 million in 2013 to $60.6 million in 2014. Total cash inflow from operations after adjustment of non-cash items in 2014 and 2013 were $74.9 million and $61.0 million, respectively. The increase resulted mainly from higher net revenue which generated higher cash flows from operations. Changes in assets and liabilities resulted in net cash outflow of $14.3 million in 2014 compared to $5.1 million in 2013. See related discussions on significant changes in assets and liabilities for 2014 above. The significant changes in assets and liabilities in 2013 were higher accounts receivable resulting from higher revenue, lower inventories due to the timing of inventory build-up, lower deferred revenue as a result of lower subscription licenses and professional services billings to customers and higher accounts payable due to the timing of payments to the vendors.
40
Cash Flows from Investing Activities
Net cash used in investing activities in 2015 was $44.5 million compared to $24.9 million in 2014. Net cash used in investing activities in 2015 resulted from the cash payments made to purchase property and equipment of $35.8 million and intangible assets of $6.4 million and cash payment to common shareholders of Xpliant of $3.6 million pursuant to the closing of the merger. These decreases were partially offset by the proceeds from sale of a short-term investment of $1.0 million and the proceeds received from the disposition of certain consumer product assets of $0.4 million. Net cash used in investing activities in 2014 resulted from the cash payments made to purchase property and equipment of $18.0 million and intangible assets of $6.9 million and purchase of short-term investment of $1.0 million, which was partially offset by the proceeds received from the disposition of certain consumer product assets of $1.0 million.
Net cash used in investing activities in 2013 resulted from the cash payments made to purchase intangible assets of $3.8 million and property and equipment of $8.8 million, which was partially offset by the cash proceeds received related to the sale of certain assets of MontaVista of $3.4 million and proceeds received from the disposition of certain consumer product assets of $1.0 million.
Cash Flows from Financing Activities
Net cash used in financing activities in 2015 was $10.4 million compared to $31.7 million in 2014. Net cash used in financing activities in 2015 resulted from the principal payment of capital lease and technology license obligations of $20.0 million, which was partially offset by the proceeds received from issuance of common stock upon the exercise of options of $9.6 million. Net cash used in financing activities in 2014 resulted mainly from the payment of notes payable and other to non-controlling interest of $29.8 million and the principal payment of capital lease and technology license obligations of $18.6 million. These were partially offset by the proceeds received from issuance of common stock upon the exercise of options of $15.2 million and the proceeds from notes payable from non-controlling interest of $1.4 million.
Net cash provided by financing activities in 2013 resulted mainly from the proceeds received from issuance of common stock upon the exercise of options of $10.8 million, and the proceeds from notes payable and convertible security of the non-controlling interest of $9.5 million, which were partially offset by the principal payments of capital lease and technology license obligations of $15.9 million and payment of notes payable to the non-controlling interest of $1.0 million.
Capital Resources
Cash equivalents consist of an investment in a money market fund. We believe that our $134.6 million of cash and cash equivalents as of December 31, 2015, and expected cash flow from operations, if any, will be sufficient to fund our projected operating requirements for at least the next 12 months. Our future capital requirements will depend on many factors, including our rate of revenue growth, the expansion of our engineering, sales and marketing activities, the timing and extent of our expansion into new territories, the timing of introductions of new products and enhancements to existing products and the continuing market acceptance of our products. Although we currently are not a party to any agreement with respect to potential material investments in, or acquisitions of, complementary businesses, services or technologies, we may enter into these types of arrangements in the future, which could also require us to seek additional equity or debt financing. Additional funds may not be available on terms favorable to us or at all.
Indemnities
In the ordinary course of business, we have entered into agreements with customers that include indemnity provisions. Based on historical experience and information known through the filing of this report, we believe our exposure related to the above indemnities at end of 2015, is not material. We also enter into indemnification agreements with our officers and directors and our certificate of incorporation and bylaws include similar indemnification obligations to our officers and directors. It is not possible to determine the amount of our liability related to these indemnification agreements and obligations to our officers and directors due to the limited history of prior indemnification claims and the unique facts and circumstances involved in each particular agreement.
Off-Balance Sheet Arrangements
During the periods presented, we did not have, nor do we currently have, any relationships with unconsolidated entities or financial partnerships, such as entities often referred to as structured finance or special purpose entities, which would have been established for the purpose of facilitating off-balance sheet arrangements or other contractually narrow or limited purposes.
41
The following table describes our commitments to settle contractual obligations in cash as of December 31, 2015:
|
|
Payments Due By Period |
|
|||||||||||||||||
|
|
Total |
|
|
Less than 1 Year |
|
|
1 to 3 Years |
|
|
3 to 5 Years |
|
|
More Than 5 Years |
|
|||||
|
|
(in thousands) |
|
|||||||||||||||||
|
Operating lease obligations |
$ |
58,722 |
|
|
$ |
9,012 |
|
|
$ |
17,728 |
|
|
$ |
17,813 |
|
|
$ |
14,169 |
|
|
Capital lease and technology license obligations |
|
31,636 |
|
|
|
21,766 |
|
|
|
9,870 |
|
|
|
- |
|
|
|
- |
|
|
Total |
$ |
90,358 |
|
|
$ |
30,778 |
|
|
$ |
27,598 |
|
|
$ |
17,813 |
|
|
$ |
14,169 |
|
As of December 31, 2015, the liability for uncertain tax positions was $1.0 million. The timing of any payments which could result from these unrecognized tax benefits will depend upon a number of factors. Accordingly, the timing of payment cannot be estimated.
We lease our facilities under non-cancelable operating leases, which contain renewal options and escalation clauses, and expire on various dates ending in October 2022.
The capital lease and technology license obligations include future cash payments payable primarily for license agreements with various outside vendors. For license agreements which qualify under capital lease and where installment payments extend beyond one year, the present value of the future installment payments are capitalized and included as part of intangible assets or property and equipment which is amortized over the estimated useful lives of the related licenses.
In October 2014, we entered into a new purchase agreement with a third party vendor for $28.5 million, payable in installments that mature in August 2017 in exchange for certain design tools. In July 2015, we signed a purchase agreement with a third party vendor to acquire certain core software licenses amounting to $4.3 million, payable in 12 equal quarterly installments. In addition, we agreed to purchase additional combinations of core software licenses under a flexible spending program totaling $6.0 million for two years, with a minimum annual spend as specified in the agreement.
On March 30, 2015, Xpliant exercised its option to purchase the manufacturing rights to accelerate the takeover of manufacturing, and to relieve Xpliant from any further obligation to purchase product quantities from Xpliant’s application specific integrated circuit, or ASIC, vendor. In consideration for this, Xpliant agreed to pay a $7.5 million manufacturing rights licensing fee and a per-unit royalty fee for certain ASIC products sold to certain customers for a limited time. The manufacturing rights licensing fee is payable in 4 equal quarterly payments, with the first installment payment due on April 29, 2015 and each of the subsequent three installment payments being due on the first day of the following calendar quarter. The royalty shall be payable within 30 days after the end of each calendar quarter following the sale. Considering the terms of the purchase of the manufacturing rights, we recorded the full amount of the manufacturing rights licensing fee within research and development expense in the consolidated statement of operations in 2015 and the related liability was recorded within other accrued expenses and other current liabilities on the consolidated balance sheets. In 2015, we paid the first, second and third installments due.
We are subject to governmental export and import controls which apply to the encryption or other features contained in our products. On January 30, 2015, we submitted an initial notification of a voluntary self-disclosure to the U.S. Department of Commerce, Bureau of Industry and Security, or BIS. The notification reported our discovery that hardware and software, with encryption functionality, may have been exported without the required BIS export license. At this time we are unable to determine the outcome of the government’s investigation or its possible effect on us. Please refer to Item 1A, Risk Factors for further discussions related to this matter.
In addition, we have other obligations for goods and services entered into in the normal course of business. These obligations, however, are either not enforceable or legally binding or are subject to change based on our business decisions.
Recent Accounting Pronouncements
See “Recent Accounting Pronouncements” in “Note 1 Organization and Significant Accounting Policies” in Item 8 of this Annual Report, which is incorporated herein by reference.
42
Item 7A. Quantitative and Qualitative Disclosure About Market Risk
Foreign Currency Risk
Substantially all of our sales are denominated in United States dollars. We therefore have minimal foreign currency risk associated with sale of products. Our international sales and marketing and research and development operations incur expenses that are denominated in foreign currencies. These expenses could be materially affected by currency fluctuations; however, we do not consider this currency risk to be material as the related costs do not constitute a significant portion of our total spending. We outsource our wafer fabrication, assembly, testing, warehousing and shipping operations; however, all expenses related thereto are denominated in United States dollars.
Interest Rate Risk
We had cash and cash equivalents of $134.6 million and $131.7 million as of December 31, 2015 and 2014, respectively, which was held for working capital purposes. Our cash equivalents as of December 31, 2015 and 2014, consisted of investments in a money market fund. We do not enter into investments for trading or speculative purposes. We do not believe that we have any material exposure to changes in the fair value of these investments as a result of changes in interest rates due to their short term nature. Declines in interest rates, however, will reduce future investment income
43
Item 8. Financial Statement and Supplementary Data
INDEX TO CONSOLIDATED FINANCIAL STATEMENTS
The following financial statements are filed as part of this Annual Report
|
|
45 |
|
|
|
|
46 |
|
|
|
|
47 |
|
|
|
|
48 |
|
|
|
|
49 |
|
|
|
|
50 |
|
44
REPORT OF INDEPENDENT REGISTERED PUBLIC ACCOUNTING FIRM
To the Board of Directors and
Stockholders of Cavium, Inc.
In our opinion, the consolidated financial statements listed in the index appearing under Item 15(a)(1) present fairly, in all material respects, the financial position of Cavium, Inc. and its subsidiaries at December 31, 2015 and December 31, 2014, and the results of their operations and their cash flows for each of the three years in the period ended December 31, 2015 in conformity with accounting principles generally accepted in the United States of America. In addition, in our opinion, the financial statement schedule listed in the index appearing under Item 15(a)(2) presents fairly, in all material respects, the information set forth therein when read in conjunction with the related consolidated financial statements. Also in our opinion, the Company maintained, in all material respects, effective internal control over financial reporting as of December 31, 2015, based on criteria established in Internal Control - Integrated Framework (2013) issued by the Committee of Sponsoring Organizations of the Treadway Commission (COSO). The Company’s management is responsible for these financial statements and financial statement schedule, for maintaining effective internal control over financial reporting and for its assessment of the effectiveness of internal control over financial reporting, included in Management’s Report on Internal Control over Financial Reporting under Item 9A. Our responsibility is to express opinions on these financial statements, on the financial statement schedule, and on the Company’s internal control over financial reporting based on our integrated audits. We conducted our audits in accordance with the standards of the Public Company Accounting Oversight Board (United States). Those standards require that we plan and perform the audits to obtain reasonable assurance about whether the financial statements are free of material misstatement and whether effective internal control over financial reporting was maintained in all material respects. Our audits of the financial statements included examining, on a test basis, evidence supporting the amounts and disclosures in the financial statements, assessing the accounting principles used and significant estimates made by management, and evaluating the overall financial statement presentation. Our audit of internal control over financial reporting included obtaining an understanding of internal control over financial reporting, assessing the risk that a material weakness exists, and testing and evaluating the design and operating effectiveness of internal control based on the assessed risk. Our audits also included performing such other procedures as we considered necessary in the circumstances. We believe that our audits provide a reasonable basis for our opinions.
A company’s internal control over financial reporting is a process designed to provide reasonable assurance regarding the reliability of financial reporting and the preparation of financial statements for external purposes in accordance with generally accepted accounting principles. A company’s internal control over financial reporting includes those policies and procedures that (i) pertain to the maintenance of records that, in reasonable detail, accurately and fairly reflect the transactions and dispositions of the assets of the company; (ii) provide reasonable assurance that transactions are recorded as necessary to permit preparation of financial statements in accordance with generally accepted accounting principles, and that receipts and expenditures of the company are being made only in accordance with authorizations of management and directors of the company; and (iii) provide reasonable assurance regarding prevention or timely detection of unauthorized acquisition, use, or disposition of the company’s assets that could have a material effect on the financial statements.
Because of its inherent limitations, internal control over financial reporting may not prevent or detect misstatements. Also, projections of any evaluation of effectiveness to future periods are subject to the risk that controls may become inadequate because of changes in conditions, or that the degree of compliance with the policies or procedures may deteriorate.
/s/ PricewaterhouseCoopers LLP
San Jose, California
February 22, 2016
45
CAVIUM, INC.
(in thousands, except share and per share data)
|
|
As of December 31, |
|
|||||
|
|
2015 |
|
|
2014 |
|
||
|
Assets |
|
|
|
|
|
|
|
|
Current assets: |
|
|
|
|
|
|
|
|
Cash and cash equivalents |
$ |
134,646 |
|
|
$ |
131,718 |
|
|
Accounts receivable, net of allowances of $1,468 and $1,142, respectively |
|
68,742 |
|
|
|
48,199 |
|
|
Inventories |
|
47,009 |
|
|
|
51,922 |
|
|
Prepaid expenses and other current assets |
|
10,231 |
|
|
|
9,130 |
|
|
Total current assets |
|
260,628 |
|
|
|
240,969 |
|
|
Property and equipment, net |
|
64,677 |
|
|
|
56,963 |
|
|
Intangible assets, net |
|
35,492 |
|
|
|
37,644 |
|
|
Goodwill |
|
71,478 |
|
|
|
71,478 |
|
|
Other assets |
|
1,718 |
|
|
|
1,806 |
|
|
Total assets |
$ |
433,993 |
|
|
$ |
408,860 |
|
|
|
|
|
|
|
|
|
|
|
Liabilities and Stockholders' equity |
|
|
|
|
|
|
|
|
Current liabilities: |
|
|
|
|
|
|
|
|
Accounts payable |
$ |
27,489 |
|
|
$ |
26,447 |
|
|
Other accrued expenses and other current liabilities |
|
9,443 |
|
|
|
7,782 |
|
|
Deferred revenue |
|
6,316 |
|
|
|
6,285 |
|
|
Capital lease and technology license obligations |
|
20,608 |
|
|
|
23,002 |
|
|
Total current liabilities |
|
63,856 |
|
|
|
63,516 |
|
|
Capital lease and technology license obligations, net of current portion |
|
9,858 |
|
|
|
22,894 |
|
|
Deferred tax liability |
|
3,417 |
|
|
|
2,836 |
|
|
Other non-current liabilities |
|
2,962 |
|
|
|
2,931 |
|
|
Total liabilities |
|
80,093 |
|
|
|
92,177 |
|
|
|
|
|
|
|
|
|
|
|
Commitments and contingencies (Note 12) |
|
|
|
|
|
|
|
|
|
|
|
|
|
|
|
|
|
Stockholders' equity |
|
|
|
|
|
|
|
|
Preferred stock, par value $0.001: |
|
|
|
|
|
|
|
|
10,000,000 shares authorized; no shares issued and outstanding |
|
- |
|
|
|
- |
|
|
Common stock, par value $0.001: |
|
|
|
|
|
|
|
|
200,000,000 shares authorized; 56,259,252 and 54,458,288 shares issued and outstanding, respectively |
|
56 |
|
|
|
54 |
|
|
Additional paid-in capital |
|
543,256 |
|
|
|
488,981 |
|
|
Accumulated deficit |
|
(189,412 |
) |
|
|
(172,352 |
) |
|
Total stockholders' equity |
|
353,900 |
|
|
|
316,683 |
|
|
Total liabilities and stockholders' equity |
$ |
433,993 |
|
|
$ |
408,860 |
|
The accompanying notes are an integral part of these consolidated financial statements.
46
CONSOLIDATED STATEMENTS OF OPERATIONS
(in thousands, except per share data)
|
|
Year Ended December 31, |
|
|||||||||
|
|
2015 |
|
|
2014 |
|
|
2013 |
|
|||
|
Net revenue |
$ |
412,744 |
|
|
$ |
372,978 |
|
|
$ |
303,993 |
|
|
Cost of revenue |
|
143,767 |
|
|
|
138,359 |
|
|
|
114,679 |
|
|
Gross profit |
|
268,977 |
|
|
|
234,619 |
|
|
|
189,314 |
|
|
Operating expenses: |
|
|
|
|
|
|
|
|
|
|
|
|
Research and development |
|
203,778 |
|
|
|
171,690 |
|
|
|
134,596 |
|
|
Sales, general and administrative |
|
78,926 |
|
|
|
70,404 |
|
|
|
64,088 |
|
|
Total operating expenses |
|
282,704 |
|
|
|
242,094 |
|
|
|
198,684 |
|
|
Loss from operations |
|
(13,727 |
) |
|
|
(7,475 |
) |
|
|
(9,370 |
) |
|
Other expense, net: |
|
|
|
|
|
|
|
|
|
|
|
|
Interest expense |
|
(1,241 |
) |
|
|
(1,472 |
) |
|
|
(1,502 |
) |
|
Change in estimated fair value of notes payable and other |
|
- |
|
|
|
(14,888 |
) |
|
|
- |
|
|
Other, net |
|
(410 |
) |
|
|
(347 |
) |
|
|
(879 |
) |
|
Total other expense, net |
|
(1,651 |
) |
|
|
(16,707 |
) |
|
|
(2,381 |
) |
|
Loss before income taxes |
|
(15,378 |
) |
|
|
(24,182 |
) |
|
|
(11,751 |
) |
|
Provision for income taxes |
|
1,682 |
|
|
|
1,633 |
|
|
|
1,937 |
|
|
Net loss |
|
(17,060 |
) |
|
|
(25,815 |
) |
|
|
(13,688 |
) |
|
Net loss attributable to non-controlling interest |
|
- |
|
|
|
(10,520 |
) |
|
|
(10,723 |
) |
|
Net loss attributable to the Company |
$ |
(17,060 |
) |
|
$ |
(15,295 |
) |
|
$ |
(2,965 |
) |
|
|
|
|
|
|
|
|
|
|
|
|
|
|
Earnings per share attributable to the Company: |
|
|
|
|
|
|
|
|
|
|
|
|
Net loss per common share, basic |
$ |
(0.31 |
) |
|
$ |
(0.29 |
) |
|
$ |
(0.06 |
) |
|
Shares used in computing basic net loss per common share |
|
55,589 |
|
|
|
53,451 |
|
|
|
51,596 |
|
|
Net loss per common share, diluted |
$ |
(0.31 |
) |
|
$ |
(0.29 |
) |
|
$ |
(0.06 |
) |
|
Shares used in computing diluted net loss per common share |
|
55,589 |
|
|
|
53,451 |
|
|
|
51,596 |
|
The accompanying notes are an integral part of these consolidated financial statements.
47
CHANGES IN EQUITY
(in thousands, except share data)
|
|
Attributable to the Company's Stockholders |
|
|
|
|
|
|
|
|
|
|||||||||||||
|
|
Common Stock |
|
|
Additional Paid-in |
|
|
Accumulated |
|
|
Non-controlling |
|
|
Total |
|
|||||||||
|
|
Shares |
|
|
Amount |
|
|
Capital |
|
|
Deficit |
|
|
Interest |
|
|
Equity |
|
||||||
|
Balance at December 31, 2012 |
|
50,630,991 |
|
|
$ |
51 |
|
|
$ |
398,133 |
|
|
$ |
(154,092 |
) |
|
$ |
(1,030 |
) |
|
$ |
243,062 |
|
|
Common stock issued in connection with exercises of stock options |
|
723,047 |
|
|
|
1 |
|
|
|
10,826 |
|
|
|
|
|
|
|
|
|
|
|
10,827 |
|
|
Common stock issued in connection with vesting of restricted stock units |
|
867,213 |
|
|
|
1 |
|
|
|
|
|
|
|
|
|
|
|
|
|
|
|
1 |
|
|
Stock-based compensation |
|
|
|
|
|
|
|
|
|
34,629 |
|
|
|
|
|
|
|
|
|
|
|
34,629 |
|
|
Net loss |
|
|
|
|
|
|
|
|
|
|
|
|
|
(2,965 |
) |
|
|
(10,723 |
) |
|
|
(13,688 |
) |
|
Balance at December 31, 2013 |
|
52,221,251 |
|
|
|
53 |
|
|
|
443,588 |
|
|
|
(157,057 |
) |
|
|
(11,753 |
) |
|
|
274,831 |
|
|
Common stock issued in connection with exercises of stock options |
|
1,082,914 |
|
|
|
1 |
|
|
|
15,210 |
|
|
|
|
|
|
|
|
|
|
|
15,211 |
|
|
Common stock issued in connection with vesting of restricted stock units |
|
1,154,123 |
|
|
|
- |
|
|
|
|
|
|
|
|
|
|
|
|
|
|
|
- |
|
|
Stock-based compensation |
|
|
|
|
|
|
|
|
|
52,456 |
|
|
|
|
|
|
|
|
|
|
|
52,456 |
|
|
Settlement of non-controlling interest |
|
|
|
|
|
|
|
|
|
(22,273 |
) |
|
|
|
|
|
|
22,273 |
|
|
|
- |
|
|
Net loss |
|
|
|
|
|
|
|
|
|
|
|
|
|
(15,295 |
) |
|
|
(10,520 |
) |
|
|
(25,815 |
) |
|
Balance at December 31, 2014 |
|
54,458,288 |
|
|
|
54 |
|
|
|
488,981 |
|
|
|
(172,352 |
) |
|
|
- |
|
|
|
316,683 |
|
|
Common stock issued in connection with exercises of stock options |
|
685,439 |
|
|
|
1 |
|
|
|
9,607 |
|
|
|
|
|
|
|
|
|
|
|
9,608 |
|
|
Common stock issued in connection with vesting of restricted stock units |
|
1,115,525 |
|
|
|
1 |
|
|
|
|
|
|
|
|
|
|
|
|
|
|
|
1 |
|
|
Stock-based compensation |
|
|
|
|
|
|
|
|
|
48,298 |
|
|
|
|
|
|
|
|
|
|
|
48,298 |
|
|
Payments to common shareholders of Xpliant |
|
|
|
|
|
|
|
|
|
(3,630 |
) |
|
|
|
|
|
|
|
|
|
|
(3,630 |
) |
|
Net loss |
|
|
|
|
|
|
|
|
|
|
|
|
|
(17,060 |
) |
|
|
- |
|
|
|
(17,060 |
) |
|
Balance at December 31, 2015 |
|
56,259,252 |
|
|
$ |
56 |
|
|
$ |
543,256 |
|
|
$ |
(189,412 |
) |
|
$ |
- |
|
|
$ |
353,900 |
|
The accompanying notes are an integral part of these consolidated financial statements.
48
CONSOLIDATED STATEMENTS OF CASH FLOWS
(in thousands)
|
|
Year Ended December 31, |
|
|||||||||
|
|
2015 |
|
|
2014 |
|
|
2013 |
|
|||
|
Cash flows from operating activities: |
|
|
|
|
|
|
|
|
|
|
|
|
Net loss |
$ |
(17,060 |
) |
|
$ |
(25,815 |
) |
|
$ |
(13,688 |
) |
|
Adjustments to reconcile net loss to net cash provided by operating activities: |
|
|
|
|
|
|
|
|
|
|
|
|
Stock-based compensation expense |
|
48,297 |
|
|
|
52,459 |
|
|
|
34,598 |
|
|
Depreciation and amortization |
|
42,442 |
|
|
|
34,087 |
|
|
|
40,993 |
|
|
Deferred income taxes |
|
663 |
|
|
|
385 |
|
|
|
743 |
|
|
Change in estimated fair value of notes payable and other |
|
- |
|
|
|
14,888 |
|
|
|
- |
|
|
Gain on sale of held for sale assets |
|
- |
|
|
|
- |
|
|
|
(747 |
) |
|
(Gain) loss on disposal of property and equipment |
|
129 |
|
|
|
(115 |
) |
|
|
71 |
|
|
Gain on disposition of certain consumer product assets |
|
(400 |
) |
|
|
(1,000 |
) |
|
|
(1,000 |
) |
|
Changes in assets and liabilities: |
|
|
|
|
|
|
|
|
|
|
|
|
Accounts receivable, net |
|
(20,543 |
) |
|
|
(4,563 |
) |
|
|
(10,069 |
) |
|
Inventories |
|
4,914 |
|
|
|
(6,157 |
) |
|
|
788 |
|
|
Prepaid expenses and other current assets |
|
(2,101 |
) |
|
|
(1,589 |
) |
|
|
(1,321 |
) |
|
Other assets |
|
(9 |
) |
|
|
(433 |
) |
|
|
42 |
|
|
Accounts payable |
|
(220 |
) |
|
|
2,056 |
|
|
|
7,685 |
|
|
Deferred revenue |
|
31 |
|
|
|
(2,384 |
) |
|
|
(4,275 |
) |
|
Accrued expenses and other current and non-current liabilities |
|
1,706 |
|
|
|
(1,205 |
) |
|
|
2,014 |
|
|
Net cash provided by operating activities |
|
57,849 |
|
|
|
60,614 |
|
|
|
55,834 |
|
|
|
|
|
|
|
|
|
|
|
|
|
|
|
Cash flows from investing activities: |
|
|
|
|
|
|
|
|
|
|
|
|
Purchases of property and equipment |
|
(35,826 |
) |
|
|
(17,994 |
) |
|
|
(8,806 |
) |
|
Purchases of intangible assets |
|
(6,440 |
) |
|
|
(6,919 |
) |
|
|
(3,833 |
) |
|
Cash payment to common shareholders of Xpliant |
|
(3,630 |
) |
|
|
- |
|
|
|
- |
|
|
Proceeds received from sale of held for sale assets |
|
- |
|
|
|
- |
|
|
|
3,350 |
|
|
Proceeds received from disposition of certain consumer product assets |
|
400 |
|
|
|
1,000 |
|
|
|
1,000 |
|
|
Sale (purchase) of short-term investment |
|
1,000 |
|
|
|
(1,000 |
) |
|
|
- |
|
|
Net cash used in investing activities |
|
(44,496 |
) |
|
|
(24,913 |
) |
|
|
(8,289 |
) |
|
|
|
|
|
|
|
|
|
|
|
|
|
|
Cash flows from financing activities: |
|
|
|
|
|
|
|
|
|
|
|
|
Proceeds from issuance of common stock upon exercise of options |
|
9,609 |
|
|
|
15,211 |
|
|
|
10,827 |
|
|
Principal payment of capital lease and technology license obligations |
|
(20,034 |
) |
|
|
(18,557 |
) |
|
|
(15,893 |
) |
|
Proceeds from notes payable and other from non-controlling interest |
|
- |
|
|
|
1,400 |
|
|
|
9,500 |
|
|
Payment of notes payable and other to non-controlling interest |
|
- |
|
|
|
(29,800 |
) |
|
|
(1,000 |
) |
|
Net cash provided by (used in) financing activities |
|
(10,425 |
) |
|
|
(31,746 |
) |
|
|
3,434 |
|
|
|
|
|
|
|
|
|
|
|
|
|
|
|
Net increase in cash and cash equivalents |
|
2,928 |
|
|
|
3,955 |
|
|
|
50,979 |
|
|
Cash and cash equivalents, beginning of period |
|
131,718 |
|
|
|
127,763 |
|
|
|
76,784 |
|
|
Cash and cash equivalents, end of period |
$ |
134,646 |
|
|
$ |
131,718 |
|
|
$ |
127,763 |
|
|
|
|
|
|
|
|
|
|
|
|
|
|
|
Supplemental disclosures of cash flow information: |
|
|
|
|
|
|
|
|
|
|
|
|
Cash paid for interest |
|
1,273 |
|
|
|
1,812 |
|
|
|
1,242 |
|
|
Cash paid for taxes |
|
958 |
|
|
|
1,133 |
|
|
|
1,335 |
|
|
|
|
|
|
|
|
|
|
|
|
|
|
|
Supplemental disclosures of cash flows from investing and financing activities: |
|
|
|
|
|
|
|
|
|
|
|
|
Property and equipment and intangible assets acquired included in accounts payable, other accrued expense and other current liabilities |
|
2,335 |
|
|
|
1,188 |
|
|
|
264 |
|
|
|
|
|
|
|
|
|
|
|
|
|
|
|
Property and equipment and intangible assets acquired included in capital lease and technology license obligations |
|
4,157 |
|
|
|
30,443 |
|
|
|
5,860 |
|
The accompanying notes are an integral part of these consolidated financial statements.
49
NOTES TO CONSOLIDATED FINANCIAL STATEMENTS
1. Organization and Significant Accounting Policies
Organization
Cavium, Inc., (the “Company”), was incorporated in the state of California on November 21, 2000 and was reincorporated in the state of Delaware effective February 6, 2007. The Company designs, develops and markets semiconductor processors for intelligent and secure networks.
Basis of Consolidation
The consolidated financial statements include the accounts of Cavium, Inc. and its wholly owned subsidiaries. All intercompany transactions and balances have been eliminated in consolidation. Prior to the closing of the acquisition of Xpliant, Inc. (“Xpliant”) in April 2015 as discussed in Note 5 of Notes to Consolidated Financial Statements, the Company accounted for Xpliant as a variable interest entity, or VIE. Under the accounting principles generally accepted in the United States of America, or US GAAP, a VIE is required to be consolidated by its primary beneficiary. The primary beneficiary is the party that absorbs a majority of the VIE’s anticipated losses and/or a majority of the expected returns.
Use of Estimates
The preparation of financial statements in conformity with accounting principles generally accepted in the United States requires management to make estimates and assumptions that affect the amounts reported in its consolidated financial statements and accompanying notes. Management bases its estimates on historical experience and on various other assumptions it believes to be reasonable under the circumstances, the results of which form the basis of making judgments about the carrying values of assets and liabilities. Actual results could differ from those estimates.
Revenue Recognition
The Company primarily derives its revenue from sales of semiconductor products to original contract manufacturers, or OEM, or through OEM’s contract manufacturers or distributors. To a lesser extent, the Company also derive revenue from licensing software and related maintenance and support and from professional service arrangements.
The Company recognizes revenue when (i) persuasive evidence of a binding arrangement exists; (ii) delivery has occurred or service has been rendered; (iii) the price is deemed fixed or determinable and free of contingencies and significant uncertainties; and (iv) collectibility is reasonably assured. The Company records a reduction in revenue for provision for estimated sales returns in the same period the related revenues are recorded. These estimates are based on historical patterns of return, analysis of credit memo data and other known factors at the time. Revenue is recognized upon shipment to distributors with limited rights of returns and price protection if the Company concludes that it can reasonably estimate the credit for returns and price adjustments issuable. The Company records an estimated allowance, at the time of shipment, based on the Company’s historical patterns of returns and pricing credit of sales recognized upon shipment. Credits issued to distributors or other customers have historically not been material. The inventory at these distributors at the end of the period may fluctuate from time to time mainly due to the OEM production ramps and/or new customer demands.
Software arrangements typically include time-based licenses for 12 months with related support. The Company does not sell support separately, therefore, revenue from software arrangements is recognized ratably over the support period. The software arrangement may also include professional services, and these services may be purchased separately. Professional services engagements are billed on either a fixed-fee or time-and-materials basis. For fixed-fee arrangements, professional services revenue is recognized under the proportional performance method, with the associated costs included in cost of revenue. The Company estimates the proportional performance of the arrangements based on an analysis of progress toward completion. The Company periodically evaluates the actual status of each project to ensure that the estimates to complete each contract remain accurate, and a loss is recognized when the total estimated project cost exceeds project revenue. If the amount billed exceeds the amount of revenue recognized, the excess amount is recorded as deferred revenue. Revenue recognized in any period is dependent on progress toward completion of projects in progress. To the extent we are unable to estimate the proportional performance, revenue is recognized on a completed performance basis. Revenue for time-and-materials engagements is recognized as the effort is incurred.
50
Accounting for Stock-Based Compensation
The Company applies the fair value recognition provisions of stock-based compensation. The Company recognizes the fair value of the awards on a straight-line basis over its vesting periods. The Company estimates the grant date fair value of stock options using the Black-Scholes option valuation model. The Black-Scholes option-pricing model used to determine the fair value of stock options requires various subjective assumptions, including expected volatility, expected term and the risk-free interest rates. The stock price volatility assumption is estimated using the Company’s historical stock price volatility. The Company uses the simplified method as permitted by the provisions on stock-based compensation to estimate the expected term since it has no sufficient history of weighted average period from the date of grant to exercise, cancellation, or expiration. The risk free interest rate is based on the implied yield currently available on U.S. Treasury securities with an equivalent remaining term. The Company recognizes stock-based compensation expense only for the portion of stock options that are expected to vest, based on the Company’s estimated forfeiture rate.
For all restricted stock unit, or RSU, grants other than RSU grants with market condition, the fair value of the RSU grant is based on the market price of the Company’s common stock on the date of grant. For performance-based RSU grants, the Company evaluates the probability of achieving the milestones for each of the outstanding performance-based RSU grants at each reporting period and updates the related stock-based compensation expense. The fair value of market-based RSUs is determined using the Monte Carlo simulation method which takes into account multiple input variables that determine the probability of satisfying the market conditions stipulated in the award. This method requires the input of assumptions, including the expected volatility of the Company’s common stock, and a risk-free interest rate, similar to assumptions used in determining the fair value of the stock option grants discussed above. The grant date fair value of RSUs, less estimated forfeitures, is recorded on a straight-line basis, over the vesting period.
Income Taxes
The Company accounts for income taxes under the asset and liability method. Under this method, deferred tax assets, including those related to tax loss carryforwards and credits, and liabilities are determined based on the differences between the financial statement and tax bases of assets and liabilities using enacted tax rates in effect for the year in which the differences are expected to reverse. A valuation allowance is recorded to reduce deferred tax assets when management cannot conclude that it is more-likely-than-not that the net deferred tax asset will be recovered. The valuation allowance is determined by assessing both positive and negative evidence to determine whether it is more-likely-than-not that deferred tax assets are recoverable; such assessment is required on a jurisdiction-by-jurisdiction basis.
The Company recognizes uncertain tax positions when it meets a more-likely-than-not threshold. The Company recognizes potential accrued interest and penalties related to unrecognized tax benefits as income tax expense.
Business Combinations
The Company accounts for business combinations using the purchase method of accounting. The Company determines the recognition of intangible assets based on the following criteria: (i) the intangible asset arises from contractual or other rights; or (ii) the intangible is separable or divisible from the acquired entity and capable of being sold, transferred, licensed, returned or exchanged. In accordance with the guidance provided under business combinations, the Company allocates the purchase price of business combinations to the tangible assets, liabilities and intangible assets acquired, including in-process research and development, or IPR&D, based on their estimated fair values. The excess purchase price over those fair values is recorded as goodwill. The Company’s valuation assumption of acquired net assets requires significant estimates, especially with respect to intangible assets. Critical estimates in valuing certain intangible assets includes future expected cash flows from customer contracts, customer lists, and distribution agreements and acquired developed technologies, expected costs to develop IPR&D into commercially viable products, estimated cash flows from projects when completed and discount rates. The Company estimates the fair value based upon assumptions the Company believes to be reasonable, but which are inherently uncertain and unpredictable and, as a result, actual results may differ from estimates. Other estimates associated with the accounting for acquisitions may change as additional information becomes available regarding the assets acquired and liabilities assumed. Acquisition-related costs, including advisory, legal, accounting, valuation and other costs, are expensed in the periods in which the costs are incurred. The results of operations of acquired businesses are included in the consolidated financial statements from the acquisition date.
51
Valuation of Goodwill and intangible assets
Goodwill is measured as the excess of the cost of an acquisition over the sum of the amounts assigned to tangible and identifiable intangible assets and liabilities assumed. The Company evaluates goodwill for impairment at its single reporting unit level at least on an annual basis in the fourth quarter of the calendar year or whenever events and changes in circumstances suggest that the carrying amount may not be recoverable from its estimated future cash flow. The Company performs a qualitative assessment to determine if any events have occurred or circumstances exist that would indicate that it is more-likely-than-not that a goodwill impairment exists. If any indicators exist based on the qualitative analysis that it is more-likely-than-not that a goodwill impairment exists, the quantitative test is required. Otherwise, no further testing is required.
The Company reviews long-lived assets, including property and equipment and intangible assets, for impairment whenever events or changes in business circumstances indicate that the carrying amount of the assets (or asset group) may not be fully recoverable. Whenever events or changes in circumstances suggest that the carrying amount of long-lived assets may not be recoverable, the Company estimates the future cash flows expected to be generated by the assets (or asset group) from its use or eventual disposition. If the sum of the expected future cash flows is less than the carrying amount of those assets, the Company recognizes an impairment loss based on the excess of the carrying amount over the fair value of the assets. Significant management judgment is required in the grouping of long-lived assets and forecasts of future operating results that are used in the discounted cash flow method of valuation.
Inventories
Inventories consist of work-in-process and finished goods. Inventories not related to an acquisition are stated at the lower of cost (determined using the first-in, first-out method), or market value (estimated net realizable value). Inventories from acquisitions are stated at fair value at the date of acquisition. The Company writes down excess and obsolete inventory based on its age and forecasted demand, generally over a 12 month period, which includes estimates taking into consideration the Company’s outlook on uncertain events such as market and economic conditions, technology changes, new product introductions and changes in strategic direction. Actual demand may differ from forecasted demand and such differences may have a material effect on recorded inventory values. Inventory write-downs are not reversed until the related inventories have been sold or scrapped.
Property and Equipment
Property and equipment are stated at cost and depreciated over their estimated useful lives using the straight-line method. Leasehold improvements are amortized over the shorter of estimated useful lives or unexpired lease term. Additions and improvements that increase the value or extend the life of an asset are capitalized. Upon retirement or sale, the cost of assets disposed of and the related accumulated depreciation are removed from the accounts and any resulting gain or loss is credited or charged to income. Ordinary repairs and maintenance costs are expensed as incurred.
|
|
Estimated |
|
|
|
Software, design tools, computer and other equipment |
|
1 to 5 years |
|
|
Test equipment and mask costs |
|
1 to 3 years |
|
|
Furniture, office equipment and leasehold improvements |
|
1 to 5 years |
|
The Company capitalizes the cost of fabrication masks that are reasonably expected to be used during production manufacturing. Such amounts are included within property and equipment and are depreciated over a period of 12 to 24 months and recorded as a component of cost of revenue. If the Company does not reasonably expect to use the fabrication mask during production manufacturing, the related mask costs are expensed to research and development in the period in which the costs are incurred.
The Company leases certain design tools under capital lease and certain financing arrangements which are included in property and equipment. The Company also capitalizes acquired internally used software in property and equipment. Subsequent additions, modifications or upgrades to internally used software are capitalized to the extent it provides additional usage or functionality.
Cash and Cash Equivalents
The Company considers all highly liquid investments with an original or remaining maturity of 90 days or less at the date of purchase to be cash equivalents. Cash equivalents consist of an investment in a money market fund.
Allowance for Doubtful Accounts
The Company reviews its allowance for doubtful accounts by assessing individual accounts receivable over a specific age and amount. The Company’s allowance for doubtful accounts were not significant as of December 31, 2015 and 2014.
52
The Company’s products are currently manufactured, assembled and tested by third-party contractors in Asia. There are no long-term agreements with any of these contractors. A significant disruption in the operations of one or more of these contractors would impact the production of the Company’s products for a substantial period of time, which could have a material adverse effect on the Company’s business, financial condition and results of operations.
Financial instruments that potentially subject the Company to a concentration of credit risk consist of cash, cash equivalents and accounts receivable. The Company deposits cash with credit worthy financial institutions. The Company has not experienced any losses on its deposits of cash. Management believes that the financial institutions are reputable and, accordingly, minimal credit risk exists. The Company’s cash equivalents are invested in a money market fund. The Company follows an established investment policy and set of guidelines to monitor, manage and limit the Company’s exposure to interest rate and credit risk. The policy sets forth credit quality standards and limits the Company’s exposure to any one issuer, as well as the maximum exposure to various asset classes.
A majority of the Company’s accounts receivable are derived from customers headquartered in the United States. The Company performs ongoing credit evaluations of its customers’ financial condition and, generally, requires no collateral from its customers. The Company provides an allowance for doubtful accounts receivable based upon the expected collectability of accounts receivable.
Summarized below are individual customers whose accounts receivable balances were 10% or higher of the consolidated gross receivable:
|
|
|
As of December 31, |
|
|||||
|
|
|
2015 |
|
|
2014 |
|
||
|
Percentage of gross accounts receivable |
|
|
|
|
|
|
|
|
|
Customer A |
|
|
16% |
|
|
|
12% |
|
|
Customer B |
|
|
20% |
|
|
|
21% |
|
|
Customer C |
|
* |
|
|
|
11% |
|
|
*Represents less than 10% of the gross accounts receivable for the respective period end.
OEM Customers B, D and E together accounted for 42.9% and 44.4% of the Company’s net revenue in 2015 and 2014, respectively. OEM Customer D accounted for 18.6% of the Company’s net revenue in 2013. No other customer accounted for more than 10% of the Company’s net revenue in 2015, 2014 and 2013.
Deferred revenue
The Company records deferred revenue for customer billings and advance payments received from customers before the performance obligations have been completed and/or services have been performed for products and/or service related agreements. The Company had a distribution agreement with a distributor which was accounted as a sell-through distributor. The distribution agreement was terminated effective May 2014. The Company recorded deferred revenue, net of deferred costs on shipments to this sell-through distributor.
Warranty Accrual
The Company’s products are generally subject to a one-year warranty period. The Company provides for the estimated future costs of replacement upon shipment of the product as cost of revenue. The warranty accrual is estimated based on cost of historical claims compared to associated historical product cost.
Research and Development
Research and development costs are expensed as incurred and primarily include personnel costs, prototype expenses, which include the cost of fabrication mask costs not reasonably expected to be used in production manufacturing, and allocated facilities costs as well as depreciation of equipment used in research and development.
Advertising
The Company expenses advertising costs as incurred. Advertising expenses were $2.5 million, $1.8 million and $1.4 million for the years ended December 31, 2015, 2014 and 2013, respectively.
53
The Company recognizes rent expense on a straight-line basis over the term of the lease. The difference between rent expense and rent paid is recorded as deferred rent in accrued expenses and other current and non-current liabilities on the consolidated balance sheets.
Other Comprehensive Income (Loss)
Comprehensive income (loss) includes all changes in equity that are not the result of transactions with stockholders. There were no components of comprehensive income (loss) which were excluded from the net income (loss) for the years ended December 31, 2015, 2014 and 2013, and, therefore, no separate statement of comprehensive income (loss) has been presented.
Foreign Currency Remeasurement
The Company uses the United States dollar as the functional currency for its subsidiaries. Assets and liabilities denominated in non-U.S. dollars are remeasured into U.S. dollars at end-of-period exchange rates for monetary assets and liabilities, and historical exchange rates for nonmonetary assets and liabilities. Net revenue and expenses are remeasured at average exchange rates in effect during each period, except for those revenue, cost of sales and expenses related to the nonmonetary assets and liabilities, which are remeasured at historical exchange rates. The aggregate foreign exchange gains and losses, which are included in other, net in the consolidated statements of operations were not material for the years ended December 31, 2015, 2014 and 2013.
Recent Accounting Pronouncements
In November 2015, the Financial Accounting Standards Board, or FASB, issued guidance to simplify the presentation of deferred income taxes. The amendments in this update require that deferred tax assets and liabilities be classified as non-current in a classified statement of financial position. The amendments in this update will apply to all entities that present a classified statement of financial position. The current requirement that deferred tax assets and liabilities of a tax paying component of an entity be offset and presented as a single amount is not affected by the amendments to this update. The amendments to this update are effective for financial statements issued for annual periods beginning after December 15, 2016, and interim periods within those annual periods. Earlier application is permitted as of the beginning of an interim or annual reporting period. The Company adopted this guidance as of December 31, 2015. This guidance did not have a material impact on the Company’s consolidated financial statements.
In September 2015, the FASB issued an update to the business combinations standards simplifying the accounting for measurement-period adjustments. The amendments in this update require that an acquirer recognize adjustments to provisional amounts that are identified during the measurement period in the reporting period in which the adjustment amounts are determined. The amendments in this update require that the acquirer record, in the same period’s financial statements, the effect on earnings of changes in depreciation, amortization, or other income effects, if any, as a result of the change to the provisional amounts, calculated as if the accounting had been completed at the acquisition date. The amendments in this update require an entity to present separately on the face of the income statement or disclose in the notes the portion of the amount recorded in current-period earnings by line item that would have been recorded in previous reporting periods if the adjustment to the provisional amounts had been recognized as of the acquisition date. The update is effective for interim and annual periods beginning after December 15, 2015. The amendments in this update should be applied prospectively to adjustments to provisional amounts that occur after the effective date of this update with earlier application permitted for financial statements that have not been issued. The Company does not expect that this guidance will have a material impact on its consolidated financial statements.
In July 2015, the FASB issued guidance to simplify the measurement of inventory. The updated standard more closely aligns the measurement of inventory with that of International Financial Reporting Standards and amends the measurement standard from lower of cost or market to lower of cost or net realizable value. The new guidance is effective for fiscal years beginning after December 15, 2016, including interim periods during the annual period and requires a prospective approach to adoption. Early adoption is permitted. The Company does not expect that this guidance will have a material impact on its consolidated financial statements.
54
In May 2014, the FASB issued a new guidance on the recognition of revenue from contracts with customers, which includes a single set of rules and criteria for revenue recognition to be used across all industries. The new revenue guidance’s core principle is built on the contract between a vendor and a customer for the provision of goods and services. It attempts to depict the exchange of rights and obligations between the parties in the pattern of revenue recognition based on the consideration to which the vendor is entitled. To accomplish this objective, the guidance requires five basic steps: identify the contract with the customer, identify the performance obligations in the contract, determine the transaction price, allocate the transaction price to the performance obligations in the contract, and recognize revenue when or as the entity satisfies a performance obligation. In August 2015, the FASB issued an update to defer the effective date by one year. This guidance is effective for annual reporting periods beginning after December 15, 2017, including interim periods during the annual period. Early adoption is allowed for annual reporting periods beginning after December 15, 2016. Different transition methods are available - full retrospective method and a modified retrospective (cumulative effect) approach. The Company has not selected the transition method and is currently evaluating the impact of the adoption of this guidance on its consolidated financial statements.
2. Net Loss Per Common Share
The Company calculates basic net income (loss) per common share by dividing net income (loss) by the weighted average number of common shares outstanding during the reporting period. Diluted net income (loss) per common share is computed by dividing net income (loss) by the weighted-average number of common and potentially dilutive common shares outstanding during the reporting period. Potentially dilutive securities are composed of incremental common shares issuable upon the exercise of stock options and restricted stock units.
The following table sets forth the computation of net loss per share:
|
|
Year Ended December 31, |
|
|||||||||
|
|
2015 |
|
|
2014 |
|
|
2013 |
|
|||
|
|
(in thousands, except per share data) |
|
|||||||||
|
Net loss attributable to the Company |
$ |
(17,060 |
) |
|
$ |
(15,295 |
) |
|
$ |
(2,965 |
) |
|
Weighted average common shares outstanding - basic |
|
55,589 |
|
|
|
53,451 |
|
|
|
51,596 |
|
|
Dilutive effect of employee stock plans |
|
- |
|
|
|
- |
|
|
|
- |
|
|
Weighted average common shares outstanding - diluted |
|
55,589 |
|
|
|
53,451 |
|
|
|
51,596 |
|
|
Net loss per common share, basic |
$ |
(0.31 |
) |
|
$ |
(0.29 |
) |
|
$ |
(0.06 |
) |
|
Net loss per common share, diluted |
$ |
(0.31 |
) |
|
$ |
(0.29 |
) |
|
$ |
(0.06 |
) |
The following outstanding options and restricted stock units were excluded from the computation of diluted net loss per common share for the periods presented because including them would have had an anti-dilutive effect:
|
|
Year Ended December 31, |
|
|||||||||
|
|
2015 |
|
|
2014 |
|
|
2013 |
|
|||
|
|
(in thousands) |
|
|||||||||
|
Options to purchase common stock |
|
2,028 |
|
|
|
2,626 |
|
|
|
3,552 |
|
|
Restricted stock units |
|
2,194 |
|
|
|
2,465 |
|
|
|
1,776 |
|
3. Fair Value Measurements
The Company’s financial assets and liabilities measured at fair value on a recurring basis include cash equivalents. Fair value is defined as the price that would be received from selling an asset and paid to transfer a liability in an orderly transaction between market participants at the measurement date. A three-tiered fair value hierarchy is established as basis for considering the above assumptions and determining the inputs used in the valuation methodologies in measuring fair values. The three levels of inputs are defined as follows:
Level 1 – Unadjusted quoted market prices for identical assets or liabilities in active markets that the Company has the ability to access.
Level 2 – Quoted prices for similar assets or liabilities in active markets; quoted prices for identical or similar assets or liabilities in inactive markets.
Level 3 – Valuations based on models where significant inputs are not observable. The unobservable inputs reflect the Company’s own assumptions about the assumptions that market participants would use.
55
At December 31, 2015 and 2014, the Company’s cash equivalents comprised of an investment in a money market fund. In accordance with the guidance for fair value measurements and disclosures, the Company determined the fair value hierarchy of its money market fund and short-term bank deposit as Level 1, which approximated $102.2 million and $93.2 million as of December 31, 2015 and 2014, respectively. The carrying amount of the Company’s accounts receivable, accounts payable and accrued expenses approximate fair value due to their short term maturities.
See Note 5 of Notes to Consolidated Financial Statements for discussions about using Level 3 fair value hierarchy measurements. There are no other financial assets and liabilities, except those disclosed in Note 5 of Notes to Consolidated financial statements that require Level 2 or Level 3 fair value hierarchy measurements and disclosures.
Inventories
|
|
As of December 31, |
|
|||||
|
|
2015 |
|
|
2014 |
|
||
|
|
(in thousands) |
|
|||||
|
Work-in-process |
$ |
33,701 |
|
|
$ |
37,207 |
|
|
Finished goods |
|
13,308 |
|
|
|
14,715 |
|
|
|
$ |
47,009 |
|
|
$ |
51,922 |
|
Property and equipment, net
|
|
As of December 31, |
|
|||||
|
|
2015 |
|
|
2014 |
|
||
|
|
(in thousands) |
|
|||||
|
Test equipment and mask costs |
$ |
71,021 |
|
|
$ |
50,591 |
|
|
Software, design tools, computer and other equipment |
|
62,331 |
|
|
|
53,686 |
|
|
Furniture, office equipment and leasehold improvements |
|
5,755 |
|
|
|
2,500 |
|
|
|
|
139,107 |
|
|
|
106,777 |
|
|
Less: accumulated depreciation and amortization |
|
(74,430 |
) |
|
|
(49,814 |
) |
|
|
$ |
64,677 |
|
|
$ |
56,963 |
|
Depreciation and amortization expense was $32.9 million, $19.5 million and $17.7 million for the years ended December 31, 2015, 2014 and 2013, respectively. Certain fully depreciated property and equipment have been eliminated from both the gross and accumulated amount.
The Company has capitalized $8.9 million, $5.9 million and $3.6 million of mask costs for the years ended December 31, 2015, 2014 and 2013, respectively. For the years ended December 31, 2015, 2014 and 2013, total amortization expense from masks was $4.9 million, $2.6 million and $4.5 million, respectively. Total mask cost, net of accumulated depreciation at December 31, 2015 and 2014 was $9.6 million and $5.6 million, respectively.
The Company leases certain design tools and test equipment under capital lease and certain financing arrangements which are included in property and equipment, which total cost, net of accumulated amortization amounted to $25.3 million and $35.8 million at December 31, 2015 and 2014, respectively. Amortization expense related to assets recorded under capital lease and certain financing agreements was $14.7 million, $9.5 million and $6.5 million for the years ended December 31, 2015, 2014 and 2013, respectively.
56
Other accrued expenses and other current liabilities
|
|
As of December 31, |
|
|||||
|
|
2015 |
|
|
2014 |
|
||
|
|
(in thousands) |
|
|||||
|
Accrued compensation and related benefits |
$ |
4,485 |
|
|
$ |
4,855 |
|
|
Professional fees |
|
1,018 |
|
|
|
1,029 |
|
|
Accrued royalties |
|
761 |
|
|
|
638 |
|
|
Manufacturing rights payable (Note 12) |
|
1,875 |
|
|
|
- |
|
|
Income tax payable |
|
541 |
|
|
|
451 |
|
|
Other |
|
763 |
|
|
|
809 |
|
|
|
$ |
9,443 |
|
|
$ |
7,782 |
|
Warranty Accrual
The following table presents a rollforward of the warranty liability, which is included within other accrued expenses and other current liabilities above:
|
|
Year Ended December 31, |
|
|||||||||
|
|
2015 |
|
|
2014 |
|
|
2013 |
|
|||
|
|
(in thousands) |
|
|||||||||
|
Beginning balance |
$ |
227 |
|
|
$ |
167 |
|
|
$ |
440 |
|
|
Accruals and adjustments |
|
459 |
|
|
|
679 |
|
|
|
206 |
|
|
Settlements |
|
(350 |
) |
|
|
(619 |
) |
|
|
(479 |
) |
|
Ending balance |
$ |
336 |
|
|
$ |
227 |
|
|
$ |
167 |
|
Deferred revenue
|
|
As of December 31, |
|
|||||
|
|
2015 |
|
|
2014 |
|
||
|
|
(in thousands) |
|
|||||
|
Services/support and maintenance |
$ |
5,531 |
|
|
$ |
5,769 |
|
|
Software license/subscription |
|
785 |
|
|
|
516 |
|
|
|
$ |
6,316 |
|
|
$ |
6,285 |
|
5. Business Combination and Divestitures
Xpliant, Inc.
Pursuant to the Agreement and Plan of Merger and Reorganization (“the Merger Agreement”) between the Company and Xpliant, Inc., a final closing occurred on April 29, 2015 as discussed in detail below. Between May 2012 and March 2015, the Company entered into several note purchase agreements and promissory notes with Xpliant to provide cash advances. Xpliant was a Delaware incorporated and privately held company, engaged in the design and development of next generation software defined network switch chips. Prior to the closing of the merger pursuant to the Merger Agreement between the Company and Xpliant, the Company concluded that Xpliant was a VIE as the Company was Xpliant’s primary beneficiary due to the Company’s involvement with Xpliant and the Company’s purchase option to acquire Xpliant. As such, the Company has included the accounts of Xpliant in the consolidated financial statements. The Company had made total cash advances of $85.8 million, consisting of $10.0 million under nine convertible notes which, as amended, matured on August 31, 2014 and $75.8 million under several promissory notes which originally mature between April 2015 and March 2016. All promissory notes were cancelled on July 31, 2015. The convertible notes and promissory notes bore an annual interest rate of 6%.
57
In addition to the funding received by Xpliant from the Company, between May 2012 and January 2014, certain third party investors (“non-controlling interest”) made cash advances of $13.0 million under several convertible notes which, as amended, matured on August 31, 2014 and $2.9 million under a convertible security. All of the convertible notes bore interest at a rate of 6%, payable at maturity. Two of the convertible notes held by a third party investor with a principal amount of $1.0 million matured and were paid by Xpliant in December 2013. Pursuant to the convertible notes, in the event Xpliant closed a corporate transaction, as defined in the convertible notes, the holders of the convertible notes were entitled to receive two times the outstanding principal plus any unpaid accrued interest. The convertible security had the same features as the convertible notes, with the exception of the requirement for repayment, interest and maturity. For accounting purposes, the Company determined that the convertible security had derivative features and determined that the fair value of the derivative features of the convertible security at the issuance date was approximately the same as the principal amount. All of the convertible notes and the derivative feature of convertible security were classified as Level 3 liability and were all remeasured and presented at fair value in the consolidated financial statements at each reporting period. Pursuant to the option to acquire Xpliant, in June 2014, the Company provided notice to Xpliant of its decision to exercise the purchase option. Therefore, the convertible notes and derivative features of convertible security were valued to two times its principal amount at its maturity date. As such, the Company recorded the change in estimated fair value of notes payable and other of $14.9 million in the consolidated statement of operations in 2014. Pursuant to the Merger Agreement between the Company and Xpliant as discussed in detail below, in October 2014, a portion of the cash advances made by the Company to Xpliant were used to settle all outstanding convertible notes, related accrued interest and convertible security held by non-controlling interest.
On July 30, 2014, the Company entered into the Merger Agreement, which was amended on October 8, 2014 and March 31, 2015 with Xpliant. Under the terms of the Merger Agreement, as amended, the Company paid approximately $3.6 million in total cash consideration in exchange for all outstanding securities held by Xpliant’s stockholders. Pursuant to the Merger Agreement, as amended, a first closing occurred on March 31, 2015 and the Company paid $2.5 million to Xpliant’s stockholders with respect to approximately 70% of the Xpliant stock outstanding and a second and final closing occurred on April 29, 2015 and the Company paid $1.1 million to Xpliant’s stockholders with respect to the then remaining approximately 30% of the Xpliant stock outstanding. Based on the substance of the transaction, the Company recorded the payments of cash consideration to Xpliant stockholders as a decrease to the Company’s additional paid-in capital within stockholders’ equity.
Pursuant to the Merger Agreement and in connection with the transaction contemplated by the Merger Agreement, in October 2014, a portion of the cash advances made by the Company to Xpliant were used to settle all outstanding convertible notes, related accrued interest and the convertible security held by non-controlling interest of $30.8 million. Additionally, $1.7 million was used to make cash payments to the employees of Xpliant that were hired by the Company. Further, per the Merger Agreement, in October 2014, the Company issued RSU’s of approximately 193,000 shares with a fair value of $8.7 million based on the Company’s closing stock price at the grant date to the employees of Xpliant that were hired by the Company.
Prior to the closing of the merger pursuant to the Merger Agreement and the settlement of the outstanding convertible notes and convertible security to non-controlling interest, the net loss of Xpliant was allocated to the Company and to the non-controlling interest based on the outstanding cash advances provided to Xpliant at each reporting period.
Disposition of Certain Consumer Product Assets
In September 2012, the Company completed the sale of certain consumer product assets to a third party company. Under an asset purchase agreement, the Company agreed to transfer certain assets such as property and equipment and intangible assets to the third party company for an aggregate cash consideration of $2.4 million, payable in installments starting from January 10, 2013 through January 10, 2015. The Company determined that the payment terms were not fixed and determinable and as such the Company treated this transaction as disposition of assets and recognized the future payments as a credit to sales, general and administrative expenses when the payments became due. The carrying value of the assets related to the sale of $2.7 million was recognized as a loss on disposition of certain consumer product assets within sales, general and administrative expenses in 2012. The Company received total installment cash consideration of $0.4 million, $1.0 million and $1.0 million for the years ended December 31, 2015, 2014 and 2013, respectively, which was recognized as a credit within sales, general and administrative expenses.
Sale of Held for Sale Assets
In January 2013, the Company completed the sale of certain assets to a third-party company. Under the asset purchase agreement, the Company agreed to transfer certain assets for an aggregate cash consideration of $3.3 million and the carrying value of the assets held for sale was approximately $2.6 million. The difference between the sale consideration and the carrying value of the assets held for sale of $0.7 million was recognized as a gain on sale of held for sale assets within sales, general and administrative expenses.
58
6. Goodwill and Intangible Assets, Net
Goodwill
Goodwill represents the excess of the purchase price over the fair value of the net tangible and identifiable intangible assets acquired in a business combination. The carrying value of goodwill as of December 31, 2015 was $71.5 million, unchanged from the balance at December 31, 2014.
The Company reviews goodwill for impairment annually at the beginning of its fourth calendar quarter or whenever events or changes in circumstances that would more-likely-than-not reduce the fair value of a reporting unit below its carrying amount. The Company has one reporting unit. As such, the Company performed a qualitative assessment of the goodwill at the Company level as a whole and concluded that it was more-likely-than-not that goodwill is not impaired. In assessing the qualitative factors, the Company considered among others these key factors: (i) changes in the industry and competitive environment; (ii) market capitalization; (iii) stock price; and (iv) overall financial performance.
Intangible assets, net
|
|
|
As of December 31, 2015 |
|
|
|
|
|
|||||||||
|
|
|
Gross |
|
|
Accumulated Amortization |
|
|
Net |
|
|
Weighted average remaining amortization period (years) |
|
||||
|
|
|
(in thousands) |
|
|
|
|
|
|||||||||
|
Technology licenses |
|
$ |
70,521 |
|
|
$ |
(35,625 |
) |
|
$ |
34,896 |
|
|
|
6.10 |
|
|
Existing and core technology - product |
|
|
41,711 |
|
|
|
(41,115 |
) |
|
|
596 |
|
|
|
0.99 |
|
|
Customer contracts and relationships |
|
|
2,215 |
|
|
|
(2,215 |
) |
|
|
- |
|
|
- |
|
|
|
Trade name |
|
|
2,296 |
|
|
|
(2,296 |
) |
|
|
- |
|
|
- |
|
|
|
Total amortizable intangible assets |
|
$ |
116,743 |
|
|
$ |
(81,251 |
) |
|
$ |
35,492 |
|
|
|
6.01 |
|
|
|
|
As of December 31, 2014 |
|
|
|
|
|
|||||||||
|
|
|
Gross |
|
|
Accumulated Amortization |
|
|
Net |
|
|
Weighted average remaining amortization period (years) |
|
||||
|
|
|
(in thousands) |
|
|
|
|
|
|||||||||
|
Technology licenses |
|
$ |
64,002 |
|
|
$ |
(28,247 |
) |
|
$ |
35,755 |
|
|
|
7.07 |
|
|
Existing and core technology - product |
|
|
42,085 |
|
|
|
(40,264 |
) |
|
|
1,821 |
|
|
|
1.39 |
|
|
Customer contracts and relationships |
|
|
8,991 |
|
|
|
(8,965 |
) |
|
|
26 |
|
|
|
0.83 |
|
|
Trade name |
|
|
2,296 |
|
|
|
(2,254 |
) |
|
|
42 |
|
|
|
0.17 |
|
|
Order backlog |
|
|
640 |
|
|
|
(640 |
) |
|
|
- |
|
|
- |
|
|
|
Total amortizable intangible assets |
|
$ |
118,014 |
|
|
$ |
(80,370 |
) |
|
$ |
37,644 |
|
|
|
6.79 |
|
Amortization expense was $9.6 million, $14.6 million and $23.3 million for the years ended December 31, 2015, 2014 and 2013, respectively. The amortization expense for the year ended December 31, 2013 includes the effect of the change in the estimated useful lives of certain consumer product related intangible assets amounting to $6.2 million, or $0.12 earnings per share attributable to the Company. Certain fully amortized intangible assets have been eliminated from both the gross and accumulated amount.
The estimated future amortization expense of amortizable intangible assets is as follows (in thousands):
|
2016 |
|
|
|
$ |
8,643 |
|
|
2017 |
|
|
|
|
6,626 |
|
|
2018 |
|
|
|
|
5,001 |
|
|
2019 |
|
|
|
|
4,092 |
|
|
2020 |
|
|
|
|
3,751 |
|
|
2021 and thereafter |
|
|
|
|
7,379 |
|
|
|
|
|
|
$ |
35,492 |
|
59
7. Restructuring Accrual
In connection with a workforce reduction during the years ended December 31, 2014 and 2013, the Company incurred and paid $1.4 million and $1.4 million, respectively, related to severance and other related benefits. In addition, in 2014, the Company recorded restructuring accrual of $0.2 million related to the unused portion of a leased facility in Beijing China, which lease expired in December 2014. There were no outstanding accrued restructuring payables as of December 31, 2015 and 2014, respectively.
8. Stockholders’ Equity
Common and Preferred Stock
As of December 31, 2015 and 2014, the Company is authorized to issue 200,000,000 shares of $0.001 par value common stock and 10,000,000 shares of $0.001 par value preferred stock. The Company is authorized to issue preferred stock in one or more series and to fix the rights, preferences, privileges and restrictions thereof, including dividend rights, dividend rates, conversion rights, voting rights, terms of redemption and liquidation preferences. As of December 31, 2015 and 2014, no shares of preferred stock were outstanding.
2007 Stock Incentive Plan
Upon completion of its IPO in May 2007, the Company adopted the 2007 Stock Incentive Plan, the 2007 Plan, which reserved 5,000,000 shares of the Company’s common stock. The number of shares of the common stock reserved for issuance will be increased annually on January 1st each year for 10 years commencing from January 1, 2008 through January 1, 2017, by the lesser of (i) 5% of the total number of shares of the common stock outstanding on the applicable January 1st date or (ii) 5,000,000 shares. The board of directors may also act, prior to the first day of any fiscal year, to increase the number of shares as the board of directors shall determine, which number shall be less than each of (i) and (ii). The maximum number of shares that may be issued pursuant to the exercise of incentive stock options under the 2007 Plan is equal to 10,000,000 shares. As of December 31, 2015, there were 10,106,853 shares reserved for issuance under the 2007 Plan. The 2007 Plan provides for the grant of incentive stock options, non-statutory stock options, restricted stock awards, restricted stock unit awards, stock appreciation rights, performance stock awards, and other forms of equity compensation (collectively, “stock awards”), and performance cash awards, all of which may be granted to employees (including officers), directors, and consultants or affiliates. Awards granted under the 2007 Plan vest at the rate specified by the plan administrator, for stock options, typically with 1/8th of the shares vesting six months after the date of grant and 1/48th of the shares vesting monthly thereafter over the next three and one half years and for restricted stocks typically with quarterly vesting over four years. The term of awards expires seven to ten years from the date of grant. As of December 31, 2015, 16,122,851 shares have been granted under the 2007 Plan.
2001 Stock Incentive Plan
The Company’s 2001 Stock Incentive Plan, the 2001 Plan, expired as of December 31, 2011, thus there were no outstanding shares reserved for issuance. Options granted under the 2001 Plan were either incentive stock options or non-statutory stock options as determined by the Company’s board of directors. Options granted under the 2001 Plan vested at the rate specified by the plan administrator, typically with 1/8th of the shares vesting six months after the date of grant and 1/48th of the shares vesting monthly thereafter over the next three and one half years to four and one half years. The term of option expire ten years from the date of grant.
Under the Company’s 2001 Plan, certain employees have the right to early-exercise unvested stock options, subject to rights held by the Company to repurchase unvested shares in the event of voluntary or involuntary termination. For options granted prior to March 2005, the Company has the right to repurchase any such shares at the shares’ original purchase price. For options granted after March 2005, the Company has the right to repurchase such shares at the lower of market value or the original purchase price. No outstanding unvested shares of common stock as of December 31, 2015 and 2014.
60
Detail related to stock option activity is as follows:
|
|
|
Number of Options Outstanding |
|
|
Weighted Average Exercise Price |
|
||
|
Balance as of December 31, 2012 |
|
|
4,197,704 |
|
|
$ |
16.83 |
|
|
Options granted |
|
|
242,375 |
|
|
|
37.15 |
|
|
Options exercised |
|
|
(723,047 |
) |
|
|
14.95 |
|
|
Options cancelled and forfeited |
|
|
(164,816 |
) |
|
|
34.36 |
|
|
Balance as of December 31, 2013 |
|
|
3,552,216 |
|
|
|
17.79 |
|
|
Options granted |
|
|
165,000 |
|
|
|
38.78 |
|
|
Options exercised |
|
|
(1,082,914 |
) |
|
|
14.05 |
|
|
Options cancelled and forfeited |
|
|
(8,042 |
) |
|
|
28.46 |
|
|
Balance as of December 31, 2014 |
|
|
2,626,260 |
|
|
|
20.62 |
|
|
Options granted |
|
|
87,178 |
|
|
|
64.70 |
|
|
Options exercised |
|
|
(685,439 |
) |
|
|
14.02 |
|
|
Options cancelled and forfeited |
|
|
- |
|
|
|
- |
|
|
Balance as of December 31, 2015 |
|
|
2,027,999 |
|
|
|
24.75 |
|
The aggregate intrinsic value for options exercised during the years ended December 31, 2015, 2014 and 2013, were $37.4 million, $36.2 million and $16.0 million, respectively, representing the difference between the closing price of the Company’s common stock at the date of exercise and the exercise price paid.
The following table summarizes information about stock options outstanding as of December 31, 2015:
|
|
|
Outstanding Options |
|
|
Exercisable Options |
|
|
|
|
|
||||||||||||||
|
Exercise Prices |
|
Number of Shares |
|
|
Weighted Average Remaining Contractual Term |
|
|
Weighted Average Exercise Price |
|
|
Number of shares |
|
|
Weighted Average Exercise Price |
|
|
Aggregate Intrinsic Value |
|
||||||
|
$3.04 - $3.04 |
|
|
362,584 |
|
|
|
0.22 |
|
|
$ |
3.04 |
|
|
|
362,584 |
|
|
$ |
3.04 |
|
|
|
|
|
|
$5.42 - $8.52 |
|
|
14,126 |
|
|
|
1.01 |
|
|
|
7.35 |
|
|
|
14,126 |
|
|
|
7.35 |
|
|
|
|
|
|
$10.32 - $10.32 |
|
|
344,668 |
|
|
|
0.10 |
|
|
|
10.32 |
|
|
|
344,668 |
|
|
|
10.32 |
|
|
|
|
|
|
$13.50 - $24.16 |
|
|
312,675 |
|
|
|
0.90 |
|
|
|
22.44 |
|
|
|
312,675 |
|
|
|
22.44 |
|
|
|
|
|
|
$24.99 - $35.73 |
|
|
304,702 |
|
|
|
2.93 |
|
|
|
32.31 |
|
|
|
296,346 |
|
|
|
32.21 |
|
|
|
|
|
|
$37.63 - $37.63 |
|
|
409,961 |
|
|
|
3.20 |
|
|
|
37.42 |
|
|
|
342,967 |
|
|
|
37.38 |
|
|
|
|
|
|
$37.83 - $62.86 |
|
|
267,283 |
|
|
|
5.03 |
|
|
|
46.03 |
|
|
|
112,724 |
|
|
|
40.66 |
|
|
|
|
|
|
$76.38 - $76.38 |
|
|
12,000 |
|
|
|
6.46 |
|
|
|
76.38 |
|
|
|
6,000 |
|
|
|
76.38 |
|
|
|
|
|
|
$3.04 - $76.38 |
|
|
2,027,999 |
|
|
|
1.99 |
|
|
$ |
24.75 |
|
|
|
1,792,090 |
|
|
$ |
21.87 |
|
|
$ |
83,200,687 |
|
|
Exercisable |
|
|
1,792,090 |
|
|
|
1.58 |
|
|
$ |
21.87 |
|
|
|
|
|
|
|
|
|
|
$ |
78,633,864 |
|
|
Vested and expected to vest |
|
|
2,009,482 |
|
|
|
1.96 |
|
|
$ |
24.53 |
|
|
|
|
|
|
|
|
|
|
$ |
82,880,538 |
|
The aggregate intrinsic value for options outstanding at December 31, 2015, represents the difference between the weighted average exercise price and the closing price of the Company’s common stock at December 31, 2015, as reported on The NASDAQ Global Market, for all in the money options outstanding.
61
The fair value of each option grant for the years ended December 31, 2015, 2014 and 2013 were estimated on the date of grant using the Black-Scholes option-pricing model with the following assumptions below.
|
|
|
Year Ended December 31, |
|
|||||||||
|
|
|
2015 |
|
|
2014 |
|
|
2013 |
|
|||
|
Risk-free interest rate |
|
1.34% to 1.41% |
|
|
1.26% to 1.47% |
|
|
0.32% to 1.04% |
|
|||
|
Expected life |
|
3.77 to 4.58 years |
|
|
3.77 to 4.53 years |
|
|
3.77 to 4.53 years |
|
|||
|
Dividend yield |
|
|
0% |
|
|
|
0% |
|
|
|
0% |
|
|
Volatility |
|
41.0% to 43.0% |
|
|
43.8% to 45.1% |
|
|
45.8% to 49.6% |
|
|||
The estimated weighted-average grant date fair value of options granted for the years ended December 31, 2015, 2014 and 2013 was $23.79 per share, 14.63 per share and 14.91 per share, respectively.
As of December 31, 2015, there was $3.4 million of unrecognized compensation costs, net of estimated forfeitures, related to stock options granted under the Company’s 2007 Equity Incentive Plan and 2001 Stock Incentive Plan. The unrecognized compensation cost is expected to be recognized over a weighted average period of 2.07 years.
Restricted Stock Units
The Company began issuing RSUs in 2007. Shares are issued on the date the restricted stock units vest, and the fair value of the underlying stock on the dates of grant is recognized as stock-based compensation over a three or four-year vesting period. A summary of the activity of restricted stock for the related periods are presented below:
|
|
|
Number of Shares |
|
|
Weighted-Average Grant Date Fair Value Per Share |
|
||
|
Balance as of December 31, 2012 |
|
|
1,823,563 |
|
|
$ |
33.17 |
|
|
Granted |
|
|
1,119,570 |
|
|
|
36.32 |
|
|
Issued and released |
|
|
(867,213 |
) |
|
|
32.46 |
|
|
Cancelled and forfeited |
|
|
(299,750 |
) |
|
|
32.29 |
|
|
Balance as of December 31, 2013 |
|
|
1,776,170 |
|
|
|
35.64 |
|
|
Granted |
|
|
1,970,094 |
|
|
|
41.32 |
|
|
Issued and released |
|
|
(1,154,123 |
) |
|
|
37.55 |
|
|
Cancelled and forfeited |
|
|
(127,394 |
) |
|
|
37.05 |
|
|
Balance as of December 31, 2014 |
|
|
2,464,747 |
|
|
|
39.21 |
|
|
Granted |
|
|
955,592 |
|
|
|
61.82 |
|
|
Issued and released |
|
|
(1,115,525 |
) |
|
|
40.94 |
|
|
Cancelled and forfeited |
|
|
(110,746 |
) |
|
|
45.82 |
|
|
Balance as of December 31, 2015 |
|
|
2,194,068 |
|
|
|
47.85 |
|
The total intrinsic value of the RSUs outstanding as of December 31, 2015 was $144.2 million, representing the closing price of the Company’s stock on December 31, 2015, multiplied by the number of non-vested RSUs expected to vest as of December 31, 2015.
Included in the RSU grants in the year ended December 31, 2015 are one-year and two-year performance-based RSU’s granted in February 2015. The Company determined that the fair value of these performance RSU’s were $2.1 million and $0.7 million, respectively. Based on the Company’s evaluation of the probability of achieving the milestones as of December 31, 2015, no stock-based compensation was recorded related to these performance-based RSU’s. The Company continues to evaluate the probability of achieving the milestone of the outstanding performance-based RSU grants at each reporting period and updates the recognition of related stock-based compensation expense.
62
Also included in the RSU grants in the year ended December 31, 2015 in the table above is a four-year vesting market-based RSU granted in February 2015. This market-based RSU will vest if: (i) the average closing price of the Company’s common stock over a period of 30 consecutive trading days is equal to or greater than the price per share set by the Board; and (ii) the recipient remains in continuous service with the Company through such vesting period. The Company determined that the grant date fair value of this market-based RSU was $1.5 million and recorded the related stock-based compensation expense for the year ended December 31, 2015.
In October 2014, the Company granted RSU’s in connection with the Xpliant Merger Agreement. See Note 5 of Notes to Consolidated Financial Statements for related discussions.
As of December 31, 2015, there was $79.0 million of unrecognized compensation costs, net of estimated forfeitures related to RSUs granted under the Company’s 2007 Equity Incentive Plan. The unrecognized compensation cost is expected to be recognized over a weighted average period of 2.32 years.
Stock-Based Compensation
The following table presents the detail of stock-based compensation expense amounts included in the consolidated statements of operations for each of the periods presented:
|
|
Year Ended December 31, |
|
|||||||||
|
|
2015 |
|
|
2014 |
|
|
2013 |
|
|||
|
|
(in thousands) |
|
|||||||||
|
Cost of revenue |
$ |
765 |
|
|
$ |
954 |
|
|
$ |
951 |
|
|
Research and development |
|
29,085 |
|
|
|
32,328 |
|
|
|
18,577 |
|
|
Sales, general and administrative |
|
18,447 |
|
|
|
19,177 |
|
|
|
15,070 |
|
|
|
$ |
48,297 |
|
|
$ |
52,459 |
|
|
$ |
34,598 |
|
The total stock-based compensation cost capitalized as part of inventory as of December 31, 2015 and 2014 was not material.
9. Income Taxes
The following table presents the provision for income taxes and the effective tax rates:
|
|
|
Year Ended December 31, |
|
|||||||||
|
|
|
2015 |
|
|
2014 |
|
|
2013 |
|
|||
|
|
|
(in thousands) |
|
|||||||||
|
Loss before income taxes |
|
$ |
(15,378 |
) |
|
$ |
(24,182 |
) |
|
$ |
(11,751 |
) |
|
Provision for income taxes |
|
|
1,682 |
|
|
|
1,633 |
|
|
|
1,937 |
|
|
Effective tax rate |
|
|
(10.9 |
)% |
|
|
(6.8 |
)% |
|
|
(16.5 |
)% |
The provision for income taxes for the years ended December 31, 2015 and 2014 was primarily related to earnings in foreign jurisdictions. The provision for income taxes for the year ended December 31, 2013 was primarily related to foreign tax rate differential and increase in indefinite-lived intangible related deferred tax liability.
The domestic and foreign components of loss before income tax expense were as follows:
|
|
|
Year Ended December 31, |
|
|||||||||
|
|
|
2015 |
|
|
2014 |
|
|
2013 |
|
|||
|
|
|
(in thousands) |
|
|||||||||
|
Domestic |
|
$ |
(37,109 |
) |
|
$ |
(42,318 |
) |
|
$ |
(20,066 |
) |
|
Foreign |
|
|
21,731 |
|
|
|
18,136 |
|
|
|
8,315 |
|
|
|
|
$ |
(15,378 |
) |
|
$ |
(24,182 |
) |
|
$ |
(11,751 |
) |
63
The provision for income taxes consists of the following:
|
|
|
Year Ended December 31, |
|
|||||||||
|
|
|
2015 |
|
|
2014 |
|
|
2013 |
|
|||
|
|
|
(in thousands) |
|
|||||||||
|
Current tax provision (benefit) |
|
|
|
|
|
|
|
|
|
|
|
|
|
Domestic |
|
$ |
(15 |
) |
|
$ |
19 |
|
|
$ |
10 |
|
|
Foreign |
|
|
1,034 |
|
|
|
1,230 |
|
|
|
1,123 |
|
|
|
|
|
1,019 |
|
|
|
1,249 |
|
|
|
1,133 |
|
|
|
|
|
|
|
|
|
|
|
|
|
|
|
|
Deferred tax provision (benefit) |
|
|
|
|
|
|
|
|
|
|
|
|
|
Domestic |
|
|
564 |
|
|
|
627 |
|
|
|
713 |
|
|
Foreign |
|
|
99 |
|
|
|
(243 |
) |
|
|
91 |
|
|
|
|
|
663 |
|
|
|
384 |
|
|
|
804 |
|
|
Provision for income taxes |
|
$ |
1,682 |
|
|
$ |
1,633 |
|
|
$ |
1,937 |
|
The Company’s effective tax rate differs from the United States federal statutory rate as follows:
|
|
|
Year Ended December 31, |
|
|||||||||
|
|
|
2015 |
|
|
2014 |
|
|
2013 |
|
|||
|
Income tax at statutory rate |
|
|
35.0 |
% |
|
|
35.0 |
% |
|
|
35.0 |
% |
|
Stock compensation costs |
|
|
(13.1 |
) |
|
|
5.6 |
|
|
|
1.8 |
|
|
Other |
|
|
(0.1 |
) |
|
|
0.6 |
|
|
|
1.5 |
|
|
Convertible securities |
|
|
- |
|
|
|
(4.2 |
) |
|
|
- |
|
|
State taxes, net of federal benefit |
|
|
(0.1 |
) |
|
|
(0.4 |
) |
|
|
(1.6 |
) |
|
Foreign income inclusion in the U.S. |
|
|
(4.9 |
) |
|
|
(0.5 |
) |
|
|
(3.8 |
) |
|
Research and development credits |
|
|
42.6 |
|
|
|
24.2 |
|
|
|
48.0 |
|
|
Foreign tax rate differential |
|
|
41.5 |
|
|
|
19.6 |
|
|
|
46.7 |
|
|
Change in valuation allowance |
|
|
(111.8 |
) |
|
|
(86.7 |
) |
|
|
(144.1 |
) |
|
Total |
|
|
(10.9 |
)% |
|
|
(6.8 |
)% |
|
|
(16.5 |
)% |
The research and development credit, which had previously expired on December 31, 2014, was reinstated as part of the Protecting Americans from Tax Hikes Act of 2015, enacted on December 18, 2015. This legislation retroactively reinstated and permanently extended the research and development credit. There is no income tax provision impact as the Company has full valuation allowance against its related deferred tax assets.
On July 27, 2015, the U.S. Tax Court in Altera Corp. v. Commissioner, 145 T.C. No. 3 (2015) issued an opinion with respect to Altera’s litigation with the Internal Revenue Service, concerning the treatment of stock-based compensation expense in an inter-company cost sharing arrangement. In ruling in favor of Altera, the Tax Court invalidated the portion of the Treasury regulations requiring the inclusion of stock-based compensation expense in such inter-company cost-sharing arrangements. Accordingly, the Company adjusted its inter-company arrangement to reflect the recent ruling. On an ongoing basis, stock-based compensation will be excluded from intercompany charges.
64
The tax effects of the temporary differences that give rise to deferred tax assets and liabilities are as follows:
|
|
|
|
|
As of December 31, |
|
|||||
|
|
|
|
|
2015 |
|
|
2014 |
|
||
|
|
|
|
|
(in thousands) |
|
|||||
|
Deferred tax assets: |
|
|
|
|
|
|
|
|
|
|
|
Tax credits |
|
|
|
$ |
47,113 |
|
|
$ |
38,354 |
|
|
Net operating loss carryforwards |
|
|
|
|
40,325 |
|
|
|
44,975 |
|
|
Capitalized research and development |
|
|
|
|
18,093 |
|
|
|
4,652 |
|
|
Intangible assets |
|
|
|
|
6,374 |
|
|
|
3,881 |
|
|
Depreciation and amortization |
|
|
|
|
1,970 |
|
|
|
1,355 |
|
|
Stock compensation |
|
|
|
|
10,813 |
|
|
|
9,893 |
|
|
Other |
|
|
|
|
2,845 |
|
|
|
2,832 |
|
|
Gross deferred tax assets |
|
|
|
|
127,533 |
|
|
|
105,942 |
|
|
Less: valuation allowance |
|
|
|
|
(127,328 |
) |
|
|
(105,638 |
) |
|
Net deferred tax assets |
|
|
|
|
205 |
|
|
|
304 |
|
|
Deferred tax liabilities: |
|
|
|
|
|
|
|
|
|
|
|
Intangible assets |
|
|
|
|
(3,400 |
) |
|
|
(2,836 |
) |
|
Net deferred tax liabilities |
|
|
|
$ |
(3,195 |
) |
|
$ |
(2,532 |
) |
|
|
|
|
|
|
|
|
|
|
|
|
|
Reported As |
|
|
|
|
|
|
|
|
|
|
|
Deferred tax assets, non-current |
|
|
|
$ |
222 |
|
|
$ |
318 |
|
|
Deferred tax liabilities, current |
|
|
|
|
- |
|
|
|
(14 |
) |
|
Deferred tax liabilities, non-current |
|
|
|
|
(3,417 |
) |
|
|
(2,836 |
) |
|
Net deferred tax liabilities |
|
|
|
$ |
(3,195 |
) |
|
$ |
(2,532 |
) |
As of December 31, 2015, the Company had total net operating loss carryforwards for federal and states of California and Massachusetts income tax purposes of $371.1 million and $200.1 million, respectively. If not utilized, these federal and state net operating loss carryforwards will expire beginning in 2020 and 2016, respectively. The federal and states of California and Massachusetts net operating loss carryforwards include excess windfall deductions of $214.3 million and $130.5 million, respectively.
The Company is tracking the portion of its deferred tax assets attributable to stock option benefits in a separate memo account pursuant to the accounting guidance for stock-based compensation. Therefore, these amounts are no longer included in the Company’s gross or net deferred tax assets. Pursuant to the guidance for stock-based compensation, the stock option benefits of approximately $83.1 million will be recorded within stockholders’ equity when it reduces cash taxes payable. The Company uses the “with and without” approach in determining when excess tax benefits have been realized, and the Company considers the direct effects of stock option deductions to calculate excess tax benefits.
As of December 31, 2015, the Company also had federal and state research and development tax credit carryforwards of approximately $40.7 million and $36.2 million, respectively. The federal and state tax credit carryforwards will expire commencing 2020 and 2016, respectively, except for the California research tax credits which carry forward indefinitely. The Company also has various federal tax credits of approximately $0.9 million.
The Company’s net deferred tax assets relate predominantly to its U.S. tax jurisdiction. A full valuation allowance against the Company federal and state net deferred tax assets has been in place since 2012. The Company periodically evaluates the realizability of its net deferred tax assets based on all available evidence, both positive and negative. The realization of net deferred tax assets is dependent on the Company's ability to generate sufficient future taxable income during periods prior to the expiration of tax attributes to fully utilize these assets. The Company weighed both positive and negative evidence and determined that there is a continued need for a valuation allowance as the Company is in a cumulative loss position over the previous three years, which is considered significant negative evidence. As such, the Company has not changed its judgment regarding the need for a full valuation allowance on its federal and state deferred tax assets as of December 31, 2014 and 2015. Until such time, consumption of tax attributes to offset profits will reduce the overall level of deferred tax assets subject to valuation allowance. Should the Company determine that it would be able to realize its remaining deferred tax assets in the foreseeable future, an adjustment to its remaining deferred tax assets would cause a material increase to net income in the period such determination is made.
65
The Company reviews whether the utilization of its net operating losses and research credits are subject to an annual limitation due to the ownership change limitations provided by the Internal Revenue Code and similar state provisions. Utilization of these carryforwards is restricted and results in some amount expiring prior to benefiting the Company. The deferred tax assets shown above have been adjusted to reflect these expiring carryforwards.
Undistributed earnings of the Company’s foreign subsidiaries of approximately $38.3 million and $4.5 million as of December 31, 2015 and 2014, respectively, are considered to be indefinitely reinvested and, accordingly, no provisions for federal and state income taxes have been provided thereon. Upon distribution of those earnings in the form of dividends or otherwise, the Company would be subject to both United States income taxes (subject to an adjustment for foreign tax credits) and withholding taxes payable to various foreign countries. As of December 31, 2015 and 2014, the amount of potential United States income tax of a future distribution would result in an immaterial amount of United States and foreign taxes.
The following table summarizes the activity related to the unrecognized tax benefits:
|
|
|
Year Ended December 31, |
|
|||||||||
|
|
|
2015 |
|
|
2014 |
|
|
2013 |
|
|||
|
|
|
(in thousands) |
|
|||||||||
|
Balance at beginning of the year |
|
$ |
16,270 |
|
|
$ |
14,625 |
|
|
$ |
12,749 |
|
|
Gross increases (decreases) related to prior year's tax positions |
|
|
398 |
|
|
|
199 |
|
|
|
(526 |
) |
|
Gross increases related to current year's tax positions |
|
|
3,138 |
|
|
|
1,446 |
|
|
|
2,402 |
|
|
Releases related to prior year's tax positions |
|
|
(97 |
) |
|
|
- |
|
|
|
- |
|
|
Balance at the end of the year |
|
$ |
19,709 |
|
|
$ |
16,270 |
|
|
$ |
14,625 |
|
Included in the unrecognized tax benefits at December 31, 2015 is $1.0 million that, if recognized, would reduce the Company’s annual effective tax rate after considering the valuation allowance. The Company’s practice is to recognize interest and/or penalties related to income tax matters in income tax expense. The Company has immaterial accrued potential penalties and interest during the year ended December 31, 2015, 2014 and 2013. The Company does not expect its unrecognized tax benefits to change materially over the next 12 months.
Beginning in 2011, the Company is operating under tax incentives in Singapore, which are effective through February 2020. The tax incentives are conditional upon the Company meeting certain employment, revenue, and investment thresholds. The Company realized benefits from the reduced tax rate for the periods presented as follows:
|
|
|
Year Ended December 31, |
|
|||||||||
|
|
|
2015 |
|
|
2014 |
|
|
2013 |
|
|||
|
|
|
(in thousands) |
|
|||||||||
|
Provision for Singapore entity at statutory tax rate of 17% |
|
$ |
811 |
|
|
$ |
719 |
|
|
$ |
615 |
|
|
Provision for (benefit from) Singapore entity in the consolidated statement of operations |
|
|
310 |
|
|
|
303 |
|
|
|
(209 |
) |
|
Benefit from preferential tax rate differential |
|
|
(501 |
) |
|
|
(416 |
) |
|
|
(824 |
) |
|
Impact of tax benefits per basic and diluted share |
|
$ |
(0.01 |
) |
|
$ |
(0.01 |
) |
|
$ |
(0.02 |
) |
The Company’s major tax jurisdictions are the United States federal government, the states of California and Massachusetts, Japan, India, China and Singapore. The Company files income tax returns in the United States federal jurisdiction, the states of California and Massachusetts, various other states, and foreign jurisdictions in which it has a subsidiary or branch operations. The United States federal corporation income tax returns beginning with the 2000 tax year remain subject to examination by the Internal Revenue Service, or IRS. The California corporation income tax returns beginning with the 2000 tax year remain subject to examination by the California Franchise Tax Board. As of December 31, 2015, there are no on-going tax audits in the major tax jurisdictions other than India. The India tax audit is for the tax years 2011, 2012 and 2013. The Company does not expect any material tax adjustments from either of these audits.
10. Retirement Plan
The Company has established a defined contribution savings plan under Section 401(k) of the Internal Revenue Code. This plan covers substantially all employees who meet minimum age and service requirements and allows participants to defer a portion of their annual compensation on a pre-tax basis. The Company matches 50% of the employees’ annual contribution up to two thousand dollars per employee. The Company contributions to the plan may be made at the discretion of the Company’s board of directors. For the years ended December 31, 2015, 2014 and 2013, the Company’s defined contribution expense was $1.1 million, $1.0 million and $0.8 million, respectively.
66
In connection with local foreign laws, the Company is required to have a tenured-based defined benefit plan for its employees in Korea and India. The Company’s tenured-based payout liability is calculated based on the salary of each employee multiplied by the years of such employee’s employment, and is reflected on the Company’s consolidated balance sheets in other non-current liabilities on an accrual basis. The total liability from such defined benefit plan amounted to $0.4 million and $0.5 million as of December 31, 2015 and 2014, respectively.
11. Segment and Geographic Information
Operating segments are based on components of the Company that engage in business activity that earn revenue and incur expenses and (a) whose operating results are regularly reviewed by the Company’s chief operating decision maker, or CODM, to make decisions about resource allocation and performance and (b) for which discrete financial information is available. The Company manages and operates as one operating segment.
The Company’s net revenue consists primarily of sale of semiconductor products and to a lesser extent also derives revenue from licensing software and related maintenance and support. The revenue from these sources is classified by the Company as product revenue. The Company also generates revenue from professional service arrangements which is categorized as service revenue. The total service revenue is less than 10% of the Company’s total net revenue for the years ended December 31, 2015, 2014 and 2013. The Company categorizes its net revenue in two different markets, (i) the enterprise network, data center and access and service provider markets; and (ii) broadband and consumer markets. The net revenue by markets for the periods indicated was as follows:
|
|
Year Ended December 31, |
|
|||||||||
|
|
2015 |
|
|
2014 |
|
|
2013 |
|
|||
|
|
(in thousands) |
|
|||||||||
|
Enterprise network, data center and access and service provider markets |
$ |
377,809 |
|
|
$ |
341,056 |
|
|
$ |
259,860 |
|
|
Broadband and consumer markets |
|
34,935 |
|
|
|
31,922 |
|
|
|
44,133 |
|
|
|
$ |
412,744 |
|
|
$ |
372,978 |
|
|
$ |
303,993 |
|
The following table is based on the geographic location of the original equipment manufacturers, the contract manufacturers or the distributors who purchased the Company’s products. For sales to the distributors, their geographic location may be different from the geographic locations of the ultimate end customers.
Net revenue by geography for the periods indicated were as follows:
|
|
Year Ended December 31, |
|
|||||||||
|
|
2015 |
|
|
2014 |
|
|
2013 |
|
|||
|
|
(in thousands) |
|
|||||||||
|
United States |
$ |
128,431 |
|
|
$ |
111,997 |
|
|
$ |
90,537 |
|
|
China |
|
100,980 |
|
|
|
93,045 |
|
|
|
77,965 |
|
|
Mexico |
|
34,452 |
|
|
|
27,184 |
|
|
|
22,572 |
|
|
Korea |
|
28,578 |
|
|
|
28,665 |
|
|
|
30,003 |
|
|
Taiwan |
|
34,533 |
|
|
|
29,229 |
|
|
|
26,023 |
|
|
Finland |
|
38,283 |
|
|
|
44,976 |
|
|
|
17,767 |
|
|
Germany |
|
13,272 |
|
|
|
10,335 |
|
|
|
5,947 |
|
|
Other countries |
|
34,215 |
|
|
|
27,547 |
|
|
|
33,179 |
|
|
Total |
$ |
412,744 |
|
|
$ |
372,978 |
|
|
$ |
303,993 |
|
The following table sets forth the tangible long lived assets, which consist of property and equipment, net by geographic regions:
|
|
As of December 31, |
|
|||||
|
|
2015 |
|
|
2014 |
|
||
|
|
(in thousands) |
|
|
|
|
|
|
|
United States |
$ |
52,547 |
|
|
$ |
49,856 |
|
|
All other countries |
|
12,130 |
|
|
|
7,107 |
|
|
Total |
$ |
64,677 |
|
|
$ |
56,963 |
|
67
12. Commitments and Contingencies
The Company is not currently a party to any legal proceedings, the outcome of which, if determined adversely to the Company, would have a material adverse effect on the consolidated financial position, results of operations or cash flows of the Company.
The Company leases its facilities under non-cancelable operating leases, which contain renewal options and escalation clauses, and expire on various dates ending in October 2022.
The capital lease and technology license obligations include future cash payments payable primarily for license agreements with various outside vendors. For license agreements which qualify under capital lease and where installment payments extend beyond one year, the present value of the future installment payments are capitalized and included as part of intangible assets or property and equipment which is amortized over the estimated useful lives of the related licenses.
Minimum commitments under non-cancelable operating leases and capital lease and technology license obligations as of December 31, 2015 are as follows:
|
|
|
Capital lease and technology license obligations |
|
|
Operating leases |
|
|
Total |
|
|||
|
|
|
(in thousands) |
|
|||||||||
|
2016 |
|
$ |
21,766 |
|
|
$ |
9,012 |
|
|
$ |
30,778 |
|
|
2017 |
|
|
8,795 |
|
|
|
8,781 |
|
|
|
17,576 |
|
|
2018 |
|
|
1,075 |
|
|
|
8,947 |
|
|
|
10,022 |
|
|
2019 |
|
|
- |
|
|
|
8,847 |
|
|
|
8,847 |
|
|
2020 |
|
|
- |
|
|
|
8,966 |
|
|
|
8,966 |
|
|
2021 thereafter |
|
|
- |
|
|
|
14,169 |
|
|
|
14,169 |
|
|
|
|
$ |
31,636 |
|
|
$ |
58,722 |
|
|
$ |
90,358 |
|
|
Less: Interest component (3.75% annual rate) |
|
|
1,170 |
|
|
|
|
|
|
|
|
|
|
Present value of minimum lease payment |
|
|
30,466 |
|
|
|
|
|
|
|
|
|
|
|
|
|
|
|
|
|
|
|
|
|
|
|
|
Current portion of the obligations |
|
$ |
20,608 |
|
|
|
|
|
|
|
|
|
|
Long-term portion of obligations |
|
$ |
9,858 |
|
|
|
|
|
|
|
|
|
Rent expense incurred under operating leases was $8.0 million, $6.4 million and $5.1 million for the years ended December 31, 2015, 2014 and 2013, respectively.
In October 2014, the Company entered into a new purchase agreement with a third party vendor for $28.5 million, payable in installments that mature in August 2017 in exchange for certain design tools. In July 2015, the Company signed a purchase agreement with a third party vendor to acquire certain core software licenses amounting to $4.3 million, payable in 12 equal quarterly installments. In addition, the Company agreed to purchase additional combinations of core software licenses under a flexible spending program totaling $6.0 million for two years, with a minimum annual spend as specified in the agreement.
On March 30, 2015, Xpliant exercised its option to purchase the manufacturing rights to accelerate the takeover of manufacturing, and to relieve Xpliant from any further obligation to purchase product quantities from Xpliant’s application specific integrated circuit, or ASIC, vendor. In consideration for this, Xpliant agreed to pay a $7.5 million manufacturing rights licensing fee and a per-unit royalty fee for certain ASIC products sold to certain customers for a limited time. The manufacturing rights licensing fee is payable in 4 equal quarterly payments, with the first installment payment due on April 29, 2015 and each of the subsequent three installment payments being due on the first day of the following calendar quarter. The royalty shall be payable within 30 days after the end of each calendar quarter following the sale. Considering the terms of the purchase of the manufacturing rights, the Company recorded the full amount of the manufacturing rights licensing fee within research and development expense on the consolidated statement of operations and the related liability was recorded within other accrued expenses and other current liabilities on the consolidated balance sheets. During 2015, the Company paid the first, second and third installments due.
On January 30, 2015, the Company submitted an initial notification of a voluntary self-disclosure to the U.S. Department of Commerce, Bureau of Industry and Security, or BIS. The notification reported the Company’s discovery that hardware and software, with encryption functionality, may have been exported without the required BIS export license. With the assistance of outside counsel, the Company conducted a review of past export transactions during the past five years, and on July 17, 2015, the Company reported
68
its findings in a full voluntary self-disclosure to BIS. The findings reported that the Company exported certain encryption hardware and software to fifteen government end-users in the People’s Republic of China, Taiwan, Hong Kong, Singapore, India and South Korea, as well as one party on BIS' entity list, without the required BIS export license. The aggregate billings for the reported exports were approximately $0.5 million. The disclosure also addressed the Company’s remedial and corrective actions. BIS is reviewing the Company’s voluntary self-disclosure and the Company is cooperating fully with BIS. Violations of the export control laws may result in civil, administrative or criminal fines or penalties, loss of export privileges, debarment or a combination of these penalties. At this time the Company is unable to determine the outcome of the government’s investigation or its possible effect on the Company.
69
Selected Quarterly Consolidated Financial Data (Unaudited)
The following table sets forth the Company’s unaudited consolidated statements of operations data for each of the quarters in the periods ended December 31, 2015 and 2014. The quarterly data have been prepared on the same basis as the audited consolidated financial statements. This should be read together with the consolidated financial statements and related notes included elsewhere in this Annual Report.
|
|
Quarter Ended |
|
|||||||||||||||||||||||||||||
|
|
2015 |
|
|
2014 |
|
||||||||||||||||||||||||||
|
|
December 31 |
|
|
September 30 |
|
|
June 30 |
|
|
March 31 |
|
|
December 31 |
|
|
September 30 |
|
|
June 30 |
|
|
March 31 |
|
||||||||
|
|
(in thousands, except per share data) |
|
|||||||||||||||||||||||||||||
|
Net revenue |
$ |
100,942 |
|
|
$ |
105,063 |
|
|
$ |
104,961 |
|
|
$ |
101,778 |
|
|
$ |
101,223 |
|
|
$ |
97,833 |
|
|
$ |
90,681 |
|
|
$ |
83,241 |
|
|
Cost of revenue |
|
34,092 |
|
|
|
36,203 |
|
|
|
37,673 |
|
|
|
35,799 |
|
|
|
38,402 |
|
|
|
35,710 |
|
|
|
33,897 |
|
|
|
30,350 |
|
|
Gross profit |
|
66,850 |
|
|
|
68,860 |
|
|
|
67,288 |
|
|
|
65,979 |
|
|
|
62,821 |
|
|
|
62,123 |
|
|
|
56,784 |
|
|
|
52,891 |
|
|
Operating expenses: |
|
|
|
|
|
|
|
|
|
|
|
|
|
|
|
|
|
|
|
|
|
|
|
|
|
|
|
|
|
|
|
|
Research and development |
|
47,764 |
|
|
|
45,367 |
|
|
|
52,225 |
|
|
|
58,422 |
|
|
|
55,108 |
|
|
|
40,459 |
|
|
|
38,834 |
|
|
|
37,289 |
|
|
Sales, general and administrative |
|
19,397 |
|
|
|
18,522 |
|
|
|
20,336 |
|
|
|
20,671 |
|
|
|
19,314 |
|
|
|
18,141 |
|
|
|
17,017 |
|
|
|
15,932 |
|
|
Total operating expenses |
|
67,161 |
|
|
|
63,889 |
|
|
|
72,561 |
|
|
|
79,093 |
|
|
|
74,422 |
|
|
|
58,600 |
|
|
|
55,851 |
|
|
|
53,221 |
|
|
Income (loss) from operations |
|
(311 |
) |
|
|
4,971 |
|
|
|
(5,273 |
) |
|
|
(13,114 |
) |
|
|
(11,601 |
) |
|
|
3,523 |
|
|
|
933 |
|
|
|
(330 |
) |
|
Other expense, net: |
|
|
|
|
|
|
|
|
|
|
|
|
|
|
|
|
|
|
|
|
|
|
|
|
|
|
|
|
|
|
|
|
Interest expense |
|
(227 |
) |
|
|
(216 |
) |
|
|
(388 |
) |
|
|
(410 |
) |
|
|
(293 |
) |
|
|
(387 |
) |
|
|
(333 |
) |
|
|
(459 |
) |
|
Change in estimated fair value of notes payable and other |
|
- |
|
|
|
- |
|
|
|
- |
|
|
|
- |
|
|
|
- |
|
|
|
(103 |
) |
|
|
(13,927 |
) |
|
|
(858 |
) |
|
Other, net |
|
(138 |
) |
|
|
(173 |
) |
|
|
(33 |
) |
|
|
(66 |
) |
|
|
(313 |
) |
|
|
(116 |
) |
|
|
(53 |
) |
|
|
135 |
|
|
Total other expense, net |
|
(365 |
) |
|
|
(389 |
) |
|
|
(421 |
) |
|
|
(476 |
) |
|
|
(606 |
) |
|
|
(606 |
) |
|
|
(14,313 |
) |
|
|
(1,182 |
) |
|
Income (loss) before income taxes |
|
(676 |
) |
|
|
4,582 |
|
|
|
(5,694 |
) |
|
|
(13,590 |
) |
|
|
(12,207 |
) |
|
|
2,917 |
|
|
|
(13,380 |
) |
|
|
(1,512 |
) |
|
Provision for income taxes |
|
354 |
|
|
|
366 |
|
|
|
661 |
|
|
|
301 |
|
|
|
268 |
|
|
|
811 |
|
|
|
311 |
|
|
|
243 |
|
|
Net income (loss) |
|
(1,030 |
) |
|
|
4,216 |
|
|
|
(6,355 |
) |
|
|
(13,891 |
) |
|
|
(12,475 |
) |
|
|
2,106 |
|
|
|
(13,691 |
) |
|
|
(1,755 |
) |
|
Net loss attributable to non-controlling interest |
|
- |
|
|
|
- |
|
|
|
- |
|
|
|
- |
|
|
|
(444 |
) |
|
|
(3,327 |
) |
|
|
(2,647 |
) |
|
|
(4,102 |
) |
|
Net income (loss) attributable to the Company |
$ |
(1,030 |
) |
|
$ |
4,216 |
|
|
$ |
(6,355 |
) |
|
$ |
(13,891 |
) |
|
$ |
(12,031 |
) |
|
$ |
5,433 |
|
|
$ |
(11,044 |
) |
|
$ |
2,347 |
|
|
Earnings per share attributable to the Company: |
|
|
|
|
|
|
|
|
|
|
|
|
|
|
|
|
|
|
|
|
|
|
|
|
|
|
|
|
|
|
|
|
Net income (loss) per common share, basic |
$ |
(0.02 |
) |
|
$ |
0.08 |
|
|
$ |
(0.11 |
) |
|
$ |
(0.25 |
) |
|
$ |
(0.22 |
) |
|
$ |
0.10 |
|
|
$ |
(0.21 |
) |
|
$ |
0.04 |
|
|
Net income (loss) per common share, diluted |
$ |
(0.02 |
) |
|
$ |
0.07 |
|
|
$ |
(0.11 |
) |
|
$ |
(0.25 |
) |
|
$ |
(0.22 |
) |
|
$ |
0.10 |
|
|
$ |
(0.21 |
) |
|
$ |
0.04 |
|
|
(1) |
Research and development expense for the quarter ended March 31, 2015 included a charge of $7.5 million related to a manufacturing rights licensing fee due to a third party vendor. |
|
(2) |
Research and development expense and sales, general and administrative expenses for the quarter ended December 31, 2014 include stock-based compensation expense and related taxes of $8.8 million and $1.1 million, respectively, pursuant to the merger agreement with Xpliant. |
|
(3) |
A charge related to the change in estimated fair value of convertible notes and derivative feature of convertible security held by non-controlling interest for the quarters ended March 31, June 30 and September 30, 2014. |
70
Schedule II - Valuation and Qualifying Accounts
|
|
|
Balance at beginning of period |
|
|
Additions |
|
|
Deductions |
|
|
Balance at end of period |
|
||||
|
|
|
(in thousands) |
|
|||||||||||||
|
Year ended December 31, 2015 |
|
|
|
|
|
|
|
|
|
|
|
|
|
|
|
|
|
Allowance for doubtful accounts |
|
$ |
24 |
|
|
$ |
- |
|
|
$ |
- |
|
|
$ |
24 |
|
|
Allowance for customer returns |
|
|
1,118 |
|
|
|
4,513 |
|
|
|
(4,187 |
) |
|
|
1,444 |
|
|
Income tax valuation allowance |
|
|
105,638 |
|
|
|
21,690 |
|
|
|
- |
|
|
|
127,328 |
|
|
|
|
|
|
|
|
|
|
|
|
|
|
|
|
|
|
|
|
Year ended December 31, 2014 |
|
|
|
|
|
|
|
|
|
|
|
|
|
|
|
|
|
Allowance for doubtful accounts |
|
$ |
24 |
|
|
$ |
1 |
|
|
$ |
(1 |
) |
|
$ |
24 |
|
|
Allowance for customer returns |
|
|
909 |
|
|
|
3,716 |
|
|
|
(3,507 |
) |
|
|
1,118 |
|
|
Income tax valuation allowance |
|
|
79,928 |
|
|
|
25,710 |
|
|
|
- |
|
|
|
105,638 |
|
|
|
|
|
|
|
|
|
|
|
|
|
|
|
|
|
|
|
|
Year ended December 31, 2013 |
|
|
|
|
|
|
|
|
|
|
|
|
|
|
|
|
|
Allowance for doubtful accounts |
|
$ |
24 |
|
|
$ |
3 |
|
|
$ |
(3 |
) |
|
$ |
24 |
|
|
Allowance for customer returns |
|
|
967 |
|
|
|
2,752 |
|
|
|
(2,810 |
) |
|
|
909 |
|
|
Income tax valuation allowance |
|
|
59,736 |
|
|
|
20,192 |
|
|
|
- |
|
|
|
79,928 |
|
All other schedules are omitted because they are inapplicable or the requested information is shown in the consolidated financial statements of the registrant or related notes thereto.
Item 9. Changes in and Disagreements with Accountants on Accounting and Financial Disclosure
Not applicable.
Item 9A. Controls and Procedures
MANAGEMENT’S REPORT ON INTERNAL CONTROL OVER FINANCIAL REPORTING
Cavium, Inc.‘s management is responsible for establishing and maintaining adequate internal control over financial reporting for Cavium (as defined in Rules 13a-15(f) and 15d-15(f) under the Exchange Act of 1934, as amended). Cavium’s internal control over financial reporting is a process designed to provide reasonable assurance regarding the reliability of financial reporting and the preparation of financial statements for external purposes in accordance with U.S. generally accepted accounting principles. Cavium’s internal control over financial reporting includes those policies and procedures that (i) pertain to the maintenance of records that, in reasonable detail, accurately and fairly reflect the transactions and dispositions of the assets of Cavium; (ii) provide reasonable assurance that transactions are recorded as necessary to permit preparation of financial statements in accordance with generally accepted accounting principles, and that receipts and expenditures of Cavium are being made only in accordance with authorizations of management and directors of Cavium; and (iii) provide reasonable assurance regarding prevention or timely detection of unauthorized acquisition, use, or disposition of Cavium’s assets that could have a material effect on the financial statements.
Because of its inherent limitations, internal control over financial reporting may not prevent or detect misstatements. Also, projections of any evaluation of effectiveness to future periods are subject to the risk that controls may become inadequate because of changes in conditions, or that the degree of compliance with the policies or procedures may deteriorate. Our management does not expect that our disclosure controls or our internal control over financial reporting will prevent or detect all error and all fraud. A control system, no matter how well designed and operated, can provide only reasonable, not absolute, assurance that the control system’s objectives will be met. The design of a control system must reflect the fact that there are resource constraints, and the benefits of controls must be considered relative to their costs. Further, because of the inherent limitations in all control systems, no evaluation of controls can provide absolute assurance that misstatements due to error or fraud will not occur or that all control issues and instances of fraud, if any, have been detected. These inherent limitations include the realities that judgments in decision-making can be faulty and that breakdowns can occur because of simple error or mistake. Controls can also be circumvented by the individual acts of some persons, by collusion of two or more people, or by management override of the controls. The design of any system of controls is based in part on certain assumptions about the likelihood of future events, and there can be no assurance that any design will succeed in achieving its stated goals under all potential future conditions. Projections of any evaluation of controls effectiveness to future periods are subject to risks. Over time, controls may become inadequate because of changes in conditions or deterioration in the degree of compliance with policies or procedures.
71
Cavium’s management assessed the effectiveness of Cavium’s internal control over financial reporting as of December 31, 2015, utilizing the criteria set forth by the Committee of Sponsoring Organizations of the Treadway Commission (COSO) in Internal Control-Integrated Framework (2013). Based on the assessment by Cavium’s management, Cavium’s management determined that Cavium’s internal control over financial reporting was effective at a reasonable assurance level as of December 31, 2015. Management reviewed the results of their assessment with our Audit Committee. The effectiveness of Cavium’s internal control over financial reporting as of December 31, 2015, has been audited by PricewaterhouseCoopers LLP, an independent registered public accounting firm, as stated in their report which appears herein.
Changes in Internal Control Over Financial Reporting
There were no changes in our internal control over financial reporting (as defined in Rules 13a-15(f) and 15d-15(f) under the Exchange Act of 1934, as amended) during the quarter ended December 31, 2015, that have materially affected, or are reasonably likely to materially affect, our internal control over financial reporting.
Disclosure Controls and Procedures
Our management evaluated, with the participation of our Chief Executive Officer and our Chief Financial Officer, the effectiveness of our disclosure controls and procedures (as defined in Rules 13a-15(e) and 15d-15(e) of the Exchange Act of 1934, as amended) as of the end of the period covered by this Annual Report on Form 10-K. Based on this evaluation, our Chief Executive Officer and our Chief Financial Officer have concluded that our disclosure controls and procedures are effective to provide reasonable assurance that information we are required to disclose in reports that we file or submit under the Securities Exchange Act of 1934 is recorded, processed, summarized and reported within the time periods specified in Securities and Exchange Commission rules and forms, and that such information is accumulated and communicated to management as appropriate to allow for timely decisions regarding required disclosure.
None.
Certain information required by Part III is omitted from this Annual Report on Form 10-K since we intend to file our definitive proxy statement for our 2016 annual meeting of stockholders, pursuant to Regulation 14A of the Securities Exchange Act, not later than 120 days after the end of the fiscal year covered by this Annual Report on Form 10-K, and certain information to be included in the proxy statement is incorporated herein by reference.
Item 10. Directors, Executive Officers and Corporate Governance
The information required by this item with respect to directors and executive officers may be found under the caption “Executive Officers of the Registrant” in Part I, Item 1 of this Annual Report on Form 10-K, and in the section entitled “Proposal 1 - Election of Directors” appearing in the Proxy Statement. Such information is incorporated herein by reference.
The information required by this Item with respect to our audit committee and audit committee financial expert may be found in the section entitled “Proposal 1 - Election of Directors - Audit Committee” appearing in the Proxy Statement. Such information is incorporated herein by reference.
The information required by this Item with respect to compliance with Section 16(a) of the Securities Exchange Act of 1934 and our code of ethics may be found in the sections entitled “Section 16(a) Beneficial Ownership Reporting Compliance” and “Proposal 1 - Election of Directors - Code of Ethics,” respectively, appearing in the Proxy Statement. Such information is incorporated herein by reference.
We have adopted the Cavium, Inc. Code of Business Conduct and Ethics that applies to all officers, directors and employees. The Code of Business Conduct and Ethics is available on our website at http://investor.cavium.com. If we make any substantive amendments to the Code of Business Conduct and Ethics or grant any waivers from a provision of the Code to any executive officer or director, we will promptly disclose the nature of the amendment or waiver on our website.
72
Item 11. Executive Compensation.
The information required by this item is included in our proxy statement for our 2016 annual meeting of stockholders under the sections entitled “Executive Compensation,” “Director Compensation,” “Compensation Committee Interlocks and Insider Participation,” and “Compensation Committee Report” and is incorporated herein by reference.
Item 12. Security Ownership of Certain Beneficial Owners and Management and Related Stockholder Matters.
The information required by this item relating to security ownership of certain beneficial owners and management is included in our proxy statement for our 2016 annual meeting of stockholders under the section entitled “Security Ownership of Certain Beneficial Owners and Management” and is incorporated herein by reference.
The information required by this item with respect to securities authorized for issuance under our equity compensation plans is incorporated herein by reference to the information from the proxy statement for our 2016 annual meeting of stockholders under the section entitled “Equity Compensation Plan Information” and is incorporated herein by reference.
Item 13. Certain Relationships and Related Transactions, and Director Independence.
The information required by this item is included in our proxy statement for our 2016 annual meeting of stockholders under the sections entitled “Transactions with Related Persons” and “Information Regarding the Board of Directors and Corporate Governance” and is incorporated herein by reference.
Item 14. Principal Accounting Fees and Services.
The information required by this item is incorporated herein by reference to the information included in our proxy statement for our 2016 annual meeting of stockholders under the proposal entitled “Ratification of Selection of Auditors.”
Item 15. Exhibits, Financial Statement Schedules
Index to Consolidated Financial Statements
a. The following documents are filed as part of this report:
|
1. |
46 |
|
|
|
See Index to Financial Statements in Item 8 of this Annual Report on Form 10-K, which is incorporated herein by reference. |
|
|
2. |
71 |
|
|
|
Schedule II - Valuation and Qualifying Accounts |
|
|
3. |
75 |
|
|
|
The exhibits listed in the accompanying index to exhibits are filed or incorporated by reference as a part of this Annual Report on Form 10-K. |
|
73
Pursuant to the requirements of Section 13 or 15(d) of the Securities Exchange Act of 1934, the Registrant has duly caused this report to be signed on its behalf by the undersigned, thereunto duly authorized, on February 22, 2016.
|
|
Cavium, Inc. |
|
By |
/s/ Syed Ali |
|
|
Syed Ali |
|
|
President and Chief Executive Officer |
|
By |
/s/ Arthur Chadwick |
|
|
Arthur Chadwick |
|
|
Chief Financial Officer, Vice President of Finance and Administration |
Pursuant to the requirements of the Securities Exchange Act of 1934, this report has been signed below by the following persons on behalf of the registrant and in the capacities and on the dates indicated.
|
Signature |
|
Title |
|
Date |
|
/s/ Syed Ali |
President, Chief Executive Officer and Director (Principal Executive Officer) |
February 22, 2016 |
||
|
Syed Ali |
||||
|
/s/ Arthur Chadwick |
Chief Financial Officer, Vice President of Finance and Administration (Principal Financial and Accounting Officer) |
February 22, 2016 |
||
|
Arthur Chadwick |
||||
|
/s/ Sanjay Mehrotra |
Director |
February 22, 2016 |
||
|
Sanjay Mehrotra |
||||
|
/s/ Madhav Rajan |
Director |
February 22, 2016 |
||
|
Madhav Rajan |
||||
|
/s/ C.N. Reddy |
Director |
February 22, 2016 |
||
|
C.N. Reddy |
||||
|
/s/ Anthony Thornley |
Director |
February 22, 2016 |
||
|
Anthony Thornley |
74
|
|
|
|
|
Incorporated by Reference |
|
||||||
|
Exhibit |
|
Description |
|
Schedule |
|
File |
|
Exhibit |
|
Filing |
|
|
2.1 |
|
Agreement and Plan of Merger and Reorganization between the Registrant, Cavium Semiconductor Corporation, Cavium Networks LLC, and Xpliant, Inc. dated July 30, 2014 |
|
10-Q |
|
001-33435 |
|
2.1 |
|
8/1/2014 |
|
|
|
|
|
|
|
|
|
|
|
|
|
|
|
2.2 |
|
Amendment No. 1 to the Agreement and Plan of Merger and Reorganization between the Registrant, Cavium Semiconductor Corporation, Cavium Networks LLC, and Xpliant, Inc. dated October 8, 2014 |
|
10-Q |
|
001-33435 |
|
2.2 |
|
10/31/2014 |
|
|
|
|
|
|
|
|
|
|
|
|
|
|
|
2.3 |
|
Amendment No. 2 to the Agreement and Plan of Merger and Reorganization between the Registrant, Cavium Semiconductor Corporation, Cavium Networks LLC, and Xpliant, Inc. dated March 31, 2015 |
|
8-K |
|
001-33435 |
|
2.1 |
|
4/3/2015 |
|
|
|
|
|
|
|
|
|
|
|
|
|
|
|
2.4 |
|
Asset Purchase Agreement, dated January 25, 2011, between the Registrant and Wavesat Inc. |
|
8-K |
|
001-33435 |
|
2.1 |
|
1/31/2011 |
|
|
|
|
|
|
|
|
|
|
|
|
|
|
|
2.5 |
|
Asset Purchase Agreement, dated January 31, 2011, between the Registrant, Cavium Networks Singapore Pte. Ltd., and Celestial Semiconductor Ltd. |
|
8-K/A |
|
001-33435 |
|
2.2 |
|
2/3/2011 |
|
|
|
|
|
|
|
|
|
|
|
|
|
|
|
2.6 |
|
Supplemental Agreement relating to the Asset Purchase Agreement dated January 31, 2011 between the Registrant, Cavium Networks Singapore Pte. Ltd., and Celestial Semiconductor Ltd., dated March 4, 2011 |
|
8-K |
|
001-33435 |
|
1.1 |
|
3/9/2011 |
|
|
|
|
|
|
|
|
|
|
|
|
|
|
|
2.7 |
|
Agreement and Plan Merger and Reorganization by and between the Registrant, MV Acquisition Corporation, Manta, LLC., and MontaVista Software, Inc., dated November 6, 2009 |
|
8-K |
|
001-33435 |
|
2.1 |
|
11/10/2009 |
|
|
|
|
|
|
|
|
|
|
|
|
|
|
|
2.8 |
|
Amendment No. 1 to Agreement and Plan Merger and Reorganization by and between the Registrant, MV Acquisition Corporation, Manta, LLC ., and MontaVista Software, Inc., dated November 6, 2009 |
|
8-K |
|
001-33435 |
|
10.1 |
|
12/18/2009 |
|
|
|
|
|
|
|
|
|
|
|
|
|
|
|
3.1 |
|
Restated Certificate of Incorporation of the Registrant |
|
8-K |
|
001-33435 |
|
3.2 |
|
6/20/2011 |
|
|
|
|
|
|
|
|
|
|
|
|
|
|
|
3.2 |
|
Amended and Restated Bylaws of the Registrant |
|
S-1/A |
|
333-140660 |
|
3.5 |
|
4/13/2007 |
|
|
|
|
|
|
|
|
|
|
|
|
|
|
|
4.1 |
|
Reference is made to exhibits 3.1 and 3.2 |
|
|
|
|
|
|
|
|
|
|
|
|
|
|
|
|
|
|
|
|
|
|
|
4.2 |
|
Form of the Registrant’s Common Stock Certificate |
|
S-1/A |
|
333-140660 |
|
4.2 |
|
4/24/2007 |
|
|
|
|
|
|
|
|
|
|
|
|
|
|
|
4.4 |
|
Registration Rights Agreement by and between the Registrant and certain stockholders of MontaVista Software, Inc., dated December 14, 2009. |
|
8-K |
|
001-33435 |
|
4.1 |
|
12/18/2009 |
|
|
|
|
|
|
|
|
|
|
|
|
|
|
|
4.5 |
|
Shareholders Agreement dated March 4, 2011, between the Registrant and Celestial Semiconductor Ltd. |
|
8-K |
|
001-33435 |
|
1.2 |
|
3/9/2011 |
|
|
|
|
|
|
|
|
|
|
|
|
|
|
|
10.1 |
|
Form of Indemnity Agreement entered into between the Registrant and its directors and officers |
|
S-1 |
|
333-140660 |
|
10.1 |
|
2/13/2007 |
|
|
|
|
|
|
|
|
|
|
|
|
|
|
|
10.2† |
|
2001 Stock Incentive Plan and forms of agreements thereunder |
|
S-1 |
|
333-140660 |
|
10.2 |
|
2/13/2007 |
|
|
|
|
|
|
|
|
|
|
|
|
|
|
|
10.3† |
|
Amended 2007 Equity Incentive Plan |
|
10-Q |
|
001-33435 |
|
10.1 |
|
5/2/2014 |
|
|
|
|
|
|
|
|
|
|
|
|
|
|
|
10.4† |
|
Form of Option Agreement under 2007 Equity Incentive Plan |
|
10-Q |
|
001-33435 |
|
10.24 |
|
5/2/2008 |
|
|
|
|
|
|
|
|
|
|
|
|
|
|
|
10.5† |
|
Form of Option Grant Notice and Form of Exercise Notice under 2007 Equity Incentive Plan |
|
S-1 |
|
333-140660 |
|
10.4 |
|
2/13/2007 |
|
|
|
|
|
|
|
|
|
|
|
|
|
|
|
10.6† |
|
Form of Restricted Stock Unit Grant Notice under 2007 Equity Incentive Plan |
|
10-Q |
|
001-33435 |
|
10.25 |
|
8/8/2008 |
|
75
|
|
|
|
|
Incorporated by Reference |
|
||||||
|
Exhibit |
|
Description |
|
Schedule |
|
File |
|
Exhibit |
|
Filing |
|
|
|
|
|
|
|
|
|
|
|
|
|
|
|
10.7† |
|
Restricted Stock Unit Retention Plan |
|
10-K |
|
001-33435 |
|
10.7 |
|
3/2/2009 |
|
|
|
|
|
|
|
|
|
|
|
|
|
|
|
10.8† |
|
Executive Employment Agreement, dated January 2, 2001, between the Registrant and Syed Ali |
|
S-1 |
|
333-140660 |
|
10.5 |
|
2/13/2007 |
|
|
|
|
|
|
|
|
|
|
|
|
|
|
|
10.9† |
|
Amendment to Executive Employment Agreement, dated December 24, 2008, between the Registrant and Syed Ali |
|
10-K |
|
001-33435 |
|
10.9 |
|
3/2/2009 |
|
|
|
|
|
|
|
|
|
|
|
|
|
|
|
10.10† |
|
Employment Offer Letter, dated December 27, 2004, between the Registrant and Arthur Chadwick |
|
S-1 |
|
333-140660 |
|
10.6 |
|
2/13/2007 |
|
|
|
|
|
|
|
|
|
|
|
|
|
|
|
10.11† |
|
Employment Offer Letter, dated January 22, 2001, between the Registrant and Anil K. Jain |
|
S-1 |
|
333-140660 |
|
10.7 |
|
2/13/2007 |
|
|
|
|
|
|
|
|
|
|
|
|
|
|
|
10.12† |
|
Amendment to Offer Letter, dated December 24, 2008, between the Registrant and Anil Jain |
|
10-K |
|
001-33435 |
|
10.12 |
|
3/2/2009 |
|
|
|
|
|
|
|
|
|
|
|
|
|
|
|
10.13† |
|
Letter Agreement, dated September 1, 2006, between the Registrant and Anthony Thornley |
|
S-1 |
|
333-140660 |
|
10.10 |
|
2/13/2007 |
|
|
|
|
|
|
|
|
|
|
|
|
|
|
|
10.14† |
|
Letter Agreement, dated July 15, 2009, between the Registrant and Sanjay Mehrotra |
|
8-K |
|
001-33435 |
|
10.1 |
|
7/24/2009 |
|
|
|
|
|
|
|
|
|
|
|
|
|
|
|
10.15† |
|
Letter Agreement, dated March 22, 2013, between the Registrant and Madhav Rajan |
|
10-Q |
|
001-33435 |
|
10.2 |
|
5/6/2013 |
|
|
|
|
|
|
|
|
|
|
|
|
|
|
|
#10.16 |
|
Master Technology License Agreement, dated December 30, 2003, between the Registrant and MIPS Technologies, Inc. |
|
S-1/A |
|
333-140660 |
|
10.21 |
|
4/6/2007 |
|
|
|
|
|
|
|
|
|
|
|
|
|
|
|
#10.17 |
|
MIPS Core Technology Schedule, dated as of September 29, 2010, by and among the Registrant and MIPS Technologies, Inc. |
|
10-Q |
|
001-33435 |
|
10.1 |
|
10/29/2010 |
|
|
|
|
|
|
|
|
|
|
|
|
|
|
|
10.18 |
|
Lease Agreement dated March 17, 2011, between the Registrant and SI 37, LLC (“2315 Lease”) |
|
8-K |
|
001-33435 |
|
10.1 |
|
3/1/2011 |
|
|
|
|
|
|
|
|
|
|
|
|
|
|
|
10.19 |
|
Lease Agreement dated November 1, 2013, between the Registrant and SI 37, LLC (“2345 Lease”) |
|
10-Q |
|
001-33435 |
|
10.1 |
|
11/4/2013 |
|
|
|
|
|
|
|
|
|
|
|
|
|
|
|
10.20 |
|
First Amendment to Lease Agreement dated November 1, 2013, between the Registrant and SI 37, LLC (“2315 Lease”) |
|
10-Q |
|
001-33435 |
|
10.2 |
|
11/4/2013 |
|
|
|
|
|
|
|
|
|
|
|
|
|
|
|
10.21† |
|
Employment Offer Letter, dated February 11, 2011, between the Registrant and Vincent Pangrazio |
|
10-Q |
|
001-33435 |
|
10.1 |
|
5/6/2011 |
|
|
|
|
|
|
|
|
|
|
|
|
|
|
|
21.1* |
|
Subsidiaries of the Registrant |
|
|
|
|
|
|
|
|
|
|
|
|
|
|
|
|
|
|
|
|
|
|
|
23.1* |
|
Consent of PricewaterhouseCoopers LLP, independent registered public accounting firm |
|
|
|
|
|
|
|
|
|
|
|
|
|
|
|
|
|
|
|
|
|
|
|
31.1* |
|
Certification Pursuant to 18 U.S.C. Section 1350, as Adopted Pursuant to Section 302 of the Sarbanes-Oxley Act of 2002 of Syed B. Ali, President and Chief Executive Officer |
|
|
|
|
|
|
|
|
|
|
|
|
|
|
|
|
|
|
|
|
|
|
|
31.2* |
|
Certification Pursuant to 18 U.S.C. Section 1350, as Adopted Pursuant to Section 302 of the Sarbanes-Oxley Act of 2002 of Arthur D. Chadwick, Chief Financial Officer |
|
|
|
|
|
|
|
|
|
|
|
|
|
|
|
|
|
|
|
|
|
|
|
32.1* |
|
Certification Pursuant to 18 U.S.C. Section 1350, as Adopted Pursuant to Section 906 of the Sarbanes-Oxley Act of 2002 of Syed B. Ali, President and Chief Executive Officer and Arthur D. Chadwick, Chief Financial Officer |
|
|
|
|
|
|
|
|
|
|
|
|
|
|
|
|
|
|
|
|
|
|
|
101.INS |
|
XBRL Instance Document |
|
|
|
|
|
|
|
|
|
|
|
|
|
|
|
|
|
|
|
|
|
|
|
101.SCH |
|
XBRL Taxonomy Extension Schema Document |
|
|
|
|
|
|
|
|
|
76
|
|
|
|
|
Incorporated by Reference |
|
||||||
|
Exhibit |
|
Description |
|
Schedule |
|
File |
|
Exhibit |
|
Filing |
|
|
|
|
|
|
|
|
|
|
|
|
|
|
|
101.CAL |
|
XBRL Taxonomy Extension Calculation Linkbase Document |
|
|
|
|
|
|
|
|
|
|
|
|
|
|
|
|
|
|
|
|
|
|
|
101.DEF |
|
XBRL Taxonomy Extension Definition Linkbase |
|
|
|
|
|
|
|
|
|
|
|
|
|
|
|
|
|
|
|
|
|
|
|
101.LAB |
|
XBRL Taxonomy Extension Labels Linkbase Document |
|
|
|
|
|
|
|
|
|
|
|
|
|
|
|
|
|
|
|
|
|
|
|
101.PRE |
|
XBRL Taxonomy Extension Presentation Linkbase Document |
|
|
|
|
|
|
|
|
|
|
* |
Filed herewith |
|
# |
Confidential treatment has been requested with respect to certain portions of this exhibit. Omitted portions have been filed separately with the Securities and Exchange Commission. |
|
† |
Management contract or compensatory plan or arrangement. |
77