Attached files
| file | filename |
|---|---|
| EX-12.1 - EX-12.1 - DIAMOND OFFSHORE DRILLING, INC. | d121018dex121.htm |
| EX-21.1 - EX-21.1 - DIAMOND OFFSHORE DRILLING, INC. | d121018dex211.htm |
| EX-31.2 - EX-31.2 - DIAMOND OFFSHORE DRILLING, INC. | d121018dex312.htm |
| EX-23.1 - EX-23.1 - DIAMOND OFFSHORE DRILLING, INC. | d121018dex231.htm |
| EX-32.1 - EX-32.1 - DIAMOND OFFSHORE DRILLING, INC. | d121018dex321.htm |
| EX-31.1 - EX-31.1 - DIAMOND OFFSHORE DRILLING, INC. | d121018dex311.htm |
Table of Contents
SECURITIES AND EXCHANGE COMMISSION
Washington, D.C. 20549
FORM 10-K
| x | ANNUAL REPORT PURSUANT TO SECTION 13 OR 15(d) OF THE SECURITIES EXCHANGE ACT OF 1934 |
For the fiscal year ended December 31, 2015
OR
| ¨ | TRANSITION REPORT PURSUANT TO SECTION 13 OR 15(d) OF THE SECURITIES EXCHANGE ACT OF 1934 |
For the transition period from to
Commission file number 1-13926
DIAMOND OFFSHORE DRILLING, INC.
(Exact name of registrant as specified in its charter)
| Delaware | 76-0321760 | |
| (State or other jurisdiction of incorporation or organization) |
(I.R.S. Employer Identification No.) |
15415 Katy Freeway
Houston, Texas 77094
(Address and zip code of principal executive offices)
(281) 492-5300
(Registrant’s telephone number, including area code)
Securities registered pursuant to Section 12(b) of the Act:
| Title of each class |
Name of each exchange on which registered | |
| Common Stock, $0.01 par value per share | New York Stock Exchange |
Securities registered pursuant to Section 12(g) of the Act: None
Indicate by check mark if the registrant is a well-known seasoned issuer, as defined in Rule 405 of the Securities Act. Yes x No ¨
Indicate by check mark if the registrant is not required to file reports pursuant to Section 13 or Section 15(d) of the Act. Yes ¨ No x
Indicate by check mark whether the registrant (1) has filed all reports required to be filed by Section 13 or 15(d) of the Securities Exchange Act of 1934 during the preceding 12 months (or for such shorter period that the registrant was required to file such reports), and (2) has been subject to such filing requirements for the past 90 days. Yes x No ¨
Indicate by check mark whether the registrant has submitted electronically and posted on its corporate Web site, if any, every Interactive Data File required to be submitted and posted pursuant to Rule 405 of Regulation S-T during the preceding 12 months (or for such shorter period that the registrant was required to submit and post such files). Yes x No ¨
Indicate by check mark if disclosure of delinquent filers pursuant to Item 405 of Regulation S-K is not contained herein, and will not be contained, to the best of registrant’s knowledge, in definitive proxy or information statements incorporated by reference in Part III of this Form 10-K or any amendment to this Form 10-K. x
Indicate by check mark whether the registrant is a large accelerated filer, an accelerated filer, a non-accelerated filer, or a smaller reporting company. See definitions of “large accelerated filer,” “accelerated filer,” and “smaller reporting company” in Rule 12b-2 of the Exchange Act. (Check one):
| Large accelerated filer | x | Accelerated filer | ¨ | |||
| Non-accelerated filer | ¨ (Do not check if a smaller reporting company) | Smaller reporting company | ¨ | |||
Indicate by check mark whether the registrant is a shell company (as defined in Rule 12b-2 of the Exchange Act). Yes ¨ No x
State the aggregate market value of the voting and non-voting common equity held by non-affiliates computed by reference to the price at which the common equity was last sold as of the last business day of the registrant’s most recently completed second fiscal quarter.
| As of June 30, 2015 | $1,658,817,269 |
Indicate the number of shares outstanding of each of the registrant’s classes of common stock, as of the latest practicable date.
| As of February 16, 2016 | Common Stock, $0.01 par value per share | 137,158,706 shares |
DOCUMENTS INCORPORATED BY REFERENCE
Portions of the definitive proxy statement relating to the 2016 Annual Meeting of Stockholders of Diamond Offshore Drilling, Inc., which will be filed within 120 days of December 31, 2015, are incorporated by reference in Part III of this report.
Table of Contents
DIAMOND OFFSHORE DRILLING, INC.
FORM 10-K for the Year Ended December 31, 2015
| Page No. | ||||||
| Cover Page | 1 | |||||
| Document Table of Contents | 2 | |||||
| Part I | ||||||
| Item 1. | 3 | |||||
| Item 1A. | 9 | |||||
| Item 1B. | 24 | |||||
| Item 2. | 24 | |||||
| Item 3. | 24 | |||||
| Item 4. | 24 | |||||
| Part II | ||||||
| Item 5. | Market for the Registrant’s Common Equity, Related Stockholder Matters and Issuer Purchases of Equity Securities | 25 | ||||
| Item 6. | 27 | |||||
| Item 7. | Management’s Discussion and Analysis of Financial Condition and Results of Operations | 28 | ||||
| Item 7A. | 51 | |||||
| Item 8. | 53 | |||||
| 55 | ||||||
| 60 | ||||||
| Item 9. | Changes in and Disagreements with Accountants on Accounting and Financial Disclosure | 95 | ||||
| Item 9A. | 95 | |||||
| Item 9B. | 96 | |||||
| Part III | ||||||
| Certain information called for by Part III Items 10, 11, 12, 13 and 14 has been omitted as the Registrant intends to file with the Securities and Exchange Commission not later than 120 days after the end of its fiscal year a definitive Proxy Statement pursuant to Regulation 14A. | ||||||
| Part IV | ||||||
| Item 15. | 96 | |||||
| Signatures | 97 | |||||
| Exhibit Index | 99 | |||||
2
Table of Contents
PART I
| Item 1. | Business. |
General
Diamond Offshore Drilling, Inc. is a leader in offshore drilling, providing contract drilling services to the energy industry around the globe with a fleet of 32 offshore drilling rigs, which includes four jack-up rigs that we are marketing for sale. Our fleet consists of 23 semisubmersibles, including the Ocean GreatWhite, which is under construction, five jack-ups and four dynamically positioned drillships, including the Ocean BlackLion which was delivered in the second quarter of 2015. See “– Our Fleet – Fleet Enhancements and Additions” and “– Our Fleet – Floater Fleet Status.”
Unless the context otherwise requires, references in this report to “Diamond Offshore,” “we,” “us” or “our” mean Diamond Offshore Drilling, Inc. and our consolidated subsidiaries. Diamond Offshore Drilling, Inc. was incorporated in Delaware in 1989.
Our Fleet
Our diverse fleet enables us to offer a broad range of services worldwide, primarily in the floater market (ultra-deepwater, deepwater and mid-water).
Floaters. A floater rig is a type of mobile offshore drilling unit that floats and does not rest on the seafloor. This asset class includes self-propelled drillships and semisubmersible rigs. Semisubmersible rigs consist of an upper working and living deck resting on vertical columns connected to lower hull members. Such rigs operate in a “semi-submerged” position, remaining afloat, off bottom, in a position in which the lower hull is approximately 55 feet to 90 feet below the water line and the upper deck protrudes well above the surface. Semisubmersibles hold position while drilling by use of a series of small propulsion units or thrusters that provide dynamic positioning, or DP, to keep the rig on location, or with anchors tethered to the sea bed. Although DP semisubmersibles are self-propelled, such rigs may be moved long distances with the assistance of tug boats. Non-DP, or moored, semisubmersibles require tug boats or the use of a heavy lift vessel to move between locations.
A drillship is an adaptation of a maritime vessel that is designed and constructed to carry out drilling operations by means of a substructure with a moon pool centrally located in the hull. Drillships are typically self-propelled and are positioned over a drillsite through the use of a DP system similar to those used on semisubmersible rigs.
Our floater fleet (semisubmersibles and drillships) can be further categorized based on the nominal water depth for each class of rig as follows:
| Category |
Rated Water Depth (a) (in feet) |
Number of Units in Our Fleet |
||||
| Ultra-Deepwater |
7,501 to 12,000 | 12 | (b) | |||
| Deepwater |
5,000 to 7,500 | 7 | ||||
| Mid-Water |
400 to 4,999 | 8 | ||||
| (a) | Rated water depth for semisubmersibles and drillships reflects the maximum water depth in which a floating rig has been designed to operate. However, individual rigs are capable of drilling, or have drilled, in marginally greater water depths depending on various conditions (such as salinity of the ocean, weather and sea conditions). |
| (b) | Includes the Ocean GreatWhite, a harsh environment semisubmersible rig under construction. |
See “– Fleet Enhancements and Additions” for further discussion of our rig under construction.
3
Table of Contents
Floater Fleet Status
The following table presents additional information regarding our floater fleet at February 16, 2016:
| Rig Type and Name |
Rated Water Depth (in feet) |
Attributes | Year Built/ Redelivered (a) |
Current Location (b) | Customer (c) | |||||||
| ULTRA-DEEPWATER: |
||||||||||||
| Semisubmersibles (8): |
||||||||||||
| Ocean GreatWhite |
10,000 | DP; 6R; 15K | Q2 2016 | South Korea | Under construction/BP (d) | |||||||
| Ocean Valor |
10,000 | DP; 6R; 15K | 2009 | Brazil | Petrobras | |||||||
| Ocean Courage |
10,000 | DP; 6R; 15K | 2009 | Brazil | Petrobras | |||||||
| Ocean Confidence |
10,000 | DP; 6R; 15K | 2001/Q2 2015 | Canary Islands | Cold stacked | |||||||
| Ocean Monarch |
10,000 | 15K | 2008 | Australia | Quadrant Energy | |||||||
| Ocean Endeavor |
10,000 | 15K | 2007 | Romania | Demobilizing/Actively Marketing | |||||||
| Ocean Rover |
8,000 | 15K | 2003 | Malaysia | Murphy Exploration | |||||||
| Ocean Baroness |
8,000 | 15K | 2002 | GOM | Cold Stacked | |||||||
| Drillships (4): |
||||||||||||
| Ocean BlackLion |
12,000 | DP; 7R; 15K | Q2 2015 | GOM | Customer Acceptance/Hess Corporation | |||||||
| Ocean BlackRhino |
12,000 | DP; 7R; 15K | 2014 | GOM | Contract preparation/Hess Corporation | |||||||
| Ocean BlackHornet |
12,000 | DP; 7R; 15K | 2014 | GOM | Anadarko | |||||||
| Ocean BlackHawk |
12,000 | DP; 7R; 15K | 2014 | GOM | Anadarko | |||||||
| DEEPWATER: |
||||||||||||
| Semisubmersibles (7): |
||||||||||||
| Ocean Apex |
6,000 | 15K | 2014 | Malaysia | Warm Stacked/Woodside | |||||||
| Ocean Onyx |
6,000 | 15K | 2013 | GOM | Cold Stacked | |||||||
| Ocean Victory |
5,500 | 15K | 1997 | Trinidad & Tobago | BP Trinidad | |||||||
| Ocean America |
5,500 | 15K | 1988 | Malaysia | Cold Stacked | |||||||
| Ocean Valiant |
5,500 | 15K | 1988 | North Sea/U.K. | Premier Oil | |||||||
| Ocean Star |
5,500 | 15K | 1997 | GOM | Cold Stacked | |||||||
| Ocean Alliance |
5,250 | DP; 15K | 1988 | GOM | Cold Stacked | |||||||
| MID-WATER: |
||||||||||||
| Semisubmersibles (8): |
||||||||||||
| Ocean Quest |
4,000 | 15K | 1973 | Malaysia | Cold Stacked | |||||||
| Ocean Patriot |
3,000 | 15K | 1983 | North Sea/U.K. | Shell | |||||||
| Ocean General |
3,000 | 1976 | Malaysia | Cold Stacked | ||||||||
| Ocean Guardian |
1,500 | 15K | 1985 | North Sea/U.K. | Warm Stacked/Dana | |||||||
| Ocean Princess |
1,500 | 15K | 1975 | North Sea/U.K. | Cold Stacked | |||||||
| Ocean Vanguard |
1,500 | 15K | 1982 | North Sea/U.K. | Cold stacked | |||||||
| Ocean Nomad |
1,200 | 1975 | North Sea/U.K. | Cold Stacked | ||||||||
| Ocean Ambassador |
1,100 | 1975 | Mexico | PEMEX | ||||||||
| Attributes | ||
| DP = Dynamically Positioned/Self-Propelled | 7R = 2 Seven ram blow out preventers | |
| 6R = Six ram blow out preventer | 15K = 15,000 psi well control system | |
| (a) | Represents year rig was (or is expected to be) built and originally placed in service or year rig was (or is expected to be) redelivered with significant enhancements that enabled the rig to be classified within a different floater category than originally constructed. |
| (b) | GOM means U.S. Gulf of Mexico. |
| (c) | For ease of presentation in this table, customer names have been shortened or abbreviated. |
| (d) | Rig is contracted for future work upon completion of construction and commissioning. |
Jack-ups. Jack-up rigs are mobile, self-elevating drilling platforms equipped with legs that are lowered to the ocean floor. Our jack-ups are used for drilling in water depths from 20 feet to 350 feet. The water depth limit in which a particular rig is able to operate is principally determined by the length of the rig’s legs. The rig hull includes the drilling equipment, jacking system, crew quarters, loading and unloading facilities, storage areas for bulk and liquid materials, heliport and other related equipment. A jack-up rig is towed to the drillsite with its hull
4
Table of Contents
riding in the sea, as a vessel, with its legs retracted. Once over a drillsite, the legs are lowered until they rest on the seabed and jacking continues with the legs penetrating the seabed until they are firm and stable, and resistance is sufficient to elevate the hull above the surface of the water. After completion of drilling operations, the hull is lowered until it rests in the water and then the legs are retracted for relocation to another drillsite. All of our jack-up rigs are equipped with a cantilever system that enables the rig to cantilever or extend its drilling package over the aft end of the rig.
As of February 16, 2016, the Ocean Scepter, a 350-foot jack-up drilling rig built in 2008, was operating offshore Mexico for PEMEX – Exploración y Producción, or PEMEX, under a long-term contract. In addition, we have four other jack-up rigs, which we are currently marketing for sale.
Fleet Enhancements and Additions. Our long-term strategy is to upgrade our fleet to meet customer demand for advanced, efficient and high-tech rigs by acquiring or building new rigs when possible to do so at attractive prices, and otherwise by enhancing the capabilities of our existing rigs at a lower cost and shortened construction period than newbuild construction would require. Since 2009, commencing with the acquisition of two newbuild, ultra-deepwater semisubmersible rigs, the Ocean Courage and Ocean Valor, we have committed over $5.0 billion towards upgrading our fleet. In mid-2015, we took delivery of the Ocean BlackLion, the last of four ultra-deepwater drillships constructed in South Korea during our most recent fleet enhancement cycle. The Ocean GreatWhite remains under construction in South Korea with delivery of the new rig expected to occur in mid- 2016. Upon completion of acceptance testing, the rig is expected to commence drilling operations offshore Australia later this year.
We will evaluate further rig acquisition and enhancement opportunities as they arise. However, we can provide no assurance whether, or to what extent, we will continue to make rig acquisitions or enhancements to our fleet. See “Management’s Discussion and Analysis of Financial Condition and Results of Operations – Cash Flow and Capital Expenditures” in Item 7 of this report.
Pressure Control by the Hour. In February 2016, we entered into a ten-year agreement with GE Oil & Gas, or GE, to provide services with respect to certain blowout preventer and related well control equipment on our four newbuild drillships. Such services include management of maintenance, certification and reliability with respect to such equipment. In connection with the services agreement with GE, we will sell the equipment to a GE affiliate and will lease back such equipment over separate ten-year operating leases.
Markets
The principal markets for our offshore contract drilling services are the following:
| • | South America, principally offshore Brazil, and Trinidad and Tobago; |
| • | Australia and Southeast Asia, including Malaysia, Indonesia and Vietnam; |
| • | the Middle East; |
| • | Europe, principally in the United Kingdom, or U.K., and Norway; |
| • | East and West Africa; |
| • | the Mediterranean; and |
| • | the Gulf of Mexico, including the U.S. and Mexico. |
We actively market our rigs worldwide. From time to time our fleet operates in various other markets throughout the world. See Note 17 “Segments and Geographic Area Analysis” to our Consolidated Financial Statements in Item 8 of this report.
5
Table of Contents
Offshore Contract Drilling Services
Our contracts to provide offshore drilling services vary in their terms and provisions. We typically obtain our contracts through a competitive bid process, although it is not unusual for us to be awarded drilling contracts following direct negotiations. Our drilling contracts generally provide for a basic fixed dayrate regardless of whether or not such drilling results in a productive well. Drilling contracts may also provide for reductions in rates during periods when the rig is being moved or when drilling operations are interrupted or restricted by equipment breakdowns, adverse weather conditions or other circumstances. Under dayrate contracts, we generally pay the operating expenses of the rig, including wages and the cost of incidental supplies. Historically, dayrate contracts have accounted for the majority of our revenues. In addition, from time to time, our dayrate contracts may also provide for the ability to earn an incentive bonus from our customer based upon performance.
The duration of a dayrate drilling contract is generally tied to the time required to drill a single well or a group of wells, in what we refer to as a well-to-well contract, or a fixed period of time, in what we refer to as a term contract. Many drilling contracts may be terminated by the customer in the event the drilling unit is destroyed or lost, or if drilling operations are suspended for an extended period of time as a result of a breakdown of equipment or, in some cases, due to events beyond the control of either party to the contract. Certain of our contracts also permit the customer to terminate the contract early by giving notice; in most circumstances this requires the payment of an early termination fee by the customer. The contract term in many instances may also be extended by the customer exercising options for the drilling of additional wells or for an additional length of time, generally at competitive market rates and mutually agreeable terms at the time of the extension. In periods of decreasing demand for offshore rigs, drilling contractors may prefer longer term contracts to preserve dayrates at existing levels and ensure utilization, while customers may prefer shorter contracts that allow them to more quickly obtain the benefit of declining dayrates. Moreover, drilling contractors may accept lower dayrates in a declining market in order to obtain longer-term contracts and add backlog. See “Risk Factors – We may not be able to renew or replace expiring contracts for our rigs,” “Risk Factors – Our business involves numerous operating hazards that could expose us to significant losses and significant damage claims. We are not fully insured against all of these risks and our contractual indemnity provisions may not fully protect us,” “Risk Factors – We can provide no assurance that our drilling contracts will not be terminated early or that our current backlog of contract drilling revenue will be ultimately realized,” “Risk Factors – We may enter into drilling contracts that expose us to greater risks than we normally assume” and “Risk Factors – We self-insure for physical damage to rigs and equipment caused by named windstorms in the U.S. Gulf of Mexico” in Item 1A of this report, which are incorporated herein by reference. For a discussion of our contract backlog, see “Management’s Discussion and Analysis of Financial Condition and Results of Operations – Market Overview –Contract Drilling Backlog” in Item 7 of this report, which is incorporated herein by reference.
Customers
We provide offshore drilling services to a customer base that includes major and independent oil and gas companies and government-owned oil companies. During 2015, 2014 and 2013, we performed services for 19, 35 and 39 different customers, respectively. During 2015, 2014 and 2013, one of our customers in Brazil, Petróleo Brasileiro S.A., or Petrobras (a Brazilian multinational energy company that is majority-owned by the Brazilian government), accounted for 24%, 32% and 34% of our annual total consolidated revenues, respectively. During 2015, ExxonMobil and Anadarko each accounted for 12% of our annual consolidated revenues. No other customer accounted for 10% or more of our annual total consolidated revenues during 2015, 2014 or 2013. See “Risk Factors – Our industry is highly competitive, with oversupply and intense price competition” in Item 1A of this report, which is incorporated herein by reference.
As of February 8, 2016, our contract backlog was $5.2 billion attributable to 11 customers. All four of our drillships are currently contracted to work in the GOM. As of February 8, 2016, contract backlog attributable to our expected operations in the GOM was $510.0 million, $653.0 million and $653.0 million for the years 2016, 2017 and 2018, respectively, and $626.0 million in the aggregate for the years 2019 to 2020 attributable to three
6
Table of Contents
customers. See “Management’s Discussion and Analysis of Financial Condition and Results of Operations – Market Overview – Contract Drilling Backlog” in Item 7 of this report. See “Risk Factors – We can provide no assurance that our drilling contracts will not be terminated early or that our current backlog of contract drilling revenue will be ultimately realized” in Item 1A of this report, which is incorporated herein by reference.
Competition
Despite consolidation in previous years, the offshore contract drilling industry remains highly competitive with numerous industry participants, none of which at the present time has a dominant market share. The industry may also experience additional consolidation in the future, which could create other large competitors. Some of our competitors may have greater financial or other resources than we do. Based on industry data, as of the date of this report, there are approximately 840 mobile drilling rigs in service worldwide, including approximately 300 floater rigs.
The offshore contract drilling industry is influenced by a number of factors, including global economies and demand for oil and natural gas, current and anticipated prices of oil and natural gas, expenditures by oil and gas companies for exploration and development of oil and natural gas and the availability of drilling rigs.
Drilling contracts are traditionally awarded on a competitive bid basis. Price is typically the primary factor in determining which qualified contractor is awarded a job. Customers may also consider rig availability and location, a drilling contractor’s operational and safety performance record, and condition and suitability of equipment. We believe we compete favorably with respect to these factors.
We compete on a worldwide basis, but competition may vary significantly by region at any particular time. See “– Markets.” Competition for offshore rigs generally takes place on a global basis, as these rigs are highly mobile and may be moved, at a cost that may be substantial, from one region to another. It is characteristic of the offshore contract drilling industry to move rigs from areas of low utilization and dayrates to areas of greater activity and relatively higher dayrates. Significant new rig construction and upgrades of existing drilling units could also intensify price competition. See “Risk Factors – Our industry is highly competitive, with oversupply and intense price competition” in Item 1A of this report, which is incorporated herein by reference.
Governmental Regulation
Our operations are subject to numerous international, foreign, U.S., state and local laws and regulations that relate directly or indirectly to our operations, including regulations controlling the discharge of materials into the environment, requiring removal and clean-up under some circumstances, or otherwise relating to the protection of the environment, and may include laws or regulations pertaining to climate change, carbon emissions or energy use. See “Risk Factors – Governmental laws and regulations, both domestic and international, may add to our costs or limit our drilling activity” and “Risk Factors – Compliance with or breach of environmental laws can be costly and could limit our operations” in Item 1A of this report, which are incorporated herein by reference.
Operations Outside the United States
Our operations outside the U.S. accounted for approximately 79%, 85% and 89% of our total consolidated revenues for the years ended December 31, 2015, 2014 and 2013, respectively. See “Risk Factors – Significant portions of our operations are conducted outside the United States and involve additional risks not associated with United States domestic operations,” “Risk Factors – We may enter into drilling contracts that expose us to greater risks than we normally assume,” “Risk Factors – We may be required to accrue additional tax liability on certain of our foreign earnings” and “Risk Factors – Fluctuations in exchange rates and nonconvertibility of currencies could result in losses to us” in Item 1A of this report, which are incorporated herein by reference.
7
Table of Contents
Employees
As of December 31, 2015, we had approximately 3,400 workers, including international crew personnel furnished through independent labor contractors.
Executive Officers of the Registrant
We have included information on our executive officers in Part I of this report in reliance on General Instruction G(3) to Form 10-K. Our executive officers are elected annually by our Board of Directors to serve until the next annual meeting of our Board of Directors, or until their successors are duly elected and qualified, or until their earlier death, resignation, disqualification or removal from office. Information with respect to our executive officers is set forth below.
| Name |
Age as of January 31, 2016 |
Position | ||
| Marc Edwards |
55 | President and Chief Executive Officer and Director | ||
| Lyndol L. Dew |
61 | Senior Vice President – Worldwide Operations | ||
| Gary T. Krenek |
57 | Senior Vice President and Chief Financial Officer | ||
| David L. Roland |
54 | Senior Vice President, General Counsel and Secretary | ||
| Ronald Woll |
48 | Senior Vice President and Chief Commercial Officer | ||
| Beth G. Gordon |
60 | Controller and Chief Accounting Officer |
Marc Edwards has served as our President and Chief Executive Officer and as a Director since March 2014. Mr. Edwards previously served as a member of the Executive Committee and as Senior Vice President of the Completion and Production Division at Halliburton Company, a global diversified oilfield services company, from January 2010 to February 2014. Mr. Edwards also served as Vice President for Production Enhancement of Halliburton Company from January 2008 through December 2009.
Lyndol L. Dew has served as our Senior Vice President – Worldwide Operations since September 2006. Previously, Mr. Dew served as our Vice President – International Operations from January 2006 to August 2006 and as our Vice President – North American Operations from January 2003 to December 2005.
Gary T. Krenek has served as our Senior Vice President and our Chief Financial Officer since October 2006. From March 1998 to 2006, Mr. Krenek served as our Vice President and Chief Financial Officer.
David L. Roland has served as our Senior Vice President, General Counsel and Secretary since September 2014. From April 2004 until joining us in 2014, Mr. Roland served as Senior Vice President, General Counsel and Corporate Secretary of ION Geophysical Corporation, a NYSE-listed geophysical company.
Ronald Woll has served as our Senior Vice President and Chief Commercial Officer since June 2014. Mr. Woll previously served as Senior Vice President Supply Chain at Halliburton Company, a global diversified oilfield services company, from January 2011 through June 2014. From January 2010 through December 2011, Mr. Woll served as Vice President, Procurement at Halliburton Company.
Beth G. Gordon has served as our Controller and Chief Accounting Officer since April 2000.
Access to Company Filings
We are subject to the informational requirements of the Securities Exchange Act of 1934, as amended, or the Exchange Act, and accordingly file annual, quarterly and current reports, any amendments to those reports, proxy statements and other information with the United States Securities and Exchange Commission, or SEC. You may read and copy the information we file with the SEC at the public reference facilities maintained by the SEC at 100 F Street, N.E., Washington, DC 20549. Please call the SEC at 1-800-SEC-0330 for further
8
Table of Contents
information on the operation of the public reference room. Our SEC filings are also available to the public from the SEC’s Internet site at www.sec.gov or from our Internet site at www.diamondoffshore.com. Our website provides a hyperlink to a third-party SEC filings website where these reports may be viewed and printed at no cost as soon as reasonably practicable after we have electronically filed such material with, or furnished it to, the SEC. The preceding Internet addresses and all other Internet addresses referenced in this report are for information purposes only and are not intended to be a hyperlink. Accordingly, no information found or provided at such Internet addresses or at our website in general (or at other websites linked to our website) is intended or deemed to be incorporated by reference in this report.
| Item 1A. | Risk Factors. |
Our business is subject to a variety of risks, including the risks described below. You should carefully consider these risks when evaluating us and our securities. The risks and uncertainties described below are not the only ones facing our company. We are also subject to a variety of risks that affect many other companies generally, as well as additional risks and uncertainties not known to us or that, as of the date of this report, we believe are not as significant as the risks described below. If any of the following risks actually occur, our business, financial condition, results of operations and cash flows, and the trading prices of our securities, may be materially and adversely affected.
The worldwide demand for drilling services has declined significantly as a result of the decline in oil prices, which commenced during the second half of 2014 and has continued into 2016.
Demand for our drilling services depends in large part upon oil and natural gas industry offshore exploration and production activity and expenditure levels, which are directly affected by oil and gas prices and market expectations of potential changes in oil and gas prices. Commencing in the second half of 2014, oil prices have declined precipitously and recently fell to a 12-year low of less than $30 per barrel. The dramatic reduction in commodity prices has caused a sharp decline in the demand for offshore drilling services, including services that we provide and adversely affected our results of operations and cash flows in 2015. A prolonged period of low oil prices would have a material adverse effect on many of our customers and, therefore, on our financial condition, results of operations and cash flows.
Oil prices have been, and are expected to continue to be, volatile and are affected by numerous factors beyond our control, including:
| • | worldwide supply and demand for oil and gas; |
| • | the level of economic activity in energy-consuming markets; |
| • | the worldwide economic environment or economic trends, such as recessions; |
| • | the ability of the Organization of Petroleum Exporting Countries (OPEC) to set and maintain production levels and pricing; |
| • | the level of production in non-OPEC countries; |
| • | civil unrest and the worldwide political and military environment, including uncertainty or instability resulting from an escalation or additional outbreak of armed hostilities involving the Middle East, Russia, other oil-producing regions or other geographic areas or further acts of terrorism in the United States or elsewhere; |
| • | the cost of exploring for, developing, producing and delivering oil and gas; |
| • | the discovery rate of new oil and gas reserves; |
| • | the rate of decline of existing and new oil and gas reserves and production; |
| • | available pipeline and other oil and gas transportation and refining capacity; |
9
Table of Contents
| • | the ability of oil and gas companies to raise capital; |
| • | weather conditions, including hurricanes, which can affect oil and gas operations over a wide area; |
| • | natural disasters or incidents resulting from operating hazards inherent in offshore drilling, such as oil spills; |
| • | the policies of various governments regarding exploration and development of their oil and gas reserves; |
| • | technological advances affecting energy consumption, including development and exploitation of alternative fuels or energy sources; |
| • | laws and regulations relating to environmental or energy security matters, including those purporting to address global climate change; |
| • | domestic and foreign tax policy; and |
| • | advances in exploration and development technology. |
An increase in commodity demand and prices will not necessarily result in an immediate increase in offshore drilling activity since our customers’ project development times, reserve replacement needs and expectations of future commodity demand, prices and supply of available competing rigs all combine to affect demand for our rigs.
Our business depends on the level of activity in the offshore oil and gas industry, which has been cyclical and is significantly affected by many factors outside of our control.
Demand for our drilling services depends upon the level of offshore oil and gas exploration, development and production in markets worldwide, and those activities depend in large part on oil and gas prices, worldwide demand for oil and gas and a variety of political and economic factors. The level of offshore drilling activity is also adversely affected when operators reduce or defer new investment in offshore projects, reduce or suspend their drilling budgets or reallocate their drilling budgets away from offshore drilling in favor of other priorities, such as shale or other land-based projects, which could reduce demand for our rigs and newbuilds. As a result, our business and the oil and gas industry in general are subject to cyclical fluctuations.
As a result of the cyclical fluctuations in the market, there have been periods of lower demand, excess rig supply and lower dayrates, followed by periods of higher demand, shorter rig supply and higher dayrates. We cannot predict the timing or duration of such fluctuations. Periods of lower demand or excess rig supply intensify the competition in the industry and often result in periods of lower utilization and lower dayrates. During these periods, our rigs may not obtain contracts for future work and may be idle for long periods of time or may be able to obtain work only under contracts with lower dayrates or less favorable terms, which could have a material adverse effect on our financial condition, results of operations and cash flows during these periods. Additionally, prolonged periods of low utilization and dayrates could also result in the recognition of impairment charges on certain of our drilling rigs if future cash flow estimates, based upon information available to management at the time, indicate that the carrying value of these rigs may not be recoverable. See “– We may incur additional asset impairments and/or rig retirements as a result of reduced demand for certain offshore drilling rigs.”
Our industry is highly competitive, with oversupply and intense price competition.
The offshore contract drilling industry is highly competitive with numerous industry participants. Some of our competitors may be larger companies, have larger or more technologically advanced fleets and have greater financial or other resources than we do. The drilling industry has experienced consolidation in the past and may experience additional consolidation, which could create additional large competitors. Drilling contracts are traditionally awarded on a competitive bid basis. Price is typically the primary factor in determining which
10
Table of Contents
qualified contractor is awarded a job; however, rig availability and location, a drilling contractor’s safety record and the quality and technical capability of service and equipment may also be considered.
Recent new rig construction and upgrades of existing drilling rigs, cancelation or termination of contracts, as well as established rigs coming off contract during 2015, have contributed to the current oversupply of drilling rigs, intensifying price competition. Additional newbuild rigs entering the market are expected to further negatively impact rig utilization and intensify price competition as rigs are delivered. See “Management’s Discussion and Analysis of Financial Condition and Results of Operations – Market Overview – Floater Markets” in Item 7 of this report.
We provide offshore drilling services to a customer base that includes major and independent oil and gas companies and government-owned oil companies. During 2015, one of our customers in Brazil, Petrobras, and our five largest customers in the aggregate accounted for 24% and 65%, respectively, of our annual total consolidated revenues. The loss of a significant customer could have a material adverse impact on our financial condition, results of operations and cash flows, especially in a declining market where the number of our working drilling rigs is declining along with the number of our active customers. In addition, if a significant customer experiences liquidity constraints or other financial difficulties, it could materially adversely affect our utilization rates in the affected market and also displace demand for our other drilling rigs and newbuilds as the resulting excess supply enters the market. While it is normal for our customer base to change over time as work programs are completed, the loss of, or a significant reduction in the number of rigs contracted with, any major customer may have a material adverse effect on our financial condition, results of operations and cash flows. See “Management’s Discussion and Analysis of Financial Condition and Results of Operations – Market Overview –Contract Drilling Backlog” in Item 7 of this report.
We can provide no assurance that our drilling contracts will not be terminated early or that our current backlog of contract drilling revenue will be ultimately realized.
Generally, our customers may terminate our drilling contracts under certain circumstances, such as if the drilling rig is destroyed or lost, if we suspend drilling operations for a specified period of time as a result of a breakdown of major equipment, excessive downtime for repairs, failure to meet minimum performance criteria (including customer acceptance testing) or, in some cases, due to other events beyond the control of either party. Our drilling contract for the Ocean BlackLion, for example, requires us to successfully complete certain testing procedures for the rig’s equipment, including the blowout preventers and well control systems. We are currently undergoing the required testing. If these tests are not successfully completed, our customer may have the right to terminate the drilling contract or may request a renegotiation of the terms of the contract.
In addition, some of our drilling contracts permit the customer to terminate the contract after specified notice periods, often by tendering contractually specified termination amounts, which may not fully compensate us for the loss of the contract. During depressed market conditions, certain customers have utilized such contract clauses to seek to renegotiate or terminate a drilling contract or claim that we have breached provisions of our drilling contracts in order to avoid their obligations to us under circumstances where we believe we are in compliance with the contracts. Additionally, because of depressed commodity prices, restricted credit markets, economic downturns, changes in priorities or strategy or other factors beyond our control, a customer may no longer want or need a rig that is currently under contract or may be able to obtain a comparable rig at a lower dayrate. For these reasons, customers may seek to renegotiate the terms of our existing drilling contracts, terminate our contracts without justification or repudiate or otherwise fail to perform their obligations under our contracts. Such renegotiations could include requests to lower the contract dayrate, lowering of a dayrate in exchange for additional contract term, shortening the term on one contracted rig in exchange for additional term on another rig, early termination of a contract in exchange for a lump sum margin payout and many other possibilities. Our contract backlog may be adversely impacted as a result of such contract renegotiations.
When a customer terminates our contract prior to the contract’s scheduled expiration, our contract backlog is adversely impacted, and we might not recover any compensation for the termination or any recovery we might
11
Table of Contents
obtain may not fully compensate us for the loss of the contract. In any case, the early termination of a contract may result in our rig being idle for an extended period of time. Each of these results could have a material adverse effect on our financial condition, results of operations and cash flows. In addition, if our customer cancels our contract or if we elect to terminate a contract due to the customer’s nonperformance and in either case we are unable to secure a new contract on a timely basis and on substantially similar terms, or if a contract is disputed or suspended for an extended period of time or if a contract is renegotiated, it could materially and adversely affect our financial condition, results of operations and cash flows.
Currently, our contract backlog only includes future revenues under firm commitments; however, from time to time, we may report anticipated commitments for which definitive agreements have not yet been, but are expected to be, executed. We can provide no assurance that in such cases we will be able to ultimately execute a definitive agreement. In addition, for the reasons described above, we can provide no assurance that our customers will be willing or able to fulfill their contractual commitments to us.
Our inability to perform under our contractual obligations or to execute definitive agreements, or our customers’ inability or unwillingness to fulfill their contractual commitments to us, may have a material adverse effect on our financial condition, results of operations and cash flows. See “– Our industry is highly competitive, with oversupply and intense price competition” and “Management’s Discussion and Analysis of Financial Condition and Results of Operations – Market Overview – Contract Drilling Backlog” in Item 7 of this report.
We may not be able to renew or replace expiring contracts for our rigs.
We have a number of customer contracts that will expire in 2016 and 2017. Our ability to renew or replace expiring contracts or obtain new contracts, and the terms of any such contracts, will depend on various factors, including market conditions and the specific needs of our customers. Given the highly competitive and historically cyclical nature of our industry, we may not be able to renew or replace the contracts or we may be required to renew or replace expiring contracts or obtain new contracts at dayrates that are below, and potentially substantially below, existing dayrates, or that have terms that are less favorable to us than our existing contracts or we may be unable to secure contracts for these rigs. This could have a material adverse effect on our financial condition, results of operations and cash flows.
We may incur additional asset impairments and/or rig retirements as a result of reduced demand for certain offshore drilling rigs.
The current oversupply of drilling rigs in the offshore drilling market has resulted in numerous rigs being idled and in some cases retired and/or scrapped. We evaluate our property and equipment for impairment whenever changes in circumstances indicate that the carrying amount of an asset may not be recoverable, and we could incur impairment charges related to the carrying value of our drilling rigs. Impairment write-offs could result if, for example, any of our rigs become obsolete or commercially less desirable or their carrying values become excessive due to the condition of the rig, cold stacking the rig, the expectation of cold stacking the rig in the near future, a decision to retire or scrap the rig, changes in technology, market demand or market expectations, or excess spending over budget on a new-build construction project or major rig upgrade. We utilize an undiscounted probability-weighted cash flow analysis in testing an asset for potential impairment, reflecting management’s assumptions and estimates regarding the appropriate risk-adjusted dayrate by rig, future industry conditions and operations and other factors. Asset impairment evaluations are, by their nature, highly subjective. The use of different estimates and assumptions could result in materially different carrying values of our assets, which could impact the need to record an impairment charge and the amount of any charge taken. Since 2012, we have retired and sold 12 drilling rigs and recorded impairment losses aggregating $1.0 billion, including $860.4 million recognized in 2015. See “Management’s Discussion and Analysis of Financial Condition and Results of Operations – Market Overview – Critical Accounting Estimates – Property, Plant and Equipment” in Item 7 of this report and Note 2 “Asset Impairments” to our Consolidated Financial Statements in Item 8 of this report.
12
Table of Contents
We can provide no assurance that our assumptions and estimates used in our asset impairment evaluations will ultimately be realized or that the current carrying value of our property and equipment, including rigs designated as held for sale, will ultimately be realized.
Our contract drilling expense includes fixed costs that will not decline in proportion to decreases in rig utilization and dayrates.
Our contract drilling expense includes all direct and indirect costs associated with the operation, maintenance and support of our drilling equipment, which is often not affected by changes in dayrates and utilization. During periods of reduced revenue and/or activity, certain of our fixed costs will not decline and often we may incur additional operating costs, such as fuel and catering costs, for which we are generally reimbursed by the customer when a rig is under contract. During times of reduced utilization, reductions in costs may not be immediate as we may incur additional costs associated with cold stacking a rig (particularly if we cold stack a newer rig, such as a drillship, for which cold-stacking costs are typically substantially higher than for a jack-up rig or an older floater rig), or we may not be able to fully reduce the cost of our support operations in a particular geographic region due to the need to support the remaining drilling rigs in that region. A decline in revenue due to lower dayrates and/or utilization may not be offset by a corresponding decrease in contract drilling expense and could have a material adverse effect on our financial condition, results of operations and cash flows.
Although we have paid cash dividends in the past, we may not pay regular or special cash dividends in the future and we can give no assurance as to the amount or timing of the payment of any future regular or special cash dividends.
We pay dividends at the discretion of our Board of Directors, or Board. In recent years, we have paid both regular quarterly and special cash dividends, although we did not pay special cash dividends in 2015. In February 2016, we announced that we had discontinued our regular quarterly cash dividend. Our Board has adopted a policy of considering regular and special cash dividends, in amounts to be determined, on a quarterly basis. Any determination to declare a dividend, as well as the amount of any dividend that may be declared, will be based on the Board’s consideration of our financial position, earnings, earnings outlook, capital spending plans, outlook on current and future market conditions and business needs and other factors that our Board considers relevant at that time. The Board’s dividend policy may change from time to time, but there can be no assurance that we will declare any cash dividends at all or in any particular amounts. See “Market for the Registrant’s Common Equity, Related Stockholder Matters and Issuer Purchases of Equity Securities – Dividend Policy” in Item 5 of this report and “Management’s Discussion and Analysis of Financial Condition and Results of Operations – Liquidity and Capital Resources” in Item 7 of this report.
We may enter into drilling contracts that expose us to greater risks than we normally assume.
From time to time, we may enter into drilling contracts with national oil companies, government-controlled entities or others that expose us to greater risks than we normally assume, such as exposure to greater environmental or other liability and more onerous termination provisions giving the customer a right to terminate without cause or upon little or no notice. Upon termination, these contracts may not result in a payment to us, or if a termination payment is required, it may not fully compensate us for the loss of a contract. In addition, the early termination of a contract may result in a rig being idle for an extended period of time, which could adversely affect our financial condition, results of operations and cash flows. While we believe that the financial terms of these contracts and our operating safeguards in place may partially mitigate these risks, we can provide no assurance that the increased risk exposure will not have a material negative impact on our future operations or financial results.
Changes in tax laws, effective income tax rates or adverse outcomes resulting from examination of our tax returns could adversely affect our financial results.
Tax laws and regulations are highly complex and subject to interpretation and disputes. We conduct our worldwide operations through various subsidiaries in a number of countries throughout the world. As a result, we
13
Table of Contents
are subject to highly complex tax laws, regulations and income tax treaties within and between the countries in which we operate as well as countries in which we may be resident, which may change and are subject to interpretation. We determine our income tax expense based on our interpretation of the applicable tax laws and regulations in effect in each jurisdiction for the period during which we operate and earn income. Our overall effective tax rate could be adversely and suddenly affected by lower than anticipated earnings in countries where we have lower statutory rates and higher than anticipated earnings in countries where we have higher statutory rates, by changes in the valuation of our deferred tax assets and liabilities or by changes in tax law, tax treaties, regulations, accounting principles or interpretations thereof in one or more countries in which we operate. In addition, changes in laws, treaties and regulations and the interpretation of such laws, treaties and regulations may put us at risk for future tax assessments and liabilities which could be substantial and could have a material adverse effect on our financial condition, results of operations and cash flows.
Our income tax returns are subject to review and examination. We do not recognize the benefit of income tax positions we believe are more likely than not to be disallowed upon challenge by a tax authority. If any tax authority successfully challenges any tax position taken or intercompany pricing policies, or if the terms of certain income tax treaties are interpreted in a manner that is adverse to us or our operations, or if we lose a material tax dispute in any country, our effective tax rate on our worldwide earnings could increase substantially and our earnings and cash flows from operations could be materially adversely affected.
Governmental laws and regulations, both domestic and international, may add to our costs or limit our drilling activity.
Our operations are affected from time to time in varying degrees by governmental laws and regulations. In addition to the specific regulatory risks discussed elsewhere in this Item 1A. “Risk Factors” section, our operations are subject to other laws, regulations and government policies worldwide. Certain countries are subject to restrictions, sanctions and embargoes imposed by the United States government or other governmental or international authorities. These restrictions, sanctions and embargoes may prohibit or limit us from participating in certain business activities in those countries. Our operations are also subject to numerous local, state and federal laws and regulations in the United States and in foreign jurisdictions concerning the containment and disposal of hazardous materials, the remediation of contaminated properties and the protection of the environment. The offshore drilling industry is dependent on demand for services from the oil and gas exploration industry and, accordingly, can be affected by changes in tax and other laws relating to the energy business generally. We may be required to make significant expenditures for additional capital equipment or inspections and recertifications thereof to comply with existing or new governmental laws and regulations. It is also possible that these laws and regulations may in the future add significantly to our operating costs or result in a reduction in revenues associated with downtime required to install such equipment or may otherwise significantly limit drilling activity.
In addition, our operating income is negatively impacted when we perform certain regulatory inspections, which we refer to as a 5-year survey, or special survey, that are due every five years for each of our rigs. These special surveys are generally performed in a shipyard and require scheduled downtime, which can negatively impact operating revenue. Operating expenses increase as a result of these special surveys due to the cost to mobilize the rigs to a shipyard, inspection costs incurred and repair and maintenance costs. Repair and maintenance activities may result from the special survey or may have been previously planned to take place during this mandatory downtime. The number of rigs undergoing a 5-year survey will vary from year to year, as well as from quarter to quarter. Operating income may also be negatively impacted by intermediate surveys, which are performed at interim periods between 5-year surveys. Intermediate surveys are generally less extensive in duration and scope than a 5-year survey. Although an intermediate survey normally does not require shipyard time, the survey may require some downtime for the rig. We can provide no assurance as to the exact timing and/or duration of downtime associated with regulatory inspections, planned rig mobilizations and other shipyard projects.
14
Table of Contents
In the aftermath of the 2010 Macondo well blowout and subsequent investigation into the causes of the event, new rules were implemented for oil and gas operations in the GOM and in many of the international locations in which we operate, including new standards for well design, casing and cementing and well control procedures, equipment inspection and certifications, as well as rules requiring operators to systematically identify risks and establish safeguards against those risks through a comprehensive safety and environmental management system, or SEMS. New regulations may continue to be announced, including rules regarding drilling systems and equipment, such as blowout preventer and well control systems and lifesaving systems, as well as rules regarding employee training, engaging personnel in safety management and requiring third party audits of SEMS programs. Such new regulations could require modifications or enhancements to existing systems and equipment, or require new equipment, and could increase our operating costs and cause downtime for our rigs if we are required to take any of them out of service between scheduled surveys or inspections, or if we are required to extend scheduled surveys or inspections, to meet any such new requirements. We are not able to predict the likelihood, nature or extent of additional rulemaking, and we are not able to predict the future impact of these events on our operations. Additional governmental regulations concerning licensing, taxation, equipment specifications, training requirements or other matters could increase the costs of our operations, and enhanced permitting requirements, as well as escalating costs borne by our customers, could reduce exploration activity in the GOM and therefore demand for our services.
Governments in some countries are increasingly active in regulating and controlling the ownership of concessions, the exploration for oil and gas and other aspects of the oil and gas industry. The modification of existing laws or regulations or the adoption of new laws or regulations curtailing exploratory or developmental drilling for oil and gas for economic, environmental or other reasons could materially and adversely affect our operations by limiting drilling opportunities.
Governments around the world are also increasingly considering and adopting laws and regulations to address climate change issues. Lawmakers and regulators in the United States and other jurisdictions where we operate have focused increasingly on restricting the emission of carbon dioxide, methane and other “greenhouse” gases. This may result in new environmental regulations that may unfavorably impact us, our suppliers and our customers. We may be exposed to risks related to new laws, regulations, treaties or international agreements pertaining to climate change, greenhouse gases, carbon emissions or energy use that could decrease the use of oil or natural gas, thus reducing demand for hydrocarbon-based fuel and our drilling services. Governments may also pass laws or regulations incentivizing or mandating the use of alternative energy sources, such as wind power and solar energy, which may reduce demand for oil and natural gas and our drilling services. Such laws, regulations, treaties or international agreements could result in increased compliance costs or additional operating restrictions, which may have a negative impact on our business, and could adversely affect our operations by limiting drilling opportunities.
Contracts for our drilling rigs are generally fixed dayrate contracts, and increases in our operating costs could adversely affect our profitability on those contracts.
Our contracts for our drilling rigs generally provide for the payment of a fixed dayrate per rig operating day, although some contracts do provide for a limited escalation in dayrate due to increased operating costs we incur on the project. Many of our operating costs, such as labor costs, are unpredictable and fluctuate based on events beyond our control. In addition, equipment repair and maintenance expenses fluctuate depending on the type of activity the rig is performing, the age and condition of the equipment and general market factors impacting relevant parts, components and services. The gross margin that we realize on these fixed dayrate contracts will fluctuate based on variations in our operating costs over the terms of the contracts. In addition, for contracts with dayrate escalation clauses, we may not be able to fully recover increased or unforeseen costs from our customers. Our inability to recover these increased or unforeseen costs from our customers could materially and adversely affect our financial condition, results of operations and cash flows.
15
Table of Contents
Rig conversions, upgrades or new-builds may be subject to delays and cost overruns.
From time to time, we add new capacity through conversions or upgrades to our existing rigs or through new construction, such as our harsh environment, ultra-deepwater semisubmersible rig, Ocean GreatWhite, which is currently under construction. Projects of this type are subject to risks of delay or cost overruns inherent in any large construction project resulting from numerous factors, including the following:
| • | shortages of equipment, materials or skilled labor; |
| • | work stoppages; |
| • | unscheduled delays in the delivery of ordered materials and equipment; |
| • | unanticipated cost increases or change orders; |
| • | weather interferences or storm damage; |
| • | difficulties in obtaining necessary permits or in meeting permit conditions; |
| • | design and engineering problems; |
| • | disputes with shipyards or suppliers; |
| • | availability of suppliers to recertify equipment for enhanced regulations; |
| • | customer acceptance delays; |
| • | shipyard failures or unavailability; and |
| • | failure or delay of third party service providers, civil unrest and labor disputes. |
Failure to complete a rig upgrade or new construction on time, or failure to complete a rig conversion or new construction in accordance with its design specifications may, in some circumstances, result in the delay, renegotiation or cancellation of a drilling contract, resulting in a loss of contract drilling backlog and revenue to us. If a drilling contract is terminated under these circumstances, we may not be able to secure a replacement contract or, if we do secure a replacement contract, it may not contain equally favorable terms. In addition, impairment write-offs could result if a rig’s carrying value becomes excessive due to spending over budget on a newbuild construction project or major rig upgrade.
Our business involves numerous operating hazards that could expose us to significant losses and significant damage claims. We are not fully insured against all of these risks and our contractual indemnity provisions may not fully protect us.
Our operations are subject to the significant hazards inherent in drilling for oil and gas offshore, such as blowouts, reservoir damage, loss of production, loss of well control, unstable or faulty sea floor conditions, fires and natural disasters such as hurricanes. The occurrence of any of these types of events could result in the suspension of drilling operations, damage to or destruction of the equipment involved and injury or death to rig personnel, damage to producing or potentially productive oil and gas formations, and oil spillage, oil leaks, well blowouts and extensive uncontrolled fires, any of which could cause significant environmental damage. In addition, offshore drilling operations are subject to marine hazards, including capsizing, grounding, collision and loss or damage from severe weather. Operations also may be suspended because of machinery breakdowns, abnormal drilling conditions, failure of suppliers or subcontractors to perform or supply goods or services or personnel shortages. Any of the foregoing events could result in significant damage or loss to our properties and assets or the properties and assets of others, injury or death to rig personnel or others, significant loss of revenues and significant damage claims against us, which could have a material adverse effect on our results of operations, financial condition and cash flows.
Our drilling contracts with our customers provide for varying levels of indemnity and allocation of liabilities between our customers and us with respect to the hazards and risks inherent in, and damages or losses arising out
16
Table of Contents
of, our operations, and we may not be fully protected. Our contracts with our customers generally provide that we and our customers each assume liability for our respective personnel and property. Our contracts also generally provide that our customers assume most of the responsibility for and indemnify us against loss, damage or other liability resulting from, among other hazards and risks, pollution originating from the well and subsurface damage or loss, while we typically retain responsibility for and indemnify our customers against pollution originating from the rig. However, in certain drilling contracts we may not be fully indemnified by our customers for damage to their property and/or the property of their other contractors. In certain contracts we may assume liability for losses or damages (including punitive damages) resulting from pollution or contamination caused by negligent or willful acts of commission or omission by us, our suppliers and/or subcontractors, generally subject to negotiated caps on a per occurrence basis and/or on an aggregate basis for the term of the contract. In some cases, suppliers or subcontractors who provide equipment or services to us may seek to limit their liability resulting from pollution or contamination. Our contracts are individually negotiated, and the levels of indemnity and allocation of liabilities in them can vary from contract to contract depending on market conditions, particular customer requirements and other factors existing at the time a contract is negotiated.
Additionally, the enforceability of indemnification provisions in our contracts may be limited or prohibited by applicable law or may not be enforced by courts having jurisdiction, and we could be held liable for substantial losses or damages and for fines and penalties imposed by regulatory authorities. The indemnification provisions of our contracts may be subject to differing interpretations, and the laws or courts of certain jurisdictions may enforce such provisions while other laws or courts may find them to be unenforceable, void or limited by public policy considerations, including when the cause of the underlying loss or damage is our gross negligence or willful misconduct, when punitive damages are attributable to us or when fines or penalties are imposed directly against us. The law with respect to the enforceability of indemnities varies from jurisdiction to jurisdiction and is unsettled under certain laws that are applicable to our contracts. Current or future litigation in particular jurisdictions, whether or not we are a party, may impact the interpretation and enforceability of indemnification provisions in our contracts. There can be no assurance that our contracts with our customers, suppliers and subcontractors will fully protect us against all hazards and risks inherent in our operations. There can also be no assurance that those parties with contractual obligations to indemnify us will be financially able to do so or will otherwise honor their contractual obligations.
We maintain liability insurance, which includes coverage for environmental damage; however, because of contractual provisions and policy limits, our insurance coverage may not adequately cover our losses and claim costs. In addition, certain risks such as pollution, reservoir damage and environmental risks are generally not fully insurable. Also, we do not typically purchase loss-of-hire insurance to cover lost revenues when a rig is unable to work. Accordingly, it is possible that our losses from the hazards we face could have a material adverse effect on our results of operations, financial condition and cash flows.
We believe that the policy limit under our marine liability insurance is within the range that is customary for companies of our size in the offshore drilling industry and is appropriate for our business. However, if an accident or other event occurs that exceeds our coverage limits or is not an insurable event under our insurance policies, or is not fully covered by contractual indemnity, it could have a material adverse effect on our results of operations, financial condition and cash flows. There can be no assurance that we will continue to carry the insurance we currently maintain, that our insurance will cover all types of losses or that we will be able to maintain adequate insurance in the future at rates we consider to be reasonable or that we will be able to obtain insurance against some risks.
Accordingly, the occurrence of any of the hazards we face could have a material adverse effect on our results of operations, financial condition and cash flows.
17
Table of Contents
Significant portions of our operations are conducted outside the United States and involve additional risks not associated with United States domestic operations.
Our operations outside the United States accounted for approximately 79%, 85% and 89% of our total consolidated revenues for 2015, 2014 and 2013, respectively, and include operations in South America, Australia and Southeast Asia, Europe, East and West Africa, the Mediterranean and Mexico. Because we operate in various regions throughout the world, we are exposed to risks of war, political disruption, civil disturbance, acts of terrorism, political corruption, possible economic and legal sanctions (such as possible restrictions against countries that the U.S. government may consider to be state sponsors of terrorism) and changes in global trade policies. We may not have insurance coverage for these risks, or we may not be able to obtain adequate insurance coverage for such events at reasonable rates. Our operations may become restricted, disrupted or prohibited in any country in which any of the foregoing risks occur. In particular, the occurrence of any of these risks or any of the following events could materially and adversely impact our results of operations:
| • | political and economic instability; |
| • | piracy, terrorism or other assaults on property or personnel; |
| • | kidnapping of personnel; |
| • | seizure, expropriation, nationalization, deprivation, malicious damage or other loss of possession or use of property or equipment; |
| • | renegotiation or nullification of existing contracts; |
| • | disputes and legal proceedings in international jurisdictions; |
| • | changing social, political and economic conditions; |
| • | enactment of additional or stricter U.S. government or international sanctions; |
| • | imposition of wage and price controls, trade barriers or import-export quotas; |
| • | restrictive foreign and domestic monetary policies; |
| • | the inability to repatriate income or capital; |
| • | difficulties in collecting accounts receivable and longer collection periods; |
| • | fluctuations in currency exchange rates and restrictions on currency exchange; |
| • | regulatory or financial requirements to comply with foreign bureaucratic actions; |
| • | restriction or disruption of business activities; |
| • | limitation of our access to markets for periods of time; |
| • | travel limitations or operational problems caused by public health threats; |
| • | difficulties in supplying, repairing or replacing equipment or transporting personnel in remote locations; |
| • | difficulties in obtaining visas or work permits for our employees on a timely basis; and |
| • | changing taxation policies and confiscatory or discriminatory taxation. |
We are also subject to the U.S. Treasury Department’s Office of Foreign Assets Control and other U.S. laws and regulations governing our international operations in addition to worldwide anti-bribery laws. In addition, international contract drilling operations are subject to various laws and regulations in countries in which we operate, including laws and regulations relating to:
| • | the equipping and operation of drilling rigs; |
| • | import-export quotas or other trade barriers; |
18
Table of Contents
| • | repatriation of foreign earnings or capital; |
| • | oil and gas exploration and development; |
| • | local content requirements; |
| • | taxation of offshore earnings and earnings of expatriate personnel; and |
| • | use and compensation of local employees and suppliers by foreign contractors. |
Some foreign governments favor or effectively require the awarding of drilling contracts to local contractors, require use of a local agent or require foreign contractors to employ citizens of, or purchase supplies from, a particular jurisdiction. These practices may adversely affect our ability to compete in those regions. It is difficult to predict what governmental regulations may be enacted in the future that could adversely affect the international offshore drilling industry. The actions of foreign governments may materially and adversely affect our ability to compete.
In addition, the shipment of goods, including the movement of a drilling rig across international borders, subjects us to extensive trade laws and regulations. Our import activities are governed by unique customs laws and regulations that differ in each of the countries in which we operate and often impose record keeping and reporting obligations. The laws and regulations concerning import/export activity and record keeping and reporting requirements are complex and change frequently. These laws and regulations may be enacted, amended, enforced and/or interpreted in a manner that could materially and adversely impact our operations. Shipments can be delayed and denied export or entry for a variety of reasons, some of which may be outside of our control. Shipping delays or denials could cause unscheduled downtime for our rigs. Failure to comply with these laws and regulations could result in criminal and civil penalties, economic sanctions, seizure of shipments and/or the contractual withholding of monies owed to us, among other things.
Compliance with or breach of environmental laws can be costly and could limit our operations.
In the United States and in many of the international locations in which we operate, laws and regulations controlling the discharge of materials into the environment, requiring removal and cleanup of materials that may harm the environment or otherwise relating to the protection of the environment apply to some of our operations. For example, we, as an operator of mobile offshore drilling units in navigable United States waters and some offshore areas, may be liable for damages and costs incurred in connection with oil spills related to those operations. Laws and regulations protecting the environment have become increasingly stringent, and may in some cases impose “strict liability,” rendering a person liable for environmental damage without regard to negligence or fault on the part of that person. These laws and regulations may expose us to liability for the conduct of, or conditions caused by, others or for acts that were in compliance with all applicable laws at the time they were performed.
U.S. federal and state, foreign and international laws and regulations address oil spill prevention and control and impose a variety of obligations on us related to the prevention of oil spills and liability for damages resulting from such spills. Some of these laws and regulations have significantly expanded liability exposure across all segments of the oil and gas industry. For example, the United States Oil Pollution Act of 1990 imposes strict and, with limited exceptions, joint and several liability upon each responsible party for oil removal costs and a variety of public and private damages. Failure to comply with such laws and regulations could subject us to civil or criminal enforcement action, for which we may not receive contractual indemnification or have insurance coverage, and could result in the issuance of injunctions restricting some or all of our activities in the affected areas. In addition, legislative and regulatory developments may occur that could substantially increase our exposure to liabilities that might arise in connection with our operations.
The application of these laws and regulations or the adoption of new laws and regulations could have a material adverse effect on our financial condition, results of operations and cash flows.
19
Table of Contents
We may be subject to litigation and disputes that could have a material adverse effect on us.
We are, from time to time, involved in litigation and disputes. These matters may include, among other things, contract disputes, personal injury claims, environmental claims or proceedings, asbestos and other toxic tort claims, employment and tax matters and other litigation that arises in the ordinary course of our business. Although we intend to defend these matters vigorously, we cannot predict with certainty the outcome or effect of any dispute, claim or other litigation matter, and there can be no assurance as to the ultimate outcome of any litigation. We may not have insurance for litigation or claims that may arise, or if we do have insurance coverage it may not be sufficient, insurers may not remain solvent, other claims may exhaust some or all of the insurance available to us or insurers may interpret our insurance policies such that they do not cover losses for which we make claims or may otherwise dispute claims made. Litigation may have a material adverse effect on us because of potential adverse outcomes, defense costs, the diversion of our management’s resources and other factors.
We self-insure for physical damage to rigs and equipment caused by named windstorms in the U.S. Gulf of Mexico.
Because the amount of insurance coverage available to us is limited, and the cost for such coverage is substantial, we self-insure for physical damage to rigs and equipment caused by named windstorms in the GOM. This results in a higher risk of losses, which could be material, that are not covered by third party insurance contracts. If one or more named windstorms in the GOM cause significant damage to our rigs or equipment, it could have a material adverse effect on our financial condition, results of operations and cash flows.
In addition, certain of our shore-based facilities are located in geographic regions that are susceptible to damage or disruption from hurricanes and other weather events. Future hurricanes or similar natural disasters that impact our facilities, our personnel located at those facilities or our ongoing operations may negatively affect our financial position and operating results for those periods. These negative effects may include reduced or lost sales and revenues; costs associated with interruption in operations and with resuming operations; reduced demand for our services from customers that were similarly affected by these events; lost market share; late deliveries; uninsured property losses; inadequate business interruption insurance; employee evacuations; and an inability to retain necessary staff.
We may be required to accrue additional tax liability on certain of our foreign earnings.
Certain of our international rigs are owned and operated, directly or indirectly, by Diamond Foreign Asset Company, or DFAC, a Cayman Islands subsidiary that we own. It is our intention to indefinitely reinvest future earnings of DFAC and its foreign subsidiaries to finance foreign activities. We do not expect to provide for U.S. taxes on any future earnings generated by DFAC and its foreign subsidiaries, except to the extent that these earnings are immediately subjected to U.S. federal income tax. Should a future distribution be made from any unremitted earnings of this subsidiary, we may be required to record additional U.S. income taxes that, if material, could have a material adverse effect on our financial condition, results of operations and cash flows.
Fluctuations in exchange rates and nonconvertibility of currencies could result in losses to us.
Due to our international operations, we have experienced currency exchange losses where revenues are received and expenses are paid in nonconvertible currencies or where we do not effectively hedge an exposure to a foreign currency. We may also incur losses as a result of an inability to collect revenues because of a shortage of convertible currency available to the country of operation, controls over currency exchange or controls over the repatriation of income or capital.
20
Table of Contents
Acts of terrorism and other political and military events could adversely affect the markets for our drilling services.
Terrorist attacks and the continued threat of terrorism in the U.S. and abroad, the continuation or escalation of existing armed hostilities or the outbreak of additional hostilities could lead to increased political, economic and financial market instability and a downturn in the economies of the U.S. and other countries. A lower level of economic activity could result in a decline in energy consumption or an increase in the volatility of energy prices, either of which could materially and adversely affect the market for our offshore drilling services, our dayrates or utilization and, accordingly, our financial condition, results of operations and cash flows. While we take steps that we believe are appropriately designed to secure our energy assets, there is no assurance that we can completely secure these assets, completely protect them against a terrorist attack or other political and military events or obtain adequate insurance coverage for such events at reasonable rates.
Failure to obtain and retain highly skilled personnel could hurt our operations.
We require highly skilled personnel to operate and provide technical services and support for our business. A well-trained, motivated and adequately-staffed work force has a positive impact on our ability to attract and retain business. As a result, our future success depends on our continuing ability to identify, hire, develop, motivate and retain skilled personnel for all areas of our organization. To the extent that demand for drilling services and/or the size of the worldwide industry fleet increases (including due to the impact of newly constructed rigs), shortages of qualified personnel could arise, creating upward pressure on wages and difficulty in staffing and servicing our rigs, which could adversely affect our results of operations. As of the date of this report, the Ocean GreatWhite, our ultra-deepwater, semisubmersible rig, is under construction. This rig is not yet fully crewed and will require additional skilled personnel to operate. Additional new capacity in the offshore drilling market could also cause further competition for qualified and experienced personnel as these entities seek to hire personnel with expertise in the offshore drilling industry. Our continued ability to compete effectively depends on our ability to attract new employees and to retain and motivate our existing employees. Heightened competition for skilled personnel could materially and adversely impact our financial condition, results of operations and cash flows by limiting our operations and further increasing our costs.
We rely on third-party suppliers, manufacturers and service providers to secure equipment, components and parts used in rig operations, conversions, upgrades and construction.
Our reliance on third-party suppliers, manufacturers and service providers to provide equipment and services exposes us to volatility in the quality, price and availability of such items. Certain components, parts and equipment that we use in our operations may be available only from a small number of suppliers, manufacturers or service providers. The failure of one or more third-party suppliers, manufacturers or service providers to provide equipment, components, parts or services, whether due to capacity constraints, production or delivery disruptions, price increases, quality control issues, recalls or other decreased availability of parts and equipment, is beyond our control and could materially disrupt our operations or result in the delay, renegotiation or cancellation of drilling contracts, thereby causing a loss of contract drilling backlog and/or revenue to us, as well as an increase in operating costs.
Additionally, our suppliers, manufacturers and service providers could be negatively impacted by current industry conditions or global economic conditions. If certain of our suppliers, manufacturers or service providers were to experience significant cash flow issues, become insolvent or otherwise curtail or discontinue their business as a result of such conditions, it could result in a reduction or interruption in supplies or equipment available to us and/or a significant increase in the price of such supplies and equipment, which could adversely impact our results of operations and cash flows.
21
Table of Contents
Our debt levels may limit our liquidity and flexibility in obtaining additional financing and in pursuing other business opportunities.
As of December 31, 2015, we had approximately $0.3 million and $2.0 billion in short-term borrowings and senior debt, respectively, maturing at various times from 2019 through 2043. As of February 16, 2016, we had $305.0 million in Eurodollar loans outstanding and an additional $1.2 billion of availability under our revolving credit facility. We may incur additional indebtedness in the future, including indebtedness under our commercial paper program, and we may borrow from time to time under our revolving credit facility to fund working capital or other needs, subject to compliance with its covenants.
Our ability to meet our debt service obligations is dependent upon our future performance, which is subject to general economic conditions, industry cycles and financial, business and other factors affecting our operations, many of which are beyond our control. High levels of indebtedness could have negative consequences to us, including:
| • | we may have difficulty satisfying our obligations with respect to our outstanding debt; |
| • | we may have difficulty obtaining financing in the future for working capital, capital expenditures, acquisitions or other purposes; |
| • | we may need to use a substantial portion of our available cash flow from operations to pay interest and principal on our debt, which would reduce the amount of money available to fund working capital requirements, capital expenditures, the payment of dividends and other general corporate or business activities; |
| • | our vulnerability to general economic downturns and adverse industry conditions could increase; |
| • | our flexibility in planning for, or reacting to, changes in our business and in our industry in general could be limited; |
| • | our amount of debt and the amount we must pay to service our debt obligations could place us at a competitive disadvantage compared to our competitors that have less debt; |
| • | our customers may react adversely to our significant debt level and seek alternative service providers; and |
| • | our failure to comply with the restrictive covenants in our debt instruments that, among other things, require us to maintain a specified ratio of our consolidated indebtedness to total capitalization and limit the ability of our subsidiaries to incur debt, could result in an event of default that, if not cured or waived, could have a material adverse effect on our business or prospects. |
In addition, approximately $500.0 million of our long-term debt will mature over the next five years and will need to be paid or refinanced. We may not be able to refinance our maturing debt upon commercially reasonable terms, or at all, depending on numerous factors, including our financial condition and prospects at the time and the then current state of the bank and capital markets in the U.S. Further, our liquidity may be adversely affected if we are unable to replace our revolving credit facility upon acceptable terms when it matures.
Our overall debt level and/or market conditions could lead credit rating agencies to lower our long-term and/or short-term corporate credit ratings. In January 2016, Moody’s Investor Services announced that it would be reviewing our long-term corporate credit and unsecured debt rating and short-term credit rating for commercial paper, which are currently Baa2 and Prime-2, respectively, for possible downgrade. Our current corporate credit rating is BBB+ and our short-term credit rating is A2 for Standard & Poor’s Ratings Services.
Downgrades in our corporate credit ratings could impact our ability to issue additional debt by raising the cost of issuing new debt. As a consequence, we may not be able to issue additional debt in amounts and/or with terms that we consider to be reasonable. One or more of these occurrences could limit our ability to pursue other business opportunities.
22
Table of Contents
In addition, our credit ratings are important to our ability to issue commercial paper at favorable rates of interest. A downgrade in our credit rating could increase the cost of borrowing or make the commercial paper market unavailable to us, which could increase our cost of capital. In addition, our access to funds under our commercial paper program is dependent on investor demand for our commercial paper. Disruptions and volatility in the global credit markets could limit the demand for our commercial paper or result in the need to offer higher interest rates to investors, which would result in increased expense and could adversely impact our liquidity.
Our revolving credit facility bears interest at variable rates. If market interest rates increase, debt service requirements on amounts outstanding under our revolving credit facility will increase. This would have an adverse effect on our results of operations and cash flows. Although we may employ hedging strategies such that a portion of the aggregate principal amount outstanding under this credit facility carries a fixed rate of interest, any hedging arrangement put in place may not offer complete protection from this risk.
Any significant cyber attack or other interruption in network security or the operation of critical computer systems could materially disrupt our operations and adversely affect our business.
Our business has become increasingly dependent upon information technologies, systems and networks to conduct day-to-day operations, and we are placing greater reliance on technology to help support our operations and increase efficiency in our business functions. We are dependent upon our information technology and infrastructure, including operational and financial computer systems to process the data necessary to conduct almost all aspects of our business. Computer and other business facilities and systems could become unavailable or impaired from a variety of causes including, among others, storms and other natural disasters, terrorist attacks, utility outages, theft, design defects, human error or complications encountered as existing systems are maintained, repaired, replaced or upgraded. It has also been reported that unknown entities or groups have mounted so-called “cyber attacks” on businesses and other organizations solely to disable or disrupt computer systems, disrupt operations and, in some cases, steal data. A breach or failure of our computer systems or networks, or those of our customers, vendors or others with whom we do business, could materially disrupt our business operations and could result in the alteration, loss, theft or corruption of data or unauthorized release of confidential, proprietary or sensitive data concerning our company, business activities, employees, customers or vendors. Any such breach or failure could have a material adverse effect on our operations, business or reputation.
Unionization efforts and labor regulations in some of the countries in which we operate could materially increase our costs or limit our flexibility.
Some of our employees in non-U.S. markets are represented by labor unions and work under collective bargaining or similar agreements which are subject to periodic renegotiation. These negotiations could result in higher personnel expenses, other increased costs or increased operational restrictions. Efforts have been made from time to time to unionize other portions of our workforce. In addition, we may be subjected to strikes or work stoppages and other labor disruptions in certain countries. Additional unionization efforts, new collective bargaining agreements or work stoppages could materially increase our costs, reduce our revenues or limit our flexibility.
We are controlled by a single stockholder, which could result in potential conflicts of interest.
Loews Corporation, which we refer to as Loews, beneficially owned approximately 53% of our outstanding shares of common stock as of February 16, 2016, and is in a position to control actions that require the consent of stockholders, including the election of directors, amendment of our Restated Certificate of Incorporation and any merger or sale of substantially all of our assets. In addition, three officers of Loews serve on our Board of Directors. One of those, James S. Tisch, the Chairman of the Board of our company, is also the Chief Executive Officer and a director of Loews. We have also entered into a services agreement and a registration rights agreement with Loews, and we may in the future enter into other agreements with Loews.
23
Table of Contents
Loews is a holding company. In addition to us, its principal subsidiaries are CNA Financial Corporation, a 90% owned subsidiary engaged in commercial property and casualty insurance; Boardwalk Pipeline Partners, LP, a 51% owned subsidiary engaged in transportation and storage of natural gas and natural gas liquids and gathering and processing of natural gas; and Loews Hotels Holding Corporation, a wholly-owned subsidiary engaged in the operation of a chain of hotels. It is possible that Loews may in some circumstances be in direct or indirect competition with us, including competition with respect to certain business strategies and transactions that we may propose to undertake. In addition, potential conflicts of interest exist or could arise in the future for our directors who are also officers of Loews with respect to a number of areas relating to the past and ongoing relationships of Loews and us, including tax and insurance matters, financial commitments and sales of common stock pursuant to registration rights or otherwise. Although the affected directors may abstain from voting on matters in which our interests and those of Loews are in conflict so as to avoid potential violations of their fiduciary duties to stockholders, the presence of potential or actual conflicts could affect the process or outcome of Board deliberations. We cannot assure you that these conflicts of interest will not materially adversely affect us.
| Item 1B. | Unresolved Staff Comments. |
Not applicable.
| Item 2. | Properties. |
We own an office building in Houston, Texas, where our corporate headquarters are located. We also own offices and other facilities in New Iberia, Louisiana, Aberdeen, Scotland, Macae, Brazil and Ciudad del Carmen, Mexico. Additionally, we currently lease various office, warehouse and storage facilities in Australia, Egypt, Indonesia, Louisiana, Malaysia, Romania, Singapore, Thailand, Trinidad and Tobago, the U.K. and Vietnam to support our offshore drilling operations.
| Item 3. | Legal Proceedings. |
See information with respect to legal proceedings in Note 12 “Commitments and Contingencies” to our Consolidated Financial Statements in Item 8 of this report.
| Item 4. | Mine Safety Disclosures. |
Not applicable.
24
Table of Contents
PART II
| Item 5. | Market for the Registrant’s Common Equity, Related Stockholder Matters and Issuer Purchases of Equity Securities. |
Price Range of Common Stock
Our common stock is listed on the New York Stock Exchange, or NYSE, under the symbol “DO.” The following table sets forth, for the calendar quarters indicated, the high and low closing prices of our common stock as reported by the NYSE.
| Common Stock | ||||||||
| High | Low | |||||||
| 2015 |
||||||||
| First Quarter |
$ | 37.23 | $ | 26.49 | ||||
| Second Quarter |
34.81 | 25.81 | ||||||
| Third Quarter |
25.45 | 17.30 | ||||||
| Fourth Quarter |
23.50 | 16.81 | ||||||
| 2014 |
||||||||
| First Quarter |
$ | 56.71 | $ | 43.91 | ||||
| Second Quarter |
54.61 | 45.88 | ||||||
| Third Quarter |
50.13 | 34.27 | ||||||
| Fourth Quarter |
39.60 | 29.37 | ||||||
As of February 16, 2016, there were approximately158 holders of record of our common stock. This number represents registered stockholders and does not include stockholders who hold their shares institutionally.
Dividend Policy
In 2015, we paid regular cash dividends of $0.125 per share of our common stock on March 2, June 1, September 1 and December 1. In 2014, we paid regular cash dividends of $0.125 and special cash dividends of $0.75 per share of our common stock on March 3, June 2, September 2 and December 1.
On February 8, 2016, we announced that we were discontinuing our regular cash dividend.
Our Board has adopted a policy of considering paying regular and special cash dividends, in amounts to be determined, on a quarterly basis. Any determination to declare a regular or special dividend, as well as the amount of any dividend that may be declared, will be based on the Board’s consideration of our financial position, earnings, earnings outlook, capital spending plans, outlook on current and future market conditions and business needs and other factors that our Board considers relevant at that time. Our dividend policy may change from time to time, and there can be no assurance that we will continue to declare any regular or special cash dividends at all or in any particular amounts. See “Risk Factors – Although we have paid cash dividends in the past, we may not pay regular or special cash dividends in the future and we can give no assurance as to the amount or timing of the payment of any future regular or special cash dividends” in Item 1A of this report, which is incorporated herein by reference.
25
Table of Contents
CUMULATIVE TOTAL STOCKHOLDER RETURN
The following graph shows the cumulative total stockholder return for our common stock, the Standard & Poor’s 500 Index and the Dow Jones U.S. Oil Equipment & Services index over the five year period ended December 31, 2015.
Comparison of 2011 – 2015 Cumulative Total Return (1)
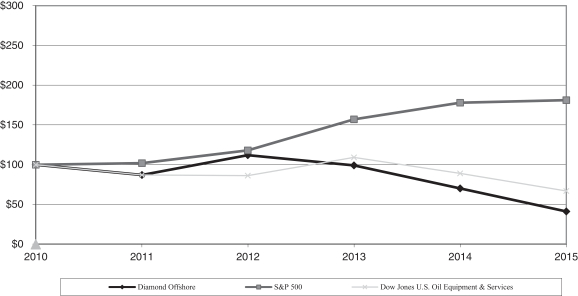
| Dec. 31, 2010 |
Dec. 31, 2011 |
Dec. 31, 2012 |
Dec. 31, 2013 |
Dec. 31, 2014 |
Dec. 31, 2015 |
|||||||||||||||||||
| Diamond Offshore |
100 | 87 | 112 | 99 | 70 | 41 | ||||||||||||||||||
| S&P 500 |
100 | 102 | 118 | 157 | 178 | 181 | ||||||||||||||||||
| Dow Jones U.S. Oil Equipment & Services |
100 | 87 | 86 | 109 | 89 | 67 | ||||||||||||||||||
| (1) | Total return assuming reinvestment of dividends. Assumes $100 invested on December 31, 2010 in our common stock and the two published indices. |
Our dividend history for the periods reported above is as follows:
| Q1 | Q2 | Q3 | Q4 | |||||||||||||||||||||||||||||
| Year |
Regular | Special | Regular | Special | Regular | Special | Regular | Special | ||||||||||||||||||||||||
| 2015 |
$ | 0.125 | $ | — | $ | 0.125 | $ | — | $ | 0.125 | $ | — | $ | 0.125 | $ | — | ||||||||||||||||
| 2014 |
$ | 0.125 | $ | 0.75 | $ | 0.125 | $ | 0.75 | $ | 0.125 | $ | 0.75 | $ | 0.125 | $ | 0.75 | ||||||||||||||||
| 2013 |
$ | 0.125 | $ | 0.75 | $ | 0.125 | $ | 0.75 | $ | 0.125 | $ | 0.75 | $ | 0.125 | $ | 0.75 | ||||||||||||||||
| 2012 |
$ | 0.125 | $ | 0.75 | $ | 0.125 | $ | 0.75 | $ | 0.125 | $ | 0.75 | $ | 0.125 | $ | 0.75 | ||||||||||||||||
| 2011 |
$ | 0.125 | $ | 0.75 | $ | 0.125 | $ | 0.75 | $ | 0.125 | $ | 0.75 | $ | 0.125 | $ | 0.75 | ||||||||||||||||
26
Table of Contents
| Item 6. | Selected Financial Data. |
The following table sets forth certain historical consolidated financial data relating to Diamond Offshore. We prepared the selected consolidated financial data from our consolidated financial statements as of and for the periods presented. The selected consolidated financial data below should be read in conjunction with “Management’s Discussion and Analysis of Financial Condition and Results of Operations” in Item 7 and our Consolidated Financial Statements (including the Notes thereto) in Item 8 of this report.
| As of and for the Year Ended December 31, | ||||||||||||||||||||
| 2015 | 2014 | 2013 | 2012 | 2011 | ||||||||||||||||
| (In thousands, except per share and ratio data) | ||||||||||||||||||||
| Income Statement Data: |
||||||||||||||||||||
| Total revenues |
$ | 2,419,393 | $ | 2,814,671 | $ | 2,920,421 | $ | 2,986,508 | $ | 3,322,419 | ||||||||||
| Operating (loss) income |
(294,074 | )(1) | 572,562 | (2) | 801,606 | 962,378 | 1,255,414 | |||||||||||||
| Net (loss) income |
(274,285 | ) | 387,011 | 548,686 | 720,477 | 962,542 | ||||||||||||||
| Net (loss) income per share: |
||||||||||||||||||||
| Basic |
(2.00 | ) | 2.82 | 3.95 | 5.18 | 6.92 | ||||||||||||||
| Diluted |
(2.00 | ) | 2.81 | 3.95 | 5.18 | 6.92 | ||||||||||||||
| Balance Sheet Data: |
||||||||||||||||||||
| Drilling and other property and equipment, net |
$ | 6,378,814 | (1) | $ | 6,945,953 | (2)(3) | $ | 5,467,227 | $ | 4,864,972 | $ | 4,667,469 | ||||||||
| Total assets |
7,164,889 | 8,021,289 | 8,391,434 | 7,235,286 | 6,964,157 | |||||||||||||||
| Long-term debt (excluding current maturities) (4) |
1,994,773 | 1,994,526 | 2,244,189 | 1,496,066 | 1,495,823 | |||||||||||||||
| Other Financial Data: |
||||||||||||||||||||
| Capital expenditures |
$ | 830,655 | $ | 2,032,764 | (3) | $ | 957,598 | $ | 702,041 | $ | 774,756 | |||||||||
| Cash dividends declared per share |
0.50 | 3.50 | 3.50 | 3.50 | 3.50 | |||||||||||||||
| Ratio of earnings to fixed charges (5) |
(2.45 | )x(6) | 4.64 | x | 7.79 | x | 11.11 | x | 14.40 | x | ||||||||||
| (1) | During 2015, we recorded an aggregate impairment loss of $860.4 million to write down certain of our drilling rigs with indicators of impairment to their estimated recoverable amounts. See “Management’s Discussion and Analysis of Financial Condition and Results of Operations – Results of Operations – Years Ended December 31, 2015, 2014 and 2013 – Overview – 2015 Compared to 2014 – Impairment of Assets and Note 2 “Asset Impairments” to our Consolidated Financial Statements included in Item 8 of this report for a discussion of the 2015 asset impairment. |
| (2) | In the third quarter of 2014, we recorded an impairment loss of $109.5 million to write down six of our mid-water semisubmersibles with indicators of impairment to their estimated recoverable amounts. See “Management’s Discussion and Analysis of Financial Condition and Results of Operations – Results of Operations – Years Ended December 31, 2015, 2014 and 2013 – Overview – 2014 Compared to 2013 – Impairment of Assets and Note 2 “Asset Impairments” to our Consolidated Financial Statements included in Item 8 of this report for a discussion of the 2014 asset impairment. |
| (3) | During 2014, we took delivery of three ultra-deepwater drillships and two deepwater semisubmersible rigs. The aggregate net book value of these newly constructed rigs was $2.7 billion at December 31, 2014, of which $1.3 billion was reported in construction work-in-progress at December 31, 2013. See Note 9 “Drilling and Other Property and Equipment” to our Consolidated Financial Statements included in Item 8 of this report for a discussion of the components of our drilling and other property and equipment. |
| (4) | See “Management’s Discussion and Analysis of Financial Condition and Results of Operations – Liquidity and Capital Resources – Credit Agreement, Commercial Paper Program and Senior Notes” in Item 7 and Note 10 “Credit Agreement and Senior Notes” to our Consolidated Financial Statements included in Item 8 of this report for a discussion of changes to our long-term debt. |
| (5) | For all periods presented, the ratio of earnings to fixed charges has been computed on a total enterprise basis. Earnings represent pre-tax income from continuing operations plus fixed charges. Fixed charges include (i) interest, whether expensed or capitalized, (ii) amortization of debt issuance costs, whether expensed or capitalized, and (iii) a portion of rent expense, which we believe represents the interest factor attributable to rent. |
| (6) | The deficiency in our earnings available for fixed charges for the year ended December 31, 2015 was $388.9 million. |
27
Table of Contents
Item 7. Management’s Discussion and Analysis of Financial Condition and Results of Operations.
The following discussion should be read in conjunction with our Consolidated Financial Statements (including the Notes thereto) in Item 8 of this report.
We are a leader in offshore drilling, providing contract drilling services to the energy industry around the globe with a fleet of 32 offshore drilling rigs that includes four jack-up rigs which we are marketing for sale. Our fleet consists of 23 semisubmersibles, including the Ocean GreatWhite, which is under construction, five jack-up rigs and four dynamically positioned drillships, including the last of our four newbuild drillships, the Ocean BlackLion, which was delivered in the second quarter of 2015. We expect our harsh environment, ultra-deepwater semisubmersible rig, the Ocean GreatWhite, to be delivered in mid-2016.
Market Overview
Market fundamentals in the oil and gas industry deteriorated further in the fourth quarter of 2015 and have continued to decline in 2016. In early January 2016, oil prices fell to a 12-year low below $30 per barrel, with some industry analysts predicting even lower commodity prices before any market recovery. Oil markets continue to be volatile due to a number of geopolitical and economic factors. These factors, combined with significant operating losses incurred during the fourth quarter of 2015 by some independent and national oil companies and exploration and production companies, have caused most of these companies to announce additional cuts to their already reduced 2016 capital spending plans, reflecting delays in planned drilling or exploration projects, and, in some cases, termination of projects altogether. Rig tenders are infrequent and have generally been limited to short-term or well-to-well work not commencing until 2017 or later. There have been very few rig tenders thus far in 2016.
The offshore floater market is currently faced with an oversupply of drilling rigs, which thus far has only been slightly abated by the cold stacking and retirement of rigs. The number of available rigs continues to grow as contracted rigs come off contract and newbuilds are delivered, increasing competition. Competition for the limited number of drilling jobs continues to be intense with some operators bidding multiple rigs on the same job, in some cases, bidding rigs of both higher and lower specifications. Operators are also continuing to attempt to sublet previously contracted rigs for which capital spending programs have been delayed or canceled. Industry analysts have predicted that the offshore contract drilling market may remain depressed with further declines in dayrates and utilization likely in 2016 and 2017.
As a result of the depressed market conditions and continued pessimistic outlook for the near term, certain of our customers, as well as those of our competitors, have attempted to renegotiate or terminate existing drilling contracts. Such renegotiations could include requests to lower the contract dayrate, lowering of a dayrate in exchange for additional contract term, shortening the term on one contracted rig in exchange for additional term on another rig, early termination of a contract in exchange for a lump sum margin payout and many other possibilities. In addition to the potential for renegotiations, some of our drilling contracts permit the customer to terminate the contract early after specified notice periods, sometimes resulting in no payment to us or sometimes resulting in a contractually specified termination amount, which may not fully compensate us for the loss of the contract. During depressed market conditions, certain customers have utilized such contract clauses to seek to renegotiate or terminate a drilling contract or claim that we have breached provisions of our drilling contracts in order to avoid their obligations to us under circumstances where we believe we are in compliance with the contracts. Particularly during depressed market conditions, the early termination of a contract may result in a rig being idle for an extended period of time, which could adversely affect our financial condition, results of operations and cash flows. When a customer terminates our contract prior to the contract’s scheduled expiration, our contract backlog is also adversely impacted. See “Risk Factors – We can provide no assurance that our drilling contracts will not be terminated early or that our current backlog of contract drilling revenue will be ultimately realized” and “– Contract Drilling Backlog” below.
28
Table of Contents
Our results of operations and cash flows for the year ended December 31, 2015 have been materially impacted by depressed market conditions in the offshore drilling industry. We currently expect that these adverse market conditions will continue for the foreseeable future. The continuation of these conditions for an extended period could result in more of our rigs being without contracts and/or cold stacked or scrapped and could further materially and adversely affect our financial condition, results of operations and cash flows. When we cold stack or elect to scrap a rig, we evaluate the rig for impairment. During 2015, we recognized an aggregate impairment loss of $860.4 million, including an impairment loss of $499.4 million recognized in the fourth quarter of 2015. See “– Results of Operations – Years Ended December 31, 2015, 2014 and 2013 – Overview – 2015 Compared to 2014 – Impairment of Assets,” “Risk Factors – We may incur additional asset impairments and/or rig retirements as a result of reduced demand for certain offshore drilling rigs” in Item 1A of this report and Note 2 “Asset Impairments” to our Consolidated Financial Statements in Item 8 of this report
As of February 16, 2016, 17 of our rigs were not subject to a drilling contract with a customer, including 14 rigs that have been cold stacked. Of the cold-stacked rigs, four jack-up rigs are currently being marketed for sale. The previously cold-stacked jack-up rig Ocean Titan was sold in February 2016. See “– Contract Drilling Backlog” for future commitments of our rigs during 2016 through 2020.
Although these general market conditions impact all segments of the offshore drilling market, the following discussion addresses market conditions within segments of the floater market.
Floater Markets
Ultra-Deepwater and Deepwater Floaters. Globally, the ultra-deepwater and deepwater floater markets continue to be depressed. Diminished or nonexistent demand, combined with an oversupply of rigs has caused floater dayrates to decline significantly. Offshore drilling contractors have been approached by customers with binding contracts, who have sought to and have successfully renegotiated such contracts at lower rates to obtain some financial relief in the current market, and, in some cases, have terminated contracts with and without compensation to the associated drilling contractor. Industry analysts expect offshore drillers to continue to scrap older, lower specification rigs; however, newer and higher specification rigs have not been immune to the recycling trend. In addition, industry analysts predict that the number of uncontracted floaters may more than double by the end of 2016.
Newbuild rig deliveries and established rigs coming off contract continue to fuel an oversupply of floaters in both the ultra-deepwater and deepwater markets. In an effort to manage the oversupply of rigs and potentially avoid the cost of cold stacking newly-built rigs, which, in the case of dynamically-positioned rigs, can be significant, several drilling contractors have exercised options to delay the delivery of rigs by the shipyard or have exercised their right to cancel orders due to the late delivery of rigs. As of the date of this report, based on industry data, there are approximately 54 competitive, or non-owner-operated, newbuild floaters on order, 32 of which are not yet contracted for future work. In addition, based on industry reports, there are currently 20 newbuild floaters scheduled for delivery in 2016, of which only four rigs have been contracted for future work; however, industry analysts predict that delivery dates may shift as newbuild owners negotiate with their respective shipyards.
Mid-Water Floaters. While conditions in the mid-water market vary slightly by region, mid-water rigs have been adversely impacted by (i) lower demand, (ii) declining dayrates, (iii) increased regulatory requirements, including more stringent design requirements for well control equipment, which could significantly increase the capital needed to comply with design requirements that would permit such rigs to work in U.S. waters, (iv) the challenges experienced by lower specification units in this segment as a result of more complex customer specifications, and (v) the intensified competition resulting from the migration of some deepwater and ultra-deepwater units to compete against mid-water units. To date, the mid-water market has seen the highest number of cold-stacked and scrapped rigs. Since 2012, we have sold 12 of our mid-water rigs for scrap. As market conditions remain challenging, we expect higher specification rigs to take the place of lower specification units, where possible, leading to additional lower specification rigs being cold stacked or ultimately scrapped.
29
Table of Contents
Contract Drilling Backlog
The following table reflects our contract drilling backlog as of February 16, 2016 (based on contract information known at that time), October 1, 2015 (the date reported in our Quarterly Report on Form 10-Q for the quarter ended September 30, 2015), and February 9, 2015 (the date reported in our Annual Report on Form 10-K for the year ended December 31, 2014). Contract drilling backlog as presented below includes only firm commitments (typically represented by signed contracts) and is calculated by multiplying the contracted operating dayrate by the firm contract period and adding one-half of any potential rig performance bonuses. Our calculation also assumes full utilization of our drilling equipment for the contract period (excluding scheduled shipyard and survey days); however, the amount of actual revenue earned and the actual periods during which revenues are earned will be different than the amounts and periods shown in the tables below due to various factors. Utilization rates, which generally approach 92-98% during contracted periods, can be adversely impacted by downtime due to various operating factors including, but not limited to, weather conditions and unscheduled repairs and maintenance. Contract drilling backlog excludes revenues for mobilization, demobilization, contract preparation and customer reimbursables. No revenue is generally earned during periods of downtime for regulatory surveys. Changes in our contract drilling backlog between periods are generally a function of the performance of work on term contracts, as well as the extension or modification of existing term contracts and the execution of additional contracts. In addition, under certain circumstances, our customers may seek to terminate or renegotiate our contracts. See “Risk Factors – We can provide no assurance that our drilling contracts will not be terminated early or that our current backlog of contract drilling revenue will be ultimately realized” in Item 1A of this report, which is incorporated herein by reference.
| February 16, 2016 |
October 1, 2015 |
February 9, 2015 |
||||||||||
| (In thousands) | ||||||||||||
| Contract Drilling Backlog |
||||||||||||
| Floaters: |
||||||||||||
| Ultra-Deepwater (1) |
$ | 4,415,000 | $ | 4,851,000 | $ | 5,390,000 | ||||||
| Deepwater |
375,000 | 439,000 | 748,000 | |||||||||
| Mid-Water |
356,000 | 401,000 | 611,000 | |||||||||
|
|
|
|
|
|
|
|||||||
| Total Floaters |
5,146,000 | 5,691,000 | 6,749,000 | |||||||||
| Jack-ups |
49,000 | 18,000 | 91,000 | |||||||||
|
|
|
|
|
|
|
|||||||
| Total |
$ | 5,195,000 | $ | 5,709,000 | $ | 6,840,000 | ||||||
|
|
|
|
|
|
|
|||||||
| (1) | Contract drilling backlog as of February 16, 2016 for our ultra-deepwater floaters includes $641.0 million for the years 2016 to 2019 attributable to future work for the semisubmersible Ocean GreatWhite, which is under construction. |
The following table reflects the amount of our contract drilling backlog by year as of February 16, 2016.
| For the Years Ending December 31, | ||||||||||||||||||||
| Total | 2016 (1) | 2017 | 2018 | 2019 - 2020 | ||||||||||||||||
| (In thousands) | ||||||||||||||||||||
| Contract Drilling Backlog |
||||||||||||||||||||
| Floaters: |
||||||||||||||||||||
| Ultra-Deepwater (2) |
$ | 4,415,000 | $ | 1,106,000 | $ | 1,201,000 | $ | 1,142,000 | $ | 966,000 | ||||||||||
| Deepwater |
375,000 | 238,000 | 137,000 | — | — | |||||||||||||||
| Mid-Water |
356,000 | 222,000 | 134,000 | — | — | |||||||||||||||
|
|
|
|
|
|
|
|
|
|
|
|||||||||||
| Total Floaters |
5,146,000 | 1,566,000 | 1,472,000 | 1,142,000 | 966,000 | |||||||||||||||
| Jack-ups |
49,000 | 42,000 | 7,000 | — | — | |||||||||||||||
|
|
|
|
|
|
|
|
|
|
|
|||||||||||
| Total |
$ | 5,195,000 | $ | 1,608,000 | $ | 1,479,000 | $ | 1,142,000 | $ | 966,000 | ||||||||||
|
|
|
|
|
|
|
|
|
|
|
|||||||||||
30
Table of Contents
| (1) | Represents the twelve-month period beginning January 1, 2016. |
| (2) | Contract drilling backlog as of February 16, 2016 for our ultra-deepwater floaters includes $90.0 million for the year 2016, $214.0 million for each of the years 2017 and 2018, and $123.0 million for the year 2019 attributable to future work for the Ocean GreatWhite, which is under construction. |
The following table reflects the percentage of rig days committed by year as of February 16, 2016. The percentage of rig days committed is calculated as the ratio of total days committed under contracts, as well as scheduled shipyard, survey and mobilization days for all rigs in our fleet, to total available days (number of rigs multiplied by the number of days in a particular year). Total available days have been calculated based on the expected final commissioning date for the Ocean GreatWhite, which is under construction.
| For the Years Ending December 31, | ||||||||||||||||
| 2016 (1) | 2017 | 2018 | 2019 - 2020 | |||||||||||||
| Rig Days Committed (2) |
||||||||||||||||
| Floaters: |
||||||||||||||||
| Ultra-Deepwater |
67 | % | 58 | % | 57 | % | 25 | % | ||||||||
| Deepwater |
30 | % | 17 | % | — | — | ||||||||||
| Mid-Water |
28 | % | 12 | % | — | — | ||||||||||
| All Floaters |
45 | % | 34 | % | 25 | % | 11 | % | ||||||||
| Jack-ups |
19 | % | 3 | % | — | — | ||||||||||
| (1) | Represents the twelve-month period beginning January 1, 2016. |
| (2) | As of February 16, 2016, includes approximately 535 currently known, scheduled shipyard days for rig commissioning, contract preparation, surveys and extended maintenance projects, as well as rig mobilization days, for the year 2016. |
Important Factors That May Impact Our Operating Results, Financial Condition or Cash Flows
Operating Income. Our operating income is primarily a function of contract drilling revenue earned less contract drilling expenses incurred or recognized. The two most significant variables affecting our contract drilling revenue are the dayrates earned and utilization rates achieved by our rigs, each of which is a function of rig supply and demand in the marketplace. These factors are not within our control and are difficult to predict. We generally recognize revenue from dayrate drilling contracts as services are performed. Consequently, when a rig is idle, no dayrate is earned and revenue will decrease as a result.
Revenue is also affected by the acquisition or disposal of rigs, rig mobilizations, required surveys and shipyard projects. In connection with certain drilling contracts, we may receive fees for the mobilization of equipment. In addition, some of our drilling contracts require downtime before the start of the contract to prepare the rig to meet customer requirements for which we may or may not be compensated. We earn these fees as services are performed over the initial term of the related drilling contracts. We defer mobilization and contract preparation fees received (on either a lump-sum or dayrate basis), as well as direct and incremental costs associated with the mobilization of equipment and contract preparation activities, and amortize each, on a straight-line basis, over the term of the related drilling contracts. Absent a contract, mobilization costs are recognized currently.
Operating income also fluctuates due to varying levels of contract drilling expenses. Our operating expenses represent all direct and indirect costs associated with the operation and maintenance of our drilling equipment, which generally are not affected by changes in dayrates and short-term reductions in utilization. For instance, if a rig is to be idle for a short period of time, few decreases in operating expenses may actually occur since the rig is typically maintained in a prepared or “warm stacked” state with a full crew. In addition, when a rig is idle, we are responsible for certain operating expenses such as rig fuel and supply boat costs, which are typically costs of the operator when a rig is under contract. However, if a rig is expected to be idle for an extended period of time, we
31
Table of Contents
may reduce the size of a rig’s crew and take steps to “cold stack” the rig, which lowers expenses and partially offsets the impact on operating income. The cost of cold stacking a rig can vary depending on the type of rig. The cost of cold stacking a drillship, for example, is typically substantially higher than the cost of cold stacking a jack-up rig or an older floater rig.
The principal components of our operating costs are, among other things, direct and indirect costs of labor and benefits, repairs and maintenance, freight, regulatory inspections, boat and helicopter rentals and insurance. Labor and repair and maintenance costs represent the most significant components of our operating expenses. In general, our labor costs increase primarily due to higher salary levels, rig staffing requirements and costs associated with labor regulations in the geographic regions in which our rigs operate. In addition, the costs associated with training new and seasoned employees can be significant. Costs to repair and maintain our equipment fluctuate depending upon the type of activity the drilling unit is performing, as well as the age and condition of the equipment and the regions in which our rigs are working.
Regulatory Surveys and Planned Downtime. Our operating income is negatively impacted when we perform certain regulatory inspections, which we refer to as a 5-year survey, or special survey, that are due every five years for each of our rigs. Operating revenue decreases because these special surveys are generally performed during scheduled downtime in a shipyard. Operating expenses increase as a result of these special surveys due to the cost to mobilize the rigs to a shipyard, inspection costs incurred and repair and maintenance costs, which are recognized as incurred. Repair and maintenance activities may result from the special survey or may have been previously planned to take place during this mandatory downtime. The number of rigs undergoing a 5-year survey will vary from year to year, as well as from quarter to quarter.
In addition, operating income may also be negatively impacted by intermediate surveys, which are performed at interim periods between 5-year surveys. Intermediate surveys are generally less extensive in duration and scope than a 5-year survey. Although an intermediate survey may require some downtime for the drilling rig, it normally does not require dry-docking or shipyard time, except for rigs generally older than 15 years that are located in the United Kingdom sector of the North Sea.
During 2016, we expect to spend approximately 535 days for the mobilization of rigs and contract acceptance testing, including days associated with mobilization and acceptance testing for the Ocean GreatWhite (approximately 90 days), which is under construction and expected to be delivered in mid-2016 and rig modifications and acceptance testing for the Ocean BlackRhino, which is scheduled to begin operating under a new contract in January 2017 (approximately 155 days). We expect the Ocean Endeavor to be unavailable through mid-2016 (approximately 135 days) as it demobilizes out of the Black Sea. We can provide no assurance as to the exact timing and/or duration of downtime associated with regulatory inspections, planned rig mobilizations and other shipyard projects. See “– Contract Drilling Backlog.”
In April 2015, the Bureau of Safety and Environmental Enforcement (an agency established by the U.S. Department of the Interior that governs the offshore drilling industry on the Outer Continental Shelf) announced proposed rules that, when enacted, will include more stringent design requirements for well control equipment used in offshore drilling operations. Based on our assessment of the proposed rules, we believe that we may need to incur significant capital costs to comply with the additional design requirements to enable our cold-stacked mid-water semisubmersibles to return to work in U.S. waters.
Physical Damage and Marine Liability Insurance. We are self-insured for physical damage to rigs and equipment caused by named windstorms in the GOM. If a named windstorm in the GOM causes significant damage to our rigs or equipment, it could have a material adverse effect on our financial condition, results of operations and cash flows. Under our insurance policy, we carry physical damage insurance for certain losses other than those caused by named windstorms in the GOM for which our deductible for physical damage is $25.0 million per occurrence. We do not typically retain loss-of-hire insurance policies to cover our rigs.
In addition, under our current insurance policy, we carry marine liability insurance covering certain legal liabilities, including coverage for certain personal injury claims, and generally covering liabilities arising out of
32
Table of Contents
or relating to pollution and/or environmental risk. We believe that the policy limit for our marine liability insurance is within the range that is customary for companies of our size in the offshore drilling industry and is appropriate for our business. Our deductibles for marine liability coverage, including for personal injury claims, are $25.0 million for the first occurrence and vary in amounts ranging between $5.0 million and, if aggregate claims exceed certain thresholds, up to $100.0 million for each subsequent occurrence, depending on the nature, severity and frequency of claims that might arise during the policy year.
Construction and Capital Upgrade Projects. We capitalize interest cost for the construction and upgrade of qualifying assets in accordance with accounting principles generally accepted in the U.S., or GAAP. The period of interest capitalization covers the duration of the activities required to make the asset ready for its intended use, and the capitalization period ends when the asset is substantially complete and ready for its intended use, which is expected to continue after delivery of the rigs from the shipyard and until the user acceptance phase of each project is completed. For the year ended December 31, 2015, we capitalized interest of $16.3 million on qualifying expenditures related to the construction of the Ocean GreatWhite and the Ocean BlackLion, until it was placed in service in June 2015. We will continue capitalizing interest on qualifying expenditures during 2016 for the Ocean GreatWhite, which is expected to be completed in mid-2016.
Impact of Changes in Tax Laws or Their Interpretation. We operate through our various subsidiaries in a number of countries throughout the world. As a result, we are subject to highly complex tax laws, treaties and regulations in the jurisdictions in which we operate, which may change and are subject to interpretation. Changes in laws, treaties and regulations and the interpretation of such laws, treaties and regulations may put us at risk for future tax assessments and liabilities which could be substantial and could have a material adverse effect on our financial condition, results of operations and cash flows.
Critical Accounting Estimates
Our significant accounting policies are included in Note 1 “General Information” to our Consolidated Financial Statements in Item 8 of this report. Judgments, assumptions and estimates by our management are inherent in the preparation of our financial statements and the application of our significant accounting policies. We believe that our most critical accounting estimates are as follows:
Property, Plant and Equipment. We carry our drilling and other property and equipment at cost, less accumulated depreciation. Maintenance and routine repairs are charged to income currently while replacements and betterments that upgrade or increase the functionality of our existing equipment and that significantly extend the useful life of an existing asset, are capitalized. Significant judgments, assumptions and estimates may be required in determining whether or not such replacements and betterments meet the criteria for capitalization and in determining useful lives and salvage values of such assets. Changes in these judgments, assumptions and estimates could produce results that differ from those reported. Historically, the amount of capital additions requiring significant judgments, assumptions or estimates has not been significant. During the years ended December 31, 2015 and 2014, we capitalized $262.4 million and $546.0 million, respectively, in replacements and betterments of our drilling fleet.
We evaluate our property and equipment for impairment whenever changes in circumstances indicate that the carrying amount of an asset may not be recoverable (such as, but not limited to, cold stacking a rig, the expectation of cold stacking a rig in the near term, contracted backlog of less than one year for a rig, a decision to retire or scrap a rig, or excess spending over budget on a newbuild, construction project or major rig upgrade). We utilize an undiscounted probability-weighted cash flow analysis in testing an asset for potential impairment. Our assumptions and estimates underlying this analysis include the following:
| • | dayrate by rig; |
| • | utilization rate by rig if active, warm stacked or cold stacked (expressed as the actual percentage of time per year that the rig would be used at certain dayrates); |
33
Table of Contents
| • | the per day operating cost for each rig if active, warm stacked or cold stacked; |
| • | the estimated annual cost for rig replacements and/or enhancement programs; |
| • | the estimated maintenance, inspection or other costs associated with a rig returning to work; |
| • | salvage value for each rig; and |
| • | estimated proceeds that may be received on disposition of each rig. |
Based on these assumptions, we develop a matrix for each rig under evaluation using multiple utilization/dayrate scenarios, to each of which we have assigned a probability of occurrence. We arrive at a projected probability-weighted cash flow for each rig based on the respective matrix and compare such amount to the carrying value of the asset to assess recoverability.
The underlying assumptions and assigned probabilities of occurrence for utilization and dayrate scenarios are developed using a methodology that examines historical data for each rig, which considers the rig’s age, rated water depth and other attributes and then assesses its future marketability in light of the current and projected market environment at the time of assessment. Other assumptions, such as operating, maintenance and inspection costs, are estimated using historical data adjusted for known developments and future events that are anticipated by management at the time of the assessment.
Management’s assumptions are necessarily subjective and are an inherent part of our asset impairment evaluation, and the use of different assumptions could produce results that differ from those reported. Our methodology generally involves the use of significant unobservable inputs, representative of a Level 3 fair value measurement, which may include assumptions related to future dayrate revenue, costs and rig utilization, quotes from rig brokers, the long-term future performance of our rigs and future market conditions. Management’s assumptions involve uncertainties about future demand for our services, dayrates, expenses and other future events, and management’s expectations may not be indicative of future outcomes. Significant unanticipated changes to these assumptions could materially alter our analysis in testing an asset for potential impairment. For example, changes in market conditions that exist at the measurement date or that are projected by management could affect our key assumptions. Other events or circumstances that could affect our assumptions may include, but are not limited to, a further sustained decline in oil and gas prices, cancelations of our drilling contracts or contracts of our competitors, contract modifications, costs to comply with new governmental regulations, growth in the global oversupply of oil and geopolitical events, such as lifting sanctions on oil-producing nations. Should actual market conditions in the future vary significantly from market conditions used in our projections, our assessment of impairment would likely be different.
During 2015, in response to pending regulatory requirements in the GOM, as well as the continued deterioration of the market fundamentals in the oil and gas industry, including the dramatic decline in oil prices, significant cutbacks in customer capital spending plans and contract cancelations by customers, we evaluated 25 of our drilling rigs with indications that their carrying amounts may not be recoverable and recorded an aggregate impairment loss of $860.4 million related to 17 drilling rigs, consisting of two ultra-deepwater, one deepwater and nine mid-water floaters and five jack-up rigs. In the third quarter of 2014, we recognized an impairment loss of $109.5 million in connection with our management’s decision to retire and scrap six mid-water semisubmersible rigs. See “– Results of Operations – Years Ended December 31, 2015, 2014 and 2013 –Overview – 2015 Compared to 2014 – Impairment of Assets,” “– Results of Operations – Years Ended December 31, 2015, 2014 and 2013 – Overview – 2014 Compared to 2013 – Impairment of Assets” and Note 2 “Asset Impairments” to our Consolidated Financial Statements in Item 8 of this report.
Personal Injury Claims. Our deductibles for liability coverage for personal injury claims, which primarily result from Jones Act liability in the Gulf of Mexico, are currently $25.0 million for the first occurrence, with no aggregate deductible, and vary in amounts ranging between $5.0 million and, if aggregate claims exceed certain thresholds, up to $100.0 million for each subsequent occurrence, depending on the nature, severity and frequency
34
Table of Contents
of claims which might arise during the policy year. The Jones Act is a federal law that permits seamen to seek compensation for certain injuries during the course of their employment on a vessel and governs the liability of vessel operators and marine employers for the work-related injury or death of an employee. We engage outside consultants to assist us in estimating our aggregate liability for personal injury claims based on our historical losses and utilizing various actuarial models.
The models used in estimating our aggregate reserve for personal injury claims include actuarial assumptions such as:
| • | claim emergence, or the delay between occurrence and recording of claims; |
| • | settlement patterns, or the rates at which claims are closed; |
| • | development patterns, or the rate at which known cases develop to their ultimate level; |
| • | average, potential frequency and severity of claims; and |
| • | effect of re-opened claims. |
The eventual settlement or adjudication of these claims could differ materially from our estimated amounts due to uncertainties such as:
| • | the severity of personal injuries claimed; |
| • | significant changes in the volume of personal injury claims; |
| • | the unpredictability of legal jurisdictions where the claims will ultimately be litigated; |
| • | inconsistent court decisions; and |
| • | the risks and lack of predictability inherent in personal injury litigation. |
Income Taxes. We account for income taxes in accordance with accounting standards that require the recognition of the amount of taxes payable or refundable for the current year and an asset and liability approach in recognizing the amount of deferred tax liabilities and assets for the future tax consequences of events that have been currently recognized in our financial statements or tax returns. In each of our tax jurisdictions we recognize a current tax liability or asset for the estimated taxes payable or refundable on tax returns for the current year and a deferred tax asset or liability for the estimated future tax effects attributable to temporary differences and carryforwards. Deferred tax assets are reduced by a valuation allowance, if necessary, which is determined by the amount of any tax benefits that, based on available evidence, are not expected to be realized under a “more likely than not” approach. We do not establish deferred tax liabilities for certain of our foreign earnings that we intend to indefinitely reinvest to finance foreign activities. However, if these earnings become subject to U.S. federal tax, any required provision could have a material adverse impact on our financial results. We make judgments regarding future events and related estimates especially as they pertain to the forecasting of our effective tax rate, the potential realization of deferred tax assets such as utilization of foreign tax credits, and exposure to the disallowance of items deducted on tax returns upon audit.
Certain of our international rigs are owned and operated, directly or indirectly, by Diamond Foreign Asset Company, or DFAC, a Cayman Islands subsidiary that we own. It is our intention to indefinitely reinvest future earnings of DFAC and its foreign subsidiaries to finance foreign activities. Accordingly, we have not made a provision for U.S. income taxes on approximately $2.0 billion of undistributed foreign earnings and profits. Although we do not intend to repatriate the earnings of DFAC and have not provided U.S. income taxes for such earnings, except to the extent that such earnings were immediately subject to U.S. income taxes, these earnings could become subject to U.S. income tax if remitted, or if deemed remitted as a dividend; however, it is not practicable to estimate this potential liability.
In several of the international locations in which we operate, certain of our wholly-owned subsidiaries enter into agreements with other of our wholly-owned subsidiaries to provide specialized services and equipment in
35
Table of Contents
support of our foreign operations. We apply a transfer pricing methodology to determine the amount to be charged for providing the services and equipment, and utilize outside consultants to assist us in the development of such transfer pricing methodologies. In most cases, there are alternative transfer pricing methodologies that could be applied to these transactions and, if applied, could result in different chargeable amounts.
Results of Operations
Although we perform contract drilling services with different types of drilling rigs and in many geographic locations, there is a similarity of economic characteristics due to the nature of the revenue earning process as it relates to the offshore drilling industry, over the operating lives of our drilling rigs. We believe that the combination of our drilling rigs into one reportable segment is the appropriate aggregation in accordance with applicable accounting standards on segment reporting. However, for purposes of this discussion and analysis of our results of operations, we provide greater detail with respect to the types of rigs in our fleet to enhance the reader’s understanding of our financial condition, changes in financial condition and results of operations.
Key performance indicators by equipment type are listed below.
| Year Ended December 31, | ||||||||||||
| 2015 | 2014 | 2013 | ||||||||||
| REVENUE EARNING DAYS (1) |
||||||||||||
| Floaters: |
||||||||||||
| Ultra-Deepwater |
2,690 | 2,151 | 2,392 | |||||||||
| Deepwater |
1,339 | 1,206 | 1,530 | |||||||||
| Mid-Water |
1,433 | 3,969 | 4,186 | |||||||||
| Jack-ups |
909 | 1,845 | 1,949 | |||||||||
| UTILIZATION (2) |
||||||||||||
| Floaters: |
||||||||||||
| Ultra-Deepwater |
64 | % | 65 | % | 82 | % | ||||||
| Deepwater (3) |
52 | % | 55 | % | 84 | % | ||||||
| Mid-Water |
36 | % | 61 | % | 64 | % | ||||||
| Jack-ups |
42 | % | 78 | % | 76 | % | ||||||
| AVERAGE DAILY REVENUE (4) |
||||||||||||
| Floaters: |
||||||||||||
| Ultra-Deepwater |
$ | 497,700 | $ | 459,100 | $ | 357,300 | ||||||
| Deepwater |
409,800 | 409,800 | 403,300 | |||||||||
| Mid-Water |
270,500 | 271,300 | 286,200 | |||||||||
| Jack-ups |
93,400 | 96,700 | 89,300 | |||||||||
| (1) | A revenue earning day is defined as a 24-hour period during which a rig earns a dayrate after commencement of operations and excludes mobilization, demobilization and contract preparation days. |
| (2) | Utilization is calculated as the ratio of total revenue-earning days divided by the total calendar days in the period for all specified rigs in our fleet (including cold-stacked rigs, but excluding rigs under construction). As of December 31, 2015, our cold stacked rigs consisted of one ultra-deepwater, two deepwater and four mid-water semisubmersible rigs. In addition, we had five cold-stacked jack-up rigs which are being marketed for sale. As of December 31, 2014, six of our mid-water semisubmersible drilling rigs were cold stacked, all of which were sold for scrap in 2015. |
| (3) | Utilization for our deepwater floaters in 2015 included 365 total calendar days for the Ocean Apex, which was placed in service in December 2014. |
| (4) | Average daily revenue is defined as total contract drilling revenue for all of the specified rigs in our fleet per revenue earning day. |
36
Table of Contents
Comparative data relating to our revenues and operating expenses by equipment type are listed below.
Years Ended December 31, 2015, 2014 and 2013
| Year Ended December 31, | ||||||||||||
| 2015 | 2014 | 2013 | ||||||||||
| (In thousands) | ||||||||||||
| CONTRACT DRILLING REVENUE |
||||||||||||
| Floaters: |
||||||||||||
| Ultra-Deepwater |
$ | 1,339,059 | $ | 987,565 | $ | 854,515 | ||||||
| Deepwater |
548,667 | 494,247 | 617,080 | |||||||||
| Mid-Water |
387,549 | 1,076,842 | 1,197,934 | |||||||||
|
|
|
|
|
|
|
|||||||
| Total Floaters |
2,275,275 | 2,558,654 | 2,669,529 | |||||||||
| Jack-ups |
84,909 | 178,472 | 174,055 | |||||||||
|
|
|
|
|
|
|
|||||||
| Total Contract Drilling Revenue |
$ | 2,360,184 | $ | 2,737,126 | $ | 2,843,584 | ||||||
|
|
|
|
|
|
|
|||||||
| REVENUES RELATED TO REIMBURSABLE EXPENSES |
$ | 59,209 | $ | 77,545 | $ | 76,837 | ||||||
| CONTRACT DRILLING EXPENSE |
||||||||||||
| Floaters: |
||||||||||||
| Ultra-Deepwater |
$ | 620,122 | $ | 536,615 | $ | 538,765 | ||||||
| Deepwater |
277,779 | 292,050 | 267,820 | |||||||||
| Mid-Water |
230,606 | 535,080 | 604,492 | |||||||||
|
|
|
|
|
|
|
|||||||
| Total Floaters |
1,128,507 | 1,363,745 | 1,411,077 | |||||||||
| Jack-ups |
65,699 | 111,204 | 115,078 | |||||||||
| Other |
33,658 | 48,674 | 46,370 | |||||||||
|
|
|
|
|
|
|
|||||||
| Total Contract Drilling Expense |
$ | 1,227,864 | $ | 1,523,623 | $ | 1,572,525 | ||||||
|
|
|
|
|
|
|
|||||||
| REIMBURSABLE EXPENSES |
$ | 58,050 | $ | 76,091 | $ | 74,967 | ||||||
| OPERATING INCOME |
||||||||||||
| Floaters: |
||||||||||||
| Ultra-Deepwater |
$ | 718,937 | $ | 450,950 | $ | 315,750 | ||||||
| Deepwater |
270,888 | 202,197 | 349,260 | |||||||||
| Mid-Water |
156,943 | 541,762 | 593,442 | |||||||||
|
|
|
|
|
|
|
|||||||
| Total Floaters |
1,146,768 | 1,194,909 | 1,258,452 | |||||||||
| Jack-ups |
19,210 | 67,268 | 58,977 | |||||||||
| Other |
(33,658 | ) | (48,674 | ) | (46,370 | ) | ||||||
| Reimbursable expenses, net |
1,159 | 1,454 | 1,870 | |||||||||
| Depreciation |
(493,162 | ) | (456,483 | ) | (388,092 | ) | ||||||
| General and administrative expense |
(66,462 | ) | (81,832 | ) | (64,788 | ) | ||||||
| Bad debt expense |
— | — | (22,513 | ) | ||||||||
| Impairment of assets |
(860,441 | ) | (109,462 | ) | — | |||||||
| Restructuring and separation costs |
(9,778 | ) | — | — | ||||||||
| Gain on disposition of assets |
2,290 | 5,382 | 4,070 | |||||||||
|
|
|
|
|
|
|
|||||||
| Total Operating (Loss) Income |
$ | (294,074 | ) | $ | 572,562 | $ | 801,606 | |||||
|
|
|
|
|
|
|
|||||||
| Other income (expense): |
||||||||||||
| Interest income |
3,322 | 801 | 701 | |||||||||
| Interest expense |
(93,934 | ) | (62,053 | ) | (24,843 | ) | ||||||
| Foreign currency transaction gain (loss) |
2,465 | 3,199 | (4,915 | ) | ||||||||
| Other, net |
873 | 682 | 1,691 | |||||||||
|
|
|
|
|
|
|
|||||||
| (Loss) income before income tax benefit (expense) |
(381,348 | ) | 515,191 | 774,240 | ||||||||
| Income tax benefit (expense) |
107,063 | (128,180 | ) | (225,554 | ) | |||||||
|
|
|
|
|
|
|
|||||||
| NET (LOSS) INCOME |
$ | (274,285 | ) | $ | 387,011 | $ | 548,686 | |||||
|
|
|
|
|
|
|
|||||||
37
Table of Contents
Overview
2015 Compared to 2014
Operating (Loss) Income. We incurred an operating loss of $294.1 million in 2015 compared to operating income of $572.6 million in 2014. Our operating results for 2015 reflected an aggregate impairment loss of $860.4 million, $9.8 million in restructuring and severance costs, and a $96.2 million net reduction in rig operating results for our combined floater fleet and jack-up rigs, compared to 2014. Depreciation expense increased $36.7 million in 2015, compared to 2014, due to a higher depreciable asset base in 2015, including the Ocean Apex and two newbuild drillships, which were placed in service in December 2014, partially offset by the absence of depreciation for certain of our rigs that were impaired or sold during late 2014 and in 2015.
Total contract drilling revenue declined $376.9 million, or 14%, during 2015 compared to 2014, primarily due to a $782.9 million decrease in revenue earned by our combined mid-water and jack-up fleets, partially offset by an aggregate $405.9 million increase in revenue earned by our ultra-deepwater and deepwater floaters. Our results for 2015 reflected an aggregate 2,800 fewer revenue earning days, compared to 2014, primarily, due to the cold stacking of additional rigs, rig sales and incremental downtime between contracts, partially offset by incremental revenue generating days for our newly constructed and upgraded or enhanced rigs.
Total contract drilling expense for 2015 decreased $295.8 million, or 19%, compared to the prior year, primarily due to lower rig utilization, combined with our efforts to control costs. Contract drilling expense for 2015, compared to 2014, reflected lower costs for labor and personnel ($165.8 million), repairs and maintenance ($70.1 million), inspections ($17.2 million), freight ($17.9 million), rig insurance ($9.7 million) and a net decrease in other rig operating costs, including costs associated with our international shorebases, overhead costs and revenue-based agency fees ($72.6 million), partially offset by higher rig mobilization expense ($57.6 million).
Impairment of Assets. During the third quarter of 2014, our management adopted a plan to scrap six of our mid-water semisubmersible rigs, all of which were sold by the end of 2015. As a result of this decision, we recognized an impairment loss of $109.5 million during 2014 to write down the aggregate net book value of these rigs to their estimated recoverable amounts. During 2015, in response to pending regulatory requirements in the GOM, as well as the continued deterioration of the market fundamentals in the oil and gas industry, we determined that the carrying value of 17 of our rigs, consisting of two ultra-deepwater, one deepwater and nine mid-water floaters and five jack-up rigs were impaired and, therefore, recorded an aggregate impairment loss of $860.4 million for the year ended December 31, 2015. See “– Critical Accounting Estimates – Property, Plant and Equipment” and Note 2 “Asset Impairments” to our Consolidated Financial Statements in Item 8 of this report.
Restructuring and Separation Costs. In response to the continued decline in the offshore drilling market, we have reviewed our cost and organization structure. As a result, our management approved and initiated a reduction in workforce at our onshore bases and corporate facilities. During the year ended December 31, 2015, we recognized $9.8 million in restructuring and employee separation related costs on behalf of separated employees.
Interest Expense, Net of Amounts Capitalized. Interest expense increased $31.9 million during 2015, compared to 2014, primarily as a result of less interest capitalized during 2015 ($44.3 million) due to the completion of five qualifying construction projects in 2014 and 2015. This increase was partially offset by a $12.3 million reduction in interest expense for 2015, primarily due to the repayment of two tranches of our senior notes in September 2014 and July 2015, reduced by additional interest expense on short-term borrowings during 2015.
Income Tax Expense. Our effective tax rate for 2015 was 28.1%, compared to a 24.9% effective tax rate for 2014. The higher effective tax rate in 2015 was due to differences in the mix of our domestic and international
38
Table of Contents
pre-tax earnings and losses, including asset impairments taken during both 2015 and 2014 in various jurisdictions, with differing tax consequences. The 2014 period also included the reversal of $55.4 million of reserves for uncertain tax positions in various foreign jurisdictions which were settled in our favor or for which the statute of limitations had expired, compared to a similar reversal of $9.5 million in 2015.
2014 Compared to 2013
Operating Income. Operating income decreased $229.0 million, or 29%, during 2014, compared to 2013, primarily due to a $106.5 million, or 4%, reduction in contract drilling revenue combined with the negative effects of a $109.5 million impairment loss recognized in the third quarter of 2014, higher depreciation ($68.4 million) and higher general and administrative expenses ($17.0 million). During 2014, we recognized incremental depreciation expense on a higher depreciable asset base, compared to 2013, which included the following newly constructed rigs placed in service during 2014: Ocean Onyx (January 2014), Ocean BlackHawk (February 2014) and Ocean BlackHornet, Ocean BlackRhino and Ocean Apex (December 2014). General and administrative costs for 2014 reflected higher employee compensation and professional fees than those incurred in the prior year, primarily related to compensation of and termination benefits paid to certain of our current and former key executives. These negative effects were partially offset by a $48.9 million reduction in contract drilling expense and the absence of a $22.5 million charge for an uncollectible receivable incurred in 2013.
Contract drilling revenue for our deepwater and mid-water fleets decreased $122.8 million and $121.1 million, respectively, during 2014, compared to 2013, primarily as a result of 324 and 217 fewer revenue earning days, respectively, combined with the effect of a lower average daily revenue earned by our mid-water floater fleet. In contrast, contract drilling revenue earned by our ultra-deepwater floaters and jack-up rigs increased $133.1 million and $4.4 million, respectively, during 2014, compared to 2013, primarily due to higher average daily revenue earned by both our ultra-deepwater and jack-up fleets despite an aggregate 345-day reduction in revenue earning days during 2014.
Total contract drilling expense during 2014 decreased by $48.9 million, or 3%, compared to 2013, primarily due to the cold stacking or scrapping of rigs, contract preparation work and lower repairs and maintenance expenses, partially offset by increased costs associated with the operation of the Ocean BlackHawk and Ocean Onyx beginning in the first quarter of 2014.
Impairment of Assets. During the third quarter of 2014, our management adopted a plan to scrap six of our mid-water semisubmersibles. As a result of this decision, we recognized an impairment loss of $109.5 million to write down the aggregate net book value of these rigs to their estimated recoverable amounts.
Bad Debt Expense. During 2013, based on our assessment of the financial condition of two of our customers, Niko Resources Ltd. and OGX Petróleo e Gás Ltda., and our expectations regarding the probability of collection of amounts due to us from them, we recorded $22.5 million in bad debt expense
Interest Expense. Interest expense increased $37.2 million during 2014, compared to 2013, primarily due to incremental interest expense of $34.4 million, primarily related to the issuance of $1.0 billion in senior unsecured notes in November 2013 and a $13.6 million decrease in capitalized interest as a result of rig construction projects completed in 2014, partially offset by reduced interest expense related to $250.0 million in senior debt that we repaid in 2014. The increase in interest expense was also partially offset by the reversal of $6.2 million of expense in 2014 associated with changes in uncertain tax positions in the Brazil and Mexico tax jurisdictions, combined with the absence of $5.9 million of interest expense recognized in the prior year associated with uncertain tax positions in the Mexico tax jurisdiction.
Income Tax Expense. Our effective tax rate for 2014 was 24.9%, compared to a 29.1% effective tax rate for 2013. The lower effective tax rate in 2014 was due to differences in the mix of our domestic and international pre-tax earnings and losses, as well as the mix of international tax jurisdictions in which we operated. The lower
39
Table of Contents
effective tax rate in the current period was also due to the reversal of $55.4 million of reserves for uncertain tax positions in various foreign jurisdictions which were settled in our favor or for which the statute of limitations had expired. During 2013, our effective tax rate was negatively impacted by a provision of $56.9 million related to an uncertain tax position in Egypt, partially offset by the recognition of the impact of The American Taxpayer Relief Act of 2012, which reduced 2013 income tax expense by $27.5 million.
Contract Drilling Revenue and Expense by Equipment Type
2015 Compared to 2014
Ultra-Deepwater Floaters. Revenue generated by our ultra-deepwater floaters increased $351.5 million during 2015, compared to 2014, primarily as a result of 539 incremental revenue earning days ($247.6 million), combined with higher average daily revenue earned ($103.9 million). Total revenue earning days increased in 2015, primarily due to incremental revenue earning days for our newbuild drillships (621 additional days), the Ocean Endeavor offshore Romania (149 additional days) and the Ocean Monarch offshore Australia (105 additional days), partially offset by fewer revenue earning days for our other ultra-deepwater floaters (336 fewer days), including the early termination of drilling contracts for the Ocean Baroness and Ocean Clipper. Average daily revenue increased in 2015, compared to 2014, primarily due to revenue associated with the operation of three additional drillships in 2015 and the Ocean Endeavor, including higher amortized mobilization and contract preparation revenue, and a favorable dayrate adjustment for the Ocean Courage.
Contract drilling expense for our ultra-deepwater floaters increased $83.5 million during 2015, compared to 2014, reflecting incremental costs for our newbuild drillships ($153.4 million), partially offset by lower aggregate costs for our other ultra-deepwater floaters ($69.9 million). The decrease in contract drilling expense in 2015 for our other ultra-deepwater floaters reflected lower costs for labor and personnel ($42.6 million), repairs and maintenance ($11.5 million), rig mobilization and inspections ($2.3 million) and other rig operating costs ($13.5 million).
Deepwater Floaters. Revenue generated by our deepwater floaters increased $54.4 million in 2015, compared to 2014, primarily due to 133 incremental revenue earning days ($54.5 million). The increase in revenue earning days during 2015 resulted from incremental operating days for four of our deepwater floaters after prolonged periods of nonproductive time for planned upgrades and surveys, as well as warm-stacking between contracts (501 incremental days), partially offset by fewer revenue earning days due to the cold stacking of the Ocean Star (233 days) and additional non-revenue earning days for rig mobilization and repairs (135 additional days).
Contract drilling expense for our deepwater floaters decreased an aggregate $14.3 million in 2015, compared to 2014, reflecting lower labor and personnel related costs ($10.0 million), repairs and maintenance ($17.0 million) and other rig operating costs ($7.5 million). These reductions in contract drilling expense in 2015, compared to 2014, were partially offset by higher amortized rig mobilization expense ($20.2 million), primarily related to drilling rigs that returned to service in 2015.
Mid-Water Floaters. Revenue generated by our mid-water floaters decreased $689.3 million in 2015, compared to 2014, primarily due to 2,536 fewer revenue earning days ($688.1 million) combined with lower average daily revenue earned ($1.2 million). The reduction in revenue earning days during 2015 resulted from the cold stacking or retirement of twelve mid-water rigs (2,638 fewer days) and the idling of the Ocean Guardian and Ocean Quest, between contracts (288 fewer days), partially offset by incremental revenue earning days for the upgraded Ocean Patriot operating in the North Sea (296 additional days) and the Ocean Ambassador, which is expected to complete its contract offshore Mexico in the first quarter of 2016 (94 additional days).
Contract drilling expense for our mid-water floaters decreased $304.5 million in 2015, compared to 2015, primarily due to reduced operating costs for our idled, cold-stacked and retired mid-water rigs ($344.1 million), partially offset by incremental operating costs for the Ocean Patriot ($36.9 million).
40
Table of Contents
Jack-ups. Contract drilling revenue and expense for our jack-up fleet decreased $93.6 million and $45.5 million, respectively, during 2015, compared to 2014, primarily due to reduced utilization for five rigs that were under contract in 2014, but were cold stacked and marketed for sale at the end of 2015. Contract drilling revenue for 2015 was also negatively impacted by a negotiated dayrate reduction for our remaining actively marketed jack-up rig, the Ocean Scepter.
2014 Compared to 2013
Ultra-Deepwater Floaters. Revenue generated by our ultra-deepwater floaters increased $133.1 million during 2014, compared to 2013, primarily due to higher average daily revenue earned ($219.0 million), partially offset by the unfavorable effect of 241 fewer revenue earning days ($85.9 million). Average daily revenue increased primarily due to several of our ultra-deepwater floaters earning higher dayrates during 2014, compared to those earned in 2013, as well as incremental amortization of $50.6 million in mobilization and contract preparation fees, including amounts recognized in connection with contracts for the Ocean Monarch in Indonesia ($11.3 million), the Ocean Endeavor in Romania ($22.4 million) and the Ocean Clipper in Colombia ($8.8 million). Revenue earning days decreased during 2014, compared to 2013, primarily due to incremental downtime for planned inspections and shipyard projects (366 additional days), including the Ocean Confidence life-extension project, non-revenue earning days between contracts (241 additional days) and rig mobilizations (95 additional days), partially offset by a reduction in unscheduled downtime for repairs (273 fewer days) and 189 revenue earning days for the Ocean BlackHawk, which was placed in service in 2014.
Contract drilling expense for our ultra-deepwater fleet decreased $2.1 million in 2014, compared to 2013, as incremental operating costs for the Ocean BlackHawk ($44.8 million) were mostly offset by lower operating costs for the Ocean Confidence ($48.3 million) as a result of the rig’s life-extension project, which began in the second quarter of 2014.
Deepwater Floaters. Revenue generated by our deepwater floaters decreased $122.8 million during 2014 compared to 2013, primarily due to 324 fewer revenue earning days ($130.6 million), partially offset by higher average daily revenue earned ($7.8 million), which reflected an increase in amortized mobilization and contract preparation revenue associated with the Ocean America’s Australia contract. Revenue earning days decreased primarily due to unplanned downtime attributable to the warm stacking of rigs between contracts (533 additional days) and incremental downtime for planned surveys and shipyard projects (85 additional days) and rig mobilizations (46 additional days), partially offset by 333 incremental revenue earning days for the Ocean Onyx during 2014.
Contract drilling expense incurred by our deepwater floaters increased $24.2 million during 2014, compared to 2013, primarily due to incremental operating costs for the Ocean Onyx ($31.5 million), costs associated with a five-year survey for the Ocean Alliance ($18.2 million) and the mobilization of the Ocean Star to the GOM, where it is currently cold stacked ($8.8 million). The increase in contract drilling expense in 2014 was partially offset by a reduction in costs for international shorebase locations ($9.7 million), labor and personnel ($6.0 million), repairs and maintenance ($9.2 million), inspections ($4.0 million), agency fees ($1.8 million), and other rig-related costs ($3.5 million), primarily as a result of lower rig utilization compared to 2013.
Mid-Water Floaters. Revenue generated by our mid-water floaters decreased $121.1 million during 2014, compared to 2013, primarily as a result of 217 fewer revenue earning days ($62.2 million) and lower average daily revenue earned ($58.9 million). The decline in revenue earning days for 2014 reflected a 652-day increase in unplanned downtime, primarily due to the cold stacking of rigs, unpaid equipment repairs and downtime between contracts, partially offset by a 435-day reduction in planned downtime for shipyard projects and regulatory inspections. Average daily revenue earned during 2014 decreased, compared to 2013, primarily due to lower amortized mobilization and contract preparation revenue ($35.9 million) and a significantly lower dayrate earned by the Ocean Quest operating in Vietnam, partially offset by higher dayrates earned by our rigs operating in the North Sea during 2014.
41
Table of Contents
Contract drilling expense for our mid-water fleet decreased $69.4 million during 2014, compared to 2013, primarily due to reduced costs for cold stacked rigs and retired rigs ($46.3 million) and the Ocean Patriot, which was out of service until the fourth quarter of 2014 for an enhancement project and contract preparation activities ($9.6 million). In addition, contract drilling expense incurred by our actively-marketed mid-water fleet in 2014, compared to 2013, reflected lower aggregate costs for shipyard projects and regulatory inspections ($24.4 million) and mobilization of rigs ($14.5 million), partially offset by higher labor and personnel costs ($23.4 million).
Jack-ups. Contract drilling revenue for our jack-up fleet increased $4.4 million during 2014, compared to 2013, primarily due to an increase in average daily revenue earned ($13.7 million), as a result of higher dayrates earned by several of our jack-up rigs during 2014, partially offset by 104 fewer revenue earning days compared to 2013 ($9.3 million). Contract drilling expense decreased $3.9 million in 2014, compared to 2013, primarily due to lower costs associated the mobilization of rigs ($6.6 million), partially offset by higher labor and personnel-related costs ($3.4 million).
Liquidity and Capital Resources
We have historically relied principally on our cash flows from operations and cash reserves to meet liquidity needs and fund our cash requirements. However, in 2015, we also utilized short-term borrowings under our $1.5 billion syndicated revolving credit agreement, or Credit Agreement, and issued commercial paper under our commercial paper program to meet our short-term liquidity needs. At February 16, 2016, we had $305.0 million in Eurodollar loans outstanding under the Credit Agreement[, which will mature on February 29, 2016]. See “– Credit Agreement, Commercial Paper Program and Senior Notes.”
Based on our cash available for current operations and contractual backlog of $5.2 billion, as of February 8, 2016, of which $1.6 billion is expected to be realized in 2016, we believe future capital spending, including the final installment due on the Ocean GreatWhite and debt service requirements, will be funded from our cash and cash equivalents, future operating cash flows and borrowings under our Credit Agreement and/or the issuance of commercial paper. See “– Cash Flow and Capital Expenditures – Contractual Cash Obligations – Rig Construction” and “Risk Factors – We can provide no assurance that our drilling contracts will not be terminated early or that our current backlog of contract drilling revenue will be ultimately realized.”
Certain of our international rigs are owned and operated, directly or indirectly, by Diamond Foreign Asset Company, or DFAC, and, as a result of our intention to indefinitely reinvest the earnings of DFAC and its foreign subsidiaries to finance our foreign activities, we do not expect such earnings to be available for distribution to our stockholders or to finance our domestic activities. See “– Market Overview – Critical Accounting Estimates – Income Taxes.” To the extent available, we expect to utilize the operating cash flows generated by and cash reserves of DFAC and the operating cash flows available to and cash reserves of Diamond Offshore Drilling, Inc., or DODI, to meet each entity’s respective working capital requirements and capital commitments.
At December 31, 2015, 2014 and 2013, we had cash available for current operations, including cash reserves of DFAC, as follows:
| December 31, | ||||||||||||
| 2015 | 2014 | 2013 | ||||||||||
| (In thousands) | ||||||||||||
| Cash and equivalents |
$ | 119,028 | $ | 233,623 | $ | 347,011 | ||||||
| Marketable securities |
11,518 | 16,033 | 1,750,053 | |||||||||
|
|
|
|
|
|
|
|||||||
| Total cash available for current operations |
$ | 130,546 | $ | 249,656 | $ | 2,097,064 | ||||||
|
|
|
|
|
|
|
|||||||
A substantial portion of our cash flows has been invested in the enhancement of our drilling fleet, including $3.8 billion since 2013 for the construction of five newbuild rigs, the major upgrade of two semisubmersible rigs
42
Table of Contents
and other capital enhancement projects. We determine the amount of cash required to meet our capital commitments by evaluating our rig construction obligations, the need to upgrade rigs to meet specific customer requirements and our ongoing rig equipment enhancement/replacement programs. We also make periodic assessments of our capital spending programs based on current and expected industry conditions and make adjustments thereto if required. See “– Cash Flow and Capital Expenditures – Contractual Cash Obligations – Rig Construction.” We pay dividends at the discretion of our Board of Directors, or Board. During the three-year period ended December 31, 2015, we paid regular and special cash dividends totaling $206.9 million and $829.9 million, respectively. Our Board has adopted a policy of considering paying cash dividends, in amounts to be determined, on a quarterly basis. Any determination to declare a dividend, as well as the amount of any dividend that may be declared, will be based on the Board’s consideration of our financial position, earnings, earnings outlook, capital spending plans, outlook on current and future market conditions and business needs and other factors that our Board of Directors considers relevant at that time. Our dividend policy may change from time to time, and there can be no assurance that we will continue to declare any cash dividends at all or in any particular amounts.
On February 8, 2016, we announced that we were discontinuing our quarterly regular cash dividend. See “Risk Factors – Although we have paid cash dividends in the past, we may not pay regular or special cash dividends in the future and we can give no assurance as to the amount or timing of the payment of any future regular or special cash dividends” in Item 1A of this report, which is incorporated herein by reference.
Depending on market conditions, we may, from time to time, purchase shares of our common stock in the open market or otherwise. During 2014, we repurchased 1,895,561 shares of our outstanding common stock at a cost of $87.8 million. In addition, Loews has informed us that, depending on market and other conditions, it may, from time to time, purchase shares of our common stock in the open market or otherwise. During the years ended December 31, 2015, 2014 and 2013, Loews purchased 1,134,827, 1,879,600 and 0, shares of our common stock, respectively.
During the three-year period ended December 31, 2015, our primary source of cash was an aggregate $2.8 billion generated from operating activities, $1.1 billion net proceeds from the sale or maturity of marketable securities in 2014 and 2013, net of purchases, $987.8 million net proceeds from the issuance of senior notes in 2013, $286.6 million net proceeds/repayments from the issuance of commercial paper in 2015 and an aggregate $25.7 million from the sale of 12 drilling rigs during 2015 and 2014. Cash usage during the same period was primarily for capital expenditures ($3.8 billion), payment of dividends and anti-dilution payments to stock plan participants ($1.0 billion), long-term debt maturities ($250.0 million in each of 2015 and 2014) and the acquisition of treasury stock ($87.8 million) in 2014.
We may, from time to time, issue debt or equity securities, or a combination thereof, to finance capital expenditures, the acquisition of assets and businesses or for general corporate purposes. Our ability to access the capital markets by issuing debt or equity securities will be dependent on our results of operations, our current financial condition, current credit ratings, current market conditions and other factors beyond our control.
43
Table of Contents
Cash Flow and Capital Expenditures
Our cash flow from operations and capital expenditures for each of the years in the three-year period ended December 31, 2015 were as follows:
| Year Ended December 31, | ||||||||||||
| 2015 | 2014 | 2013 | ||||||||||
| (In thousands) | ||||||||||||
| Cash flow from operations |
$ | 736,427 | $ | 992,831 | $ | 1,065,988 | ||||||
| Capital expenditures: |
||||||||||||
| Drillship construction |
$ | 454,093 | $ | 1,318,271 | $ | 130,268 | ||||||
| Major upgrade of deepwater floaters |
34,723 | 168,045 | 396,584 | |||||||||
| Construction of ultra-deepwater floater |
55,805 | 18,223 | 195,578 | |||||||||
| Ocean Patriot enhancement program |
2,669 | 107,181 | 29,948 | |||||||||
| Ocean Confidence service-life-extension project |
72,124 | 134,871 | — | |||||||||
| Rig equipment and replacement program |
211,241 | 286,173 | 205,220 | |||||||||
|
|
|
|
|
|
|
|||||||
| Total capital expenditures |
$ | 830,655 | $ | 2,032,764 | $ | 957,598 | ||||||
|
|
|
|
|
|
|
|||||||
Cash Flow. Cash flow from operations decreased approximately $256.4 million during 2015, compared to 2014, primarily due to lower cash receipts from contract drilling services ($444.8 million), partially offset by a $144.4 million net decrease in cash payments for contract drilling and general and administrative expenses, including personnel-related, maintenance, mobilization and other rig operating costs and lower income taxes paid, net of refunds ($44.0 million). The decline in cash receipts from and cash payments related to contract drilling services both reflect an aggregate decline in our contract drilling operations, as well as our efforts to control costs.
Cash flow from operations decreased approximately $73.2 million during 2014, compared to 2013, primarily due to higher cash payments for contract drilling expenses ($77.0 million) and higher interest paid on our senior notes ($50.8 million) related to interest paid on $1.0 billion in debt issued in November 2013 and an early interest payment for our 4.875% senior notes due July 1, 2015. The increase in cash outflows for 2014 was partially offset by lower income taxes paid, in the U.S. federal jurisdiction, net of refunds, and a slight increase in cash receipts from contract drilling services ($6.5 million).
See “– Results of Operations – Years Ended December 31, 2015, 2014 and 2013.”
Capital Expenditures. As of the date of this report, we expect capital expenditures for 2016 to aggregate approximately $675.0 million, of which we expect to spend approximately $525.0 million to complete construction of the Ocean GreatWhite and an estimated $150.0 million for our ongoing capital maintenance and replacement programs. See “– Contractual Cash Obligations – Rig Construction.” We expect to fund our 2016 capital spending from the operating cash flows generated by and cash reserves of DFAC and the operating cash flows available to and cash reserves of DODI, as well as borrowings under our Credit Agreement or issuance of commercial paper.
Contractual Cash Obligations – Rig Construction. As of the date of this report, we have one rig, the Ocean GreatWhite, under construction in Ulsan, South Korea, for which we are obligated under a construction agreement with Hyundai Heavy Industries Co., Ltd. Construction of the Ocean GreatWhite continues with delivery expected in mid-2016. The estimated total project cost, including shipyard costs, capital spares, commissioning, project management and shipyard supervision, but excluding capitalized interest, is $764.0 million, of which $241.5 million has been incurred as of December 31, 2015. See Note 12 “Commitments and Contingencies” to our Consolidated Financial Statements included in Item 8 of this report for more information about this project.
44
Table of Contents
We had no other purchase obligations for major rig upgrades or any other significant obligations at December 31, 2015, except for those related to our direct rig operations, which arise during the normal course of business.
Credit Agreement, Commercial Paper Program and Senior Notes
Our Credit Agreement provides for a $1.5 billion senior unsecured revolving credit facility for general corporate purposes maturing on October 22, 2020, except for $40 million of commitments that mature on March 17, 2019 and $60 million of commitments that mature on October 22, 2019. As of December 31, 2015, there were no loans or letters of credit outstanding under the Credit Agreement, and we were in compliance with all covenant requirements under the Credit Agreement.
Our Credit Agreement also provides liquidity for our payment obligations in respect of notes issued under our commercial paper program. Under our commercial paper program, we may issue, on a private placement basis, unsecured commercial paper notes up to a maximum aggregate amount outstanding at any time of $1.5 billion,and, unless we change the terms of the program, the aggregate amount of commercial paper notes and total loans and letters of credit outstanding under the Credit Agreement at any time will not exceed $1.5 billion. At December 31, 2015, we had $286.6 million in commercial paper notes outstanding with a weighted average interest rate of 0.86% and a weighted average remaining term of 5.8 days that were repaid in January 2016. As of February 16, 2016, we had no commercial paper notes outstanding.
During February 2016, we borrowed $305.0 million in Eurodollar loans under our Credit Agreement, which bear interest at 1.565% and mature on February 29, 2016. As of February 16, 2016, we had an additional $1.2 billion available under the Credit Agreement.
As of December 31, 2015, we had an aggregate $2.0 billion in long-term, unsecured senior notes outstanding, of which $500.0 million will mature in 2019 and the remainder will mature at various times beginning in 2023.
See Note 10 “Credit Agreement and Senior Notes” to our Consolidated Financial Statements in Item 8 of this report.
Credit Ratings. In January 2016, Moody’s Investor Services announced that it would be reviewing our long-term corporate credit and unsecured debt rating and short-term credit rating for commercial paper, which are currently Baa2 and Prime-2, respectively, for possible downgrade. Our current corporate credit rating is BBB+ and our short-term credit rating is A2 for Standard & Poor’s Ratings Services. Market conditions and other factors, many of which are outside of our control, could cause our credit ratings to be lowered. A downgrade in our credit ratings could adversely impact our cost of issuing additional debt and the amount of additional debt that we could issue, and could restrict our access to our commercial paper program and capital markets and our ability to raise additional debt or rollover existing maturities. As a consequence, we may not be able to issue additional debt in amounts and/or with terms that we consider to be reasonable. One or more of these occurrences could limit our ability to pursue other business opportunities.
Contractual Cash Obligations
The following table sets forth our contractual cash obligations at December 31, 2015.
| Payments Due By Period | ||||||||||||||||||||
| Contractual Obligations (1) | Total | Less than 1 year |
1 – 3 years | 4 – 5 years | After 5 years |
|||||||||||||||
| (In thousands) | ||||||||||||||||||||
| Long-term debt (principal and interest) |
$ | 3,879,563 | $ | 103,063 | $ | 206,125 | $ | 662,063 | $ | 2,908,312 | ||||||||||
| Construction contract |
439,962 | 439,962 | — | — | — | |||||||||||||||
| Operating leases |
4,565 | 2,673 | 1,705 | 103 | 84 | |||||||||||||||
|
|
|
|
|
|
|
|
|
|
|
|||||||||||
| Total obligations |
$ | 4,324,090 | $ | 545,698 | $ | 207,830 | $ | 662,166 | $ | 2,908,396 | ||||||||||
|
|
|
|
|
|
|
|
|
|
|
|||||||||||
45
Table of Contents
| (1) | The above table excludes $49.4 million of unrecognized tax benefits related to uncertain tax positions as of December 31, 2015 and an additional $39.9 million and $2.7 million for potential penalties and interest, respectively, related to such uncertain tax positions. Due to the high degree of uncertainty regarding the timing of future cash outflows associated with the liabilities recognized in these balances, we are unable to make reasonably reliable estimates of the period of cash settlement with the respective taxing authorities. |
Except for the construction contracts discussed above and referred to in the preceding table, we had no other purchase obligations for major rig upgrades or any other significant obligations at December 31, 2015, except for those related to our direct rig operations, which arise during the normal course of business.
In February 2016, we entered into a ten-year agreement with GE Oil & Gas, or GE, to provide services with respect to certain blowout preventer and related well control equipment on our four newbuild drillships. Such services include management of maintenance, certification and reliability with respect to such equipment. In connection with the services agreement with GE, we will sell the equipment to a GE affiliate for an aggregate $210.0 million and will lease back such equipment over separate ten-year operating leases. We do not expect to realize any gain or loss on these sale and leaseback transactions. Future commitments for the full term under the services agreement and leases are estimated to aggregate approximately $650.0 million.
Other Commercial Commitments – Letters of Credit
We were contingently liable as of December 31, 2015 in the amount of $71.6 million under certain performance, supersedeas, bid, tax and customs bonds and letters of credit. Agreements relating to approximately $64.0 million of performance, tax, supersedeas, court and customs bonds can require collateral at any time. As of December 31, 2015, we had not been required to make any collateral deposits with respect to these agreements. The remaining agreements cannot require collateral except in events of default. Banks have issued letters of credit on our behalf securing certain of these bonds. The table below provides a list of these obligations in U.S. dollar equivalents and their time to expiration.
| Total | For the Years Ending December 31, | |||||||||||||||
| 2016 | 2017 | 2018 | ||||||||||||||
| (In thousands) | ||||||||||||||||
| Other Commercial Commitments |
||||||||||||||||
| Performance bonds |
$ | 51,357 | $ | 6,122 | $ | 26,110 | $ | 19,125 | ||||||||
| Supersedeas bond |
9,189 | 9,189 | — | — | ||||||||||||
| Bid bonds |
2,470 | 2,470 | — | — | ||||||||||||
| Tax bond |
5,865 | 5,865 | — | — | ||||||||||||
| Other |
2,669 | 2,345 | — | 324 | ||||||||||||
|
|
|
|
|
|
|
|
|
|||||||||
| Total obligations |
$ | 71,550 | $ | 25,991 | $ | 26,110 | $ | 19,449 | ||||||||
|
|
|
|
|
|
|
|
|
|||||||||
Off-Balance Sheet Arrangements
At December 31, 2015 and 2014, we had no off-balance sheet debt or other off-balance sheet arrangements.
Other
Currency Risk. Some of our subsidiaries conduct a portion of their operations in the local currency of the country where they conduct operations. Currency environments in which we have significant business operations include Brazil, the U.K., Australia and Mexico. We may, if possible, attempt to minimize our currency exchange risk by seeking international contracts payable to us in local currency in amounts equal to our estimated operating costs payable in local currency, with the balance of the contract payable in U.S. dollars. At present, however, only a limited number of our contracts are payable both in U.S. dollars and the local currency.
46
Table of Contents
Historically, to the extent that we have not been able to cover our local currency operating costs with customer payments in the local currency, we have also utilized foreign currency forward exchange, or FOREX, contracts to reduce our currency exchange risk. We currently have no outstanding FOREX contracts.
We record currency transaction gains and losses as “Foreign currency transaction gain (loss)” in our Consolidated Statements of Operations. Gains and losses arising from the settlement of our FOREX contracts that have been designated as cash flow hedges are reported as a component of “Contract drilling, excluding depreciation” expense in our Consolidated Statements of Operations.
Forward-Looking Statements
We or our representatives may, from time to time, either in this report, in periodic press releases or otherwise, make or incorporate by reference certain written or oral statements that are “forward-looking statements” within the meaning of Section 27A of the Securities Act of 1933, as amended, or the Securities Act, and Section 21E of the Securities Exchange Act of 1934, as amended, or the Exchange Act. All statements other than statements of historical fact are, or may be deemed to be, forward-looking statements. Forward-looking statements include, without limitation, any statement that may project, indicate or imply future results, events, performance or achievements, and may contain or be identified by the words “expect,” “intend,” “plan,” “predict,” “anticipate,” “estimate,” “believe,” “should,” “could,” “may,” “might,” “will,” “will be,” “will continue,” “will likely result,” “project,” “forecast,” “budget” and similar expressions. In addition, any statement concerning future financial performance (including, without limitation, future revenues, earnings or growth rates), ongoing business strategies or prospects, and possible actions taken by or against us, which may be provided by management, are also forward-looking statements as so defined. Statements made by us in this report that contain forward-looking statements may include, but are not limited to, information concerning our possible or assumed future results of operations and statements about the following subjects:
| • | market conditions and the effect of such conditions on our future results of operations; |
| • | sources and uses of and requirements for financial resources and sources of liquidity; |
| • | interest rate and foreign exchange risk; |
| • | contractual obligations and future contract negotiations; |
| • | operations outside the United States; |
| • | business strategy; |
| • | growth opportunities; |
| • | competitive position, including without limitation, competitive rigs entering the market; |
| • | expected financial position; |
| • | cash flows and contract backlog; |
| • | declaration and payment of regular or special dividends; |
| • | financing plans; |
| • | market outlook; |
| • | tax planning; |
| • | debt levels and the impact of changes in the credit markets and credit ratings for our debt; |
| • | budgets for capital and other expenditures; |
| • | timing and duration of required regulatory inspections for our drilling rigs; |
| • | timing and cost of completion of rig upgrades, construction projects and other capital projects; |
47
Table of Contents
| • | delivery dates and drilling contracts related to rig conversion or upgrade projects, construction projects, other capital projects or rig acquisitions; |
| • | plans and objectives of management; |
| • | idling drilling rigs or reactivating stacked rigs; |
| • | scrapping retired rigs; |
| • | assets held for sale; |
| • | asset impairments and impairment evaluations; |
| • | effective date and performance of contracts; |
| • | outcomes of legal proceedings; |
| • | purchases of our securities; |
| • | compliance with applicable laws; and |
| • | availability, limits and adequacy of insurance or indemnification. |
These types of statements are based on current expectations about future events and inherently are subject to a variety of assumptions, risks and uncertainties, many of which are beyond our control, that could cause actual results to differ materially from those expected, projected or expressed in forward-looking statements. These risks and uncertainties include, among others, the following:
| • | those described under “Risk Factors” in Item 1A; |
| • | general economic and business conditions; |
| • | worldwide supply and demand for oil and natural gas; |
| • | changes in foreign and domestic oil and gas exploration, development and production activity; |
| • | oil and natural gas price fluctuations and related market expectations; |
| • | the ability of the Organization of Petroleum Exporting Countries, or OPEC, to set and maintain production levels and pricing, and the level of production in non-OPEC countries; |
| • | policies of various governments regarding exploration and development of oil and gas reserves; |
| • | inability to obtain contracts for our rigs that do not have contracts; |
| • | the cancellation of contracts included in our reported contract backlog; |
| • | advances in exploration and development technology; |
| • | the worldwide political and military environment, including, for example, in oil-producing regions and locations where our rigs are operating or where we have rigs under construction; |
| • | casualty losses; |
| • | operating hazards inherent in drilling for oil and gas offshore; |
| • | the risk that future regular and special dividends may not be declared or paid; |
| • | the risk of physical damage to rigs and equipment caused by named windstorms in the U.S. Gulf of Mexico; |
| • | industry fleet capacity; |
| • | market conditions in the offshore contract drilling industry, including, without limitation, dayrates and utilization levels; |
48
Table of Contents
| • | competition; |
| • | changes in foreign, political, social and economic conditions; |
| • | risks of international operations, compliance with foreign laws and taxation policies and seizure, expropriation, nationalization, deprivation, malicious damage or other loss of possession or use of equipment and assets; |
| • | risks of potential contractual liabilities pursuant to our various drilling contracts in effect from time to time; |
| • | customer or supplier bankruptcy, liquidation or other financial difficulties; |
| • | the ability of customers and suppliers to meet their obligations to us and our subsidiaries; |
| • | collection of receivables; |
| • | the risk that a letter of intent may not result in a definitive agreement; |
| • | foreign exchange and currency fluctuations and regulations, and the inability to repatriate income or capital; |
| • | risks of war, military operations, other armed hostilities, terrorist acts and embargoes; |
| • | changes in offshore drilling technology, which could require significant capital expenditures in order to maintain competitiveness; |
| • | regulatory initiatives and compliance with governmental regulations including, without limitation, regulations pertaining to climate change, greenhouse gases, carbon emissions or energy use; |
| • | compliance with and liability under environmental laws and regulations; |
| • | potential changes in accounting policies by the Financial Accounting Standards Board, the Securities and Exchange Commission, or SEC, or regulatory agencies for our industry which may cause us to revise our financial accounting and/or disclosures in the future, and which may change the way analysts measure our business or financial performance; |
| • | development and exploitation of alternative fuels; |
| • | customer preferences; |
| • | effects of litigation, tax audits and contingencies and the impact of compliance with judicial rulings and jury verdicts; |
| • | cost, availability, limits and adequacy of insurance; |
| • | invalidity of assumptions used in the design of our controls and procedures; |
| • | the results of financing efforts; |
| • | adequacy and availability of our sources of liquidity; |
| • | risks resulting from our indebtedness; |
| • | public health threats; |
| • | negative publicity; |
| • | impairments of assets; |
| • | the availability of qualified personnel to operate and service our drilling rigs; and |
| • | various other matters, many of which are beyond our control. |
49
Table of Contents
The risks and uncertainties included here are not exhaustive. Other sections of this report and our other filings with the SEC include additional factors that could adversely affect our business, results of operations and financial performance. Given these risks and uncertainties, investors should not place undue reliance on forward-looking statements. Forward-looking statements included in this report speak only as of the date of this report. We expressly disclaim any obligation or undertaking to release publicly any updates or revisions to any forward-looking statement to reflect any change in our expectations or beliefs with regard to the statement or any change in events, conditions or circumstances on which any forward-looking statement is based. In addition, in certain places in this report, we may refer to reports published by third parties that purport to describe trends or developments in energy production or drilling and exploration activity. We do so for the convenience of our investors and potential investors and in an effort to provide information available in the market intended to lead to a better understanding of the market environment in which we operate. We specifically disclaim any responsibility for the accuracy and completeness of such information and undertake no obligation to update such information.
New Accounting Pronouncements
For a discussion of recent accounting pronouncements, which are not yet effective, and their effect on our financial position, results of operations and cash flows, see Note 1 “General Information – Recent Accounting Pronouncements” to our Consolidated Financial Statements in Item 8 of this report.
50
Table of Contents
| Item 7A. | Quantitative and Qualitative Disclosures About Market Risk. |
The information included in this Item 7A is considered to constitute “forward-looking statements” for purposes of the statutory safe harbor provided in Section 27A of the Securities Act and Section 21E of the Exchange Act. See “Management’s Discussion and Analysis of Financial Condition and Results of Operations –Forward-Looking Statements” in Item 7 of this report.
Our measure of market risk exposure represents an estimate of the change in fair value of our financial instruments. Market risk exposure is presented for each class of financial instrument held by us at December 31, 2015 and 2014, assuming immediate adverse market movements of the magnitude described below. We believe that the various rates of adverse market movements represent a measure of exposure to loss under hypothetically assumed adverse conditions. The estimated market risk exposure represents the hypothetical loss to future earnings and does not represent the maximum possible loss or any expected actual loss, even under adverse conditions, because actual adverse fluctuations would likely differ. In addition, since our investment portfolio is subject to change based on our portfolio management strategy as well as in response to changes in the market, these estimates are not necessarily indicative of the actual results that may occur.
Exposure to market risk is managed and monitored by our senior management. Senior management approves the overall investment strategy that we employ and has responsibility to ensure that the investment positions are consistent with that strategy and the level of risk acceptable to us. We may manage risk by buying or selling instruments or entering into offsetting positions.
Interest Rate Risk
We have exposure to interest rate risk arising from changes in the level or volatility of interest rates. Our investments in marketable securities are primarily in fixed maturity securities. We monitor our sensitivity to interest rate risk by evaluating the change in the value of our financial assets and liabilities due to fluctuations in interest rates. The evaluation is performed by applying an instantaneous change in interest rates by varying magnitudes on a static balance sheet to determine the effect such a change in rates would have on the recorded market value of our investments and the resulting effect on stockholders’ equity. The analysis presents the sensitivity of the market value of our financial instruments to selected changes in market rates and prices which we believe are reasonably possible over a one-year period.
The sensitivity analysis estimates the change in the market value of our interest sensitive assets and liabilities that were held on December 31, 2015 and 2014, due to instantaneous parallel shifts in the yield curve of 100 basis points, with all other variables held constant.
The interest rates on certain types of assets and liabilities may fluctuate in advance of changes in market interest rates, while interest rates on other types may lag behind changes in market rates. Accordingly, the analysis may not be indicative of, is not intended to provide, and does not provide a precise forecast of the effect of changes in market interest rates on our earnings or stockholders’ equity. Further, the computations do not contemplate any actions we could undertake in response to changes in interest rates.
Our long-term debt, as of December 31, 2015 and 2014, is denominated in U.S. dollars. Our existing debt has been issued at fixed rates, and as such, interest expense would not be impacted by interest rate shifts. The impact of a 100-basis point increase in interest rates on fixed rate debt would result in a decrease in market value of $112.7 million and $176.8 million as of December 31, 2015 and 2014, respectively. A 100-basis point decrease would result in an increase in market value of $131.3 million and $210.6 million as of December 31, 2015 and 2014, respectively.
51
Table of Contents
Foreign Exchange Risk
Foreign exchange rate risk arises from the possibility that changes in foreign currency exchange rates will impact the value of financial instruments. It is customary for us to enter into FOREX contracts in the normal course of business. These contracts generally require us to net settle the spread between the contracted foreign currency exchange rate and the spot rate on the contract settlement date, which for most of our contracts is the average spot rate for the contract period. As of December 31, 2015, we had no FOREX contracts outstanding. At December 31, 2014, we have presented the fair value of our outstanding FOREX contracts as a current liability of $(5.4) million in “Accrued liabilities” in our Consolidated Balance Sheets included in Item 8 of this report.
The following table presents our exposure to market risk by category (interest rates and foreign currency exchange rates):
| Fair Value Asset (Liability) |
Market Risk | |||||||||||||||
| December 31, | December 31, | |||||||||||||||
| 2015 | 2014 | 2015 | 2014 | |||||||||||||
| (In thousands) | ||||||||||||||||
| Interest rate: |
||||||||||||||||
| Marketable securities |
$ | 11,500 | (a) | $ | 16,000 | (a) | $ | (300 | )(b) | $ | (600 | )(b) | ||||
| Foreign Exchange: |
||||||||||||||||
| Forward exchange contracts – liability positions |
— | (5,400 | )(c) | — | (12,100 | )(d) | ||||||||||
| (a) | The fair market value of our investment in marketable securities, excluding repurchase agreements, is based on the quoted closing market prices on December 31, 2015 and 2014. |
| (b) | The calculation of estimated market risk exposure is based on assumed adverse changes in the underlying reference price or index of an increase in interest rates of 100 basis points at December 31, 2015 and 2014. |
| (c) | The fair value of our foreign currency forward exchange contracts is based on both quoted market prices and valuations derived from pricing models on December 31, 2014. |
| (d) | The calculation of estimated foreign exchange risk assumes an instantaneous 20% decrease in the foreign currency exchange rates versus the U.S. dollar from their values at December 31, 2014, with all other variables held constant. |
52
Table of Contents
| Item 8. | Financial Statements and Supplementary Data. |
REPORT OF INDEPENDENT REGISTERED PUBLIC ACCOUNTING FIRM
To the Board of Directors and Stockholders of
Diamond Offshore Drilling, Inc. and Subsidiaries
Houston, Texas
We have audited the accompanying consolidated balance sheets of Diamond Offshore Drilling, Inc. and subsidiaries (the “Company”) as of December 31, 2015 and 2014, and the related consolidated statements of income, comprehensive income, stockholders’ equity, and cash flows for each of the three years in the period ended December 31, 2015. These financial statements are the responsibility of the Company’s management. Our responsibility is to express an opinion on the financial statements based on our audits.
We conducted our audits in accordance with the standards of the Public Company Accounting Oversight Board (United States). Those standards require that we plan and perform the audit to obtain reasonable assurance about whether the financial statements are free of material misstatement. An audit includes examining, on a test basis, evidence supporting the amounts and disclosures in the financial statements. An audit also includes assessing the accounting principles used and significant estimates made by management, as well as evaluating the overall financial statement presentation. We believe that our audits provide a reasonable basis for our opinion.
In our opinion, such consolidated financial statements present fairly, in all material respects, the financial position of Diamond Offshore Drilling, Inc. and subsidiaries at December 31, 2015 and 2014, and the results of their operations and their cash flows for each of the three years in the period ended December 31, 2015, in conformity with accounting principles generally accepted in the United States of America.
We have also audited, in accordance with the standards of the Public Company Accounting Oversight Board (United States), the Company’s internal control over financial reporting as of December 31, 2015, based on the criteria established in Internal Control – Integrated Framework (2013) issued by the Committee of Sponsoring Organizations of the Treadway Commission and our report dated February 19, 2016 expressed an unqualified opinion on the Company’s internal control over financial reporting.
/s/ Deloitte & Touche LLP
Houston, Texas
February 19, 2016
53
Table of Contents
REPORT OF INDEPENDENT REGISTERED PUBLIC ACCOUNTING FIRM
To the Board of Directors and Stockholders of Diamond
Offshore Drilling, Inc. and Subsidiaries Houston, Texas
We have audited the internal control over financial reporting of Diamond Offshore Drilling, Inc. and subsidiaries (the “Company”) as of December 31, 2015, based on criteria established in Internal Control – Integrated Framework (2013) issued by the Committee of Sponsoring Organizations of the Treadway Commission. The Company’s management is responsible for maintaining effective internal control over financial reporting and for its assessment of the effectiveness of internal control over financial reporting, included in the accompanying Item 9A of this Form 10-K under the heading “Management’s Annual Report on Internal Control Over Financial Reporting.” Our responsibility is to express an opinion on the Company’s internal control over financial reporting based on our audit.
We conducted our audit in accordance with the standards of the Public Company Accounting Oversight Board (United States). Those standards require that we plan and perform the audit to obtain reasonable assurance about whether effective internal control over financial reporting was maintained in all material respects. Our audit included obtaining an understanding of internal control over financial reporting, assessing the risk that a material weakness exists, testing and evaluating the design and operating effectiveness of internal control based on the assessed risk, and performing such other procedures as we considered necessary in the circumstances. We believe that our audit provides a reasonable basis for our opinion.
A company’s internal control over financial reporting is a process designed by, or under the supervision of, the company’s principal executive and principal financial officers, or persons performing similar functions, and effected by the company’s board of directors, management, and other personnel to provide reasonable assurance regarding the reliability of financial reporting and the preparation of financial statements for external purposes in accordance with generally accepted accounting principles. A company’s internal control over financial reporting includes those policies and procedures that (1) pertain to the maintenance of records that, in reasonable detail, accurately and fairly reflect the transactions and dispositions of the assets of the company; (2) provide reasonable assurance that transactions are recorded as necessary to permit preparation of financial statements in accordance with generally accepted accounting principles, and that receipts and expenditures of the company are being made only in accordance with authorizations of management and directors of the company; and (3) provide reasonable assurance regarding prevention or timely detection of unauthorized acquisition, use, or disposition of the company’s assets that could have a material effect on the financial statements.
Because of the inherent limitations of internal control over financial reporting, including the possibility of collusion or improper management override of controls, material misstatements due to error or fraud may not be prevented or detected on a timely basis. Also, projections of any evaluation of the effectiveness of the internal control over financial reporting to future periods are subject to the risk that the controls may become inadequate because of changes in conditions, or that the degree of compliance with the policies or procedures may deteriorate.
In our opinion, the Company maintained, in all material respects, effective internal control over financial reporting as of December 31, 2015, based on the criteria established in Internal Control – Integrated Framework (2013) issued by the Committee of Sponsoring Organizations of the Treadway Commission.
We have also audited, in accordance with the standards of the Public Company Accounting Oversight Board (United States), the consolidated financial statements as of and for the year ended December 31, 2015 of the Company and our report dated February 19, 2016 expressed an unqualified opinion on those financial statements.
/s/ Deloitte & Touche LLP
Houston, Texas
February 19, 2016
54
Table of Contents
DIAMOND OFFSHORE DRILLING, INC.
AND SUBSIDIARIES
(In thousands, except share and per share data)
| December 31, | ||||||||
| 2015 | 2014 | |||||||
| ASSETS | ||||||||
| Current assets: |
||||||||
| Cash and cash equivalents |
$ | 119,028 | $ | 233,623 | ||||
| Marketable securities |
11,518 | 16,033 | ||||||
| Accounts receivable, net of allowance for bad debts |
405,370 | 463,862 | ||||||
| Prepaid expenses and other current assets |
119,479 | 185,541 | ||||||
| Assets held for sale |
14,200 | — | ||||||
|
|
|
|
|
|||||
| Total current assets |
669,595 | 899,059 | ||||||
| Drilling and other property and equipment, net of accumulated depreciation |
6,378,814 | 6,945,953 | ||||||
| Other assets |
116,480 | 176,277 | ||||||
|
|
|
|
|
|||||
| Total assets |
$ | 7,164,889 | $ | 8,021,289 | ||||
|
|
|
|
|
|||||
| LIABILITIES AND STOCKHOLDERS’ EQUITY | ||||||||
| Current liabilities: |
||||||||
| Accounts payable |
$ | 70,272 | $ | 138,444 | ||||
| Accrued liabilities |
253,769 | 426,592 | ||||||
| Taxes payable |
15,093 | 41,648 | ||||||
| Short-term borrowings |
286,589 | — | ||||||
| Current portion of long-term debt |
— | 249,962 | ||||||
|
|
|
|
|
|||||
| Total current liabilities |
625,723 | 856,646 | ||||||
| Long-term debt |
1,994,773 | 1,994,526 | ||||||
| Deferred tax liability |
276,529 | 530,394 | ||||||
| Other liabilities |
155,094 | 188,160 | ||||||
|
|
|
|
|
|||||
| Total liabilities |
3,052,119 | 3,569,726 | ||||||
|
|
|
|
|
|||||
| Commitments and contingencies (Note 12) |
||||||||
| Stockholders’ equity: |
||||||||
| Preferred stock (par value $0.01, 25,000,000 shares authorized, none issued and outstanding) |
— | — | ||||||
| Common stock (par value $0.01, 500,000,000 shares authorized; 143,978,877 shares issued and 137,158,706 shares outstanding at December 31, 2015; 143,960,260 shares issued and 137,147,899 shares outstanding at December 31, 2014) |
1,440 | 1,440 | ||||||
| Additional paid-in capital |
1,999,634 | 1,993,898 | ||||||
| Retained earnings |
2,319,136 | 2,661,999 | ||||||
| Accumulated other comprehensive gain (loss) |
(5,035 | ) | (3,605 | ) | ||||
| Treasury stock, at cost (6,820,171 and 6,812,361 shares of common stock at December 31, 2015 and 2014, respectively) |
(202,405 | ) | (202,169 | ) | ||||
|
|
|
|
|
|||||
| Total stockholders’ equity |
4,112,770 | 4,451,563 | ||||||
|
|
|
|
|
|||||
| Total liabilities and stockholders’ equity |
$ | 7,164,889 | $ | 8,021,289 | ||||
|
|
|
|
|
|||||
The accompanying notes are an integral part of the consolidated financial statements.
55
Table of Contents
DIAMOND OFFSHORE DRILLING, INC.
AND SUBSIDIARIES
CONSOLIDATED STATEMENTS OF OPERATIONS
(In thousands, except per share data)
| Year Ended December 31, | ||||||||||||
| 2015 | 2014 | 2013 | ||||||||||
| Revenues: |
||||||||||||
| Contract drilling |
$ | 2,360,184 | $ | 2,737,126 | $ | 2,843,584 | ||||||
| Revenues related to reimbursable expenses |
59,209 | 77,545 | 76,837 | |||||||||
|
|
|
|
|
|
|
|||||||
| Total revenues |
2,419,393 | 2,814,671 | 2,920,421 | |||||||||
|
|
|
|
|
|
|
|||||||
| Operating expenses: |
||||||||||||
| Contract drilling, excluding depreciation |
1,227,864 | 1,523,623 | 1,572,525 | |||||||||
| Reimbursable expenses |
58,050 | 76,091 | 74,967 | |||||||||
| Depreciation |
493,162 | 456,483 | 388,092 | |||||||||
| General and administrative |
66,462 | 81,832 | 64,788 | |||||||||
| Impairment of assets |
860,441 | 109,462 | — | |||||||||
| Bad debt expense |
— | — | 22,513 | |||||||||
| Restructuring and separation costs |
9,778 | — | — | |||||||||
| Gain on disposition of assets |
(2,290 | ) | (5,382 | ) | (4,070 | ) | ||||||
|
|
|
|
|
|
|
|||||||
| Total operating expenses |
2,713,467 | 2,242,109 | 2,118,815 | |||||||||
|
|
|
|
|
|
|
|||||||
| Operating (loss) income |
(294,074 | ) | 572,562 | 801,606 | ||||||||
| Other income (expense): |
||||||||||||
| Interest income |
3,322 | 801 | 701 | |||||||||
| Interest expense, net of amounts capitalized |
(93,934 | ) | (62,053 | ) | (24,843 | ) | ||||||
| Foreign currency transaction gain (loss) |
2,465 | 3,199 | (4,915 | ) | ||||||||
| Other, net |
873 | 682 | 1,691 | |||||||||
|
|
|
|
|
|
|
|||||||
| (Loss) income before income tax benefit (expense) |
(381,348 | ) | 515,191 | 774,240 | ||||||||
| Income tax benefit (expense) |
107,063 | (128,180 | ) | (225,554 | ) | |||||||
|
|
|
|
|
|
|
|||||||
| Net (loss) income |
$ | (274,285 | ) | $ | 387,011 | $ | 548,686 | |||||
|
|
|
|
|
|
|
|||||||
| (Loss) earnings per share: |
||||||||||||
| Basic |
$ | (2.00 | ) | $ | 2.82 | $ | 3.95 | |||||
|
|
|
|
|
|
|
|||||||
| Diluted |
$ | (2.00 | ) | $ | 2.81 | $ | 3.95 | |||||
|
|
|
|
|
|
|
|||||||
| Weighted-average shares outstanding: |
||||||||||||
| Shares of common stock |
137,157 | 137,473 | 139,035 | |||||||||
| Dilutive potential shares of common stock |
— | 50 | 29 | |||||||||
|
|
|
|
|
|
|
|||||||
| Total weighted-average shares outstanding |
137,157 | 137,523 | 139,064 | |||||||||
|
|
|
|
|
|
|
|||||||
| Cash dividends declared per share of common stock |
$ | 0.50 | $ | 3.50 | $ | 3.50 | ||||||
|
|
|
|
|
|
|
|||||||
The accompanying notes are an integral part of the consolidated financial statements.
56
Table of Contents
DIAMOND OFFSHORE DRILLING, INC.
AND SUBSIDIARIES
CONSOLIDATED STATEMENTS OF COMPREHENSIVE INCOME OR LOSS
(In thousands)
| Year Ended December 31, | ||||||||||||
| 2015 | 2014 | 2013 | ||||||||||
| Net (loss) income |
$ | (274,285 | ) | $ | 387,011 | $ | 548,686 | |||||
| Other comprehensive (losses) gains, net of tax: |
||||||||||||
| Derivative financial instruments: |
||||||||||||
| Unrealized holding loss |
(1,574 | ) | (1,482 | ) | (6,833 | ) | ||||||
| Reclassification adjustment for loss (gain) included in net income |
5,084 | (2,379 | ) | 4,840 | ||||||||
| Investments in marketable securities: |
||||||||||||
| Unrealized holding loss on investments |
(4,940 | ) | (69 | ) | (6 | ) | ||||||
| Reclassification adjustment for gain included in net income |
— | (25 | ) | (147 | ) | |||||||
|
|
|
|
|
|
|
|||||||
| Total other comprehensive loss |
(1,430 | ) | (3,955 | ) | (2,146 | ) | ||||||
|
|
|
|
|
|
|
|||||||
| Comprehensive (loss) income |
$ | (275,715 | ) | $ | 383,056 | $ | 546,540 | |||||
|
|
|
|
|
|
|
|||||||
The accompanying notes are an integral part of the consolidated financial statements.
57
Table of Contents
DIAMOND OFFSHORE DRILLING, INC.
AND SUBSIDIARIES
CONSOLIDATED STATEMENTS OF STOCKHOLDERS’ EQUITY
(In thousands, except number of shares)
|
Common Stock |
Additional Paid-In Capital |
Retained Earnings |
Accumulated Other Comprehensive Gains (Losses) |
Treasury Stock |
Total Stockholders’ Equity |
|||||||||||||||||||||||||||
| Shares | Amount | Shares | Amount | |||||||||||||||||||||||||||||
| January 1, 2013 |
143,948,370 | 1,439 | 1,983,957 | 2,702,915 | 2,496 | 4,916,800 | (114,413 | ) | 4,576,394 | |||||||||||||||||||||||
|
|
|
|
|
|
|
|
|
|
|
|
|
|
|
|
|
|||||||||||||||||
| Net income |
— | — | — | 548,686 | — | — | — | 548,686 | ||||||||||||||||||||||||
| Dividends to stockholders ($3.50 per share) |
— | — | — | (486,620 | ) | — | — | — | (486,620 | ) | ||||||||||||||||||||||
| Anti-dilution adjustment paid to stock plan participants ($3.00 per share) |
— | — | — | (3,820 | ) | — | — | — | (3,820 | ) | ||||||||||||||||||||||
| Stock options exercised |
3,878 | 1 | 109 | — | — | — | — | 110 | ||||||||||||||||||||||||
| Stock-based compensation, net of tax |
— | — | 4,654 | — | — | — | — | 4,654 | ||||||||||||||||||||||||
| Net loss on derivative financial instruments |
— | — | — | — | (1,993 | ) | — | — | (1,993 | ) | ||||||||||||||||||||||
| Net loss on investments |
— | — | — | — | (153 | ) | — | — | (153 | ) | ||||||||||||||||||||||
|
|
|
|
|
|
|
|
|
|
|
|
|
|
|
|
|
|||||||||||||||||
| December 31, 2013 |
143,952,248 | 1,440 | 1,988,720 | 2,761,161 | 350 | 4,916,800 | (114,413 | ) | 4,637,258 | |||||||||||||||||||||||
|
|
|
|
|
|
|
|
|
|
|
|
|
|
|
|
|
|||||||||||||||||
| Net income |
— | — | — | 387,011 | — | — | — | 387,011 | ||||||||||||||||||||||||
| Dividends to stockholders ($3.50 per share) |
— | — | — | (481,642 | ) | — | — | — | (481,642 | ) | ||||||||||||||||||||||
| Anti-dilution adjustment paid to stock plan participants ($3.00 per share) |
— | — | — | (4,531 | ) | — | — | — | (4,531 | ) | ||||||||||||||||||||||
| Treasury stock purchase |
— | — | — | — | — | 1,895,561 | (87,756 | ) | (87,756 | ) | ||||||||||||||||||||||
| Stock options exercised |
8,012 | — | 213 | — | — | — | — | 213 | ||||||||||||||||||||||||
| Stock-based compensation, net of tax |
— | — | 4,965 | — | — | — | — | 4,965 | ||||||||||||||||||||||||
| Net loss on derivative financial instruments |
— | — | — | — | (3,861 | ) | — | — | (3,861 | ) | ||||||||||||||||||||||
| Net loss on investments |
— | — | — | — | (94 | ) | — | — | (94 | ) | ||||||||||||||||||||||
|
|
|
|
|
|
|
|
|
|
|
|
|
|
|
|
|
|||||||||||||||||
| December 31, 2014 |
143,960,260 | 1,440 | 1,993,898 | 2,661,999 | (3,605 | ) | 6,812,361 | (202,169 | ) | 4,451,563 | ||||||||||||||||||||||
|
|
|
|
|
|
|
|
|
|
|
|
|
|
|
|
|
|||||||||||||||||
| Net loss |
— | — | — | (274,285 | ) | — | — | — | (274,285 | ) | ||||||||||||||||||||||
| Dividends to stockholders ($0.50 per share) |
— | — | — | (68,578 | ) | — | — | — | (68,578 | ) | ||||||||||||||||||||||
| Stock-based compensation, net of tax |
18,617 | — | 5,736 | — | — | 7,810 | (236 | ) | 5,500 | |||||||||||||||||||||||
| Net gain on derivative financial instruments |
— | — | — | — | 3,510 | — | — | 3,510 | ||||||||||||||||||||||||
| Net loss on investments |
— | — | — | — | (4,940 | ) | — | — | (4,940 | ) | ||||||||||||||||||||||
|
|
|
|
|
|
|
|
|
|
|
|
|
|
|
|
|
|||||||||||||||||
| December 31, 2015 |
143,978,877 | $ | 1,440 | $ | 1,999,634 | $ | 2,319,136 | $ | (5,035 | ) | 6,820,171 | $ | (202,405 | ) | $ | 4,112,770 | ||||||||||||||||
|
|
|
|
|
|
|
|
|
|
|
|
|
|
|
|
|
|||||||||||||||||
The accompanying notes are an integral part of the consolidated financial statements.
58
Table of Contents
DIAMOND OFFSHORE DRILLING, INC.
AND SUBSIDIARIES
CONSOLIDATED STATEMENTS OF CASH FLOWS
(In thousands)
| Year Ended December 31, | ||||||||||||
| 2015 | 2014 | 2013 | ||||||||||
| Operating activities: |
||||||||||||
| Net (loss) income |
$ | (274,285 | ) | $ | 387,011 | $ | 548,686 | |||||
| Adjustments to reconcile net (loss) income to net cash provided by operating activities: |
||||||||||||
| Depreciation |
493,162 | 456,483 | 388,092 | |||||||||
| Loss on impairment of assets |
860,441 | 109,462 | — | |||||||||
| Gain on disposition of assets |
(2,290 | ) | (5,382 | ) | (4,070 | ) | ||||||
| Bad debt expense |
— | — | 22,513 | |||||||||
| Loss (gain) on foreign currency forward exchange contracts |
8,364 | (3,275 | ) | 6,501 | ||||||||
| Deferred tax provision |
(242,034 | ) | 1,532 | 34,101 | ||||||||
| Stock-based compensation expense |
4,856 | 3,507 | 3,573 | |||||||||
| Deferred income, net |
(45,383 | ) | 60,061 | (54,274 | ) | |||||||
| Deferred expenses, net |
(26,405 | ) | (82,814 | ) | 25,604 | |||||||
| Long-term employee remuneration programs |
(1,838 | ) | 1,195 | 8,966 | ||||||||
| Other assets, noncurrent |
2,483 | 2,881 | (4,922 | ) | ||||||||
| Other liabilities, noncurrent |
(3,890 | ) | (3,979 | ) | (5,296 | ) | ||||||
| (Payments of) proceeds from settlement of foreign currency forward exchange contracts designated as accounting hedges |
(8,364 | ) | 3,275 | (6,501 | ) | |||||||
| Bank deposits denominated in nonconvertible currencies |
1,069 | 5,520 | (12,741 | ) | ||||||||
| Other |
1,627 | 1,923 | 1,247 | |||||||||
| Changes in operating assets and liabilities: |
||||||||||||
| Accounts receivable |
58,872 | 5,269 | 7,905 | |||||||||
| Prepaid expenses and other current assets |
19,195 | (2,791 | ) | 10,066 | ||||||||
| Accounts payable and accrued liabilities |
(180,872 | ) | 27,463 | 46,752 | ||||||||
| Taxes payable |
71,719 | 25,490 | 49,786 | |||||||||
|
|
|
|
|
|
|
|||||||
| Net cash provided by operating activities |
736,427 | 992,831 | 1,065,988 | |||||||||
|
|
|
|
|
|
|
|||||||
| Investing activities: |
||||||||||||
| Capital expenditures (including rig construction) |
(830,655 | ) | (2,032,764 | ) | (957,598 | ) | ||||||
| Proceeds from disposition of assets, net of disposal costs |
13,049 | 18,318 | 4,900 | |||||||||
| Proceeds from sale and maturities of marketable securities |
51 | 8,000,057 | 4,650,085 | |||||||||
| Purchases of marketable securities |
— | (6,265,846 | ) | (5,249,462 | ) | |||||||
|
|
|
|
|
|
|
|||||||
| Net cash used in investing activities |
(817,555 | ) | (280,235 | ) | (1,552,075 | ) | ||||||
|
|
|
|
|
|
|
|||||||
| Financing activities: |
||||||||||||
| Repayment of long-term debt |
(250,000 | ) | (250,000 | ) | — | |||||||
| Issuance of senior notes |
— | — | 997,805 | |||||||||
| Proceeds from short-term borrowings, net of repayments |
286,589 | — | — | |||||||||
| Debt issuance costs and arrangement fees |
(624 | ) | (2,249 | ) | (9,973 | ) | ||||||
| Payment of dividends and anti-dilution payments |
(69,432 | ) | (486,240 | ) | (490,331 | ) | ||||||
| Purchase of treasury stock |
— | (87,756 | ) | — | ||||||||
| Other |
— | 261 | 165 | |||||||||
|
|
|
|
|
|
|
|||||||
| Net cash (used in) provided by financing activities |
(33,467 | ) | (825,984 | ) | 497,666 | |||||||
|
|
|
|
|
|
|
|||||||
| Net change in cash and cash equivalents |
(114,595 | ) | (113,388 | ) | 11,579 | |||||||
| Cash and cash equivalents, beginning of year |
233,623 | 347,011 | 335,432 | |||||||||
|
|
|
|
|
|
|
|||||||
| Cash and cash equivalents, end of year |
$ | 119,028 | $ | 233,623 | $ | 347,011 | ||||||
|
|
|
|
|
|
|
|||||||
The accompanying notes are an integral part of the consolidated financial statements.
59
Table of Contents
DIAMOND OFFSHORE DRILLING, INC.
AND SUBSIDIARIES
NOTES TO CONSOLIDATED FINANCIAL STATEMENTS
1. General Information
Diamond Offshore Drilling, Inc. is a leader in offshore drilling, providing contract drilling services to the energy industry around the globe with a fleet of 32 offshore drilling rigs, consisting of eight ultra-deepwater, seven deepwater and eight mid-water semisubmersibles, four dynamically positioned drillships and five jack-ups. Unless the context otherwise requires, references in these Notes to “Diamond Offshore,” “we,” “us” or “our” mean Diamond Offshore Drilling, Inc. and our consolidated subsidiaries. We were incorporated in Delaware in 1989.
As of February 16, 2016, Loews Corporation, or Loews, owned 53% of the outstanding shares of our common stock.
Principles of Consolidation
Our consolidated financial statements include the accounts of Diamond Offshore Drilling, Inc. and our subsidiaries after elimination of intercompany transactions and balances.
Use of Estimates in the Preparation of Financial Statements
The preparation of financial statements in conformity with accounting principles generally accepted in the United States, or U.S., or GAAP, requires management to make estimates and assumptions that affect the reported amounts of assets and liabilities and disclosure of contingent assets and liabilities at the date of the financial statements and the reported amount of revenues and expenses during the reporting period. Actual results could differ from those estimated.
Cash and Cash Equivalents
We consider short-term, highly liquid investments that have an original maturity of three months or less and deposits in money market mutual funds that are readily convertible into cash to be cash equivalents.
The effect of exchange rate changes on cash balances held in foreign currencies was not material for the years ended December 31, 2015, 2014 and 2013.
Marketable Securities
We classify our investments in marketable securities as available for sale and they are stated at fair value in our Consolidated Balance Sheets. Accordingly, any unrealized gains and losses, net of taxes, are reported in our Consolidated Balance Sheets in “Accumulated other comprehensive gain (loss)” until realized. The cost of debt securities is adjusted for amortization of premiums and accretion of discounts to maturity and such adjustments are included in our Consolidated Statements of Operations in “Interest income.” The sale and purchase of securities are recorded on the date of the trade. The cost of debt securities sold is based on the specific identification method. Realized gains or losses, as well as any declines in value that are judged to be other than temporary, are reported in our Consolidated Statements of Operations in “Other income (expense) – Other, net.” See Note 6.
60
Table of Contents
Provision for Bad Debts
We record a provision for bad debts on a case-by-case basis when facts and circumstances indicate that a customer receivable may not be collectible. In establishing these reserves, we consider historical and other factors that predict collectability, including write-offs, recoveries and the monitoring of credit quality. Such provision is reported as a component of “Operating expense” in our Consolidated Statements of Operations. See Note 3.
Derivative Financial Instruments
Our derivative financial instruments have primarily consisted of foreign currency forward exchange, or FOREX, contracts which we may designate as cash flow hedges. In accordance with GAAP, each derivative contract is stated in the balance sheet at its fair value with gains and losses reflected in the income statement except that, to the extent the derivative qualifies for and is designated as an accounting hedge, the gains and losses are reflected in income in the same period as offsetting gains and losses on the qualifying hedged positions. Designated hedges are expected to be highly effective, and therefore, adjustments to record the carrying value of the effective portion of our derivative financial instruments to their fair value are recorded as a component of “Accumulated other comprehensive gain (loss),” or AOCGL, in our Consolidated Balance Sheets. The effective portion of the cash flow hedge will remain in AOCGL until it is reclassified into earnings in the period or periods during which the hedged transaction affects earnings or it is determined that the hedged transaction will not occur. We report such realized gains and losses as a component of “Contract drilling, excluding depreciation” expense in our Consolidated Statements of Operations to offset the impact of foreign currency fluctuations in our expenditures in local foreign currencies in the countries in which we operate.
Adjustments to record the carrying value of the ineffective portion of our derivative financial instruments to fair value and realized gains or losses upon settlement of derivative contracts not designated as cash flow hedges are reported as “Foreign currency transaction gain (loss)” in our Consolidated Statements of Operations. See Notes 7 and 8.
Assets Held For Sale
At December 31, 2015, we reported the $14.2 million carrying value of five of our jack-up rigs as “Assets held for sale” in our Consolidated Balance Sheets. One of these rigs was subsequently sold for $8.0 million in February 2016. See Notes 2 and 9.
Drilling and Other Property and Equipment
We carry our drilling and other property and equipment at cost, less accumulated depreciation. Maintenance and routine repairs are charged to income currently while replacements and betterments that upgrade or increase the functionality of our existing equipment and that significantly extend the useful life of an existing asset, are capitalized. Significant judgments, assumptions and estimates may be required in determining whether or not such replacements and betterments meet the criteria for capitalization and in determining useful lives and salvage values of such assets. Changes in these judgments, assumptions and estimates could produce results that differ from those reported. During the years ended December 31, 2015 and 2014, we capitalized $262.4 million and $546.0 million, respectively, in replacements and betterments of our drilling fleet.
Costs incurred for major rig upgrades and/or the construction of rigs are accumulated in construction work-in-progress, with no depreciation recorded on the additions, until the month the upgrade or newbuild is completed and the rig is placed in service. Upon retirement or sale of a rig, the cost and related accumulated depreciation are removed from the respective accounts and any gains or losses are included in our results of operations as “Gain on disposition of assets.” Depreciation is recognized up to applicable salvage values by applying the straight-line method over the remaining estimated useful lives from the year the asset is placed in service. Drilling rigs and equipment are depreciated over their estimated useful lives ranging from 3 to 30 years.
61
Table of Contents
Capitalized Interest
We capitalize interest cost for qualifying construction and upgrade projects. During the three years ended December 31, 2015, we capitalized interest on qualifying expenditures, primarily related to our rig construction projects. See Note 9.
A reconciliation of our total interest cost to “Interest expense” as reported in our Consolidated Statements of Operations is as follows:
| For the Year Ended December 31, | ||||||||||||
| 2015 | 2014 | 2013 | ||||||||||
| (In thousands) | ||||||||||||
| Total interest cost including amortization of debt issuance costs |
$ | 110,242 | $ | 122,656 | $ | 99,080 | ||||||
| Capitalized interest |
(16,308 | ) | (60,603 | ) | (74,237 | ) | ||||||
|
|
|
|
|
|
|
|||||||
| Total interest expense as reported |
$ | 93,934 | $ | 62,053 | $ | 24,843 | ||||||
|
|
|
|
|
|
|
|||||||
Impairment of Long-Lived Assets
We evaluate our property and equipment for impairment whenever changes in circumstances indicate that the carrying amount of an asset may not be recoverable (such as, but not limited to, cold stacking a rig, the expectation of cold stacking a rig in the near term, contracted backlog of less than one year for a rig, a decision to retire or scrap a rig, or excess spending over budget on a newbuild, construction project or major rig upgrade). We utilize an undiscounted probability-weighted cash flow analysis in testing an asset for potential impairment. Our assumptions and estimates underlying this analysis include the following:
| • | dayrate by rig; |
| • | utilization rate by rig if active, warm stacked or cold stacked (expressed as the actual percentage of time per year that the rig would be used at certain dayrates); |
| • | the per day operating cost for each rig if active, warm stacked or cold stacked; |
| • | the estimated annual cost for rig replacements and/or enhancement programs; |
| • | the estimated maintenance, inspection or other costs associated with a rig returning to work; |
| • | salvage value for each rig; and |
| • | estimated proceeds that may be received on disposition of each rig. |
Based on these assumptions, we develop a matrix for each rig under evaluation using multiple utilization/dayrate scenarios, to each of which we have assigned a probability of occurrence. We arrive at a projected probability – weighted cash flow for each rig based on the respective matrix and compare such amount to the carrying value of the asset to assess recoverability.
The underlying assumptions and assigned probabilities of occurrence for utilization and dayrate scenarios are developed using a methodology that examines historical data for each rig, which considers the rig’s age, rated water depth and other attributes and then assesses its future marketability in light of the current and projected market environment at the time of assessment. Other assumptions, such as operating, maintenance and inspection costs, are estimated using historical data adjusted for known developments and future events that are anticipated by management at the time of the assessment.
Management’s assumptions are necessarily subjective and are an inherent part of our asset impairment evaluation, and the use of different assumptions could produce results that differ from those reported. Our methodology generally involves the use of significant unobservable inputs, representative of a Level 3 fair value
62
Table of Contents
measurement, which may include assumptions related to future dayrate revenue, costs and rig utilization, quotes from rig brokers, the long-term future performance of our rigs and future market conditions. Management’s assumptions involve uncertainties about future demand for our services, dayrates, expenses and other future events, and management’s expectations may not be indicative of future outcomes. Significant unanticipated changes to these assumptions could materially alter our analysis in testing an asset for potential impairment. For example, changes in market conditions that exist at the measurement date or that are projected by management could affect our key assumptions. Other events or circumstances that could affect our assumptions may include, but are not limited to, a further sustained decline in oil and gas prices, cancelations of our drilling contracts or contracts of our competitors, contract modifications, costs to comply with new governmental regulations, growth in the global oversupply of oil and geopolitical events, such as lifting sanctions on oil-producing nations. Should actual market conditions in the future vary significantly from market conditions used in our projections, our assessment of impairment would likely be different. See Note 2.
Fair Value of Financial Instruments
We believe that the carrying amount of our current financial instruments approximates fair value because of the short maturity of these instruments. See Note 8.
Debt Issuance Costs
Debt issuance costs are included in our Consolidated Balance Sheets at December 31, 2015 and 2014 in “Other assets” and are amortized over the respective terms of the related debt. In April 2015, the Financial Accounting Standards Board, or FASB, issued Accounting Standards Update, or ASU, No. 2015-03, Interest – Imputation of Interest (Subtopic 835-30); Simplifying the Presentation of Debt Issuance Costs, or ASU 2015-03, which requires debt issuance costs associated with our senior notes (See Note 10) to be presented in the balance sheet as a direct deduction from the carrying amount of the related senior note. This change is effective for fiscal years beginning after December 15, 2015, with early adoption permitted. We will be adopting the provisions of ASU 2015-03 in the first quarter of 2016, which will affect only the presentation of such amounts in our Consolidated Balance Sheets.
Income Taxes
We account for income taxes in accordance with accounting standards that require the recognition of the amount of taxes payable or refundable for the current year and an asset and liability approach in recognizing the amount of deferred tax liabilities and assets for the future tax consequences of events that have been currently recognized in our financial statements or tax returns. In each of our tax jurisdictions we recognize a current tax liability or asset for the estimated taxes payable or refundable on tax returns for the current year and a deferred tax asset or liability for the estimated future tax effects attributable to temporary differences and carryforwards. Deferred tax assets are reduced by a valuation allowance, if necessary, which is determined by the amount of any tax benefits that, based on available evidence, are not expected to be realized under a “more likely than not” approach. We make judgments regarding future events and related estimates especially as they pertain to the forecasting of our effective tax rate, the potential realization of deferred tax assets such as utilization of foreign tax credits, and exposure to the disallowance of items deducted on tax returns upon audit.
We record interest related to accrued unrecognized tax positions in interest expense and recognize penalties associated with uncertain tax positions in our tax expense. See Note 15.
Current GAAP requires a reporting entity to separate deferred income tax liabilities and assets into current and noncurrent amounts in a classified statement of financial position based on the underlying assets and liabilities to which such deferred income taxes relate. To simplify the presentation of deferred income taxes, the FASB issued ASU No. 2015-17, Balance Sheet Classification of Deferred Taxes, or ASU 2015-17, in November 2015, which requires that deferred tax liabilities and assets be classified as noncurrent in a classified statement of
63
Table of Contents
financial position. ASU 2015-17 is effective for annual and interim reporting periods beginning after December 15, 2016 with earlier application permitted. We have elected to early adopt ASU 2015-17 and are prospectively applying the classification requirements as of the beginning of 2015. Our Consolidated Balance Sheet at December 31, 2014 has not been retrospectively adjusted. See Note 15.
Treasury Stock
In connection with the vesting of restricted stock units held by our chief executive officer, or CEO, in 2015, we acquired 7,810 shares of our common stock (valued at $0.2 million) in satisfaction of tax withholding obligations that were incurred on the vesting date. See Note 3.
Depending on market conditions, we may, from time to time, purchase shares of our common stock in the open market or otherwise. We account for the purchase of treasury stock using the cost method, which reports the cost of the shares acquired in “Treasury stock” as a deduction from stockholders’ equity in our Consolidated Balance Sheets. During the year ended December 31, 2014, we repurchased 1,895,561 shares of our outstanding common stock at a cost of $87.8 million. We did not repurchase any shares of our outstanding common stock during 2015 or 2013.
Comprehensive Income (Loss)
Comprehensive income (loss) is the change in equity of a business enterprise during a period from transactions and other events and circumstances except those transactions resulting from investments by owners and distributions to owners. Comprehensive income (loss) for the three years ended December 31, 2015, 2014 and 2013 includes net income (loss) and unrealized holding gains and losses on marketable securities and financial derivatives designated as cash flow accounting hedges. See Note 11.
Foreign Currency
Our functional currency is the U.S. dollar. Foreign currency transaction gains and losses are reported as “Foreign currency transaction gain (loss)” in our Consolidated Statements of Operations and include, when applicable, unrealized gains and losses to record the carrying value of our FOREX contracts not designated as accounting hedges, as well as realized gains and losses from the settlement of such contracts. For the years ended December 31, 2015, 2014 and 2013, we recognized aggregate net foreign currency gains (losses) of $2.5 million, $3.2 million and $(4.9) million, respectively. See Note 7.
Revenue Recognition
We recognize revenue from dayrate drilling contracts as services are performed. In connection with such drilling contracts, we may receive fees (on either a lump-sum or dayrate basis) for the mobilization of equipment. We earn these fees as services are performed over the initial term of the related drilling contracts. We defer mobilization fees received, as well as direct and incremental mobilization costs incurred, and amortize each, on a straight-line basis, over the term of the related drilling contracts (which is the period we estimate to be benefited from the mobilization activity). Straight-line amortization of mobilization revenues and related costs over the term of the related drilling contracts (which generally range from two to 60 months) is consistent with the timing of net cash flows generated from the actual drilling services performed. Absent a contract, mobilization costs are recognized currently. Upon completion of a drilling contract, we recognize in earnings any demobilization fees received and costs incurred.
Some of our drilling contracts require downtime before the start of the contract to prepare the rig to meet customer requirements. At times, we may be compensated by the customer for such work (on either a lump-sum or dayrate basis). These fees are generally earned as services are performed over the initial term of the related drilling contracts. We defer contract preparation fees received, as well as direct and incremental costs associated
64
Table of Contents
with the contract preparation activities and amortize each, on a straight-line basis, over the term of the related drilling contracts (which we estimate to be benefited from the contract preparation activity).
From time to time, we may receive fees from our customers for capital improvements to our rigs (on either a lump-sum or dayrate basis). We defer such fees received in “Accrued liabilities” and “Other liabilities” in our Consolidated Balance Sheets and recognize these fees into income on a straight-line basis over the period of the related drilling contract. We capitalize the costs of such capital improvements and depreciate them over the estimated useful life of the improvement.
We record reimbursements received for the purchase of supplies, equipment, personnel services and other services provided at the request of our customers in accordance with a contract or agreement, for the gross amount billed to the customer, as “Revenues related to reimbursable expenses” in our Consolidated Statements of Operations.
Recent Accounting Pronouncements
In May 2014, the FASB, issued ASU No. 2014-09, Revenue from Contracts with Customers (Topic 606), or ASU 2014-09. The new standard supersedes the industry-specific standards that currently exist under GAAP and provides a framework to address revenue recognition issues comprehensively for all contracts with customers regardless of industry-specific or transaction-specific fact patterns. Under the new guidance, companies recognize revenue to depict the transfer of promised goods or services to customers in an amount that reflects the consideration to which the company expects to be entitled in exchange for those goods or services. ASU 2014-09 also provides for additional disclosure requirements. In July 2015, the FASB issued ASU 2015-14, which deferred the effective date of ASU 2014-09. The guidance of ASU 2014-09 is now effective for annual reporting periods beginning after December 15, 2017, including interim periods within that reporting period, and may be adopted using a retrospective or modified retrospective approach.
2. Asset Impairments
2015 Impairments – During 2015, in response to a continued deterioration of the market fundamentals in the oil and gas industry, including the dramatic decline in oil prices, significant cutbacks in customer capital spending plans and contract cancelations by customers, as well as pending regulatory requirements in the U.S. Gulf of Mexico, or GOM, we evaluated 25 of our drilling rigs with indications that their carrying amounts may not be recoverable (See Note 1). Using an undiscounted, projected probability-weighted cash flow analysis as described in Note 1, we determined that the carrying value of 17 of these rigs, consisting of two ultra-deepwater, one deepwater and nine mid-water floaters and five jack-up rigs, were impaired (collectively referred to as the 2015 Impaired Rigs).
We estimated the fair value of 16 of the 2015 Impaired Rigs utilizing a market approach, which required us to estimate the value that would be received for each rig in the principal or most advantageous market for that rig in an orderly transaction between market participants. Such estimates were based on various inputs, including historical contracted sales prices for similar rigs in our fleet, nonbinding quotes from rig brokers and/or indicative bids, where applicable. We estimated the fair value of the one remaining 2015 Impaired Rig using an income approach, as we determined that the most likely use for this rig would be to cold stack the rig and reintroduce it into the market at a later date. The fair value of this rig was estimated based on a calculation of the rig’s discounted future net cash flows over its remaining economic life, which utilized significant unobservable inputs, including, but not limited to, assumptions related to estimated dayrate revenue, rig utilization, estimated equipment upgrade and regulatory survey costs, as well as estimated proceeds that may be received on ultimate disposition of the rig. Our fair value estimates are representative of Level 3 fair value measurements due to the significant level of estimation involved and the lack of transparency as to the inputs used.
During the first, third and fourth quarters of 2015, we recognized impairment losses of $358.5 million, $2.6 million and $499.4 million, respectively, for an aggregate impairment loss of $860.4 million for the year ended December 31, 2015. Of the 2015 Impaired Rigs, five mid-water rigs were sold during 2015. We are actively
65
Table of Contents
marketing for sale the five jack-up rigs in the impairment group and have presented the $14.2 million aggregate carrying value of these rigs as “Assets Held for Sale” in our Consolidated Balance Sheets at December 31, 2015. Six of the 2015 Impaired Rigs were cold stacked at the end of 2015, and the remaining impaired rig is expected to be sold for scrap after completion of its contract in 2016. We have reported the $175.4 million aggregate carrying value of these rigs in “Drilling and other property and equipment, net of accumulated depreciation” in our Consolidated Balance Sheets at December 31, 2015, as they did not qualify for reporting as assets held for sale.
In February 2016, we sold one of our marketed-for-sale jack-up rigs for $8.0 million.
If market fundamentals in the oil and gas industry deteriorate further or if we are unable to secure new or extend contracts for our current, actively-marketed drilling fleet or reactivate any of our cold stacked rigs or if we experience unfavorable changes to our actual dayrates and rig utilization, we may be required to recognize additional impairment losses in future periods, if we are unable to recover the carrying value of any of our drilling rigs.
2014 Impairments – During the third quarter of 2014, we initiated a plan to retire and scrap six mid-water drilling rigs. Using an undiscounted, projected probability-weighted cash flow analysis as described in Note 1, we determined that the carrying values of these six rigs were impaired, collectively referred to as the 2014 Impaired Rigs. We determined the fair value of the 2014 Impaired Rigs by applying a combination of income and market approaches which were representative of Level 3 fair value measurements due to the significant level of estimation involved and the lack of transparency as to the inputs used. As a result of our valuations, we recognized an impairment loss aggregating $109.5 million during the third quarter of 2014.
At December 31, 2014, we had six additional rigs with indications that their carrying amounts may not be recoverable. We performed an impairment analysis for each of these rigs using the methodology described in Note 1 and concluded that these rigs were not impaired at December 31, 2014.
During the fourth quarter of 2014, two of the 2014 Impaired Rigs were sold for scrap. The $9.4 million aggregate book value of the four remaining 2014 Impaired Rigs was reported in “Drilling and other property and equipment, net of accumulated depreciation” in our Consolidated Balance Sheets at December 31, 2014. The remaining 2014 Impaired Rigs were sold in 2015.
We did not record an impairment loss during the year ended December 31, 2013.
See Notes 1 and 9.
3. Supplemental Financial Information
Consolidated Balance Sheet Information
Accounts receivable, net of allowance for bad debts, consists of the following:
| December 31, | ||||||||
| 2015 | 2014 | |||||||
| (In thousands) | ||||||||
| Trade receivables |
$ | 390,429 | $ | 437,017 | ||||
| Value added tax receivables |
14,475 | 24,853 | ||||||
| Amounts held in escrow |
4,966 | 6,450 | ||||||
| Interest receivable |
336 | 317 | ||||||
| Related party receivables |
167 | 339 | ||||||
| Other |
721 | 610 | ||||||
|
|
|
|
|
|||||
| 411,094 | 469,586 | |||||||
| Allowance for bad debts |
(5,724 | ) | (5,724 | ) | ||||
|
|
|
|
|
|||||
| Total |
$ | 405,370 | $ | 463,862 | ||||
|
|
|
|
|
|||||
66
Table of Contents
An analysis of the changes in our provision for bad debts for each of the three years ended December 31, 2015, 2014 and 2013, is as follows:
| For the Year Ended December 31, | ||||||||||||
| 2015 | 2014 | 2013 | ||||||||||
| (In thousands) | ||||||||||||
| Allowance for bad debts, beginning of year |
$ | 5,724 | $ | 27,340 | $ | 5,458 | ||||||
| Bad debt expense: |
||||||||||||
| Provision for bad debts |
— | — | 22,513 | |||||||||
| Recovery of bad debts |
— | — | — | |||||||||
|
|
|
|
|
|
|
|||||||
| Total bad debt expense (recovery) |
— | — | 22,513 | |||||||||
| Write off of uncollectible accounts against reserve |
— | (21,148 | ) | (509 | ) | |||||||
| Other (1) |
— | (468 | ) | (122 | ) | |||||||
|
|
|
|
|
|
|
|||||||
| Allowance for bad debts, end of year |
$ | 5,724 | $ | 5,724 | $ | 27,340 | ||||||
|
|
|
|
|
|
|
|||||||
| (1) | Includes revaluation adjustments for non-U.S. dollar denominated receivables, which have been recorded as “Foreign currency transaction gain (loss)” in our Consolidated Statements of Operations. |
See Note 8 for a discussion of our provision for bad debts and write off of uncollectible accounts against the reserve.
Prepaid expenses and other current assets consist of the following:
| December 31, | ||||||||
| 2015 | 2014 | |||||||
| (In thousands) | ||||||||
| Rig spare parts and supplies |
$ | 42,804 | $ | 56,315 | ||||
| Deferred mobilization costs |
52,965 | 53,206 | ||||||
| Prepaid insurance |
4,483 | 12,163 | ||||||
| Deferred tax assets (1) |
— | 15,612 | ||||||
| Prepaid taxes |
14,969 | 44,085 | ||||||
| Other |
4,258 | 4,160 | ||||||
|
|
|
|
|
|||||
| Total |
$ | 119,479 | $ | 185,541 | ||||
|
|
|
|
|
|||||
| (1) | We have elected to early adopt the provisions of ASU 2015-17 and are prospectively applying the classification requirements as of the beginning of 2015. Our Consolidated Balance Sheet at December 31, 2014 has not been retrospectively adjusted. See Notes 1 and 15. |
Accrued liabilities consist of the following:
| December 31, | ||||||||
| 2015 | 2014 | |||||||
| (In thousands) | ||||||||
| Rig operating expenses |
$ | 47,426 | $ | 85,897 | ||||
| Payroll and benefits |
59,787 | 131,664 | ||||||
| Deferred revenue |
31,542 | 63,209 | ||||||
| Accrued capital project/upgrade costs |
84,146 | 103,123 | ||||||
| Interest payable |
18,365 | 18,365 | ||||||
| Personal injury and other claims |
8,320 | 8,570 | ||||||
| FOREX contracts Other |
|
— 4,183 |
|
|
5,439 10,325 |
| ||
|
|
|
|
|
|||||
| Total |
$ | 253,769 | $ | 426,592 | ||||
|
|
|
|
|
|||||
67
Table of Contents
Consolidated Statement of Cash Flows Information
Noncash investing activities excluded from the Consolidated Statements of Cash Flows and other supplemental cash flow information is as follows:
| December 31, | ||||||||||||
| 2015 | 2014 | 2013 | ||||||||||
| (In thousands) | ||||||||||||
| Accrued but unpaid capital expenditures at period end |
$ | 84,146 | $ | 103,123 | $ | 86,274 | ||||||
| Income tax benefits related to exercise of stock options |
— | 1,458 | 1,081 | |||||||||
| Common stock withheld for payroll tax obligations (1) |
236 | — | — | |||||||||
| Cash interest payments (2) |
110,412 | 133,784 | 82,938 | |||||||||
| Cash income taxes paid (refunded), net: |
||||||||||||
| U.S. federal |
(21,751 | ) | — | 62,000 | ||||||||
| Foreign |
69,697 | 92,049 | 78,041 | |||||||||
| State |
58 | (18 | ) | 190 | ||||||||
| (1) | Represents the cost of 7,810 shares of common stock withheld to satisfy the payroll tax obligation incurred as a result of the vesting of restricted stock units in the first quarter of 2015. This cost is presented as a deduction from stockholders’ equity in “Treasury stock” in our Consolidated Balance Sheets at December 31, 2015. |
| (2) | Interest payments, net of amounts capitalized, were $94.7 million, $73.2 million and $16.5 million for the years ended December 31, 2015, 2014 and 2013, respectively. |
4. Stock-Based Compensation
We have an Equity Incentive Compensation Plan, or Equity Plan, for our (a) employees, (b) independent contractors and (c) non-employee directors, which is designed to encourage stock ownership by such persons, thereby aligning their interests with those of our stockholders and to permit the payment of performance-based compensation as defined by the Internal Revenue Code of 1986, as amended, or the Code. Under the Equity Plan, we may grant both time-vesting and performance-vesting awards, which are earned on the achievement of certain performance criteria. The following types of awards may be granted under the Equity Plan:
| • | Stock options (including incentive stock options and nonqualified stock options); |
| • | Stock appreciation rights, or SARs; |
| • | Restricted stock; |
| • | Restricted stock units, or RSUs; |
| • | Performance shares or units; and |
| • | Other stock-based awards (including dividend equivalents). |
A maximum of 7,500,000 shares of our common stock is available for the grant or settlement of awards under the Equity Plan, subject to adjustment for certain business transactions and changes in capital structure. Vesting conditions and other terms and conditions of awards under the Equity Plan are determined by our Board of Directors or the compensation committee of our Board of Directors, subject to the terms of the Equity Plan. RSUs may be issued with performance-vesting or time-vesting features. Except for RSUs issued to our CEO, RSUs are not participating securities, and the holders of such awards have no right to receive regular dividends if or when declared.
Total compensation cost recognized for all awards under the Equity Plan (or its predecessor) for the years ended December 31, 2015, 2014 and 2013 was $5.7 million, $5.0 million and $3.9 million, respectively. Tax benefits recognized for the years ended December 31, 2015, 2014 and 2013 related thereto were $1.9 million,
68
Table of Contents
$1.4 million and $1.3 million, respectively. As of December 31, 2015 there was $9.3 million of total unrecognized compensation cost related to nonvested awards under the Equity Plan, which we expect to recognize over a weighted average period of two years.
Time-Vesting Awards
SARs. SARs awarded under the Equity Plan generally vest ratably over a four-year period and expire in ten years. The exercise price per share of SARs awarded under the Equity Plan may not be less than the fair market value of our common stock on the date of grant.
The fair value of SARs granted under the Equity Plan (or its predecessor) during each of the years ended December 31, 2015, 2014 and 2013 was estimated using the Black Scholes pricing model with the following weighted average assumptions:
| Year Ended December 31, | ||||||||||||
| 2015 | 2014 | 2013 | ||||||||||
| Expected life of SARs (in years) |
6 | 7 | 7 | |||||||||
| Expected volatility |
55.12 | % | 21.68 | % | 18.24 | % | ||||||
| Dividend yield |
1.70 | % | 1.10 | % | .75 | % | ||||||
| Risk free interest rate |
1.66 | % | 2.08 | % | 1.61 | % | ||||||
The expected life of SARs is based on historical data as is the expected volatility. The dividend yield is based on the current approved regular dividend rate in effect and the current market price at the time of grant. Risk free interest rates are determined using the U.S. Treasury yield curve at time of grant with a term equal to the expected life of the SARs.
A summary of SARs activity under the Equity Plan as of December 31, 2015 and changes during the year then ended is as follows:
| Number of Awards |
Weighted- Average Exercise Price |
Weighted-Average Remaining Contractual Term (Years) |
Aggregate Intrinsic Value (In Thousands) |
|||||||||||||
| Awards outstanding at January 1, 2015 |
1,587,330 | $ | 73.03 | |||||||||||||
| Granted |
124,250 | $ | 31.67 | |||||||||||||
| Exercised |
— | $ | — | |||||||||||||
| Forfeited |
42,901 | $ | 52.17 | |||||||||||||
| Expired |
127,248 | $ | 72.07 | |||||||||||||
|
|
|
|||||||||||||||
| Awards outstanding at December 31, 2015 |
1,541,431 | $ | 70.36 | 5.6 | $ | 58 | ||||||||||
|
|
|
|||||||||||||||
| Awards exercisable at December 31, 2015 |
1,316,849 | $ | 73.52 | 5.2 | $ | 58 | ||||||||||
|
|
|
|||||||||||||||
The weighted-average grant date fair values per share of awards granted during the years ended December 31, 2015, 2014 and 2013 were $14.44, $10.40 and $13.74, respectively. The total intrinsic value of awards exercised during the years ended December 31, 2015, 2014 and 2013 was $0, $169,000 and $162,000, respectively. The total fair value of awards vested during the years ended December 31, 2015, 2014 and 2013 was $3.6 million, $4.5 million and $4.1 million, respectively.
Restricted Stock Units. RSUs are contractual rights to receive shares of our common stock in the future if the applicable vesting conditions are met. In April 2015, we granted 153,493 time-vesting RSUs, one half of which will vest on April 1, 2017 and the remaining 50% of which will vest on April 1, 2018, conditioned upon continued employment through the applicable vesting date. The fair value of time-vesting RSUs granted under the Equity Plan in 2015 was estimated based on the fair market value of our common stock on the date of grant,
69
Table of Contents
discounted at a three-year risk-free interest rate of 1.48%, as consideration of the non-participative rights of the awards.
A summary of activity for time-vesting RSUs under the Equity Plan as of December 31, 2015 and changes during the year then ended is as follows:
| Number of Awards |
Weighted- Average Grant Date Fair Value Per Share |
|||||||
| Nonvested awards at January 1, 2015 |
— | $ | — | |||||
| Granted |
153,493 | $ | 25.09 | |||||
| Vested |
— | $ | — | |||||
| Forfeited |
3,879 | $ | 25.21 | |||||
|
|
|
|||||||
| Nonvested awards at December 31, 2015 |
149,614 | $ | 25.09 | |||||
|
|
|
|||||||
No time-vesting RSUs vested during the year ended December 31, 2015.
Performance-Vesting Awards
Restricted Stock Units. In April 2015, we granted an aggregate 169,312 in performance-vesting RSUs, which will vest upon achievement of certain performance goals as set forth in the individual award agreements over the performance period from January 1, 2015 to December 31, 2017. The shares of our common stock to be received upon the vesting of the performance-vesting RSUs will be delivered no later than March 15, 2018. The fair value of performance-vesting RSUs granted under the Equity Plan to employees other than our CEO was estimated based on the fair market value of our common stock on the date of grant, discounted at a three-year risk-free interest rate of 1.48%. The fair value of performance-vesting RSUs granted to our CEO in 2015 was not discounted as such awards are participating securities.
In 2014, we awarded 55,661 targeted performance RSUs, with a volume weighted average price of our common stock preceding the grant date of $46.99 per share, including 3,080 in RSUs credited upon payment of cash dividends in 2014, to our CEO in connection with his commencement of service with us in March 2014. The RSUs awarded to our CEO in 2014 will vest in one-third increments annually, over three years, commencing on the first anniversary of his hire date, conditioned upon continued employment through the applicable vesting date.
A summary of activity for performance-vesting RSUs under the Equity Plan as of December 31, 2015 and changes during the year then ended is as follows:
| Number of Awards |
Weighted- Average Grant Date Fair Value Per Share |
|||||||
| Nonvested awards at January 1, 2015 |
55,661 | $ | 46.99 | |||||
| Granted |
169,312 | $ | 26.19 | |||||
| Vested |
18,617 | $ | 46.94 | |||||
| Forfeited |
— | $ | — | |||||
|
|
|
|||||||
| Nonvested awards at December 31, 2015 |
206,356 | $ | 29.93 | |||||
|
|
|
|||||||
The total grant date fair value of the performance-vesting RSUs that vested during the years ended December 31, 2015 and 2014 was $0.6 million and $0, respectively.
70
Table of Contents
5. Earnings Per Share
A reconciliation of the numerators and the denominators of the basic and diluted per-share computations follows:
| Year Ended December 31, | ||||||||||||
| 2015 | 2014 | 2013 | ||||||||||
| (In thousands, except per share data) | ||||||||||||
| Net (loss) income – basic and diluted (numerator): |
$ | (274,285 | ) | $ | 387,011 | $ | 548,686 | |||||
|
|
|
|
|
|
|
|||||||
| Weighted-average shares – basic (denominator): |
137,157 | 137,473 | 139,035 | |||||||||
| Dilutive effect of stock-based awards |
— | 50 | 29 | |||||||||
|
|
|
|
|
|
|
|||||||
| Weighted-average shares including conversions – diluted (denominator): |
137,157 | 137,523 | 139,064 | |||||||||
|
|
|
|
|
|
|
|||||||
| (Loss) earnings per share: |
||||||||||||
| Basic |
$ | (2.00 | ) | $ | 2.82 | $ | 3.95 | |||||
|
|
|
|
|
|
|
|||||||
| Diluted |
$ | (2.00 | ) | $ | 2.81 | $ | 3.95 | |||||
|
|
|
|
|
|
|
|||||||
The following table sets forth the share effects of stock-based awards excluded from our computations of diluted earnings per share, or EPS, as the inclusion of such potentially dilutive shares would have been antidilutive for the periods presented:
| Year Ended December 31, | ||||||||||||
| 2015 | 2014 | 2013 | ||||||||||
| (In thousands) | ||||||||||||
| Employee and director: |
||||||||||||
| Stock options |
26 | 37 | 18 | |||||||||
| SARs |
1,553 | 1,488 | 956 | |||||||||
| RSUs |
278 | — | — | |||||||||
6. Marketable Securities
We report our investments in marketable securities as current assets in our Consolidated Balance Sheets in “Marketable securities,” representing the investment of cash available for current operations. See Note 8.
Our investments in marketable securities are classified as available for sale and are summarized as follows:
| December 31, 2015 | ||||||||||||
| Amortized Cost |
Unrealized Gain (Loss) |
Market Value |
||||||||||
| (In thousands) | ||||||||||||
| Corporate bonds |
$ | 16,480 | $ | (5,042 | ) | $ | 11,438 | |||||
| Mortgage-backed securities |
77 | 3 | 80 | |||||||||
|
|
|
|
|
|
|
|||||||
| Total |
$ | 16,557 | $ | (5,039 | ) | $ | 11,518 | |||||
|
|
|
|
|
|
|
|||||||
| December 31, 2014 | ||||||||||||
| Amortized Cost |
Unrealized Gain (Loss) |
Market Value |
||||||||||
| (In thousands) | ||||||||||||
| Corporate bonds |
$ | 16,003 | $ | (104 | ) | $ | 15,899 | |||||
| Mortgage-backed securities |
130 | 4 | 134 | |||||||||
|
|
|
|
|
|
|
|||||||
| Total |
$ | 16,133 | $ | (100 | ) | $ | 16,033 | |||||
|
|
|
|
|
|
|
|||||||
71
Table of Contents
Based on current facts and circumstances, we believe that the unrealized losses on our investments in corporate bonds presented in the tables above are not indicative of the ultimate collectability of these investments, but are primarily related to the financial market’s perception of the current downturn in the bond issuer’s industry (oil and gas market and contract drilling industry). We have no current intent to sell these securities, nor is it more likely than not that we will be required to sell these investments prior to their maturity. Therefore, we do not consider the unrealized losses at December 31, 2015 and 2014 associated with our investments in corporate bonds to be other than temporary.
Proceeds from maturities and sales of marketable securities and gross realized gains and losses are summarized as follows:
| Year Ended December 31, | ||||||||||||
| 2015 | 2014 | 2013 | ||||||||||
| (In thousands) | ||||||||||||
| Proceeds from maturities |
$ | — | $ | 8,000,000 | $ | 4,650,000 | ||||||
| Proceeds from sales |
51 | 57 | 85 | |||||||||
Gross realized gains and losses from the sale of marketable securities for each of the three years ended December 31, 2015, 2014 and 2013 were not significant.
7. Derivative Financial Instruments
Foreign Currency Forward Exchange Contracts
Our international operations expose us to foreign exchange risk associated with our costs payable in foreign currencies for employee compensation, foreign income tax payments and purchases from foreign suppliers. From time to time, we may utilize FOREX contracts to manage our foreign exchange risk. Our FOREX contracts generally require us to net settle the spread between the contracted foreign currency exchange rate and the spot rate on the contract settlement date, which, for most of our contracts, is the average spot rate for the contract period.
We enter into FOREX contracts when we believe market conditions are favorable to purchase contracts for future settlement with the expectation that such contracts, when settled, will reduce our exposure to foreign currency gains and losses on future foreign currency expenditures. The amount and duration of such contracts is based on our monthly forecast of expenditures in the significant currencies in which we do business and for which there is a financial market. Historically we have entered into FOREX contracts for future delivery of Australian dollars, Brazilian reais, British pounds sterling, Mexican pesos and Norwegian kroner. These forward contracts are derivatives as defined by GAAP.
During the years ended December 31, 2015, 2014 and 2013, we settled FOREX contracts with aggregate notional values of approximately $91.6 million, $304.7 million and $307.4 million, respectively, of which the entire aggregate amounts were designated as an accounting hedge. During the years ended December 31, 2015, 2014 and 2013, we did not enter into or settle any FOREX contracts that were not designated as accounting hedges. There were no FOREX contracts outstanding at December 31, 2015.
The following table presents the aggregate amount of gain or loss recognized in our Consolidated Statements of Operations related to our FOREX contracts designated as hedging instruments for the years ended December 31, 2015, 2014 and 2013.
| Amount of Gain (Loss) Recognized in Income | ||||||||||||
| For the Years Ended December 31, | ||||||||||||
| Location of Gain (Loss) Recognized in Income | 2015 | 2014 | 2013 | |||||||||
| (In thousands) | ||||||||||||
| Contract drilling expense |
$ | (8,364 | ) | $ | 3,275 | $ | (6,501 | ) | ||||
72
Table of Contents
The following table presents the fair values of our derivative FOREX contracts designated as hedging instruments at December 31, 2015 and 2014.
| Balance Sheet Location |
Fair Value | Balance Sheet Location |
Fair Value | |||||||||||||||
| December 31, 2015 |
December 31, 2014 |
December 31, 2015 |
December 31, 2014 |
|||||||||||||||
| (In thousands) | (In thousands) | |||||||||||||||||
| Prepaid expenses and other current assets |
$ | — | $ | — | Accrued liabilities | $ | — | $ | (5,439 | ) | ||||||||
The following table presents the amounts recognized in our Consolidated Balance Sheets and Consolidated Statements of Operations related to our derivative financial instruments designated as cash flow hedges for the years ended December 31, 2015, 2014 and 2013.
| For the Year Ended December 31, | ||||||||||||
| 2015 | 2014 | 2013 | ||||||||||
| (In thousands) | ||||||||||||
| FOREX contracts: |
||||||||||||
| Amount of (loss) gain recognized in AOCGL on derivative (effective portion) |
$ | (2,420 | ) | $ | (2,281 | ) | $ | (10,542 | ) | |||
| Location of (loss) gain reclassified from AOCGL into income (effective portion) |
|
Contract drilling, excluding depreciation |
|
|
Contract drilling, excluding depreciation |
|
|
Contract drilling, excluding depreciation |
| |||
| Amount of (loss) gain reclassified from AOCGL into income (effective portion) |
$ | (7,829 | ) | $ | 3,650 | $ | (7,449 | ) | ||||
| Location of loss recognized in income on derivative (ineffective portion and amount excluded from effectiveness testing) |
|
Foreign currency transaction gain (loss) |
|
|
Foreign currency transaction gain (loss) |
|
|
Foreign currency transaction gain (loss) |
| |||
| Amount of loss recognized in income on derivative (ineffective portion and amount excluded from effectiveness testing) |
$ | (1 | ) | $ | (31 | ) | $ | (104 | ) | |||
During the years ended December 31, 2015, 2014 and 2013, we did not reclassify any amounts from AOCGL due to the probability of an underlying forecasted transaction not occurring.
8. Financial Instruments and Fair Value Disclosures
Concentrations of Credit and Market Risk
Financial instruments that potentially subject us to significant concentrations of credit or market risk consist primarily of periodic temporary investments of excess cash, trade accounts receivable and investments in debt securities, including mortgage-backed securities. We generally place our excess cash investments in U.S. government backed short-term money market instruments through several financial institutions. At times, such investments may be in excess of the insurable limit. We periodically evaluate the relative credit standing of these financial institutions as part of our investment strategy.
Most of our investments in debt securities are securitized corporate bonds whereby our credit risk is mitigated by the collateral. However, we are exposed to market risk due to price volatility associated with interest rate fluctuations.
Concentrations of credit risk with respect to our trade accounts receivable are limited primarily due to the entities comprising our customer base. Since the market for our services is the offshore oil and gas industry, this customer base consists primarily of major and independent oil and gas companies and government-owned oil
73
Table of Contents
companies. Based on our current customer base and the geographic areas in which we operate, as well as the number of rigs currently working in a geographic area, we do not believe that we have any significant concentrations of credit risk at December 31, 2015.
In general, before working for a customer with whom we have not had a prior business relationship and/or whose financial stability may be uncertain to us, we perform a credit review on that company. Based on that analysis, we may require that the customer present a letter of credit, prepay or provide other credit enhancements. We record a provision for bad debts on a case-by-case basis when facts and circumstances indicate that a customer receivable may not be collectible and, historically, losses on our trade receivables have been infrequent occurrences.
During 2013, based on our assessment of the financial condition of two of our customers, Niko Resources Ltd., or Niko, and OGX Petróleo e Gás Ltda. (a privately owned Brazilian oil and natural gas company that filed for bankruptcy in October 2013), or OGX, and our expectations at the time regarding the probability of collection of amounts due to us from them, we recorded $22.5 million in bad debt expense to fully reserve all outstanding receivables owed to us.
In December 2013, we entered into a settlement agreement with Niko, or the Niko Settlement, whereby Niko will be released from certain obligations under the dayrate contracts for the Ocean Monarch and Ocean Lexington, subject to and effective upon the full payment of amounts owed to us under the Niko Settlement and subject to its other conditions. In accordance with the terms of the Niko Settlement, we received cash payments of $20.3 million during 2014 and $25.0 million in the fourth quarter of 2013, which we recognized as revenue against invoices due us. Niko is further obligated to make future periodic payments to us pursuant to the Niko Settlement totaling an aggregate of $34.8 million, payable at various times through December 2016. In 2015, Niko failed to make required payments and perform certain other obligations under the settlement agreement, so we filed suit seeking payment of the overdue amounts and requiring Niko to perform its other contractual obligations. We plan to recognize these amounts in revenue as they are received due to the uncertainty regarding their timing and collection.
In 2014, the creditors of OGX, including us, agreed to a settlement whereby the creditors granted us shares of the reorganized OGX company in full settlement of obligations owed to them by OGX. As a result of the settlement, we have written off $21.2 million in receivables due us from OGX against the associated allowance for bad debts, which was set up in 2013. See Note 3.
Fair Values
Fair value is defined as the exchange price that would be received for an asset or paid to transfer a liability (an exit price) in the principal or most advantageous market for the asset or liability in an orderly transaction between market participants on the measurement date. The fair value hierarchy prescribed by GAAP requires an entity to maximize the use of observable inputs and minimize the use of unobservable inputs when measuring fair value. There are three levels of inputs that may be used to measure fair value:
| Level 1 |
Quoted prices for identical instruments in active markets. Level 1 assets include short-term investments such as money market funds, U.S. Treasury Bills and Treasury notes. Our Level 1 assets at December 31, 2015 consisted of cash held in money market funds of $85.2 million and time deposits of $20.4 million. Our Level 1 assets at December 31, 2014 consisted of cash held in money market funds of $197.5 million and time deposits of $20.3 million. | |
| Level 2 |
Quoted market prices for similar instruments in active markets; quoted prices for identical or similar instruments in markets that are not active; and model-derived valuations in which all significant inputs and significant value drivers are observable in active markets. Level 2 assets and liabilities include residential mortgage-backed securities, corporate bonds purchased in a private placement offering and | |
74
Table of Contents
| over-the-counter FOREX contracts. Our residential mortgage-backed securities and corporate bonds were valued using a model-derived valuation technique based on the quoted closing market prices received from a financial institution. Our FOREX contracts were valued based on quoted market prices, which are derived from observable inputs including current spot and forward rates, less the contract rate multiplied by the notional amount. The inputs used in our valuation are obtained from a Bloomberg curve analysis which uses par coupon swap rates to calculate implied forward rates so that projected floating rate cash flows can be calculated. The valuation techniques underlying the models are widely accepted in the financial services industry and do not involve significant judgment. | ||
| Level 3 |
Valuations derived from valuation techniques in which one or more significant inputs or significant value drivers are unobservable. Level 3 assets and liabilities generally include financial instruments whose value is determined using pricing models, discounted cash flow methodologies, or similar techniques, as well as instruments for which the determination of fair value requires significant management judgment or estimation or for which there is a lack of transparency as to the inputs used. Our Level 3 assets at December 31, 2015 and 2014 consisted of nonrecurring measurements of certain of our drilling rigs for which we recorded an impairment loss during the years ended December 31, 2015 and 2014. See Notes 1 and 2. | |
Market conditions could cause an instrument to be reclassified among Levels 1, 2 and 3. Our policy regarding fair value measurements of financial instruments transferred into and out of levels is to reflect the transfers as having occurred at the beginning of the reporting period. There were no transfers between fair value levels during the years ended December 31, 2015 and 2014.
Certain of our assets and liabilities are required to be measured at fair value on a recurring basis in accordance with GAAP. In addition, certain assets and liabilities may be recorded at fair value on a nonrecurring basis. Generally, we record assets at fair value on a nonrecurring basis as a result of impairment charges. We recorded impairment charges related to our 2015 Impaired Rigs and our 2014 Impaired Rigs, which were measured at fair value on a nonrecurring basis in 2015 and 2014, respectively, and have presented the aggregate loss in “Impairment of assets” in our Consolidated Statements of Operations for the years ended December 31, 2015 and 2014.
| December 31, 2015 | ||||||||||||||||||||
| Fair Value Measurements Using | Assets at Fair Value |
Total Losses for Year Ended (1) |
||||||||||||||||||
| Level 1 | Level 2 | Level 3 | ||||||||||||||||||
| (In thousands) | ||||||||||||||||||||
| Recurring fair value measurements: |
||||||||||||||||||||
| Assets: |
||||||||||||||||||||
| Short-term investments |
$ | 105,659 | — | $ | — | $ | 105,659 | |||||||||||||
| Corporate bonds |
— | 11,438 | — | 11,438 | ||||||||||||||||
| Mortgage-backed securities |
— | 80 | — | 80 | ||||||||||||||||
|
|
|
|
|
|
|
|
|
|||||||||||||
| Total assets |
$ | 105,659 | 11,518 | $ | — | $ | 117,177 | |||||||||||||
|
|
|
|
|
|
|
|
|
|||||||||||||
| Nonrecurring fair value measurements: |
||||||||||||||||||||
| Assets: |
||||||||||||||||||||
| Impaired assets (2)(3) |
$ | — | $ | — | $ | 189,600 | $ | 189,600 | $ | 860,441 | ||||||||||
|
|
|
|
|
|
|
|
|
|
|
|||||||||||
| (1) | Represents the aggregate impairment loss recognized for the year ended December 31, 2015 related to our 2015 Impaired Rigs. |
| (2) | Represents the book value of our 2015 Impaired Rigs, which were written down to their estimated recoverable amounts during 2015, of which $14.2 million and $175.4 million were reported as “Assets Held for Sale” and “Drilling and other property and equipment, net of accumulated depreciation,” respectively, in our Consolidated Balance Sheets at December 31, 2015. |
75
Table of Contents
| (3) | Excludes five rigs with an aggregate fair value of $2.4 million, which were impaired in 2015, but were subsequently sold for scrap during the year. |
| December 31, 2014 | ||||||||||||||||||||
| Fair Value Measurements Using | Assets at Fair Value |
Total Losses for Year Ended |
||||||||||||||||||
| Level 1 | Level 2 | Level 3 | ||||||||||||||||||
| (In thousands) | ||||||||||||||||||||
| Recurring fair value measurements: |
||||||||||||||||||||
| Assets: |
||||||||||||||||||||
| Short-term investments |
$ | 217,789 | $ | — | $ | — | $ | 217,789 | ||||||||||||
| Corporate bonds |
— | 15,899 | — | 15,899 | ||||||||||||||||
| Mortgage-backed securities |
— | 134 | — | 134 | ||||||||||||||||
|
|
|
|
|
|
|
|
|
|||||||||||||
| Total assets |
$ | 217,789 | $ | 16,033 | $ | — | $ | 233,822 | ||||||||||||
|
|
|
|
|
|
|
|
|
|||||||||||||
| Liabilities: |
||||||||||||||||||||
| FOREX contracts |
$ | — | $ | (5,439 | ) | $ | — | $ | (5,439 | ) | ||||||||||
| Nonrecurring fair value measurements: |
||||||||||||||||||||
| Assets: |
||||||||||||||||||||
| Impaired assets (1) |
$ | — | $ | — | $ | 9,421 | $ | 9,421 | $ | 109,462 | ||||||||||
|
|
|
|
|
|
|
|
|
|
|
|||||||||||
| (1) | Represents the book value as of December 31, 2014 of four of our 2014 Impaired Rigs, which were written down to their estimated recoverable amounts in September 2014 and had not yet been scrapped. All of these rigs were sold during 2015. |
We believe that the carrying amounts of our other financial assets and liabilities (excluding long-term debt), which are not measured at fair value in our Consolidated Balance Sheets, approximate fair value based on the following assumptions:
| • | Cash and cash equivalents – The carrying amounts approximate fair value because of the short maturity of these instruments. |
| • | Accounts receivable and accounts payable – The carrying amounts approximate fair value based on the nature of the instruments. |
| • | Commercial paper – The carrying amounts approximate fair value because of the short maturity of these instruments. |
We consider our senior notes, including current maturities, to be Level 2 liabilities under the GAAP fair value hierarchy and, accordingly, the fair value of our senior notes was derived using a third-party pricing service at December 31, 2015 and 2014. We perform control procedures over information we obtain from pricing services and brokers to test whether prices received represent a reasonable estimate of fair value. These procedures include the review of pricing service or broker pricing methodologies and comparing fair value estimates to actual trade activity executed in the market for these instruments occurring generally within a 10-day window of the report date. Fair values and related carrying values of our senior notes (see Note 10) are shown below.
| December 31, 2015 | December 31, 2014 | |||||||||||||||
| Fair Value | Carrying Value | Fair Value | Carrying Value | |||||||||||||
| (In millions) | ||||||||||||||||
| 4.875% Senior Notes due 2015 |
$ | — | $ | — | $ | 255.0 | $ | 250.0 | ||||||||
| 5.875% Senior Notes due 2019 |
506.8 | 499.7 | 544.9 | 499.6 | ||||||||||||
| 3.45% Senior Notes due 2023 |
208.0 | 249.2 | 232.0 | 249.1 | ||||||||||||
| 5.70% Senior Notes due 2039 |
360.0 | 497.0 | 478.5 | 497.0 | ||||||||||||
| 4.875% Senior Notes due 2043 |
455.3 | 748.9 | 638.9 | 748.8 | ||||||||||||
76
Table of Contents
We have estimated the fair value amounts by using appropriate valuation methodologies and information available to management. Considerable judgment is required in developing these estimates, and accordingly, no assurance can be given that the estimated values are indicative of the amounts that would be realized in a free market exchange.
9. Drilling and Other Property and Equipment
Cost and accumulated depreciation of drilling and other property and equipment are summarized as follows:
| December 31, | ||||||||
| 2015 | 2014 | |||||||
| (In thousands) | ||||||||
| Drilling rigs and equipment |
$ | 9,345,484 | $ | 10,555,314 | ||||
| Construction work-in-progress |
269,605 | 439,206 | ||||||
| Land and buildings |
64,775 | 66,989 | ||||||
| Office equipment and other |
71,537 | 70,591 | ||||||
|
|
|
|
|
|||||
| Cost |
9,751,401 | 11,132,100 | ||||||
| Less accumulated depreciation |
(3,372,587 | ) | (4,186,147 | ) | ||||
|
|
|
|
|
|||||
| Drilling and other property and equipment, net |
$ | 6,378,814 | $ | 6,945,953 | ||||
|
|
|
|
|
|||||
During the year ended December 31, 2015, we recognized an impairment loss of $860.4 million and transferred $14.2 million net book value of five of our non-working jack-up rigs to “Assets held for sale” in our Consolidated Balance Sheet at December 31, 2015. In addition, we sold nine rigs with an aggregate net book value of $5.2 million and recognized an aggregate gain on disposition of $3.5 million. See Notes 1 and 2.
Construction work-in-progress, including capitalized interest, at December 31, 2015 and 2014 is summarized as follows:
| December 31, | ||||||||
| 2015 | 2014 | |||||||
| (In thousands) | ||||||||
| Ultra-deepwater drillships – Ocean BlackLion |
$ | — | $ | 225,405 | ||||
| Ultra-deepwater semisubmersible – Ocean GreatWhite |
269,605 | 213,801 | ||||||
|
|
|
|
|
|||||
| Total construction work-in-progress |
$ | 269,605 | $ | 439,206 | ||||
|
|
|
|
|
|||||
The Ocean BlackLion was placed in service in June 2015 and is no longer reported as construction work-in-progress at December 31, 2015. See Note 12.
10. Credit Agreement and Senior Notes
Credit Agreement
We have a syndicated revolving credit agreement with Wells Fargo Bank, National Association, as administrative agent and swingline lender, which provides for a $1.5 billion senior unsecured revolving credit facility for general corporate purposes, or the Credit Agreement. Effective October 22, 2015, we entered into an extension agreement and fourth amendment to our Credit Agreement, which, among other things, provided for a one-year extension of the maturity date for most of the lenders. As so extended, our Credit Agreement matures on October 22, 2020, except for $40 million of commitments that mature on March 17, 2019 and $60 million of commitments that mature on October 22, 2019. In addition, we also have the option to increase the revolving commitments under the Credit Agreement by up to an additional $500 million from time to time, upon receipt of additional commitments from new or existing lenders, and to request one additional one-year extension of the
77
Table of Contents
maturity date. The entire amount of the facility is available, subject to its terms, for revolving loans. Up to $250 million of the facility may be used for the issuance of performance or other standby letters of credit and up to $100 million may be used for swingline loans. At December 31, 2015, 2014 and 2013, there were no amounts outstanding under the Credit Agreement.
Revolving loans under the Credit Agreement bear interest, at our option, at a rate per annum based on either an alternate base rate, or ABR, or a Eurodollar Rate, as defined in the Credit Agreement, plus the applicable interest margin for an ABR loan or a Eurodollar loan. The ABR is the greatest of (i) the prime rate, (ii) the federal funds rate plus 0.50% and (iii) the daily one-month Eurodollar Rate plus 1.00%. The applicable interest margin for ABR loans varies from 0% to 0.25%. The applicable interest margin for Eurodollar loans varies between 0.75% and 1.25%. Based on our current credit ratings, the applicable interest margin is 0.125% for ABR loans and 1.125% for Eurodollar loans.
Swingline loans bear interest, at our option, at a rate per annum equal to (i) the ABR plus the applicable interest margin for ABR loans or (ii) the daily one-month Eurodollar Rate plus the applicable interest margin for Eurodollar loans.
Under our Credit Agreement, we also pay, based on our current long-term credit ratings, and as applicable, other customary fees including, but not limited to, a commitment fee on the unused commitments under the Credit Agreement, varying between 0.06% and 0.20% per annum, and a fronting fee to the issuing bank for each letter of credit. Participation fees for letters of credit are dependent upon the type of letter of credit issued, varying between 0.375% and 0.625% per annum for performance letters of credit, and between 0.75% and 1.25% per annum for all other letters of credit. Based on our current credit ratings, the applicable commitment fee is 0.15%, and the participation fee for letters of credit is 0.5625%. Changes in credit ratings could lower or raise the fees that we pay under the Credit Agreement.
The Credit Agreement contains customary covenants including, but not limited to, maintenance of a ratio of consolidated indebtedness to total capitalization, as defined in the Credit Agreement, of not more than 60% at the end of each fiscal quarter, as well as limitations on liens; mergers, consolidations, liquidation and dissolution; changes in lines of business; swap agreements; transactions with affiliates; and subsidiary indebtedness. As of December 31, 2015, we were in compliance with all covenant requirements.
At December 31, 2015 and 2014, there were no amounts outstanding under the Credit Agreement. As of February 16, 2016, we had $305.0 million in Eurodollar loans outstanding under the Credit Agreement and an additional $1.2 billion available.
Commercial Paper
In 2015, we established a commercial paper program with four commercial paper dealers pursuant to which we may issue, on a private placement basis, unsecured commercial paper notes up to a maximum aggregate amount outstanding at any time of $1.5 billion and, unless we change the terms of the program, the aggregate amount of commercial paper notes and total loans and letters of credit outstanding under the Credit Agreement at any time will not exceed $1.5 billion. Proceeds from issuances under the commercial paper program may be used for general corporate purposes. The maturities of the notes may vary, but may not exceed 397 days from the date of issuance. The notes will be issued, at our option, either at a discounted price to their principal face value or will bear interest, which may be at a fixed or floating rate, at rates that will vary based on market conditions and the ratings assigned by credit rating agencies at the time of issuance. The notes are not redeemable or subject to voluntary prepayment by us prior to maturity. Liquidity for our payment obligations in respect of the notes issued under the commercial paper program is provided under our Credit Agreement, and the aggregate amount of notes outstanding at any time will not exceed the amount available under the Credit Agreement.
As of December 31, 2015, we had $286.6 million in commercial paper notes outstanding with a weighted average interest rate of 0.86% and a weighted average remaining term of 5.8 days. As of February 16, 2016, there were no commercial paper notes outstanding.
78
Table of Contents
Senior Notes
At December 31, 2015, our senior notes were comprised of the following debt issues:
| Principal Amount (In millions) |
Maturity Date | Interest Rate | Semiannual Interest Payment Dates | |||||||||||||
| Debt Issue |
Coupon | Effective | ||||||||||||||
| 5.875% Senior Notes due 2019 |
$ | 500.0 | May 1, 2019 | 5.875 | % | 5.89 | % | May 1 and November 1 | ||||||||
| 3.45% Senior Notes due 2023 |
$ | 250.0 | November 1, 2023 | 3.45 | % | 3.50 | % | May 1 and November 1 | ||||||||
| 5.70% Senior Notes due 2039 |
$ | 500.0 | October 15, 2039 | 5.70 | % | 5.75 | % | April 15 and October 15 | ||||||||
| 4.875% Senior Notes due 2043 |
$ | 750.0 | November 1, 2043 | 4.875 | % | 4.89 | % | May 1 and November 1 | ||||||||
At December 31, 2015 and 2014, the carrying value of our senior notes was as follows:
| December 31, | ||||||||
| 2015 | 2014 | |||||||
| (In thousands) | ||||||||
| 4.875% Senior Notes due 2015 |
$ | — | $ | 249,962 | ||||
| 5.875% Senior Notes due 2019 |
499,705 | 499,626 | ||||||
| 3.45% Senior Notes due 2023 |
249,169 | 249,077 | ||||||
| 5.70% Senior Notes due 2039 |
497,030 | 496,973 | ||||||
| 4.875% Senior Notes due 2043 |
748,869 | 748,850 | ||||||
|
|
|
|
|
|||||
| Total senior notes, net of unamortized discount |
$ | 1,994,773 | $ | 2,244,488 | ||||
| Less: Current portion of long-term debt |
— | 249,962 | ||||||
|
|
|
|
|
|||||
| Total Long-term debt |
$ | 1,994,773 | $ | 1,994,526 | ||||
|
|
|
|
|
|||||
As of December 31, 2015, the aggregate annual maturity of our senior notes was as follows:
| Aggregate Principal Amount |
||||
| (In thousands) | ||||
| Year Ending December 31, |
||||
| 2016 |
$ | — | ||
| 2017 |
— | |||
| 2018 |
— | |||
| 2019 |
500,000 | |||
| 2020 |
— | |||
| Thereafter |
1,500,000 | |||
|
|
|
|||
| Total maturities of senior notes |
2,000,000 | |||
| Less: unamortized discounts |
(5,227 | ) | ||
|
|
|
|||
| Total maturities of senior notes, net of unamortized discount |
$ | 1,994,773 | ||
|
|
|
|||
Senior Notes Due 2023 and 2043. In 2013, we issued $1.0 billion aggregate principal amount of senior notes consisting of $250.0 million aggregate principal amount of 3.45% senior unsecured notes due 2023 and $750.0 million aggregate principal amount of 4.875% senior unsecured notes due 2043 or, collectively, the Senior Notes Due 2023 and 2043, for general corporate purposes, including redemption, repurchase or retirement of our 5.15% senior notes due September 1, 2014 and our 4.875% senior notes due July 1, 2015, or 2015 Notes. The transaction resulted in net proceeds to us of $987.8 million after deducting underwriting discounts, commissions and estimated expenses.
The Senior Notes Due 2023 and 2043 are unsecured and unsubordinated obligations of Diamond Offshore Drilling, Inc., and rank equally in right of payment to all of its existing and future unsecured and unsubordinated
79
Table of Contents
indebtedness, and are effectively subordinated to all existing and future obligations of our subsidiaries. We have the right to redeem all or a portion of the Senior Notes Due 2023 and 2043 for cash at any time or from time to time, on at least 15 days but not more than 60 days prior written notice, at a make-whole redemption price specified in the governing indenture (if applicable) plus accrued and unpaid interest to, but excluding, the date of redemption.
Senior Notes Due 2019 and 2039. Our 5.875% Senior Notes due 2019 and 5.70% Senior Notes due 2039 are unsecured and unsubordinated obligations of Diamond Offshore Drilling, Inc. and rank equally in right of payment to its existing and future unsecured and unsubordinated indebtedness, and are effectively subordinated to all existing and future obligations of our subsidiaries. We have the right to redeem all or a portion of these notes for cash at any time or from time to time, on at least 15 days but not more than 60 days prior written notice, at the redemption price specified in the governing indenture plus accrued and unpaid interest to the date of redemption.
2015 Maturities. On July 1, 2015, we repaid $250.0 million in aggregate principal amount of our 4.875% Senior Notes due July 1, 2015, primarily with funds obtained through the issuance of commercial paper. These notes were presented as “Current portion of long-term debt” in our Consolidated Balance Sheet at December 31, 2014.
11. Other Comprehensive Income (Loss)
The following table sets forth the components of “Other comprehensive income (loss)” and the related income tax effects thereon for the three years ended December 31, 2015 and the cumulative balances in AOCGL by component at December 31, 2015, 2014 and 2013.
| Unrealized (Loss) Gain on | Total AOCGL |
|||||||||||
| Derivative Financial Instruments |
Marketable Securities |
|||||||||||
| (In thousands) | ||||||||||||
| Balance at January 1, 2013 |
$ | 2,350 | $ | 146 | $ | 2,496 | ||||||
| Change in other comprehensive (loss) gain before reclassifications, after tax of $3,682 and $18 |
(6,833 | ) | (6 | ) | (6,839 | ) | ||||||
| Reclassification adjustments for items included in Net Income, after tax of $(2,608) and $18 |
4,840 | (147 | ) | 4,693 | ||||||||
|
|
|
|
|
|
|
|||||||
| Total other comprehensive (loss) income |
(1,993 | ) | (153 | ) | (2,146 | ) | ||||||
|
|
|
|
|
|
|
|||||||
| Balance at December 31, 2013 |
357 | (7 | ) | 350 | ||||||||
| Change in other comprehensive (loss) gain before reclassifications, after tax of $799 and $(15) |
(1,482 | ) | (69 | ) | (1,551 | ) | ||||||
| Reclassification adjustments for items included in Net Income, after tax of $1,279 and $7 |
(2,379 | ) | (25 | ) | (2,404 | ) | ||||||
|
|
|
|
|
|
|
|||||||
| Total other comprehensive (loss) income |
(3,861 | ) | (94 | ) | (3,955 | ) | ||||||
|
|
|
|
|
|
|
|||||||
| Balance at December 31, 2014 |
(3,504 | ) | (101 | ) | (3,605 | ) | ||||||
| Change in other comprehensive (loss) gain before reclassifications, after tax of $846 and $(1) |
(1,574 | ) | (4,940 | ) | (6,514 | ) | ||||||
| Reclassification adjustments for items included in Net Income, after tax of $(2,737) and $0 |
5,084 | — | 5,084 | |||||||||
|
|
|
|
|
|
|
|||||||
| Total other comprehensive income (loss) |
3,510 | (4,940 | ) | (1,430 | ) | |||||||
|
|
|
|
|
|
|
|||||||
| Balance at December 31, 2015 |
$ | 6 | $ | (5,041 | ) | $ | (5,035 | ) | ||||
|
|
|
|
|
|
|
|||||||
80
Table of Contents
The following table presents the line items in our Consolidated Statements of Operations affected by reclassification adjustments out of AOCGL.
| Major Components of AOCGL | Year Ended December 31, | Consolidated Statements of | ||||||||||||
| 2015 | 2014 | 2013 | ||||||||||||
| (In thousands) | ||||||||||||||
| Derivative financial instruments: |
||||||||||||||
| Unrealized loss (gain) on FOREX contracts |
$ | 7,829 | $ | (3,650 | ) | $ | 7,449 | Contract drilling, excluding depreciation | ||||||
| Unrealized (gain) loss on Treasury Lock Agreements |
(8 | ) | (8 | ) | (1 | ) | Interest expense | |||||||
| (2,737 | ) | 1,279 | (2,608 | ) | Income tax expense | |||||||||
|
|
|
|
|
|
|
|||||||||
| $ | 5,084 | $ | (2,379 | ) | $ | 4,840 | Net of tax | |||||||
|
|
|
|
|
|
|
|||||||||
| Marketable securities: |
||||||||||||||
| Unrealized (gain) loss on marketable securities |
$ | — | $ | (32 | ) | $ | (165 | ) | Other, net | |||||
| — | 7 | 18 | Income tax expense | |||||||||||
|
|
|
|
|
|
|
|||||||||
| $ | — | $ | (25 | ) | $ | (147 | ) | Net of tax | ||||||
|
|
|
|
|
|
|
|||||||||
12. Commitments and Contingencies
Various claims have been filed against us in the ordinary course of business, including claims by offshore workers alleging personal injuries. With respect to each claim or exposure, we have made an assessment, in accordance with GAAP, of the probability that the resolution of the matter would ultimately result in a loss. When we determine that an unfavorable resolution of a matter is probable and such amount of loss can be determined, we record a liability for the amount of the estimated loss at the time that both of these criteria are met. Our management believes that we have recorded adequate accruals for any liabilities that may reasonably be expected to result from these claims.
Asbestos Litigation. We are one of several unrelated defendants in lawsuits filed in Mississippi, Louisiana and Missouri state courts alleging that defendants manufactured, distributed or utilized drilling mud containing asbestos and, in our case, allowed such drilling mud to have been utilized aboard our offshore drilling rigs. The plaintiffs seek, among other things, an award of unspecified compensatory and punitive damages. The manufacture and use of asbestos-containing drilling mud had already ceased before we acquired any of the drilling rigs addressed in these lawsuits. We believe that we are not liable for the damages asserted and we expect to receive complete defense and indemnity from Murphy Exploration & Production Company with respect to many of the lawsuits pursuant to the terms of our 1992 asset purchase agreement with them. We also believe that we are not liable for the damages asserted in the remaining lawsuits pursuant to the terms of our 1989 asset purchase agreement with Diamond M Corporation, and we filed a declaratory judgment action in Texas state court against NuStar Energy LP, or NuStar, and Kaneb Management Co., L.L.C., or Kaneb, the successors to Diamond M Corporation, seeking a judicial determination that we did not assume liability for these claims. We are unable to estimate our potential exposure, if any, to these lawsuits at this time but do not believe that our ultimate liability, if any, resulting from this litigation will have a material effect on our consolidated financial condition, results of operations or cash flows.
Other Litigation. We have been named in various other claims, lawsuits or threatened actions that are incidental to the ordinary course of our business, including a claim by Petrobras that it will seek to recover from its contractors, including us, any taxes, penalties, interest and fees that it must pay to the Brazilian tax authorities for our applicable portion of withholding taxes related to Petrobras’ charter agreements with its contractors. We intend to defend these matters vigorously; however, litigation is inherently unpredictable, and the ultimate outcome or effect of these claims, lawsuits and actions cannot be predicted with certainty. As a result, there can be no assurance as to the ultimate outcome of these matters. Any claims against us, whether meritorious or not,
81
Table of Contents
could cause us to incur costs and expenses, require significant amounts of management time and result in the diversion of significant operational resources. In the opinion of our management, no pending or known threatened claims, actions or proceedings against us are expected to have a material adverse effect on our consolidated financial position, results of operations or cash flows.
NPI Arrangement. We received customer payments measured by a percentage net profits interest (primarily of 27%) under an overriding royalty interest in certain developmental oil-and-gas producing properties, or NPI, which we believe is a real property interest. Our drilling program related to the NPI was completed in 2011, and the balance of the amounts due to us under the NPI was received in 2013. However, the customer that conveyed the NPI to us filed a voluntary petition for reorganization under Chapter 11 of the Bankruptcy Code in August 2012. Certain parties (including the debtor) in the bankruptcy proceedings questioned whether our NPI, and certain amounts we received under it since the filing of the bankruptcy, should be included in the debtor’s estate under the bankruptcy proceeding. In 2013, we filed a declaratory judgment action in the bankruptcy court seeking a declaration that our NPI, and payments that we received from it since the filing of the bankruptcy, are not part of the bankruptcy estate. We agreed to a settlement with the company that purchased most of the debtor’s assets (including the debtor’s claims against our NPI) whereby the nature of our NPI will not be challenged by that party and our declaratory judgment action was dismissed. Following the settlement, the bankruptcy was converted to a Chapter 7 liquidation proceeding. Several lienholders who had previously intervened in the declaratory judgment action filed motions in the bankruptcy contending that their liens have priority and seeking disgorgement of $3.25 million of payments made to us after the bankruptcy was filed. We believe that our rights to the payments at issue are superior to these liens, and we have filed appropriate motions to dismiss these claims. In addition, the bankruptcy trustee filed counterclaims seeking disgorgement of a total of $30.0 million of pre- and post-bankruptcy payments made to us under the original NPI. We have filed motions to dismiss these counterclaims and still expect the bankruptcy proceedings to be concluded with no further material impact to us.
Personal Injury Claims. Under our current insurance policies, our deductibles for marine liability insurance coverage, including personal injury claims, which primarily result from Jones Act liability in the Gulf of Mexico, are $25.0 million for the first occurrence, with no aggregate deductible, and vary in amounts ranging between $5.0 million and, if aggregate claims exceed certain thresholds, up to $100.0 million for each subsequent occurrence, depending on the nature, severity and frequency of claims that might arise during the policy year.
The Jones Act is a federal law that permits seamen to seek compensation for certain injuries during the course of their employment on a vessel and governs the liability of vessel operators and marine employers for the work-related injury or death of an employee. We engage outside consultants to assist us in estimating our aggregate liability for personal injury claims based on our historical losses and utilizing various actuarial models. We allocate a portion of the aggregate liability to “Accrued liabilities” based on an estimate of claims expected to be paid within the next twelve months with the residual recorded as “Other liabilities.” At December 31, 2015 our estimated liability for personal injury claims was $40.4 million, of which $8.2 million and $32.2 million were recorded in “Accrued liabilities” and “Other liabilities,” respectively, in our Consolidated Balance Sheets. At December 31, 2014, our estimated liability for personal injury claims was $39.4 million, of which $8.2 million and $31.2 million were recorded in “Accrued liabilities” and “Other liabilities,” respectively, in our Consolidated Balance Sheets. The eventual settlement or adjudication of these claims could differ materially from our estimated amounts due to uncertainties such as:
| • | the severity of personal injuries claimed; |
| • | significant changes in the volume of personal injury claims; |
| • | the unpredictability of legal jurisdictions where the claims will ultimately be litigated; |
| • | inconsistent court decisions; and |
| • | the risks and lack of predictability inherent in personal injury litigation. |
82
Table of Contents
Purchase Obligations. The Ocean GreatWhite, a 10,000 foot dynamically positioned, harsh environment semisubmersible drilling rig, is under construction in South Korea at an estimated cost of $764 million, including shipyard costs, capital spares, commissioning, project management and shipyard supervision. The contracted price to Hyundai Heavy Industries Co., Ltd. totaling $628.5 million is payable in two installments, of which the first installment of $188.6 million has been paid. The final installment of $439.9 million is due upon delivery of the rig, which is expected to occur in mid-2016.
At December 31, 2015, we had no other purchase obligations for major rig upgrades or any other significant obligations, except for those related to our direct rig operations, which arise during the normal course of business.
Operating Leases. We lease office and yard facilities, housing, equipment and vehicles under operating leases, which expire at various times through the year 2018. Total rent expense amounted to $7.8 million, $10.6 million and $13.5 million for the years ended December 31, 2015, 2014 and 2013, respectively. Future minimum rental payments under leases are approximately $2.7 million, $1.3 million and $0.4 million for the years 2016, 2017 and 2018, respectively. There are no minimum future rental payments under operating leases after 2018.
Letters of Credit and Other. We were contingently liable as of December 31, 2015 in the amount of $71.6 million under certain performance, supersedeas, bid, tax and customs bonds and letters of credit. Agreements relating to approximately $64.0 million of performance, tax, supersedeas, court and customs bonds can require collateral at any time. As of December 31, 2015, we had not been required to make any collateral deposits with respect to these agreements. The remaining agreements cannot require collateral except in events of default. On our behalf, banks have issued letters of credit securing certain of these bonds.
13. Related-Party Transactions
Transactions with Loews. We are party to a services agreement with Loews, or the Services Agreement, pursuant to which Loews performs certain administrative and technical services on our behalf. Such services include personnel, internal auditing, accounting, and cash management services, in addition to advice and assistance with respect to preparation of tax returns and obtaining insurance. Under the Services Agreement, we are required to reimburse Loews for (i) allocated personnel costs (such as salaries, employee benefits and payroll taxes) of the Loews personnel actually providing such services and (ii) all out-of-pocket expenses related to the provision of such services. The Services Agreement may be terminated at our option upon 30 days’ notice to Loews and at the option of Loews upon six months’ notice to us. In addition, we have agreed to indemnify Loews for all claims and damages arising from the provision of services by Loews under the Services Agreement unless due to the gross negligence or willful misconduct of Loews. We were charged $1.3 million, $1.1 million and $1.0 million by Loews for these support functions during the years ended December 31, 2015, 2014 and 2013, respectively.
Transactions with Other Related Parties. We hire marine vessels and helicopter transportation services at the prevailing market rate from subsidiaries of SEACOR Holdings Inc. and Era Group Inc. The Executive Chairman of the Board of Directors of SEACOR Holdings Inc. and the Non-Executive Chairman of the Board of Directors of Era Group Inc. is also a member of our Board of Directors. We paid $6.0 million, $0.8 million and $0.1 million for the hire of such vessels and such services during the years ended December 31, 2015, 2014 and 2013, respectively.
The wife of our former President and Chief Executive Officer was an audit partner at Ernst & Young LLP, or E&Y, during his term of service with us. For the year ended December 31, 2014, we made payments aggregating $2.9 million to E&Y for tax and other consulting services; however, E&Y ceased to be a related party on March 3, 2014. For the year ended December 31, 2013, we made payments to E&Y of $1.6 million.
83
Table of Contents
14. Restructuring and Separation Costs
During 2015, in response to the continuing decline in the offshore drilling market, we reviewed our cost and organization structure, and, as a result, our management approved and initiated a reduction in workforce at our onshore bases and corporate facilities, also referred to as the Corporate Reduction Plan. As of December 31, 2015, appropriate communications had been made to substantially all impacted personnel, and we paid $9.8 million in restructuring and employee separation related costs during 2015. There were no accrued costs associated with the Corporate Reduction Plan as of December 31, 2015.
15. Income Taxes
Our income tax expense is a function of the mix between our domestic and international pre-tax earnings or losses, as well as the mix of international tax jurisdictions in which we operate. Certain of our international rigs are owned and operated, directly or indirectly, by Diamond Foreign Asset Company, or DFAC, a Cayman Islands subsidiary that we own. It is our intention to indefinitely reinvest future earnings of DFAC and its foreign subsidiaries to finance foreign activities. Accordingly, we have not made a provision for U.S. income taxes on approximately $2.0 billion of undistributed foreign earnings and profits. Although we do not intend to repatriate the earnings of our foreign subsidiary, and have not provided U.S. income taxes for such earnings, except to the extent that such earnings were immediately subject to U.S. income taxes, these earnings could become subject to U.S. income tax if remitted, or if deemed remitted as a dividend; however, it is not practical to estimate this potential liability.
The components of income tax expense (benefit) are as follows:
| Year Ended December 31, | ||||||||||||
| 2015 | 2014 | 2013 | ||||||||||
| (In thousands) | ||||||||||||
| Federal – current |
$ | 63,223 | $ | 66,843 | $ | 40,045 | ||||||
| State – current |
93 | (121 | ) | 69 | ||||||||
| Foreign – current |
71,656 | 59,926 | 151,339 | |||||||||
|
|
|
|
|
|
|
|||||||
| Total current |
134,972 | 126,648 | 191,453 | |||||||||
|
|
|
|
|
|
|
|||||||
| Federal – deferred |
(245,045 | ) | (6,699 | ) | 46,767 | |||||||
| Foreign – deferred |
3,010 | 8,231 | (12,666 | ) | ||||||||
|
|
|
|
|
|
|
|||||||
| Total deferred |
(242,035 | ) | 1,532 | 34,101 | ||||||||
|
|
|
|
|
|
|
|||||||
| Total |
$ | (107,063 | ) | $ | 128,180 | $ | 225,554 | |||||
|
|
|
|
|
|
|
|||||||
84
Table of Contents
The difference between actual income tax expense and the tax provision computed by applying the statutory federal income tax rate to income before taxes is attributable to the following:
| Year Ended December 31, | ||||||||||||
| 2015 | 2014 | 2013 | ||||||||||
| (In thousands) | ||||||||||||
| Income before income tax expense: |
||||||||||||
| U.S. |
$ | (11,158 | ) | $ | 288,080 | $ | 537,635 | |||||
| Foreign |
(370,190 | ) | 227,111 | 236,605 | ||||||||
|
|
|
|
|
|
|
|||||||
| Worldwide |
$ | (381,348 | ) | $ | 515,191 | $ | 774,240 | |||||
|
|
|
|
|
|
|
|||||||
| Expected income tax expense at federal statutory rate |
$ | (133,472 | ) | $ | 180,317 | $ | 270,984 | |||||
| Foreign earnings of foreign subsidiaries (not taxed at the statutory federal income tax rate) net of related foreign taxes |
(5,518 | ) | (46,163 | ) | (102,359 | ) | ||||||
| Foreign earnings of foreign subsidiaries for which U.S. federal income taxes have been provided |
9 | 7,190 | 805 | |||||||||
| Foreign taxes of domestic and foreign subsidiaries for which U.S. federal income taxes have also been provided |
27,193 | 38,358 | 45,428 | |||||||||
| Foreign tax credits |
(26,590 | ) | (39,843 | ) | (46,524 | ) | ||||||
| Interest capitalized by foreign subsidiaries |
(5,708 | ) | (16,492 | ) | (18,391 | ) | ||||||
| Impact of American Taxpayer Relief Act of 2012 |
— | — | (27,509 | ) | ||||||||
| Uncertain tax positions |
1,169 | (47,964 | ) | 66,085 | ||||||||
| Amortization of deferred charges associated with intercompany rig sales to other tax jurisdictions |
38,466 | 44,301 | 30,894 | |||||||||
| Net expense (benefit) in connection with resolutions of tax issues and adjustments relating to prior years |
(2,283 | ) | 7,775 | 4,804 | ||||||||
| Other |
(329 | ) | 701 | 1,337 | ||||||||
|
|
|
|
|
|
|
|||||||
| Income tax expense |
$ | (107,063 | ) | $ | 128,180 | $ | 225,554 | |||||
|
|
|
|
|
|
|
|||||||
85
Table of Contents
Deferred Income Taxes. Significant components of our deferred income tax assets and liabilities are as follows:
| December 31, | ||||||||
| 2015 | 2014 | |||||||
| (In thousands) | ||||||||
| Deferred tax assets: |
||||||||
| Net operating loss carryforwards, or NOLs |
$ | 143,231 | $ | 20,277 | ||||
| Foreign tax credits |
33,699 | 17,962 | ||||||
| Worker’s compensation and other current accruals |
19,888 | 19,155 | ||||||
| Bareboat charter deductions |
32,469 | 21,898 | ||||||
| UK depreciation deduction |
17,358 | — | ||||||
| Disputed receivables reserved |
3,109 | 2,438 | ||||||
| Deferred compensation |
5,362 | 14,409 | ||||||
| Foreign contribution taxes |
3,630 | 5,345 | ||||||
| Stock compensation awards |
11,294 | 10,627 | ||||||
| Deferred deductions |
14,185 | 12,196 | ||||||
| Interest – Uncertain Tax Positions |
1,153 | 1,011 | ||||||
| Other |
2,089 | 2,244 | ||||||
|
|
|
|
|
|||||
| Total deferred tax assets (1) |
287,467 | 127,562 | ||||||
| Valuation allowance for NOLs |
(93,191 | ) | (20,277 | ) | ||||
| Valuation allowance for foreign tax credits |
— | (516 | ) | |||||
| Valuation allowance for other deferred tax assets |
(53,456 | ) | (27,243 | ) | ||||
|
|
|
|
|
|||||
| Net deferred tax assets |
140,820 | 79,526 | ||||||
|
|
|
|
|
|||||
| Deferred tax liabilities: |
||||||||
| Depreciation |
(372,334 | ) | (577,103 | ) | ||||
| Mobilization |
(30,990 | ) | (10,655 | ) | ||||
| Unbilled revenue |
(13,971 | ) | (6,518 | ) | ||||
| Undistributed earnings of foreign subsidiaries |
(50 | ) | (24 | ) | ||||
| Other |
(4 | ) | (8 | ) | ||||
|
|
|
|
|
|||||
| Total deferred tax liabilities |
(417,349 | ) | (594,308 | ) | ||||
|
|
|
|
|
|||||
| Net deferred tax liability |
$ | (276,529 | ) | $ | (514,782 | ) | ||
|
|
|
|
|
|||||
| (1) | In 2015, we adopted ASU 2015-17, as allowed by the standard. In order to reduce the complexity of our financial statements we are no longer separating deferred income liabilities and assets into current and noncurrent classifications. Prior periods were not retrospectively adjusted and accordingly, at December 31, 2014, $15.6 million was reflected in “Prepaid expenses and other current assets” in our Consolidated Balance Sheets. See Notes 1 and 3. |
86
Table of Contents
We record a valuation allowance to derecognize a portion of our deferred tax assets, which we do not expect to be ultimately realized. A summary of changes in the valuation allowance is as follows:
| For the Year Ended December 31, | ||||||||||||
| 2015 | 2014 | 2013 | ||||||||||
| (In thousands) | ||||||||||||
| Valuation allowance as of January 1 |
$ | 48,036 | $ | 7,321 | $ | 22,876 | ||||||
| Establishment of valuation allowances: |
||||||||||||
| Net operating losses |
82,155 | 15,677 | 25 | |||||||||
| Foreign tax credits |
— | 516 | — | |||||||||
| Other deferred tax assets |
27,928 | 27,243 | — | |||||||||
| Releases of valuation allowances in various jurisdictions |
(11,472 | ) | (2,721 | ) | (15,580 | ) | ||||||
|
|
|
|
|
|
|
|||||||
| Valuation allowance as of December 31 |
$ | 146,647 | $ | 48,036 | $ | 7,321 | ||||||
|
|
|
|
|
|
|
|||||||
Net Operating Loss Carryforwards – As of December 31, 2015, we had recorded a deferred tax asset of $143.2 million for the benefit of NOL carryforwards; $49.3 million related to our U.S. losses and $93.9 million related to our international operations. Approximately $28.6 million of this deferred tax asset relates to NOL carryforwards that have an indefinite life. The remaining $114.6 million relates to NOL carryforwards of our subsidiaries in Mexico, Hungary and the United States. Unless utilized, tax benefits of NOL carryforwards will expire between 2020 and 2035 as follows:
| Year Expiring |
Tax Benefit of NOL Carryforwards (In millions) |
|||
| 2020 |
$ | 56.1 | ||
| 2021 |
0.2 | |||
| 2022 |
0.1 | |||
| 2023 |
0.1 | |||
| 2024 |
— | |||
| 2025 |
8.8 | |||
| 2035 |
49.3 | |||
|
|
|
|||
| Total |
$ | 114.6 | ||
|
|
|
|||
As of December 31, 2015, a valuation allowance for $93.2 million has been recorded for our NOLs for which the deferred tax assets are not likely to be realized.
Foreign Tax Credits. As of December 31, 2015, we had recorded a deferred tax asset of $33.7 million for the benefit of foreign tax credits in the U.S. Unless utilized, our excess foreign tax credits in the U.S. will expire in 2024 and 2025 as follows:
| Year Expiring |
Foreign Tax Credits (In millions) |
|||
| 2024 |
$ | 4.8 | ||
| 2025 |
28.9 | |||
|
|
|
|||
| Total |
$ | 33.7 | ||
|
|
|
|||
As of December 31, 2015, no valuation allowance has been recorded for our foreign tax credits.
87
Table of Contents
Valuation Allowances – Other Deferred Tax Assets. As of December 31, 2015, we recorded valuation allowances for other deferred tax assets as follows:
| Deferred Tax Asset |
Valuation Allowance (In millions) |
|||
| Bareboat charter deductions in the UK |
$ | 32.5 | ||
| Depreciation deduction in the UK |
17.4 | |||
| Foreign contribution taxes in Brazil |
3.6 | |||
|
|
|
|||
| Total |
$ | 53.5 | ||
|
|
|
|||
Unrecognized Tax Benefits. Our income tax returns are subject to review and examination in the various jurisdictions in which we operate and we are currently contesting various tax assessments. We accrue for income tax contingencies, or uncertain tax positions, that we believe are more likely than not exposures. A reconciliation of the beginning and ending amount of unrecognized tax benefits, gross of tax carryforwards and excluding interest and penalties, is as follows:
| For the Year Ended December 31, | ||||||||||||
| 2015 | 2014 | 2013 | ||||||||||
| (In thousands) | ||||||||||||
| Balance, beginning of period |
$ | (57,116 | ) | $ | (90,921 | ) | $ | (67,150 | ) | |||
| Additions for current year tax positions |
(7,013 | ) | (5,813 | ) | (1,724 | ) | ||||||
| Additions for prior year tax positions |
(82 | ) | (292 | ) | (31,264 | ) | ||||||
| Reductions for prior year tax positions |
2,673 | 34,630 | 7,280 | |||||||||
| Reductions related to statute of limitation expirations |
7,586 | 5,280 | 1,937 | |||||||||
|
|
|
|
|
|
|
|||||||
| Balance, end of period |
$ | (53,952 | ) | $ | (57,116 | ) | $ | (90,921 | ) | |||
|
|
|
|
|
|
|
|||||||
At December 31, 2015, $2.8 million, $1.9 million and $50.3 million of the net liability for uncertain tax positions were reflected in “Other assets,” “Deferred tax liability” and “Other liabilities,” respectively. At December 31, 2014, $4.9 million and $55.4 million of the net liability for uncertain tax positions were reflected in “Other assets” and “Other liabilities,” respectively. Of the net unrecognized tax benefits at December 31, 2015, 2014 and 2013, all $49.4 million, $50.5 million and $76.3 million, respectively, would affect the effective tax rates if recognized.
The following table presents the amount of accrued interest and penalties at December 31, 2015 and 2014 related to uncertain tax positions:
| December 31, | ||||||||
| 2015 | 2014 | |||||||
| (In thousands) | ||||||||
| Uncertain tax positions net, excluding interest and penalties |
$ | (49,380 | ) | $ | (50,513 | ) | ||
| Accrued interest on uncertain tax positions |
(2,743 | ) | (7,503 | ) | ||||
| Accrued penalties on uncertain tax positions |
(39,924 | ) | (37,622 | ) | ||||
|
|
|
|
|
|||||
| Uncertain tax positions net, including interest and penalties |
$ | (92,047 | ) | $ | (95,638 | ) | ||
|
|
|
|
|
|||||
88
Table of Contents
We record interest related to accrued uncertain tax positions in interest expense and recognize penalties associated with uncertain tax positions in tax expense. Interest expense and penalties recognized during the three years ended December 31, 2015 related to uncertain tax positions are as follows:
| For the Year Ended December 31, | ||||||||||||
| 2015 | 2014 | 2013 | ||||||||||
| (In thousands) | ||||||||||||
| Net increase (decrease) in interest expense related to unrecognized tax positions |
$ | (4,761 | ) | $ | (5,283 | ) | $ | 5,758 | ||||
| Net increase (decrease) in penalties related to unrecognized tax positions |
2,302 | (22,175 | ) | 38,136 | ||||||||
In several of the international locations in which we operate, certain of our wholly-owned subsidiaries enter into agreements with other of our wholly-owned subsidiaries to provide specialized services and equipment in support of our foreign operations. We apply a transfer pricing methodology to determine the amount to be charged for providing the services and equipment. In most cases, there are alternative transfer pricing methodologies that could be applied to these transactions and, if applied, could result in different chargeable amounts. Taxing authorities in the various foreign locations in which we operate could apply one of the alternative transfer pricing methodologies which could result in an increase to our income tax liabilities with respect to tax returns that remain subject to examination.
We expect the statute of limitations for the 2010 tax year to expire in 2016 for one of our subsidiaries operating in Mexico, and we anticipate that the related unrecognized tax benefit will decrease by $0.7 million at that time.
Tax Returns and Examinations. We file income tax returns in the U.S. federal jurisdiction, various state jurisdictions and various foreign jurisdictions. Tax years that remain subject to examination by these jurisdictions include years 2009 to 2015. We are currently under audit in several of these jurisdictions. We do not anticipate that any adjustments resulting from the tax audit of any of these years will have a material impact on our consolidated results of operations, financial condition or cash flows.
U.S. Jurisdiction. Our 2013 tax year is currently under audit by the U.S. Internal Revenue Service.
Brazil Tax Jurisdiction. In December 2009, we received an assessment of approximately $26.0 million for the years 2004 and 2005, including interest and penalty. We contested the tax assessment in 2010 and, during the third quarter of 2014, received a favorable court decision resulting in the closure of the 2004 and 2005 tax years. As a consequence, we reversed our $14.0 million reserve for this uncertain tax position, of which $3.5 million was interest and $4.4 million was penalty.
In March 2013, the Brazilian tax authorities began an audit of our income tax returns for the years 2009 and 2010. The tax audit is still ongoing.
In February 2012, the tax authorities concluded their audit of our income tax return for the 2007 tax year for which we received an assessment of approximately $17.1 million for income tax, including interest and penalties. We contested the assessment and a court in Brazil ruled to cancel the assessment. However, the Brazilian tax authorities have appealed the ruling, and we are awaiting the outcome of the appeal. We have not accrued any tax expense related to this assessment.
In addition, the Brazilian tax authorities have issued an assessment for the 2000 tax year of approximately $1.5 million, including interest and penalty. We have appealed the tax assessment and are awaiting the outcome of the appeal.
Egypt Tax Jurisdiction. During 2013, we were under audit by the Egyptian tax authorities for the tax years 2006 through 2010. In 2013, after receiving notification that the Egyptian government had concluded the income
89
Table of Contents
tax audit for the period 2006 to 2008 and proposed a $1.2 billion increase to taxable income, we accrued an additional $56.9 million of expense for uncertain tax positions in Egypt for all open years. During the first quarter of 2014, we settled certain disputes for the years 2006 through 2008 with the Egyptian tax authorities, which resulted in an aggregate $17.2 million reduction in tax expense, comprised of a $23.2 million reversal of uncertain tax positions, partially offset by $6.0 million in current foreign income tax expense. One issue for the 2006 through 2008 period remains open, which we appealed. Our court case is scheduled to occur in the first quarter of 2016. We have sought assistance from an agency of the U.S. Treasury Department, pursuant to international tax treaties, and continue to believe that our position will, more likely than not, be sustained. However, if our position is not sustained, tax expense and related penalties would increase by approximately $53 million related to this issue for the 2006 through 2008 tax years as of December 31, 2015.
We are currently also under audit by the Egyptian tax authorities for the tax years 2009 through 2012.
Malaysia Tax Jurisdiction. During the third quarter of 2014, we received final approval from the Malaysian tax authorities for the settlement of tax liabilities and penalties for the years 2003 through 2008 resulting in the reversal of a $14.2 million reserve for uncertain tax positions for these years, of which $5.3 million was penalty.
Mexico Tax Jurisdiction. During the year ended December 31, 2015, the statute of limitations for the 2008 tax year related to an uncertain tax position expired and we reversed our $3.8 million tax accrual, of which $1.3 million was interest and $0.5 million was penalty. In addition, the statute of limitations for the 2009 tax year related to an uncertain tax position expired, and we reversed our $10.7 million tax accrual, of which $3.6 million was interest and $1.4 million was penalty.
In August 2015, the Mexican tax authorities completed an audit for the 2008 tax year for one of our subsidiaries operating in Mexico and issued an assessment in the amount of $5.3 million, including interest and penalty. We have appealed the tax assessment and are awaiting the outcome of the appeal. We have not accrued any tax expense related to this assessment. In June 2015, the Mexican tax authorities initiated an audit of the 2009 income tax return of one of our other subsidiaries operating in Mexico.
Due to the 2014 expiration of the statute of limitations in Mexico for the 2008 tax year for one of our subsidiaries operating in Mexico, we reversed our $8.0 million accrual for an uncertain tax position, of which $2.7 million was interest and $1.1 million was penalty, during the year ended December 31, 2014.
The tax authorities in Mexico previously audited our income tax returns for the years 2004 and 2006 and had issued assessments for tax years 2004 and 2006 of approximately $22.9 million and $24.4 million, respectively, including interest and penalties, which we had appealed. In 2013 the Mexican tax authorities initiated a tax amnesty program whereby income tax assessments, including penalties and interest, could be partially or completely waived. Under the tax amnesty, we were able to settle our tax liabilities for the years 2004 and 2006 for a net cash cost of $3.7 million. As a result of increases in uncertain tax positions for later years, we recorded an additional $13.2 million of expense, including $5.0 million of interest and $2.7 million of penalties, during the year ended December 31, 2013.
Due to the expiration of the statute of limitations in Mexico for the 2007 tax year, during the second quarter of 2013, we reversed our $4.3 million accrual for this uncertain tax position, of which $1.5 million was interest and $0.6 million was penalty.
Australia Jurisdiction. We are currently under audit for tax years 2010 through 2013.
American Taxpayer Relief Act of 2012. The American Taxpayer Relief Act of 2012, or the Act, was signed into law on January 2, 2013. The Act extended through 2013 several expired or expiring temporary business provisions, commonly referred to as “extenders,” which were retroactively extended to the beginning of 2012. As
90
Table of Contents
required by GAAP, the effects of new legislation are recognized when signed into law. Consequently, we reduced our 2013 tax expense by $27.5 million as a result of recognizing the 2012 effect of the extenders.
16. Employee Benefit Plans
Defined Contribution Plans
We maintain defined contribution retirement plans for our U.S., U.K. and third-country national, or TCN, employees. The plan for our U.S. employees, or the 401k Plan, is designed to qualify under Section 401(k) of the Code. Under the 401k Plan, each participant may elect to defer taxation on a portion of his or her eligible earnings, as defined by the 401k Plan, by directing his or her employer to withhold a percentage of such earnings. A participating employee may also elect to make after-tax contributions to the 401k Plan. During each of the years ended December 31, 2015, 2014 and 2013, we matched up to 6% of each employee’s compensation contributed to the 401k Plan. During the four months ended April 30, 2015 and the years ended December 31, 2014 and 2013, we made discretionary profit sharing contributions of 4% of a participant’s defined compensation to the 401k Plan. We ceased making profit sharing contributions under the 401k Plan on May 1, 2015. Participants are fully vested in the employer match immediately upon enrollment in the 401k Plan and subject to a three-year cliff vesting period for any profit sharing contribution. For the years ended December 31, 2015, 2014 and 2013, our provision for contributions was $23.8 million, $34.1 million and $29.6 million, respectively.
The defined contribution retirement plan for our U.K. employees provides that we make annual contributions in an amount equal to the employee’s contributions generally up to a maximum percentage of the employee’s defined compensation per year. For each of the years ended December 31, 2015, 2014 and 2013, our contribution for employees working in the U.K. sector of the North Sea was up to a maximum of 10%, of the employee’s defined compensation. Our provision for contributions was $3.4 million, $5.0 million and $3.5 million for the years ended December 31, 2015, 2014 and 2013, respectively.
The defined contribution retirement plan for our TCN employees, or International Savings Plan, is similar to the 401k Plan. During each of the years ended December 31, 2015, 2014 and 2013, we matched up to 6% of each employee’s compensation contributed to the International Savings Plan. During the four months ended April 30, 2015 and the years ended December 31, 2014 and 2013, we made discretionary profit sharing contributions of 4% of a participant’s defined compensation to the International Savings Plan. We ceased making profit sharing contributions under this plan on May 1, 2015. Our provision for contributions was $2.2 million, $3.7 million and $3.1 million for the years ended December 31, 2015, 2014 and 2013, respectively.
Deferred Compensation and Supplemental Executive Retirement Plan
Our Amended and Restated Diamond Offshore Management Company Supplemental Executive Retirement Plan, or Supplemental Plan, provides benefits to a select group of our management or other highly compensated employees to compensate such employees for any portion of our base salary contribution and/or matching contribution under the 401k Plan that could not be contributed to that plan because of limitations within the Code. Our provision for contributions to the Supplemental Plan for the years ended December 31, 2015, 2014 and 2013 was approximately $153,000, $265,000 and $261,000, respectively.
17. Segments and Geographic Area Analysis
Although we provide contract drilling services with different types of offshore drilling rigs and also provide such services in many geographic locations, we have aggregated these operations into one reportable segment based on the similarity of economic characteristics due to the nature of the revenue earning process as it relates to the offshore drilling industry over the operating lives of our drilling rigs.
91
Table of Contents
Revenues from contract drilling services by equipment-type are listed below:
| Year Ended December 31, | ||||||||||||
| 2015 | 2014 | 2013 | ||||||||||
| (In thousands) | ||||||||||||
| Floaters: |
||||||||||||
| Ultra-Deepwater |
$ | 1,339,059 | $ | 987,565 | $ | 854,515 | ||||||
| Deepwater |
548,667 | 494,247 | 617,080 | |||||||||
| Mid-Water |
387,549 | 1,076,842 | 1,197,934 | |||||||||
|
|
|
|
|
|
|
|||||||
| Total Floaters |
2,275,275 | 2,558,654 | 2,669,529 | |||||||||
| Jack-ups |
84,909 | 178,472 | 174,055 | |||||||||
|
|
|
|
|
|
|
|||||||
| Total contract drilling revenues |
2,360,184 | 2,737,126 | 2,843,584 | |||||||||
| Revenues related to reimbursable expenses |
59,209 | 77,545 | 76,837 | |||||||||
|
|
|
|
|
|
|
|||||||
| Total revenues |
$ | 2,419,393 | $ | 2,814,671 | $ | 2,920,421 | ||||||
|
|
|
|
|
|
|
|||||||
Geographic Areas
Our drilling rigs are highly mobile and may be moved to other markets throughout the world in response to market conditions or customer needs. At December 31, 2015, our actively-marketed drilling rigs were en route to or located offshore seven countries in addition to the United States. Revenues by geographic area are presented by attributing revenues to the individual country or areas where the services were performed.
| Year Ended December 31, | ||||||||||||
| 2015 | 2014 | 2013 | ||||||||||
| (In thousands) | ||||||||||||
| United States |
$ | 513,605 | $ | 418,095 | $ | 330,471 | ||||||
| International: |
||||||||||||
| South America |
812,271 | 1,088,796 | 1,219,287 | |||||||||
| Europe/Africa/Mediterranean |
532,824 | 558,367 | 731,888 | |||||||||
| Australia/Asia |
415,033 | 503,814 | 438,814 | |||||||||
| Mexico |
145,660 | 245,599 | 199,961 | |||||||||
|
|
|
|
|
|
|
|||||||
| 1,905,788 | 2,396,576 | 2,589,950 | ||||||||||
|
|
|
|
|
|
|
|||||||
| Total revenues |
$ | 2,419,393 | $ | 2,814,671 | $ | 2,920,421 | ||||||
|
|
|
|
|
|
|
|||||||
An individual international country may, from time to time, comprise a material percentage of our total contract drilling revenues from unaffiliated customers. For the years ended December 31, 2015, 2014 and 2013, individual countries that comprised 5% or more of our total contract drilling revenues from unaffiliated customers are listed below.
| Year Ended December 31, | ||||||||||||
| 2015 | 2014 | 2013 | ||||||||||
| Brazil |
23.1 | % | 31.0 | % | 38.3 | % | ||||||
| United Kingdom |
11.4 | % | 10.7 | % | 7.9 | % | ||||||
| Trinidad |
9.8 | % | 4.0 | % | 1.7 | % | ||||||
| Romania |
9.7 | % | 3.9 | % | — | |||||||
| Australia |
7.0 | % | 6.4 | % | 3.2 | % | ||||||
| Malaysia |
6.8 | % | 5.5 | % | 2.9 | % | ||||||
| Mexico |
6.0 | % | 8.7 | % | 6.9 | % | ||||||
92
Table of Contents
The following table presents our long-lived tangible assets by geographic location as of December 31, 2015, 2014 and 2013. A substantial portion of our assets is comprised of rigs that are mobile, and therefore asset locations at the end of the period are not necessarily indicative of the geographic distribution of the earnings generated by such assets during the periods and may vary from period to period due to the relocation of rigs. In circumstances where our drilling rigs were in transit at the end of a calendar year, they have been presented in the tables below within the geographic area in which they were expected to operate.
| December 31, | ||||||||||||
| 2015 (1) | 2014 | 2013 | ||||||||||
| (In thousands) | ||||||||||||
| Drilling and other property and equipment, net: |
||||||||||||
| United States (2) |
$ | 3,292,474 | $ | 2,637,621 | $ | 611,731 | ||||||
| International: |
||||||||||||
| Australia/Asia/Middle East (3) |
1,224,089 | 1,460,841 | 2,078,348 | |||||||||
| South America |
1,051,283 | 1,445,832 | 1,690,976 | |||||||||
| Europe/Africa/Mediterranean |
664,520 | 1,128,857 | 793,097 | |||||||||
| Mexico |
146,448 | 272,802 | 293,075 | |||||||||
|
|
|
|
|
|
|
|||||||
| 3,086,340 | 4,308,332 | 4,855,496 | ||||||||||
|
|
|
|
|
|
|
|||||||
| Total |
$ | 6,378,814 | $ | 6,945,953 | $ | 5,467,227 | ||||||
|
|
|
|
|
|
|
|||||||
| (1) | During 2015, we recorded an aggregate impairment loss of $860.4 million to write down certain of our drilling rigs with indicators of impairment to their estimated recoverable amounts. |
| (2) | Long-lived tangible assets in the United States region as of December 31, 2015 and December 31, 2014 included $2.6 billion and $1.9 billion, respectively, related to our newbuild drillships, three of which were located in GOM waters in 2014 and the fourth of which arrived in 2015. |
| (3) | Long-lived tangible assets in the Australia/Asia/Middle East region include $270.0 million, $439.2 million and $1,064.5 million in construction work-in-progress for rigs under construction in South Korea as of December 31, 2015, 2014 and 2013, respectively. |
The following table presents the countries in which material concentrations of our long-lived tangible assets were located as of December 31, 2015, 2014 and 2013:
| December 31, | ||||||||||||
| 2015 | 2014 | 2013 | ||||||||||
| United States |
51.6 | % | 38.0 | % | 11.2 | % | ||||||
| Brazil Malaysia |
|
15.3 10.4 |
% % |
|
20.3 6.6 |
% % |
|
30.2 4.3 |
% % | |||
| South Korea |
4.2 | % | 6.3 | % | 19.5 | % | ||||||
| Spain |
2.7 | % | 8.1 | % | 1.2 | % | ||||||
| Mexico |
2.3 | % | 3.9 | % | 5.4 | % | ||||||
| Vietnam |
— | 6.9 | % | 0.6 | % | |||||||
| Singapore |
— | — | 8.2 | % | ||||||||
| Angola |
— | — | 6.3 | % | ||||||||
| Indonesia |
— | — | 5.2 | % | ||||||||
As of December 31, 2015, 2014 and 2013, no other countries had more than a 5% concentration of our long-lived tangible assets.
93
Table of Contents
Major Customers
Our customer base includes major and independent oil and gas companies and government-owned oil companies. Revenues from our major customers for the years ended December 31, 2015, 2014 and 2013 that contributed more than 10% of our total revenues are as follows:
| Year Ended December 31, | ||||||||||||
| Customer | 2015 | 2014 | 2013 | |||||||||
| Petróleo Brasileiro S.A. |
24.1 | % | 31.9 | % | 33.6 | % | ||||||
| ExxonMobil |
12.4 | % | 5.0 | % | — | |||||||
| Anadarko |
12.4 | % | 3.6 | % | — | |||||||
18. Unaudited Quarterly Financial Data
Unaudited summarized financial data by quarter for the years ended December 31, 2015 and 2014 is shown below.
| First Quarter |
Second Quarter |
Third Quarter |
Fourth Quarter |
|||||||||||||
| (In thousands, except per share data) | ||||||||||||||||
| 2015 |
||||||||||||||||
| Revenues |
$ | 620,056 | $ | 634,032 | $ | 609,742 | $ | 555,563 | ||||||||
| Operating (loss) income (1) |
(269,530 | ) | 134,121 | 181,434 | (340,099 | ) | ||||||||||
| (Loss) income before income tax expense |
(287,118 | ) | 106,028 | 159,767 | (360,025 | ) | ||||||||||
| Net (loss) income |
(255,709 | ) | 90,386 | 136,422 | (245,384 | ) | ||||||||||
| Net (loss) income per share, basic and diluted |
$ | (1.86 | ) | $ | 0.66 | $ | 0.99 | $ | (1.79 | ) | ||||||
| 2014 |
||||||||||||||||
| Revenues |
$ | 709,424 | $ | 692,244 | $ | 737,682 | $ | 675,321 | ||||||||
| Operating income |
186,277 | 133,766 | 90,416 | 162,103 | ||||||||||||
| Income before income tax expense |
167,679 | 112,603 | 81,639 | 153,270 | ||||||||||||
| Net income |
145,810 | 89,713 | 52,645 | 98,843 | ||||||||||||
| Net income per share, basic and diluted |
$ | 1.05 | $ | 0.65 | $ | 0.38 | $ | 0.72 | ||||||||
| (1) | During the first, third and fourth quarters of 2015, we recognized impairment losses of $358.5 million, $2.6 million and $499.4 million, respectively, aggregating $860.4 million for the year ended December 31, 2015 to write down certain of our drilling rigs with indicators of impairment to their estimated recoverable amounts. See Notes 1 and 2. |
19. Subsequent Event
In February 2016, we entered into a ten-year agreement with GE Oil & Gas, or GE, to provide services with respect to certain blowout preventer and related well control equipment on our four newbuild drillships. Such services include management of maintenance, certification and reliability with respect to such equipment. In connection with the services agreement with GE, we will sell the equipment to a GE affiliate for an aggregate $210.0 million and will lease back such equipment over separate ten-year operating leases. We do not expect to realize any gain or loss on these sale and leaseback transactions. Future commitments for the full term under the services agreement and leases are estimated to aggregate approximately $650.0 million.
94
Table of Contents
| Item 9. | Changes in and Disagreements with Accountants on Accounting and Financial Disclosure. |
Not applicable.
| Item 9A. | Controls and Procedures |
Disclosure Controls and Procedures
We maintain a system of disclosure controls and procedures which are designed to ensure that information required to be disclosed by us in reports that we file or submit under the federal securities laws, including this report, is recorded, processed, summarized and reported on a timely basis. These disclosure controls and procedures include controls and procedures designed to ensure that information required to be disclosed by us under the federal securities laws is accumulated and communicated to our management on a timely basis to allow decisions regarding required disclosure.
Our Chief Executive Officer, or CEO, and Chief Financial Officer, or CFO, participated in an evaluation by our management of the effectiveness of our disclosure controls and procedures (as defined in Exchange Act Rules 13a-15(e) and 15d-15(e)) as of December 31, 2015. Based on their participation in that evaluation, our CEO and CFO concluded that our disclosure controls and procedures were effective as of December 31, 2015.
Internal Control Over Financial Reporting
Management’s Annual Report on Internal Control Over Financial Reporting
Our management is responsible for establishing and maintaining adequate internal control over financial reporting (as defined in Exchange Act Rules 13a-15(f) and 15d-15(f)) for Diamond Offshore Drilling, Inc. Our internal control system was designed to provide reasonable assurance to our management and Board of Directors regarding the preparation and fair presentation of published financial statements.
There are inherent limitations to the effectiveness of any control system, however well designed, including the possibility of human error and the possible circumvention or overriding of controls. Further, the design of a control system must reflect the fact that there are resource constraints, and the benefits of controls must be considered relative to their costs. Management must make judgments with respect to the relative cost and expected benefits of any specific control measure. The design of a control system also is based in part upon assumptions and judgments made by management about the likelihood of future events, and there can be no assurance that a control will be effective under all potential future conditions. As a result, even an effective system of internal controls can provide no more than reasonable assurance with respect to the fair presentation of financial statements and the processes under which they were prepared.
Our management assessed the effectiveness of our internal control over financial reporting as of December 31, 2015. In making this assessment, our management used the criteria set forth by the Committee of Sponsoring Organizations of the Treadway Commission (COSO) in Internal Control – Integrated Framework (2013). Based on this assessment our management believes that, as of December 31, 2015, our internal control over financial reporting was effective.
Deloitte & Touche LLP, the registered public accounting firm that audited our financial statements included in this Annual Report on Form 10-K, has issued an attestation report on the effectiveness of our internal control over financial reporting. The attestation report of Deloitte & Touche LLP is included at the beginning of Item 8 of this Form 10-K.
Changes in Internal Control Over Financial Reporting
There were no changes in our internal control over financial reporting identified in connection with the foregoing evaluation that occurred during our fourth fiscal quarter of 2015 that have materially affected, or are reasonably likely to materially affect, our internal control over financial reporting.
95
Table of Contents
| Item 9B. | Other Information. |
Not applicable.
Reference is made to the information responsive to Items 10, 11, 12, 13 and 14 of this Part III contained in our definitive proxy statement for our 2016 Annual Meeting of Stockholders, which is incorporated herein by reference.
| Item 10. | Directors, Executive Officers and Corporate Governance. |
| Item 11. | Executive Compensation. |
| Item 12. | Security Ownership of Certain Beneficial Owners and Management and Related Stockholder Matters. |
| Item 13. | Certain Relationships and Related Transactions, and Director Independence. |
| Item 14. | Principal Accountant Fees and Services. |
PART IV
| Item 15. | Exhibits and Financial Statement Schedules. |
| (a) | Index to Financial Statements, Financial Statement Schedules and Exhibits |
| Page | ||||
| (1) Financial Statements |
||||
| 54 | ||||
| 55 | ||||
| 56 | ||||
| 57 | ||||
| 58 | ||||
| 59 | ||||
| 60 | ||||
| 99 | ||||
See the Exhibit Index for a list of those exhibits filed herewith, which Exhibit Index also includes and identifies management contracts or compensatory plans or arrangements required to be filed as exhibits to this Form 10-K by Item 601 of Regulation S-K.
96
Table of Contents
Pursuant to the requirements of Section 13 or 15(d) of the Securities Exchange Act of 1934, the registrant has duly caused this report to be signed on its behalf by the undersigned, thereunto duly authorized, on February 19, 2016.
| DIAMOND OFFSHORE DRILLING, INC. | ||
| By: | /s/ GARY T. KRENEK | |
| Gary T. Krenek | ||
| Senior Vice President and Chief Financial Officer | ||
POWER OF ATTORNEY
Each person whose signature appears below constitutes and appoints Gary T. Krenek and David L. Roland and each of them, as his or her true and lawful attorneys-in-fact and agents, with full power of substitution and re-substitution, for him or her and in his or her name, place and stead, in any and all capacities, to sign any and all documents relating to this Annual Report on Form 10-K, including any and all amendments and supplements thereto, and to file the same with all exhibits thereto and other documents in connection therewith with the Securities and Exchange Commission, granting unto said attorneys-in-fact and agents full power and authority to do and perform each and every act and thing requisite and necessary to be done, as fully as to all intents and purposes as he or she might or could do in person, hereby ratifying and confirming all that said attorneys-in-fact and agents or their or his or her substitute or substitutes may lawfully do or cause to be done by virtue hereof.
Pursuant to the requirements of the Securities Exchange Act of 1934, this report has been signed below by the following persons on behalf of the registrant and in the capacities and on the dates indicated.
| Signature |
Title |
Date | ||
| /s/ MARC EDWARDS Marc Edwards |
President, Chief Executive Officer and Director (Principal Executive Officer) |
February 19, 2016 | ||
| /s/ GARY T. KRENEK Gary T. Krenek |
Senior Vice President and Chief Financial Officer (Principal Financial Officer) |
February 19, 2016 | ||
| /s/ BETH G. GORDON Beth G. Gordon |
Controller (Principal Accounting Officer) | February 19, 2016 | ||
| /s/ JAMES S. TISCH James S. Tisch |
Chairman of the Board | February 19, 2016 | ||
| /s/ JOHN R. BOLTON John R. Bolton |
Director | February 19, 2016 | ||
| /s/ CHARLES L. FABRIKANT Charles L. Fabrikant |
Director | February 19, 2016 | ||
| /s/ PAUL G. GAFFNEY II Paul G. Gaffney II |
Director | February 19, 2016 | ||
97
Table of Contents
| Signature |
Title |
Date | ||
| /s/ EDWARD GREBOW Edward Grebow |
Director | February 19, 2016 | ||
| /s/ HERBERT C. HOFMANN Herbert C. Hofmann |
Director | February 19, 2016 | ||
| /s/ KENNETH I. SIEGEL Kenneth I. Siegel |
Director | February 19, 2016 | ||
| /s/ CLIFFORD M. SOBEL Clifford M. Sobel |
Director | February 19, 2016 | ||
| /s/ ANDREW H. TISCH Andrew H. Tisch |
Director | February 19, 2016 | ||
| /s/ RAYMOND S. TROUBH Raymond S. Troubh |
Director | February 19, 2016 | ||
98
Table of Contents
| Exhibit No. |
Description | |
| 3.1 | Amended and Restated Certificate of Incorporation of Diamond Offshore Drilling, Inc. (incorporated by reference to Exhibit 3.1 to our Quarterly Report on Form 10-Q for the quarterly period ended June 30, 2003) (SEC File No. 1-13926). | |
| 3.2 | Amended and Restated By-laws (as amended through October 4, 2013) of Diamond Offshore Drilling, Inc. (incorporated by reference to Exhibit 3.1 to our Current Report on Form 8-K filed October 8, 2013). | |
| 4.1 | Indenture, dated as of February 4, 1997, between Diamond Offshore Drilling, Inc. and The Bank of New York Mellon Trust Company, N.A. (formerly known as The Bank of New York) (as successor to The Chase Manhattan Bank), as Trustee (incorporated by reference to Exhibit 4.1 to our Annual Report on Form 10-K for the fiscal year ended December 31, 2001) (SEC File No. 1-13926). | |
| 4.2 | Sixth Supplemental Indenture, dated as of May 4, 2009, between Diamond Offshore Drilling, Inc. and The Bank of New York Mellon Trust Company, N.A. (formerly known as The Bank of New York Mellon), as Trustee (incorporated by reference to Exhibit 4.2 to our Current Report on Form 8-K filed May 4, 2009) (SEC File No. 1-13926). | |
| 4.3 | Seventh Supplemental Indenture, dated as of October 8, 2009, between Diamond Offshore Drilling, Inc. and The Bank of New York Mellon Trust Company, N.A. (formerly known as The Bank of New York Mellon), as Trustee (incorporated by reference to Exhibit 4.2 to our Current Report on Form 8-K filed October 8, 2009) (SEC File No. 1-13926). | |
| 4.4 | Eighth Supplemental Indenture, dated as of November 5, 2013, between Diamond Offshore Drilling, Inc. and The Bank of New York Mellon Trust Company, N.A. (formerly known as The Bank of New York Mellon), as Trustee (incorporated by reference to Exhibit 4.2 to our Current Report on Form 8-K filed November 5, 2013). | |
| 10.1 | Registration Rights Agreement (the “Registration Rights Agreement”) dated October 16, 1995 between Loews and Diamond Offshore Drilling, Inc. (incorporated by reference to Exhibit 10.1 to our Annual Report on Form 10-K for the fiscal year ended December 31, 2001) (SEC File No. 1-13926). | |
| 10.2 | Amendment to the Registration Rights Agreement, dated September 16, 1997, between Loews and Diamond Offshore Drilling, Inc. (incorporated by reference to Exhibit 10.2 to our Annual Report on Form 10-K for the fiscal year ended December 31, 1997) (SEC File No. 1-13926). | |
| 10.3 | Services Agreement, dated October 16, 1995, between Loews and Diamond Offshore Drilling, Inc. (incorporated by reference to Exhibit 10.3 to our Annual Report on Form 10-K for the fiscal year ended December 31, 2001) (SEC File No. 1-13926). | |
| 10.4+ | Amended and Restated Diamond Offshore Management Company Supplemental Executive Retirement Plan effective as of January 1, 2007 (incorporated by reference to Exhibit 10.4 to our Annual Report on Form 10-K for the fiscal year ended December 31, 2006) (SEC File No. 1-13926). | |
| 10.5+ | Diamond Offshore Management Bonus Program, as amended and restated, and dated as of December 31, 1997 (incorporated by reference to Exhibit 10.6 to our Annual Report on Form 10-K for the fiscal year ended December 31, 1997) (SEC File No. 1-13926). | |
| 10.6+ | Diamond Offshore Drilling, Inc. Equity Incentive Compensation Plan (incorporated by reference to Exhibit B attached to our definitive proxy statement on Schedule 14A filed April 1, 2014). | |
99
Table of Contents
| Exhibit No. |
Description | |
| 10.7+ | Form of Stock Option Certificate for grants to executive officers, other employees and consultants pursuant to the Equity Incentive Compensation Plan (incorporated by reference to Exhibit 10.1 to our Current Report on Form 8-K filed October 1, 2004) (SEC File No. 1-13926). | |
| 10.8+ | Form of Stock Option Certificate for grants to non-employee directors pursuant to the Equity Incentive Compensation Plan (incorporated by reference to Exhibit 10.2 to our Current Report on Form 8-K filed October 1, 2004) (SEC File No. 1-13926). | |
| 10.9+ | The Diamond Offshore Drilling, Inc. Incentive Compensation Plan for Executive Officers (as Amended and Restated as of March 28, 2014) (incorporated by reference to Exhibit A attached to our definitive proxy statement on Schedule 14A filed April 1, 2014). | |
| 10.10+ | Form of Award Certificate for stock appreciation right grants to the Company’s executive officers, other employees and consultants pursuant to the Equity Incentive Compensation Plan (incorporated by reference to Exhibit 10.1 to our Current Report on Form 8-K filed April 28, 2006) (SEC File No. 1-13926). | |
| 10.11+ | Form of Award Certificate for stock appreciation right grants to non-employee directors pursuant to the Equity Incentive Compensation Plan (incorporated by reference to Exhibit 10.1 to our Quarterly Report on Form 10-Q for the quarterly period ended March 31, 2007) (SEC File No. 1-13926). | |
| 10.12+ | Form of Award Certificate for grants of Performance Restricted Stock Units under the Equity Incentive Compensation Plan (incorporated by reference to Exhibit 10.5 to our Quarterly Report Form 10-Q for the quarterly period ended March 31, 2014). | |
| 10.13+ | Specimen Agreement for grants of restricted stock units to officers under the Equity Incentive Compensation Plan (incorporated by reference to Exhibit 10.1 to our Current Report on Form 8-K filed March 30, 2015). | |
| 10.14+ | Specimen Agreement for grants of restricted stock units to the Chief Executive Officer under the Equity Incentive Compensation Plan (incorporated by reference to Exhibit 10.2 to our Current Report on 8-K filed March 30, 2015). | |
| 10.15+ | Employment Agreement between Diamond Offshore Management Company and Gary T. Krenek dated as of December 15, 2006 (incorporated by reference to Exhibit 10.2 to our Current Report on Form 8-K filed December 21, 2006) (SEC File No. 1-13926). | |
| 10.16+ | Employment Agreement between Diamond Offshore Management Company and Lyndol L. Dew dated as of December 15, 2006 (incorporated by reference to Exhibit 10.17 to our Annual Report on Form 10-K for the fiscal year ended December 31, 2006) (SEC File No. 1-13926). | |
| 10.17+ | Employment Agreement between Diamond Offshore Management Company and Beth G. Gordon dated as of January 3, 2007 (incorporated by reference to Exhibit 10.19 to our Annual Report on Form 10-K for the fiscal year ended December 31, 2006) (SEC File No. 1-13926). | |
| 10.18+ | Amendment to Employment Agreement, dated April 1, 2015, between Diamond Offshore Management Company and Beth G. Gordon (incorporated by reference to Exhibit 10.4 to our Quarterly Report on Form 10-Q for the quarterly period ended March 31, 2015). | |
| 10.19+ | Separation Agreement and General Release, dated March 30, 2015, between Diamond Offshore Management Company and John M. Vecchio (incorporated by reference to Exhibit 10.2 to our Quarterly Report on Form 10-Q for the quarterly period ended June 30, 2015). | |
| 10.20 | 5-Year Revolving Credit Agreement, dated as of September 28, 2012, among Diamond Offshore Drilling, Inc., Wells Fargo Bank, National Association, as administrative agent and swingline lender, the issuing banks named therein and the lenders named therein (incorporated by reference to Exhibit 10.1 to our Current Report on Form 8-K filed October 1, 2012). | |
100
Table of Contents
| Exhibit No. |
Description | |
| 10.21 | Extension Agreement and Amendment No. 1 to Credit Agreement, dated as of December 9, 2013, among Diamond Offshore Drilling, Inc., Wells Fargo Bank, National Association, as an issuing bank, as swingline lender and as administrative agent for the lenders, and the lenders named therein (incorporated by reference to Exhibit 10.20 to our Annual Report on Form 10-K for the fiscal year ended December 31, 2013). | |
| 10.22 | Commitment Increase and Amendment No. 2 to Credit Agreement, dated as of March 17, 2014, among Diamond Offshore Drilling, Inc., Wells Fargo Bank, National Association, as an issuing bank, as swingline lender and as administrative agent for the lenders, and the lenders named therein (incorporated by reference to Exhibit 10.2 to our Quarterly Report on Form 10-Q for the quarterly period ended March 31, 2014). | |
| 10.23 | Commitment Increase and Extension Agreement and Amendment No. 3 to Credit Agreement, dated as of October 22, 2014, among Diamond Offshore Drilling, Inc., Wells Fargo Bank, National Association, as administrative agent and swingline lender, the issuing banks named therein and the lenders named therein (incorporated by reference to Exhibit 10.1 to our Current Report on Form 8-K filed October 24, 2014). | |
| 10.24 | Extension Agreement and Amendment No. 4 to Credit Agreement, dated as of October 22, 2015, among Diamond Offshore Drilling, Inc., Wells Fargo Bank, National Association, as administrative agent and swingline lender, the issuing banks named therein and the lenders named therein (incorporated by reference to Exhibit 10.1 to our Quarterly Report on Form 10-Q for the quarterly period ended September 30, 2015). | |
| 10.25 | Form of Commercial Paper Dealer Agreement between Diamond Offshore Drilling, Inc. and the Dealer party thereto (incorporated by reference to Exhibit 10.1 to our Current Report on Form 8-K filed on February 12, 2015). | |
| 10.26+ | Retirement Agreement and General Release between Diamond Offshore Management Company and Lawrence R. Dickerson dated September 23, 2013 (incorporated by reference to Exhibit 10.1 to our Quarterly Report on Form 10-Q for the quarterly period ended September 30, 2013). | |
| 10.27+ | Employment Agreement, dated as of February 12, 2014, between Diamond Offshore Drilling, Inc., and Marc Edwards (incorporated by reference to Exhibit 10.1 to our Quarterly Report on Form 10-Q for the quarterly period ended March 31, 2014). | |
| 10.28+ | Separation Agreement and General Release, dated June 11, 2014, between Diamond Offshore Management Company and William C. Long (incorporated by reference to Exhibit 10.1 to our Quarterly Report on Form 10-Q for the quarterly period ended June 30, 2014). | |
| 12.1* | Statement re Computation of Ratios. | |
| 21.1* | List of Subsidiaries of Diamond Offshore Drilling, Inc. | |
| 23.1* | Consent of Deloitte & Touche LLP. | |
| 24.1* | Power of Attorney (set forth on the signature page hereof). | |
| 31.1* | Rule 13a-14(a) Certification of the Chief Executive Officer. | |
| 31.2* | Rule 13a-14(a) Certification of the Chief Financial Officer. | |
| 32.1* | Section 1350 Certification of the Chief Executive Officer and Chief Financial Officer. | |
| 101.INS** | XBRL Instance Document. | |
| 101.SCH** | XBRL Taxonomy Extension Schema Document. | |
| 101.CAL** | XBRL Taxonomy Calculation Linkbase Document. | |
| 101.LAB** | XBRL Taxonomy Label Linkbase Document. | |
101
Table of Contents
| Exhibit No. |
Description | |
| 101.PRE** | XBRL Presentation Linkbase Document. | |
| 101.DEF** | XBRL Taxonomy Extension Definition. | |
| * | Filed or furnished herewith. |
| ** | The documents formatted in XBRL (Extensible Business Reporting Language) and attached as Exhibit 101 to this report are deemed not filed or part of a registration statement or prospectus for purposes of sections 11 or 12 of the Securities Act, are deemed not filed for purposes of section 18 of the Exchange Act, and otherwise, not subject to liability under these sections. |
| + | Management contracts or compensatory plans or arrangements. |
102