Attached files
| file | filename |
|---|---|
| EX-99.1 - EXHIBIT 99.1 - QUESTAR CORP | a8-kexhibit9912015yeteleco.htm |
| 8-K - 8-K - QUESTAR CORP | a8-k2015earningsteleconfer.htm |
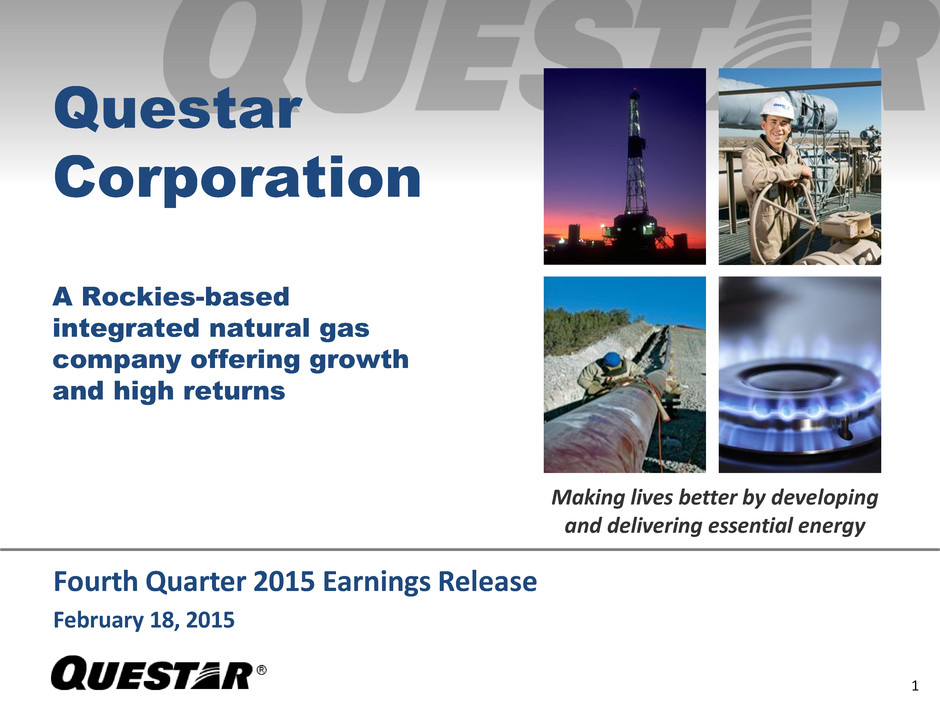
Fourth Quarter 2015 Earnings Release February 18, 2015 1 Questar Corporation A Rockies-based integrated natural gas company offering growth and high returns Making lives better by developing and delivering essential energy
This presentation contains forward-looking statements within the meaning of the federal securities laws. Such statements are based on management's current expectations, estimates and projections, which are subject to a wide range of uncertainties and business risks. Factors that could cause actual results to differ from those anticipated are discussed in the company's periodic filings with the Securities and Exchange Commission, including its annual report on Form 10-K for the year ended December 31, 2015. Questar undertakes no obligation to publicly correct or update the forward-looking statements in this presentation to reflect future events or circumstances. All such statements are expressly qualified by this cautionary statement. Notes and caution regarding forward-looking statements 2
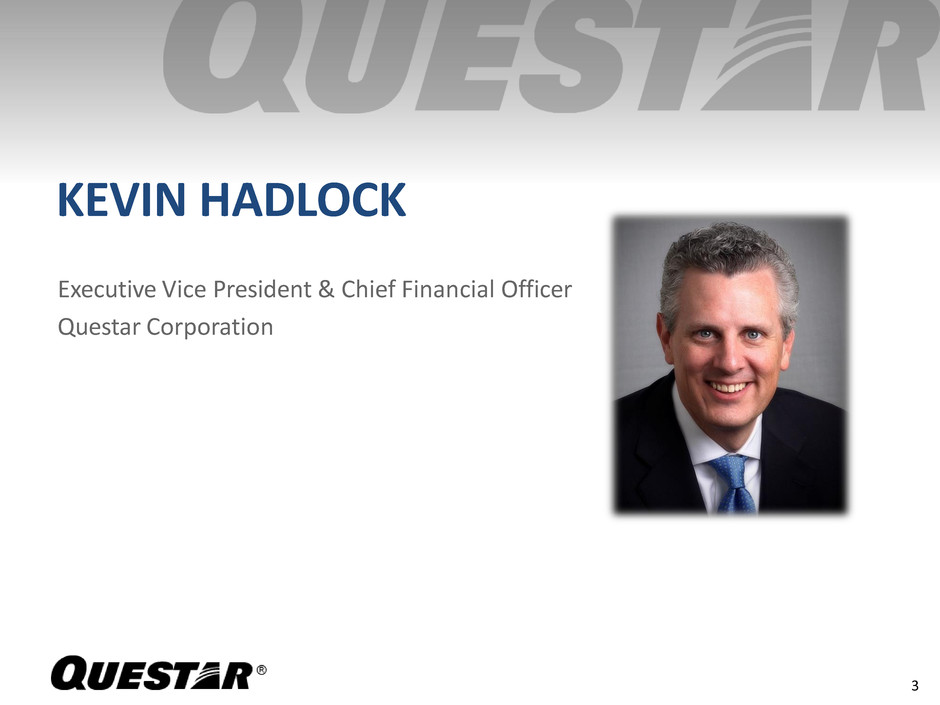
KEVIN HADLOCK Executive Vice President & Chief Financial Officer Questar Corporation 3
FY 2015 Financial Summary 4 ▪ Reported FY 2015 adjusted earnings of $226.9 million compared to FY 2014 net income of $226.5 million(1) ▪ Earned adjusted $1.28 per diluted share in FY 2015 compared to $1.29 per diluted share in FY 2014(1) ▪ Adjusted EBITDA for FY 2015 totaled $625.7 million, down 1% compared to FY 2014 (1) ▪ Excluding energy efficiency program costs, combined O&M and G&A expense for FY 2015 was down $12 million, or 4% compared to FY 2014 (1) ▪ Capital investment for 2015 was $330.4 million, a decrease of 11% compared to 2014 (1) See appendix
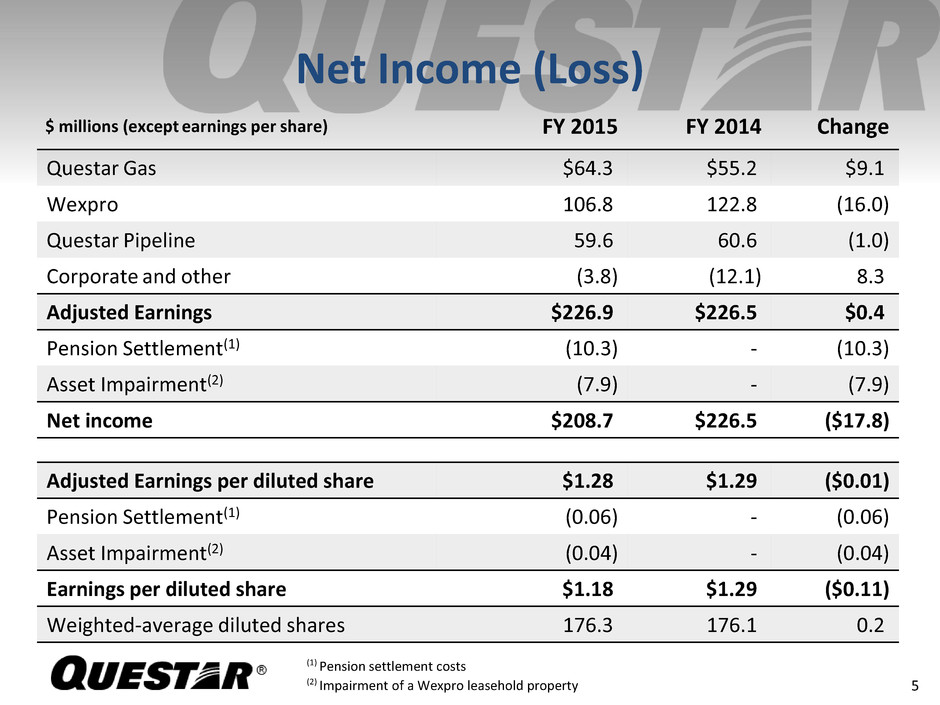
Net Income (Loss) 5 $ millions (except earnings per share) FY 2015 FY 2014 Change Questar Gas $64.3 $55.2 $9.1 Wexpro 106.8 122.8 (16.0) Questar Pipeline 59.6 60.6 (1.0) Corporate and other (3.8) (12.1) 8.3 Adjusted Earnings $226.9 $226.5 $0.4 Pension Settlement(1) (10.3) - (10.3) Asset Impairment(2) (7.9) - (7.9) Net income $208.7 $226.5 ($17.8) Adjusted Earnings per diluted share $1.28 $1.29 ($0.01) Pension Settlement(1) (0.06) - (0.06) Asset Impairment(2) (0.04) - (0.04) Earnings per diluted share $1.18 $1.29 ($0.11) Weighted-average diluted shares 176.3 176.1 0.2 (1) Pension settlement costs (2) Impairment of a Wexpro leasehold property
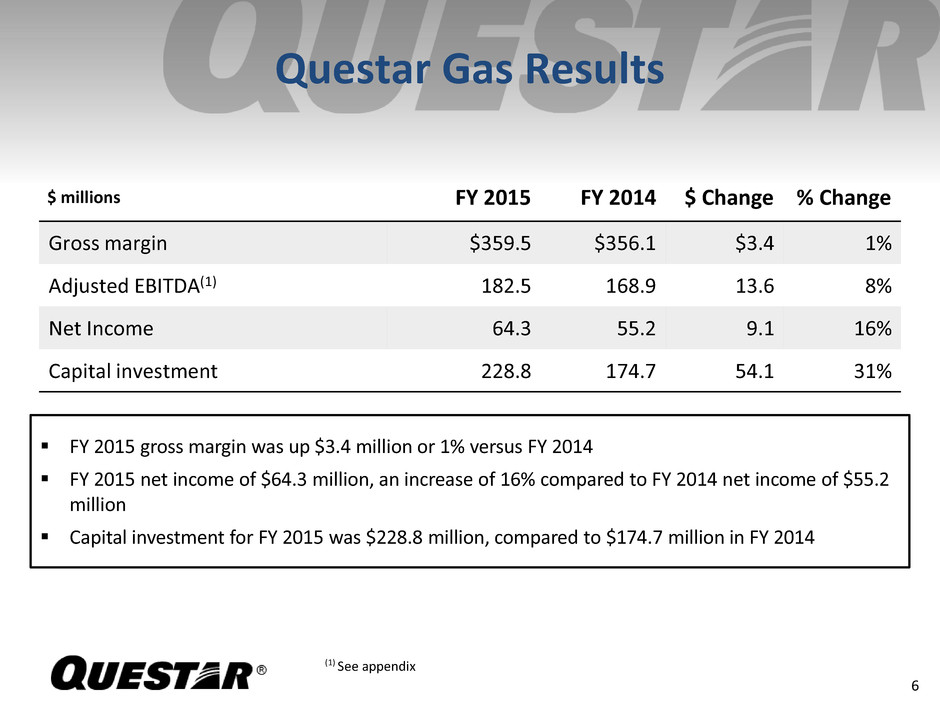
FY 2015 gross margin was up $3.4 million or 1% versus FY 2014 FY 2015 net income of $64.3 million, an increase of 16% compared to FY 2014 net income of $55.2 million Capital investment for FY 2015 was $228.8 million, compared to $174.7 million in FY 2014 Questar Gas Results 6 (1) See appendix $ millions FY 2015 FY 2014 $ Change % Change Gross margin $359.5 $356.1 $3.4 1% Adjusted EBITDA(1) 182.5 168.9 13.6 8% Net Income 64.3 55.2 9.1 16% Capital investment 228.8 174.7 54.1 31%
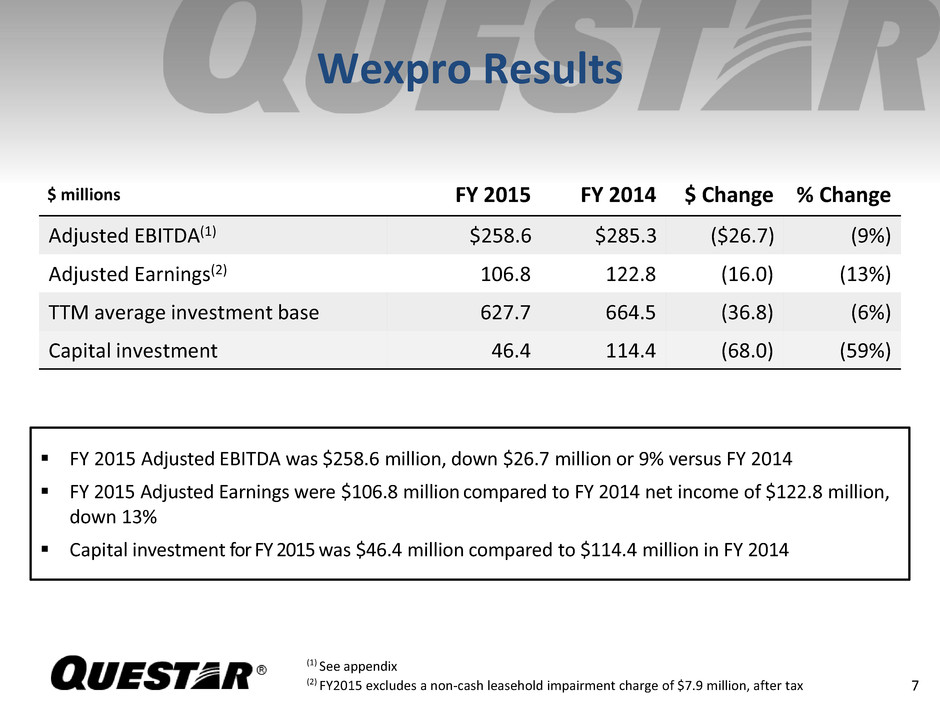
Wexpro Results 7 (1) See appendix $ millions FY 2015 FY 2014 $ Change % Change Adjusted EBITDA(1) $258.6 $285.3 ($26.7) (9%) Adjusted Earnings(2) 106.8 122.8 (16.0) (13%) TTM average investment base 627.7 664.5 (36.8) (6%) Capital investment 46.4 114.4 (68.0) (59%) FY 2015 Adjusted EBITDA was $258.6 million, down $26.7 million or 9% versus FY 2014 FY 2015 Adjusted Earnings were $106.8 million compared to FY 2014 net income of $122.8 million, down 13% Capital investment for FY 2015 was $46.4 million compared to $114.4 million in FY 2014 (2) FY2015 excludes a non-cash leasehold impairment charge of $7.9 million, after tax
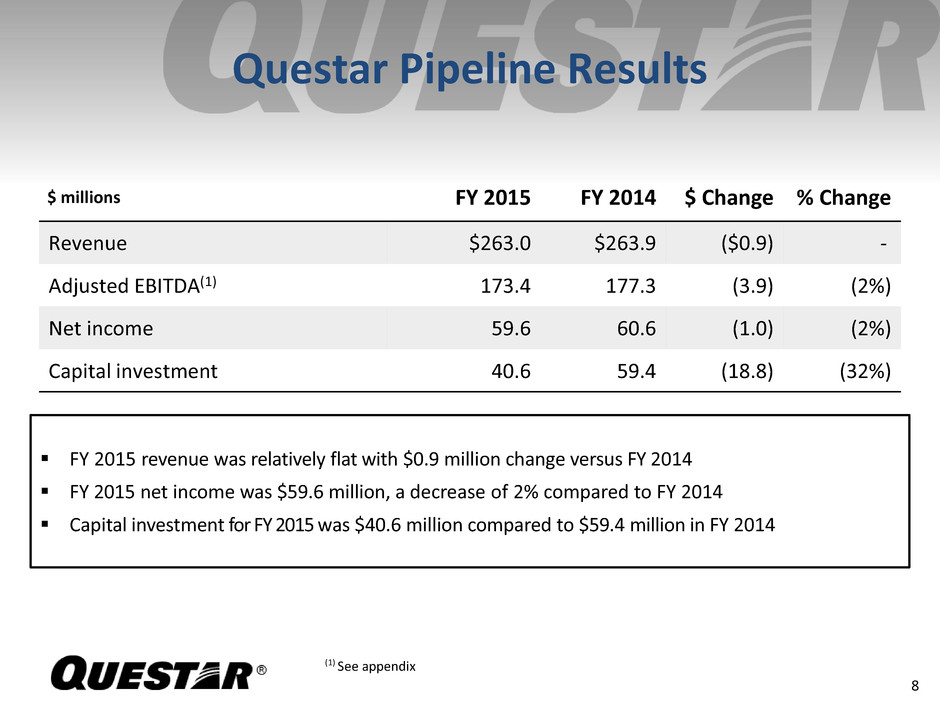
Questar Pipeline Results 8 (1) See appendix $ millions FY 2015 FY 2014 $ Change % Change Revenue $263.0 $263.9 ($0.9) - Adjusted EBITDA(1) 173.4 177.3 (3.9) (2%) Net income 59.6 60.6 (1.0) (2%) Capital investment 40.6 59.4 (18.8) (32%) FY 2015 revenue was relatively flat with $0.9 million change versus FY 2014 FY 2015 net income was $59.6 million, a decrease of 2% compared to FY 2014 Capital investment for FY 2015 was $40.6 million compared to $59.4 million in FY 2014
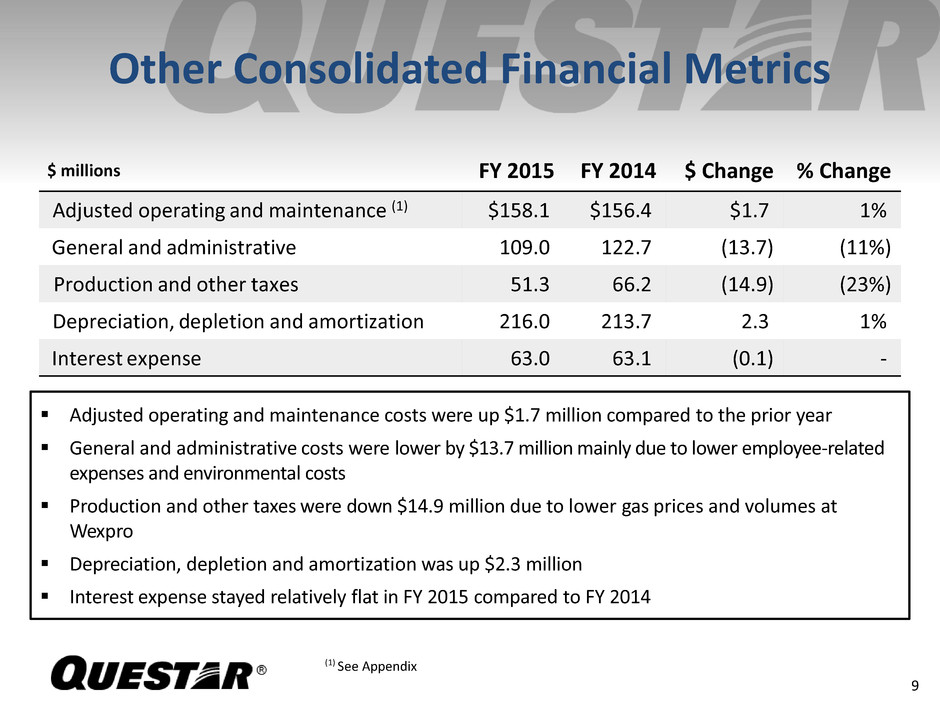
Other Consolidated Financial Metrics 9 (1) See Appendix $ millions FY 2015 FY 2014 $ Change % Change Adjusted operating and maintenance (1) $158.1 $156.4 $1.7 1% General and administrative 109.0 122.7 (13.7) (11%) Production and other taxes 51.3 66.2 (14.9) (23%) Depreciation, depletion and amortization 216.0 213.7 2.3 1% Interest expense 63.0 63.1 (0.1) - Adjusted operating and maintenance costs were up $1.7 million compared to the prior year General and administrative costs were lower by $13.7 million mainly due to lower employee-related expenses and environmental costs Production and other taxes were down $14.9 million due to lower gas prices and volumes at Wexpro Depreciation, depletion and amortization was up $2.3 million Interest expense stayed relatively flat in FY 2015 compared to FY 2014
10 ▪ Cash Flow (1) - Cash flow for the twelve months ended December 31, 2015 totaled $515.7 million, a decrease of 2% compared to the twelve months ended December 31, 2014 ▪ Liquidity -At the end of the fourth quarter 2015, Questar had net available liquidity of $317.4 million with $292.4 million of unused commercial paper capacity ▪ Capital Markets Activity -1,000,000 common shares repurchased during 2015 (1) Cash flow from operations before changes in working capital; See appendix Cash Flow and Liquidity
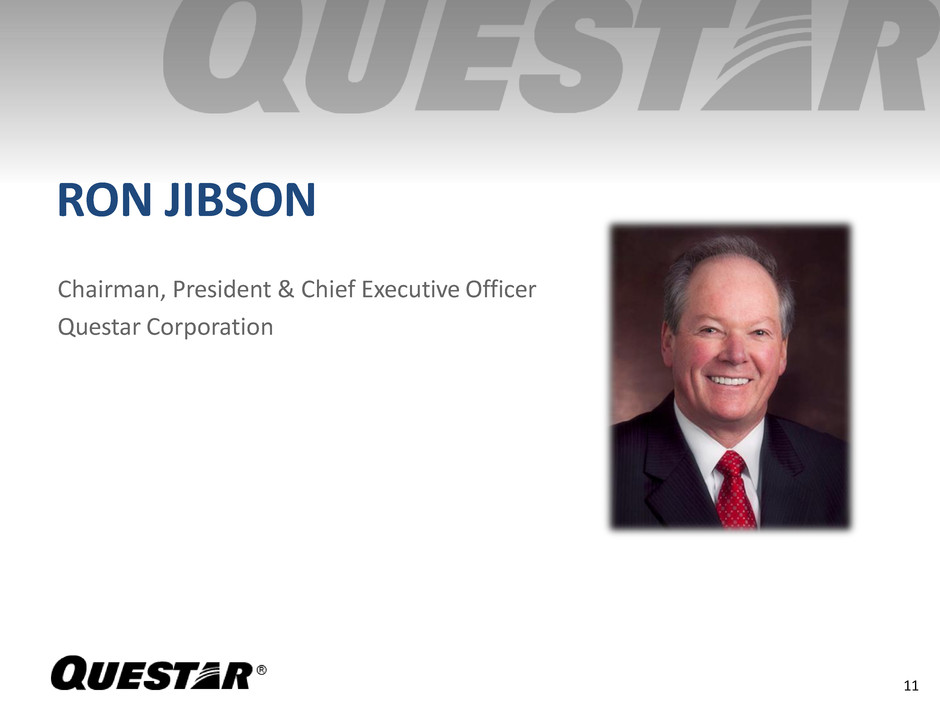
RON JIBSON Chairman, President & Chief Executive Officer Questar Corporation 11
Dominion Transaction Overview 12 ▪ Dominion Resources and Questar Corporation to combine in a $4.4 billion equity value transaction - Consideration of $25 per share in cash represents a 30% premium to Questar shareholders based on 20-trading day volume-weighted average price ▪ $6.0 billion enterprise value transaction - Includes the assumption of ~$1.6 billion of debt ▪ Anticipated to close during 2016 -Subject to customary regulatory approvals, Questar shareholder approval, and clearance under the Hart-Scott-Rodino Act
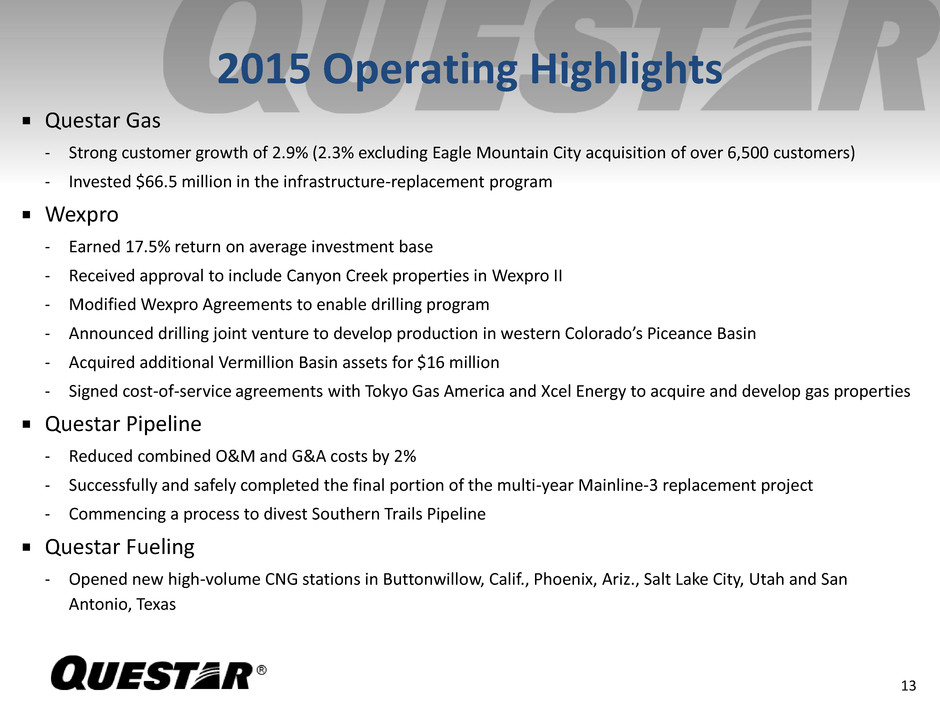
Questar Gas - Strong customer growth of 2.9% (2.3% excluding Eagle Mountain City acquisition of over 6,500 customers) - Invested $66.5 million in the infrastructure-replacement program Wexpro - Earned 17.5% return on average investment base - Received approval to include Canyon Creek properties in Wexpro II - Modified Wexpro Agreements to enable drilling program - Announced drilling joint venture to develop production in western Colorado’s Piceance Basin - Acquired additional Vermillion Basin assets for $16 million - Signed cost-of-service agreements with Tokyo Gas America and Xcel Energy to acquire and develop gas properties Questar Pipeline - Reduced combined O&M and G&A costs by 2% - Successfully and safely completed the final portion of the multi-year Mainline-3 replacement project - Commencing a process to divest Southern Trails Pipeline Questar Fueling - Opened new high-volume CNG stations in Buttonwillow, Calif., Phoenix, Ariz., Salt Lake City, Utah and San Antonio, Texas 2015 Operating Highlights 13
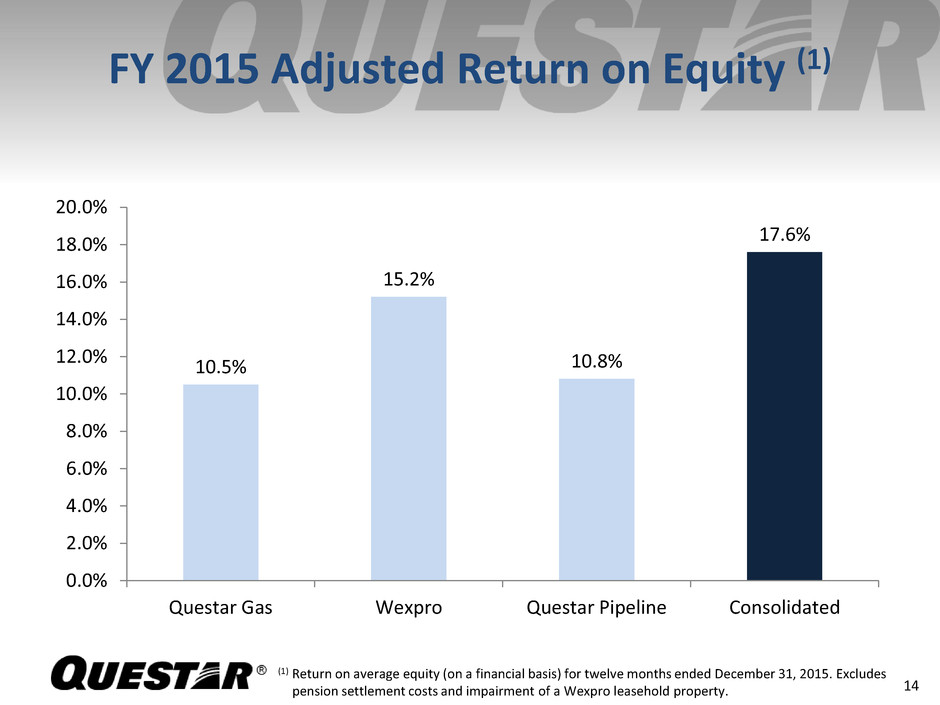
FY 2015 Adjusted Return on Equity (1) 14 10.5% 15.2% 10.8% 17.6% 0.0% 2.0% 4.0% 6.0% 8.0% 10.0% 12.0% 14.0% 16.0% 18.0% 20.0% Questar Gas Wexpro Questar Pipeline Consolidated (1) Return on average equity (on a financial basis) for twelve months ended December 31, 2015. Excludes pension settlement costs and impairment of a Wexpro leasehold property.
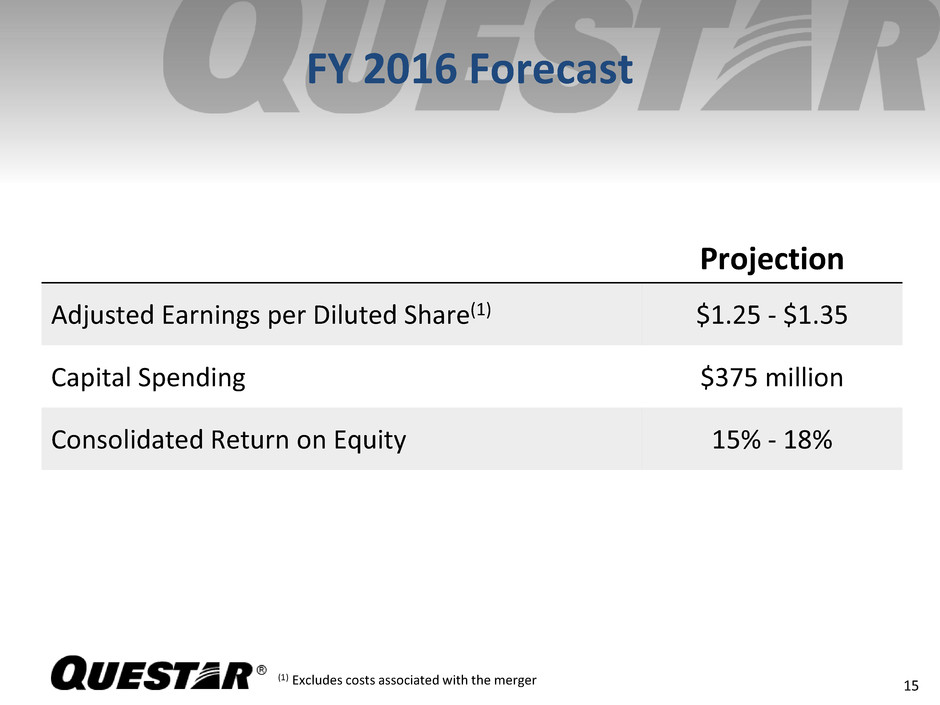
FY 2016 Forecast 15 Projection Adjusted Earnings per Diluted Share(1) $1.25 - $1.35 Capital Spending $375 million Consolidated Return on Equity 15% - 18% (1) Excludes costs associated with the merger
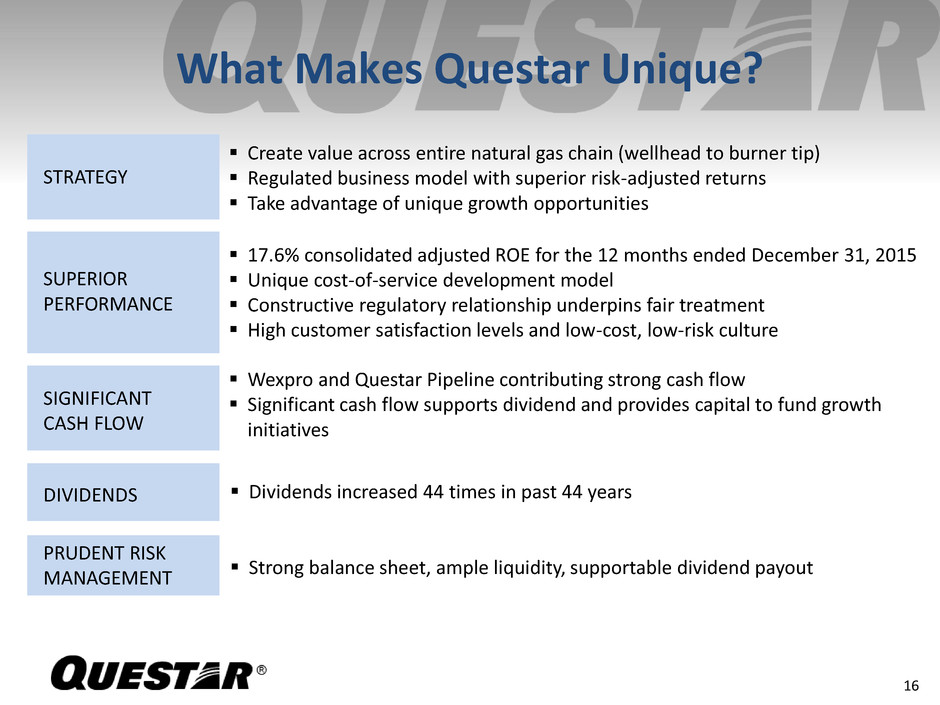
STRATEGY SIGNIFICANT CASH FLOW SUPERIOR PERFORMANCE PRUDENT RISK MANAGEMENT What Makes Questar Unique? 16 DIVIDENDS Create value across entire natural gas chain (wellhead to burner tip) Regulated business model with superior risk-adjusted returns Take advantage of unique growth opportunities 17.6% consolidated adjusted ROE for the 12 months ended December 31, 2015 Unique cost-of-service development model Constructive regulatory relationship underpins fair treatment High customer satisfaction levels and low-cost, low-risk culture Wexpro and Questar Pipeline contributing strong cash flow Significant cash flow supports dividend and provides capital to fund growth initiatives Dividends increased 44 times in past 44 years Strong balance sheet, ample liquidity, supportable dividend payout
APPENDIX 17
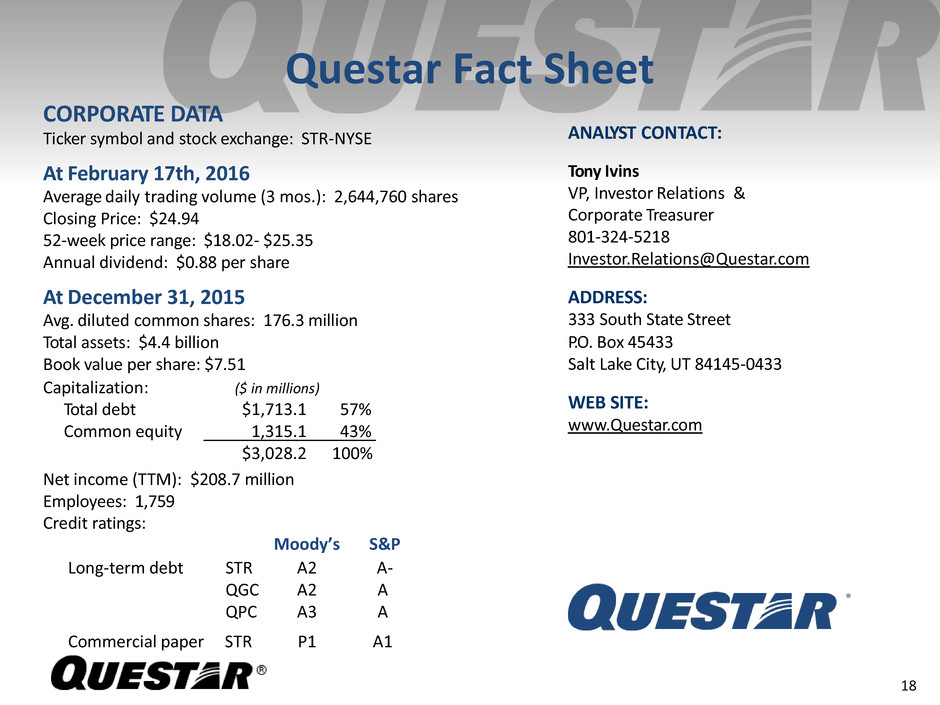
Questar Fact Sheet 18 CORPORATE DATA Ticker symbol and stock exchange: STR-NYSE At February 17th, 2016 Average daily trading volume (3 mos.): 2,644,760 shares Closing Price: $24.94 52-week price range: $18.02- $25.35 Annual dividend: $0.88 per share At December 31, 2015 Avg. diluted common shares: 176.3 million Total assets: $4.4 billion Book value per share: $7.51 Net income (TTM): $208.7 million Employees: 1,759 Credit ratings: ANALYST CONTACT: Tony Ivins VP, Investor Relations & Corporate Treasurer 801-324-5218 Investor.Relations@Questar.com ADDRESS: 333 South State Street P.O. Box 45433 Salt Lake City, UT 84145-0433 WEB SITE: www.Questar.com Moody’s S&P Long-term debt STR A2 A- QGC A2 A QPC A3 A Commercial paper STR P1 A1 Capitalization: ($ in millions) Total debt $1,713.1 57% Common equity $1,315.1 43% $3,028.2 100%
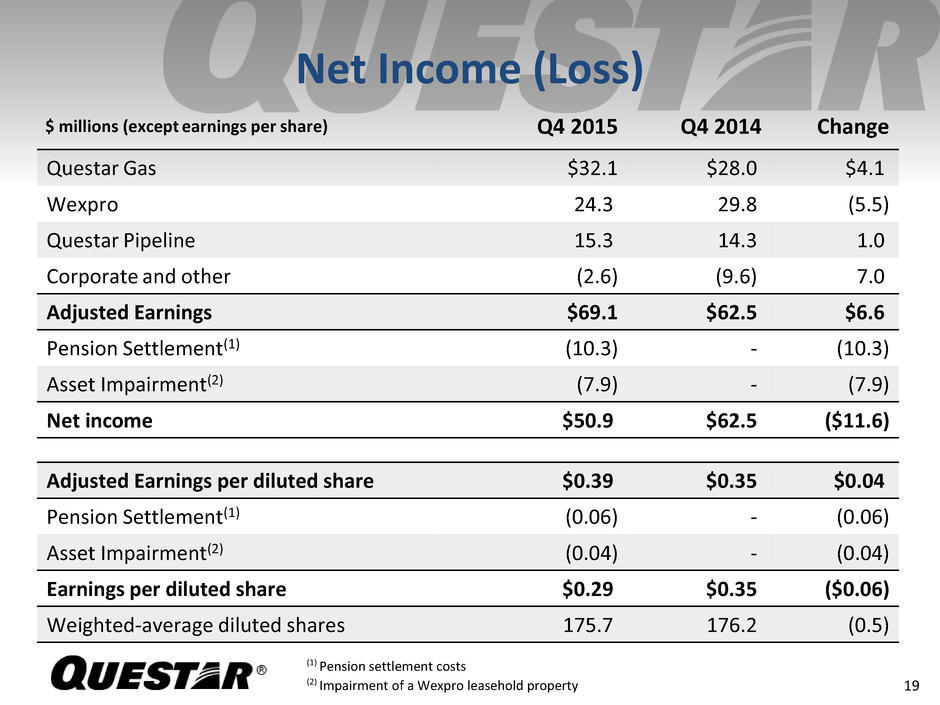
Net Income (Loss) $ millions (except earnings per share) Q4 2015 Q4 2014 Change Questar Gas $32.1 $28.0 $4.1 Wexpro 24.3 29.8 (5.5) Questar Pipeline 15.3 14.3 1.0 Corporate and other (2.6) (9.6) 7.0 Adjusted Earnings $69.1 $62.5 $6.6 Pension Settlement(1) (10.3) - (10.3) Asset Impairment(2) (7.9) - (7.9) Net income $50.9 $62.5 ($11.6) Adjusted Earnings per diluted share $0.39 $0.35 $0.04 Pension Settlement(1) (0.06) - (0.06) Asset Impairment(2) (0.04) - (0.04) Earnings per diluted share $0.29 $0.35 ($0.06) Weighted-average diluted shares 175.7 176.2 (0.5) (1) Pension settlement costs (2) Impairment of a Wexpro leasehold property 19
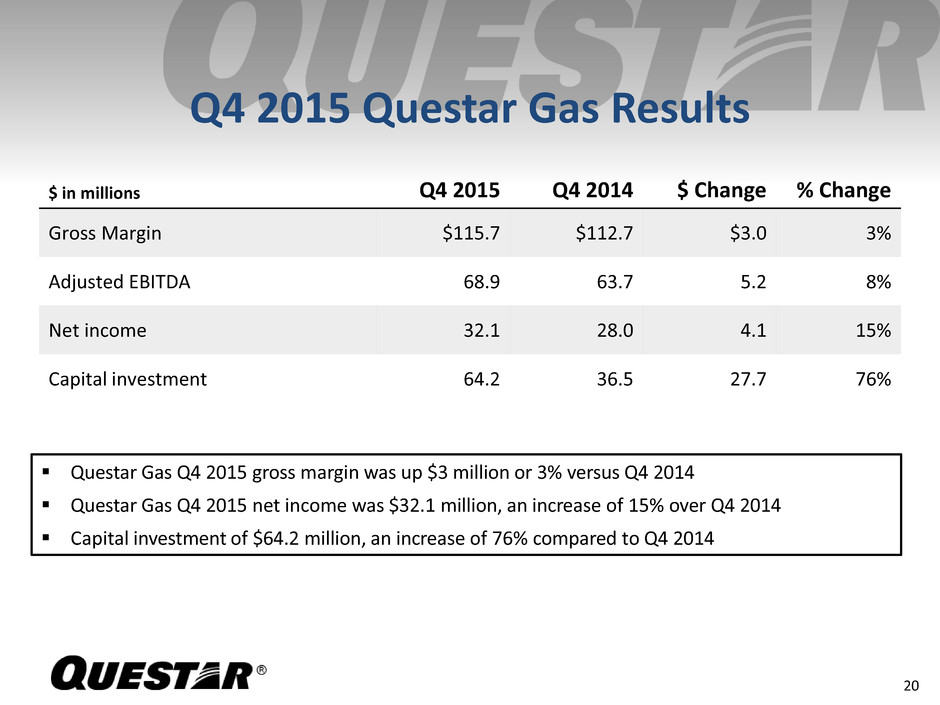
Questar Gas Q4 2015 gross margin was up $3 million or 3% versus Q4 2014 Questar Gas Q4 2015 net income was $32.1 million, an increase of 15% over Q4 2014 Capital investment of $64.2 million, an increase of 76% compared to Q4 2014 20 $ in millions Q4 2015 Q4 2014 $ Change % Change Gross Margin $115.7 $112.7 $3.0 3% Adjusted EBITDA 68.9 63.7 5.2 8% Net income 32.1 28.0 4.1 15% Capital investment 64.2 36.5 27.7 76% Q4 2015 Questar Gas Results
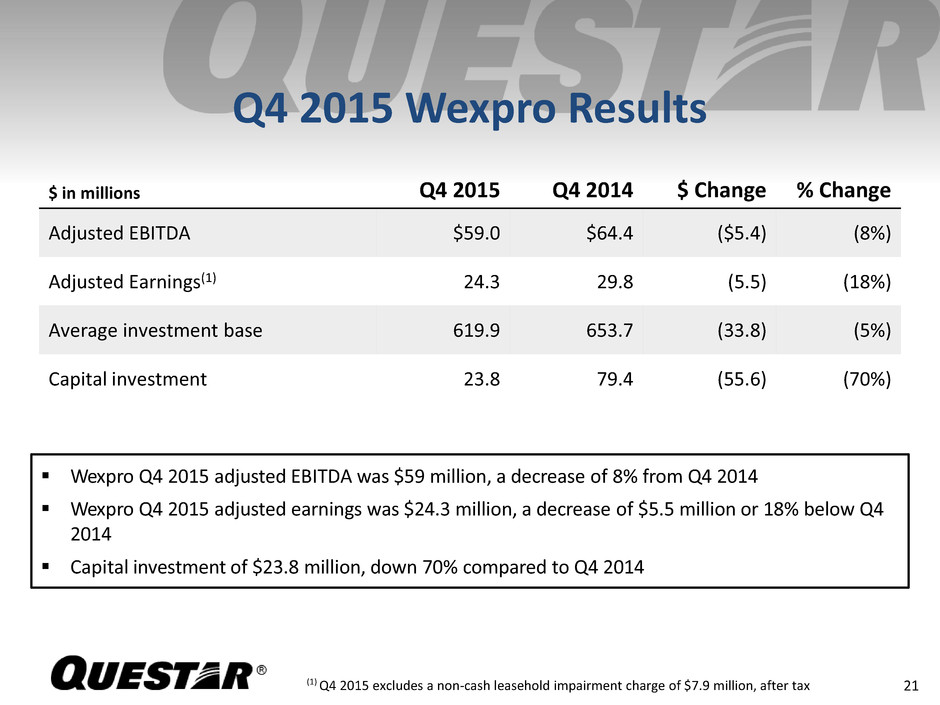
Wexpro Q4 2015 adjusted EBITDA was $59 million, a decrease of 8% from Q4 2014 Wexpro Q4 2015 adjusted earnings was $24.3 million, a decrease of $5.5 million or 18% below Q4 2014 Capital investment of $23.8 million, down 70% compared to Q4 2014 21 Q4 2015 Wexpro Results $ in millions Q4 2015 Q4 2014 $ Change % Change Adjusted EBITDA $59.0 $64.4 ($5.4) (8%) Adjusted Earnings(1) 24.3 29.8 (5.5) (18%) Average investment base 619.9 653.7 (33.8) (5%) Capital investment 23.8 79.4 (55.6) (70%) (1) Q4 2015 excludes a non-cash leasehold impairment charge of $7.9 million, after tax
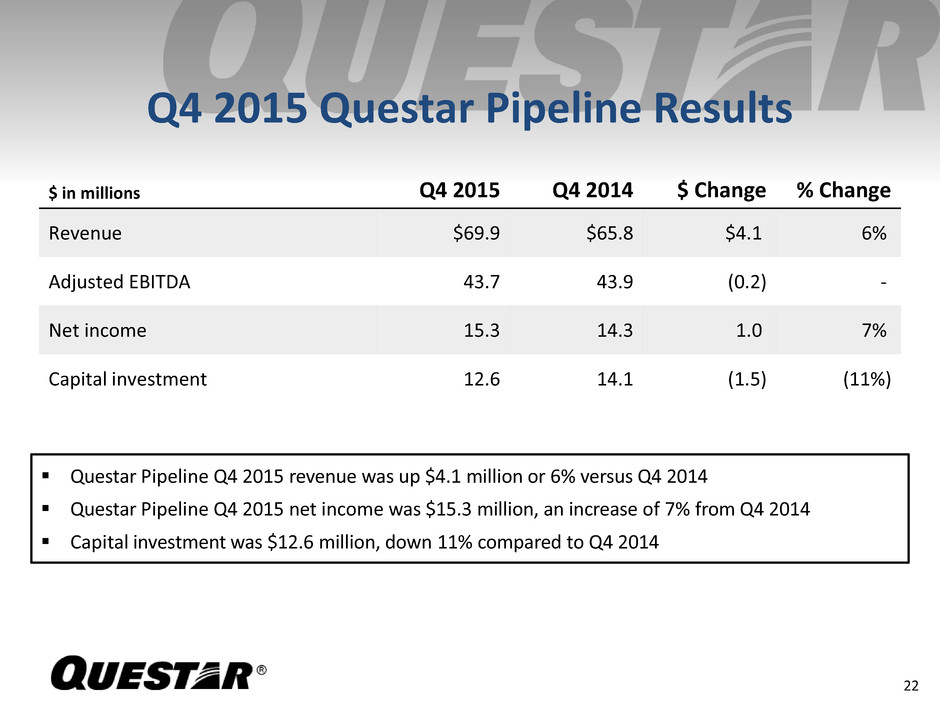
Questar Pipeline Q4 2015 revenue was up $4.1 million or 6% versus Q4 2014 Questar Pipeline Q4 2015 net income was $15.3 million, an increase of 7% from Q4 2014 Capital investment was $12.6 million, down 11% compared to Q4 2014 22 Q4 2015 Questar Pipeline Results $ in millions Q4 2015 Q4 2014 $ Change % Change Revenue $69.9 $65.8 $4.1 6% Adjusted EBITDA 43.7 43.9 (0.2) - Net income 15.3 14.3 1.0 7% Capital investment 12.6 14.1 (1.5) (11%)
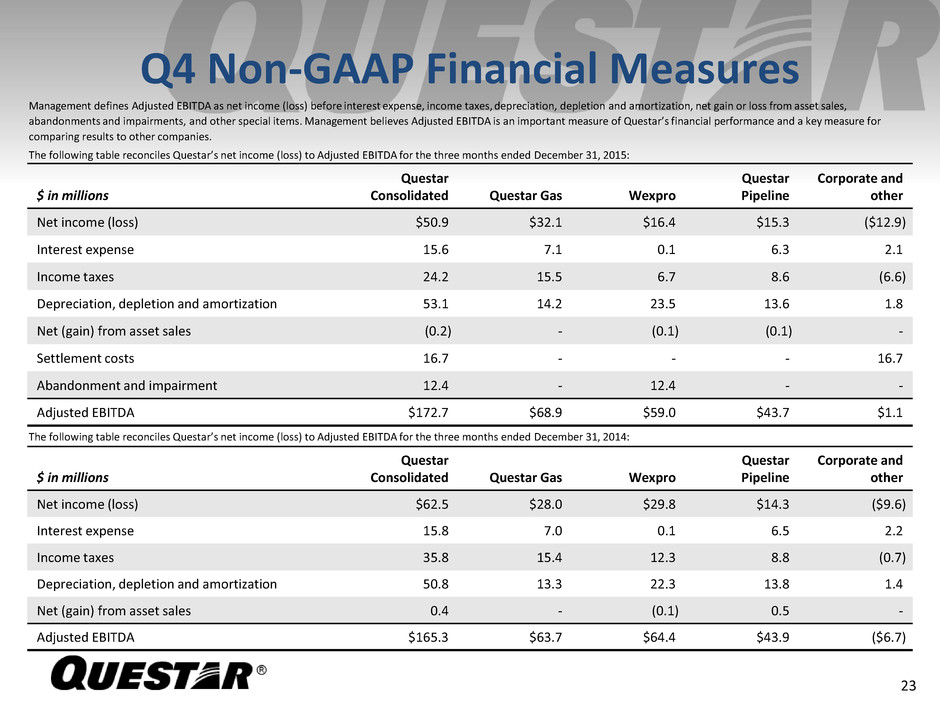
$ in millions Questar Consolidated Questar Gas Wexpro Questar Pipeline Corporate and other Net income (loss) $62.5 $28.0 $29.8 $14.3 ($9.6) Interest expense 15.8 7.0 0.1 6.5 2.2 Income taxes 35.8 15.4 12.3 8.8 (0.7) Depreciation, depletion and amortization 50.8 13.3 22.3 13.8 1.4 Net (gain) from asset sales 0.4 - (0.1) 0.5 - Adjusted EBITDA $165.3 $63.7 $64.4 $43.9 ($6.7) Q4 Non-GAAP Financial Measures 23 Management defines Adjusted EBITDA as net income (loss) before interest expense, income taxes, depreciation, depletion and amortization, net gain or loss from asset sales, abandonments and impairments, and other special items. Management believes Adjusted EBITDA is an important measure of Questar’s financial performance and a key measure for comparing results to other companies. The following table reconciles Questar’s net income (loss) to Adjusted EBITDA for the three months ended December 31, 2015: $ in millions Questar Consolidated Questar Gas Wexpro Questar Pipeline Corporate and other Net income (loss) $50.9 $32.1 $16.4 $15.3 ($12.9) Interest expense 15.6 7.1 0.1 6.3 2.1 Income taxes 24.2 15.5 6.7 8.6 (6.6) Depreciation, depletion and amortization 53.1 14.2 23.5 13.6 1.8 Net (gain) from asset sales (0.2) - (0.1) (0.1) - Settlement costs 16.7 - - - 16.7 Abandonment and impairment 12.4 - 12.4 - - Adjusted EBITDA $172.7 $68.9 $59.0 $43.7 $1.1 The following table reconciles Questar’s net income (loss) to Adjusted EBITDA for the three months ended December 31, 2014:
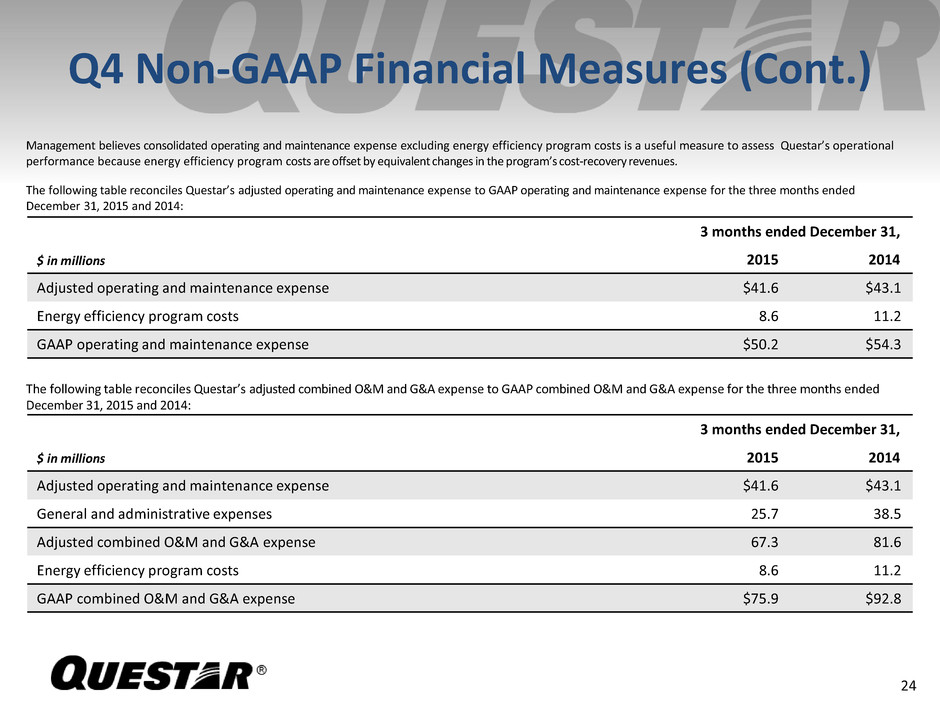
Q4 Non-GAAP Financial Measures (Cont.) 24 Management believes consolidated operating and maintenance expense excluding energy efficiency program costs is a useful measure to assess Questar’s operational performance because energy efficiency program costs are offset by equivalent changes in the program’s cost-recovery revenues. The following table reconciles Questar’s adjusted operating and maintenance expense to GAAP operating and maintenance expense for the three months ended December 31, 2015 and 2014: $ in millions 3 months ended December 31, 2015 2014 Adjusted operating and maintenance expense $41.6 $43.1 Energy efficiency program costs 8.6 11.2 GAAP operating and maintenance expense $50.2 $54.3 $ in millions 3 months ended December 31, 2015 2014 Adjusted operating and maintenance expense $41.6 $43.1 General and administrative expenses 25.7 38.5 Adjusted combined O&M and G&A expense 67.3 81.6 Energy efficiency program costs 8.6 11.2 GAAP combined O&M and G&A expense $75.9 $92.8 The following table reconciles Questar’s adjusted combined O&M and G&A expense to GAAP combined O&M and G&A expense for the three months ended December 31, 2015 and 2014:
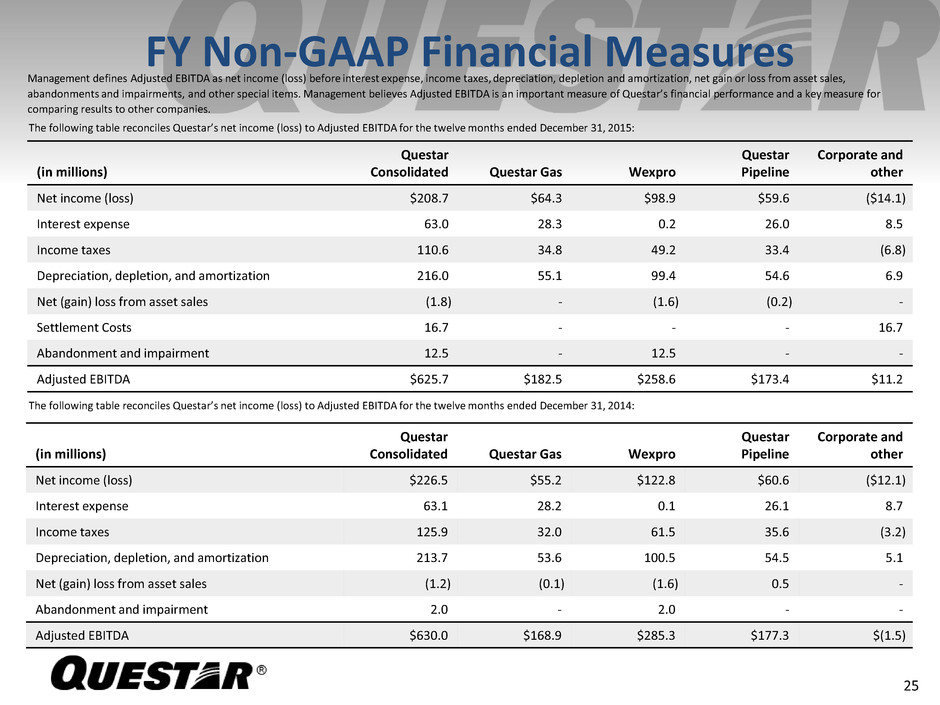
FY Non-GAAP Financial Measures 25 Management defines Adjusted EBITDA as net income (loss) before interest expense, income taxes, depreciation, depletion and amortization, net gain or loss from asset sales, abandonments and impairments, and other special items. Management believes Adjusted EBITDA is an important measure of Questar’s financial performance and a key measure for comparing results to other companies. The following table reconciles Questar’s net income (loss) to Adjusted EBITDA for the twelve months ended December 31, 2015: The following table reconciles Questar’s net income (loss) to Adjusted EBITDA for the twelve months ended December 31, 2014: (in millions) Questar Consolidated Questar Gas Wexpro Questar Pipeline Corporate and other Net income (loss) $208.7 $64.3 $98.9 $59.6 ($14.1) Interest expense 63.0 28.3 0.2 26.0 8.5 Income taxes 110.6 34.8 49.2 33.4 (6.8) Depreciation, depletion, and amortization 216.0 55.1 99.4 54.6 6.9 Net (gain) loss from asset sales (1.8) - (1.6) (0.2) - Settlement Costs 16.7 - - - 16.7 Abandonment and impairment 12.5 - 12.5 - - Adjusted EBITDA $625.7 $182.5 $258.6 $173.4 $11.2 (in millions) Questar Consolidated Questar Gas Wexpro Questar Pipeline Corporate and other Net income (loss) $226.5 $55.2 $122.8 $60.6 ($12.1) Interest expense 63.1 28.2 0.1 26.1 8.7 Income taxes 125.9 32.0 61.5 35.6 (3.2) Depreciation, depletion, and amortization 213.7 53.6 100.5 54.5 5.1 Net (gain) loss from asset sales (1.2) (0.1) (1.6) 0.5 - Abandonment and impairment 2.0 - 2.0 - - Adjusted EBITDA $630.0 $168.9 $285.3 $177.3 $(1.5)
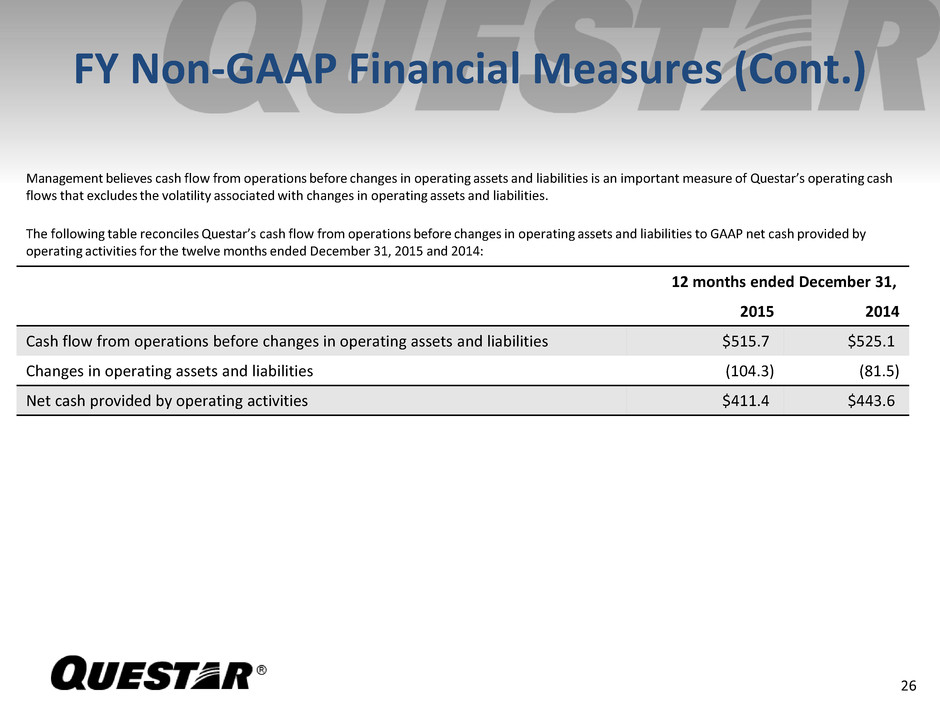
FY Non-GAAP Financial Measures (Cont.) 26 Management believes cash flow from operations before changes in operating assets and liabilities is an important measure of Questar’s operating cash flows that excludes the volatility associated with changes in operating assets and liabilities. The following table reconciles Questar’s cash flow from operations before changes in operating assets and liabilities to GAAP net cash provided by operating activities for the twelve months ended December 31, 2015 and 2014: 12 months ended December 31, 2015 2014 Cash flow from operations before changes in operating assets and liabilities $515.7 $525.1 Changes in operating assets and liabilities (104.3) (81.5) Net cash provided by operating activities $411.4 $443.6
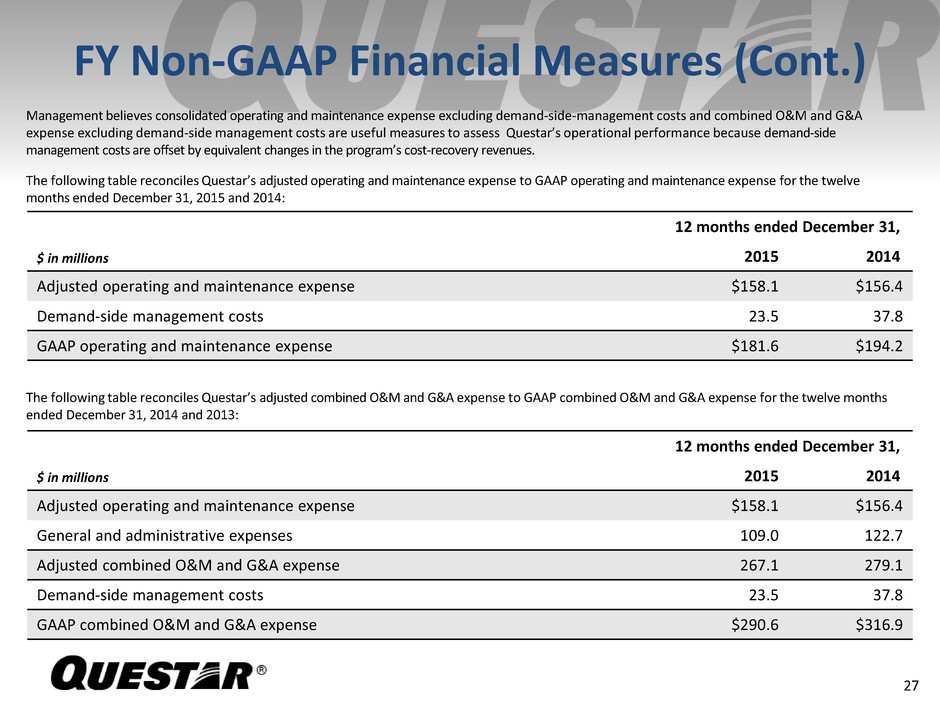
27 FY Non-GAAP Financial Measures (Cont.) $ in millions 12 months ended December 31, 2015 2014 Adjusted operating and maintenance expense $158.1 $156.4 Demand-side management costs 23.5 37.8 GAAP operating and maintenance expense $181.6 $194.2 Management believes consolidated operating and maintenance expense excluding demand-side-management costs and combined O&M and G&A expense excluding demand-side management costs are useful measures to assess Questar’s operational performance because demand-side management costs are offset by equivalent changes in the program’s cost-recovery revenues. The following table reconciles Questar’s adjusted operating and maintenance expense to GAAP operating and maintenance expense for the twelve months ended December 31, 2015 and 2014: $ in millions 12 months ended December 31, 2015 2014 Adjusted operating and maintenance expense $158.1 $156.4 General and administrative expenses 109.0 122.7 Adjusted combined O&M and G&A expense 267.1 279.1 Demand-side management costs 23.5 37.8 GAAP combined O&M and G&A expense $290.6 $316.9 The following table reconciles Questar’s adjusted combined O&M and G&A expense to GAAP combined O&M and G&A expense for the twelve months ended December 31, 2014 and 2013:
