Attached files
| file | filename |
|---|---|
| EX-99.1 - EX-99.1 - NABORS INDUSTRIES LTD | a16-4572_1ex99d1.htm |
| 8-K - 8-K - NABORS INDUSTRIES LTD | a16-4572_18k.htm |
Exhibit 99.2
4Q15 Earnings Presentation February 17, 2016 Presenters: Anthony G. Petrello Chairman, President & Chief Executive Officer William J. Restrepo Chief Financial Officer

Forward-Looking Statements 2 We often discuss expectations regarding our markets, demand for our products and services, and our future performance in our annual and quarterly reports, press releases, and other written and oral statements. Such statements, including statements in this document incorporated by reference that relate to matters that are not historical facts are “forward-looking statements” within the meaning of the safe harbor provisions of Section 27A of the U.S. Securities Act of 1933, as amended (the “Securities Act”) and Section 21E of the U.S. Securities Exchange Act of 1934. These “forward-looking statements” are based on our analysis of currently available competitive, financial and economic data and our operating plans. They are inherently uncertain, and investors must recognize that events and actual results could turn out to be significantly different from our expectations. Factors to consider when evaluating these forward-looking statements include, but are not limited to: fluctuations and volatility in worldwide prices and demand for natural gas and oil; fluctuations in levels of natural gas and oil exploration and development activities; fluctuations in the demand for our services; Competitive and technological changes and other developments in the oilfield services industry; Changes in the market value of investments accounted for using the equity method of accounting; the existence of operating risks inherent in the oilfield services industry; the possibility of changes in tax laws and other laws and regulations; the possibility of political or economic instability, civil disturbance, war or acts of terrorism in any of the countries in which we ---ido business; and general economic conditions including the capital and credit markets. Our businesses depend, to a large degree, on the level of spending by oil and gas companies for exploration, development and production activities. Therefore, a sustained decrease in the price of natural gas or oil, which could have a material impact on exploration and production activities, could also materially affect our financial position, results of operations and cash flows. The above description of risks and uncertainties is by no means all inclusive, but is designed to highlight what we believe are important factors to consider. Statements made in this presentation include non-GAAP financial measures. The required reconciliation to the nearest comparable GAAP financial measures is included on of our website at http://www.nabors.com.
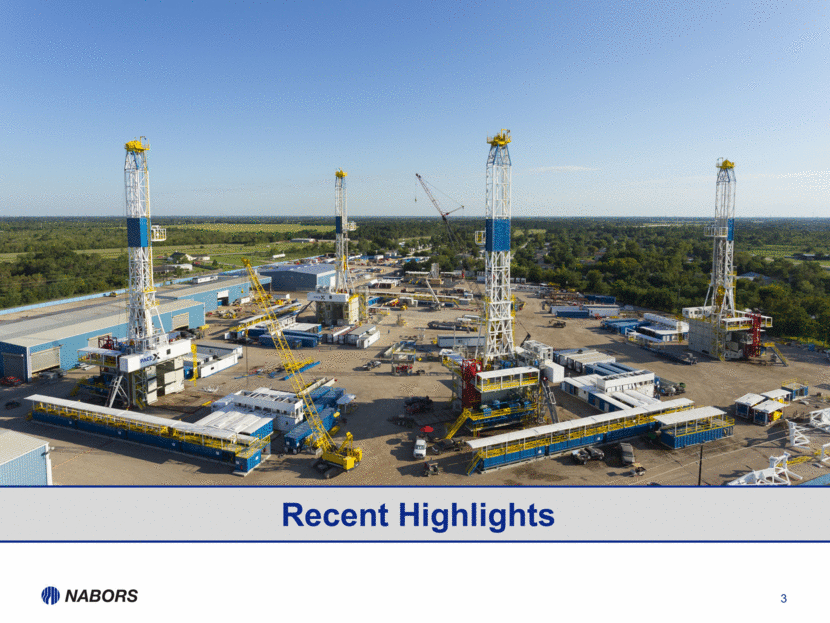
3 Recent Highlights
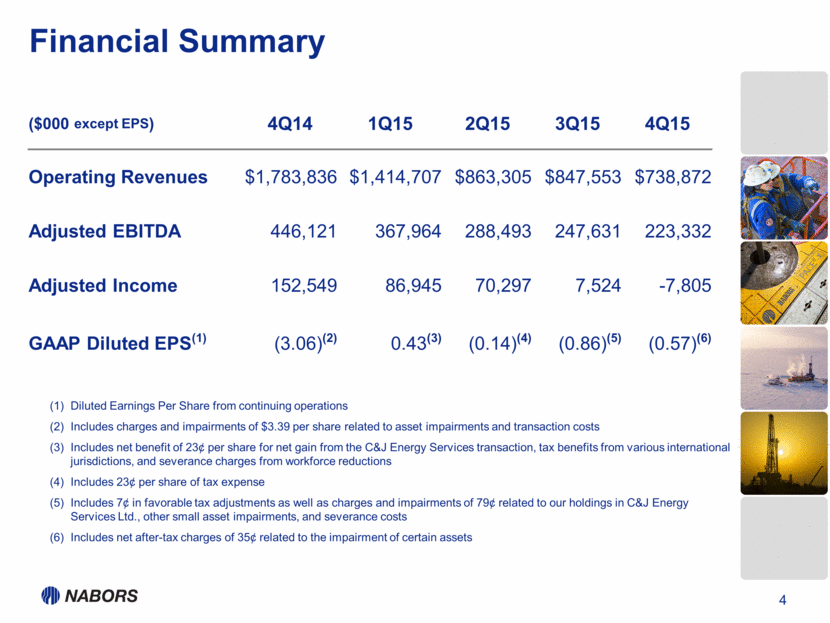
4 Financial Summary Diluted Earnings Per Share from continuing operations Includes charges and impairments of $3.39 per share related to asset impairments and transaction costs Includes net benefit of 23¢ per share for net gain from the C&J Energy Services transaction, tax benefits from various international jurisdictions, and severance charges from workforce reductions Includes 23¢ per share of tax expense Includes 7¢ in favorable tax adjustments as well as charges and impairments of 79¢ related to our holdings in C&J Energy Services Ltd., other small asset impairments, and severance costs Includes net after-tax charges of 35¢ related to the impairment of certain assets ($000 except EPS) 4Q14 1Q15 2Q15 3Q15 4Q15 Operating Revenues $1,783,836 $1,414,707 $863,305 $847,553 $738,872 Adjusted EBITDA 446,121 367,964 288,493 247,631 223,332 Adjusted Income 152,549 86,945 70,297 7,524 -7,805 GAAP Diluted EPS(1) (3.06)(2) 0.43(3) (0.14)(4) (0.86)(5) (0.57)(6)
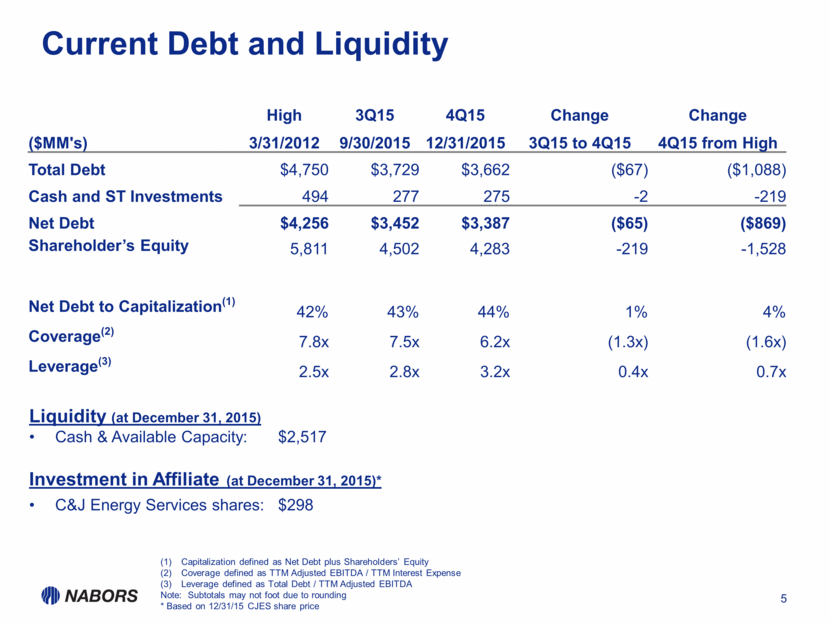
Current Debt and Liquidity 5 Capitalization defined as Net Debt plus Shareholders’ Equity Coverage defined as TTM Adjusted EBITDA / TTM Interest Expense Leverage defined as Total Debt / TTM Adjusted EBITDA Note: Subtotals may not foot due to rounding * Based on 12/31/15 CJES share price Liquidity (at December 31, 2015) Cash & Available Capacity: $2,517 Investment in Affiliate (at December 31, 2015)* C&J Energy Services shares: $298 High 3Q15 4Q15 Change Change ($MM's) 3/31/2012 9/30/2015 12/31/2015 3Q15 to 4Q15 4Q15 from High Total Debt $4,750 $3,729 $3,662 ($67) ($1,088) Cash and ST Investments 494 277 275 -2 -219 Net Debt $4,256 $3,452 $3,387 ($65) ($869) Shareholder’s Equity 5,811 4,502 4,283 -219 -1,528 Net Debt to Capitalization(1) 42% 43% 44% 1% 4% Coverage(2) 7.8x 7.5x 6.2x (1.3x) (1.6x) Leverage(3) 2.5x 2.8x 3.2x 0.4x 0.7x
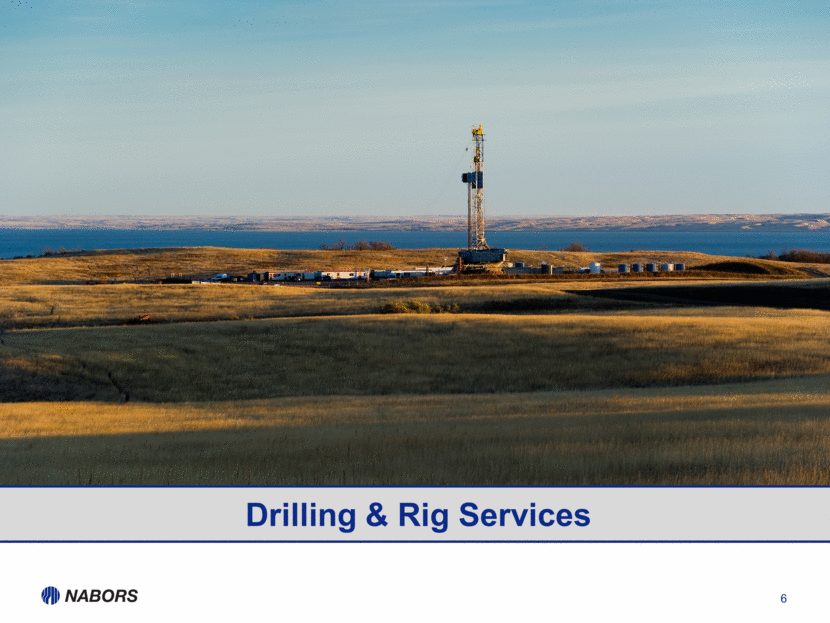
6 Drilling & Rig Services
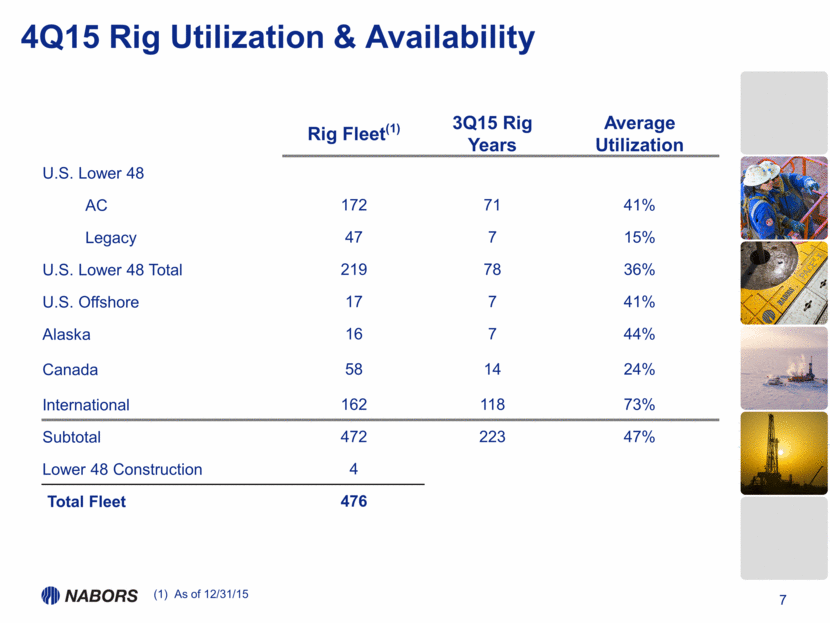
4Q15 Rig Utilization & Availability 7 Rig Fleet(1) 3Q15 Rig Years Average Utilization U.S. Lower 48 AC 172 71 41% Legacy 47 7 15% U.S. Lower 48 Total 219 78 36% U.S. Offshore 17 7 41% Alaska 16 7 44% Canada 58 14 24% International 162 118 73% Subtotal 472 223 47% Lower 48 Construction 4 Total Fleet 476 As of 12/31/15
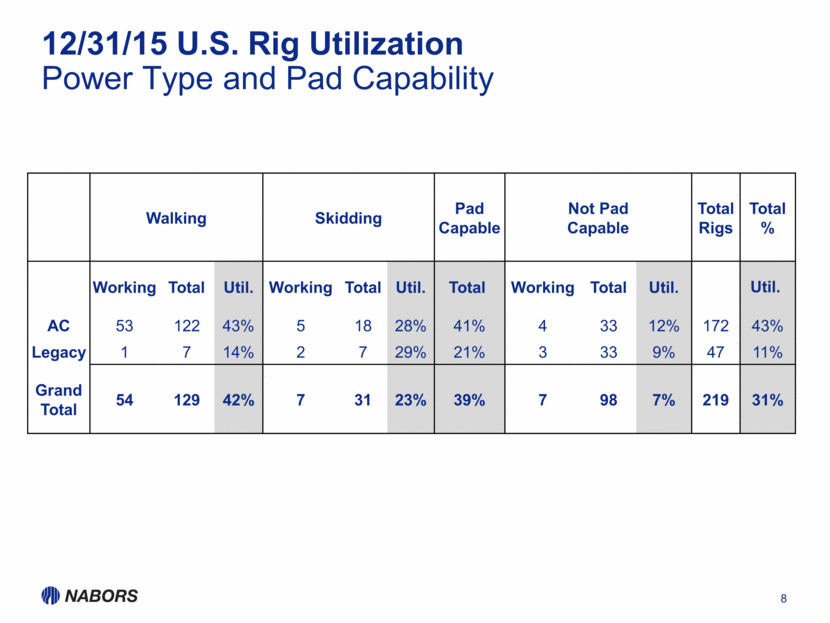
12/31/15 U.S. Rig Utilization Power Type and Pad Capability 8 Walking Skidding Pad Capable Not Pad Capable Total Rigs Total % Working Total Util. Working Total Util. Total Working Total Util. Util. AC 53 122 43% 5 18 28% 41% 4 33 12% 172 43% Legacy 1 7 14% 2 7 29% 21% 3 33 9% 47 11% Grand Total 54 129 42% 7 31 23% 39% 7 98 7% 219 31%
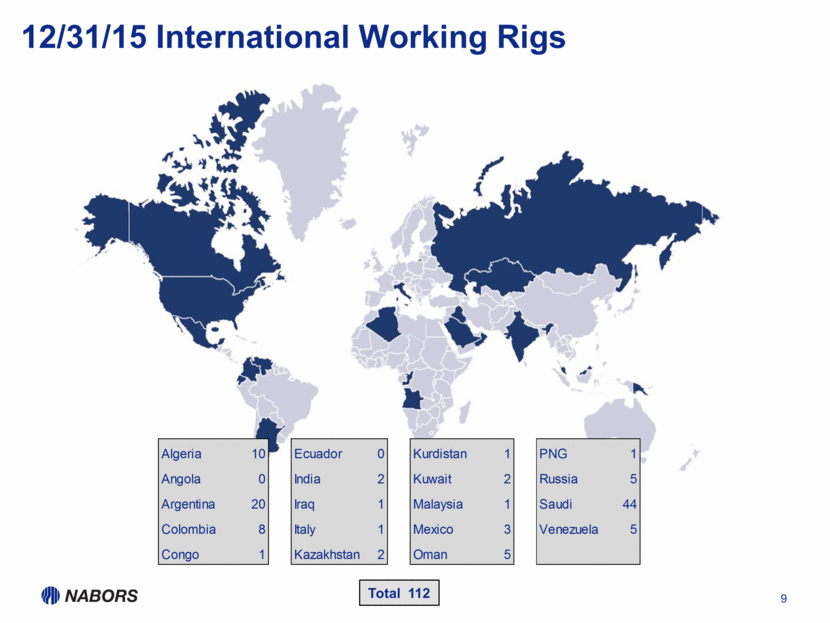
12/31/15 International Working Rigs 9 Total 112 Algeria 10 Ecuador 0 Kurdistan 1 PNG 1 Angola 0 India 2 Kuwait 2 Russia 5 Argentina 20 Iraq 1 Malaysia 1 Saudi 44 Colombia 8 Italy 1 Mexico 3 Venezuela 5 Congo 1 Kazakhstan 2 Oman 5
10 Outlook and Summary

Strategic Focus Capitalize on the existing asset base Differentiate the rig and service offerings Enhance operational excellence Improve financial flexibility 11
12 Appendix
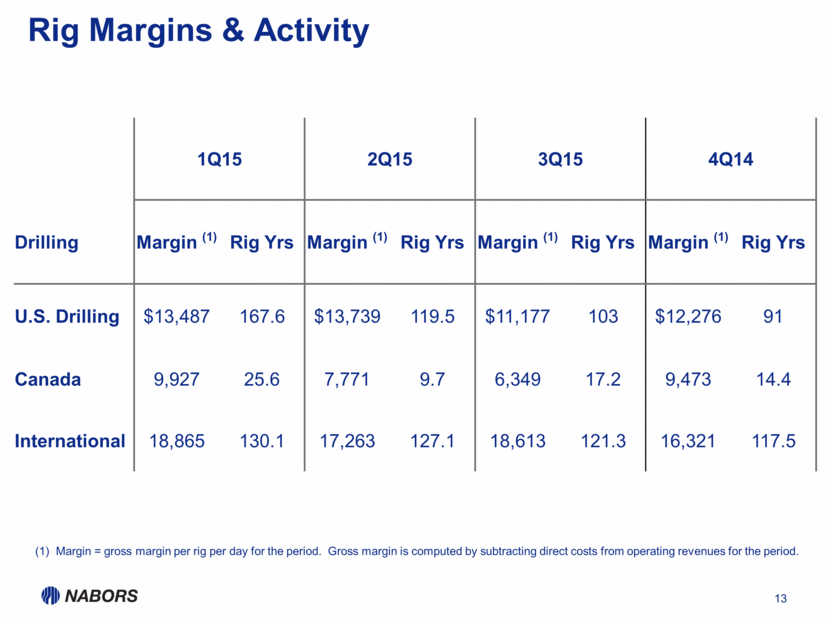
13 Rig Margins & Activity Margin = gross margin per rig per day for the period. Gross margin is computed by subtracting direct costs from operating revenues for the period. 1Q15 2Q15 3Q15 4Q14 Drilling Margin (1) Rig Yrs Margin (1) Rig Yrs Margin (1) Rig Yrs Margin (1) Rig Yrs U.S. Drilling $13,487 167.6 $13,739 119.5 $11,177 103 $12,276 91 Canada 9,927 25.6 7,771 9.7 6,349 17.2 9,473 14.4 International 18,865 130.1 17,263 127.1 18,613 121.3 16,321 117.5
