Attached files
| file | filename |
|---|---|
| 8-K - 8-K - Baxalta Inc | d141413d8k.htm |
| EX-99.1 - EX-99.1 - Baxalta Inc | d141413dex991.htm |
 Baxalta Incorporated Fourth Quarter 2015 Financial Results And Business Performance Update February 16 , 2016 th Exhibit 99.2 |
| Baxalta Performance Update | Q4 2015 | Page 2
Forward-Looking Statements And
GAAP Reconciliation
“Safe Harbor” Statement under the Private Securities
Litigation Reform Act of 1995: This presentation includes forward-looking statements
concerning expectations, prospects, estimates and other matters
that are dependent upon future events or developments. Forward-looking statements are subject to a number of risks and uncertainties, many of which involve factors or circumstances that are beyond Baxalta's control and which could cause actual results to differ materially from those in the forward-looking statements,
including, but not limited to, the following:
demand for and market acceptance of risks for new and existing products; product development risks; product quality or patient safety concerns; future actions of regulatory bodies and other governmental authorities, including the FDA and
foreign counterparts; failures with respect to
compliance programs; future actions of third-parties, including payers; U.S. healthcare reform and other global austerity measures; pricing, reimbursement, taxation and rebate policies of government agencies and private payers; the
impact of competitive
products
and
pricing,
including
generic
competition,
drug
reimportation
and
disruptive
technologies;
global,
trade
and
tax
policies; accurate identification of and execution on business
development and R&D opportunities and realization of anticipated benefits; fluctuations in supply and demand and the pricing of plasma-based therapies; the availability of acceptable raw
materials and component supply; the inability to
create timely production capacity or other manufacturing or supply difficulties; the ability to successfully achieve the intended results of the spin-off from Baxter International Inc.; the ability to enforce owned or in-licensed
patents, or the patents of third parties preventing
or restricting manufacture, sale or use of affected products or technology; the impact of global economic conditions; fluctuations in foreign exchange and interest rates; any changes in law concerning the taxation of income, including income
earned outside the United States; actions by tax
authorities in connection with ongoing tax audits; breaches or failures of Baxalta’s information technology systems; loss of key employees or inability to identify and recruit new employees; the outcome of pending or future
litigation; the adequacy of Baxalta’s cash
flows from operations to meet its ongoing cash obligations and fund its investment program; the inability to complete the proposed combination with Shire plc (Shire) due to failure to obtain the approval of Baxalta’s or Shire’s stockholders or the failure to satisfy other conditions to completion of the proposed combination; the failure to obtain regulatory approvals required for the
proposed combination, or required regulatory
approvals delaying the proposed combination or causing the parties to abandon the proposed combination; the occurrence of any event, change or other circumstance that could give rise to the termination of the
merger agreement related
to
the
proposed
combination;
the
amount
of
the
costs,
fees,
expenses
and
charges
related
to
the
proposed
combination;
the
effect
of the announcement of the proposed combination on Baxalta’s
client relationships, operating results and business generally, including without limitation the ability to retain key employees; the potential diversion of Baxalta’s management’s attention resulting from the proposed combination and of the combined company’s management’s attention resulting from integration issues after
the proposed combination; and other risks
identified in Baxalta’s Securities and Exchange Commission (SEC) filings, all of which are available on Baxalta’s website, as well as other risks related to the proposed combination identified in Shire’s respective filings with the
SEC. This presentation reflects
management’s
views
as
of
February
16,
2016.
Except
to
the
extent
required
by
applicable
law,
we
undertake
no
obligation
to
update or revise any forward-looking statement.
Non-GAAP Financial Measures:
The financial information included in this presentation includes financial measures that are not calculated in accordance with generally accepted accounting principles (GAAP). Reconciliations of the GAAP to non-GAAP financial
measures can be found
on
slides
40
-
46. |
 Table Of Contents |
 Baxalta Performance Update | Q4 2015 | Page 4
Achieving ~20 new product launches by 2020
• Advancing the pipeline with key milestone achievements and 3 key approvals in
2015
• Driving enhanced value from new products with 2015 sales of ~$300
million
Sustaining growth and value across the portfolio
• Generating positive sales momentum across broad and diversified portfolio
• Demonstrating compelling commercial, regulatory, operational & financial execution
Augmenting portfolio with disciplined M&A
initiatives •
Maximizing value with ONCASPAR leukemia portfolio
acquisition •
Accelerating innovation with strategic collaborations and
partnerships Creating value with compelling financial
profile •
Exceeding guidance in 2H 2015 across key financial
metrics •
Delivering strong Q4 2015 results with sales growth* of 10%
(constant currency) and adjusted EPS of
$0.57** *Growth
compares
to
2014
pro
forma
sales
**Financial
results
and
guidance
exclude
special
items
and
are
presented
on
an
adjusted
basis;
refer
to
slides
40
–
46
for
information
regarding
non-GAAP
measures
used
throughout
the
presentation
Strong Execution Validates Baxalta’s
Commitment To Enhancing Shareholder Value
|
 Baxalta Performance Update | Q4 2015 | Page 5
$2,840
$787
$1,750
$766
$87
Hemophilia
Inhibitor Therapies
Immunoglobulin Therapies
BioTherapeutics
Oncology
$6.2B
+10% cc
Capabilities
100+ countries of
operation
Leadership
$6 billion global
biopharmaceutical
leader
Value
~20
new product
launches expected
by 2020
2015 Sales By Product Category*
$ In Millions
2015 Sales By Geography*
$ In Millions
*Growth compares to 2014 pro forma sales; 1H 2015 results include
pro forma adjustments $3,315
$2,915
U.S.
International
$6.2B
+10% cc
Driving Sustainable Growth And Value
|
 Baxalta Performance Update | Q4 2015 | Page 6
Strong ADVATE and FEIBA
FY performance
ADYNOVATE approval and
launch in U.S.
VONVENDI U.S. approval
Advancing Gene
Therapy
programs
Enhanced supply position
Strong market acceptance
of HYQVIA
Acquired SuppreMol
innovative technology
Advanced two biosimilar
anti-TNFs in Phase III
Completed ONCASPAR
acquisition
Received EU approval of
ONCASPAR
Preparing to launch
ONIVYDE
Collaborating with
Symphogen
on
check-point
inhibitors
Hematology*
Q4 2015
FY 2015
Immunology*
Q4 2015
FY 2015
Oncology
Q4 2015
FY 2015
*Growth
is
at
constant
currency
and
compares
to
2014
pro
forma
sales;
1H 2015
results
include
pro
forma
adjustments
for
Immunology
Generating Positive Momentum Across Portfolio
|
 Baxalta Performance Update | Q4 2015 | Page 7
Exceeding Sales Expectations
Across All Product Categories
% Growth At Constant Currency
*FY 2015 original guidance does not include pro forma
adjustments **Growth compares to 2014 pro forma
sales; 1H 2015 results include pro forma adjustments
FY 2015
Original
*
(Q1 Conference Call)
FY
2015
Guidance
**
(Q3 Conference Call)
FY 2015
Actual Results
**
Hemophilia
0%
-
2%
~3%
+4%
Inhibitor
Therapies
8%+
10% -
11%
+16%
Hematology
2% -
3%
~5%
+7%
Immunoglobulin
Therapies
6% -
8%
~9%
+9%
BioTherapeutics
2%
-
4%
~10%
+16%
Immunology
5% -
7%
~9%
+11%
Oncology
N/A
~$80M
$87M
Baxalta
~4%
~8%
+10% |
 Baxalta Performance Update | Q4 2015 | Page 8
New Product
Launches By 2020
New Product Revenue
~$300 Million
2015 Actual Results
~$750 Million
2016 Guidance
Key Regulatory
Approvals
New Products In
Regulatory Review
20% IGSC
U.S./EU
ONIVYDE
EU
Our Pipeline Is Delivering Results
|
 Baxalta Performance Update | Q4 2015 | Page 9
ADYNOVATE
Launched in U.S.; met primary endpoint in Phase III pediatric
study VONVENDI
Received
U.S. regulatory approval
OBIZUR
Received EU
approval; recently launched in EU
BAX 826
Initiated
Phase I trial targeting once-weekly dosing regimen for
hemophilia A Gene
Therapy
FIX
Progressed Phase I/II open-label study (8 patients
dosed) HYQVIA
Initiated Phase III trial for patients with CIDP
20% IGSC
Submitted for U.S. and EU regulatory approval for PI
BAX 923
Initiated pivotal trial in chronic plaque psoriasis; met primary
endpoint in PK study BAX 2200
Met
primary
endpoints
in
Phase
III
trials
in
chronic
plaque
psoriasis
and
rheumatoid
arthritis
Sanquin
Received positive CHMP opinion
to begin production for EU for IG therapies
ONCASPAR
Received EU approval for use in
combination therapy to treat ALL
ONIVYDE
Submitted European MAA; FDA
approval granted to Merrimack
Symphogen
Established strategic collaboration
to accelerate
innovation in immuno-oncology
Oncology
Immunology
Hematology
Achieving Key Milestones |
 Baxalta Performance Update | Q4 2015 | Page 10
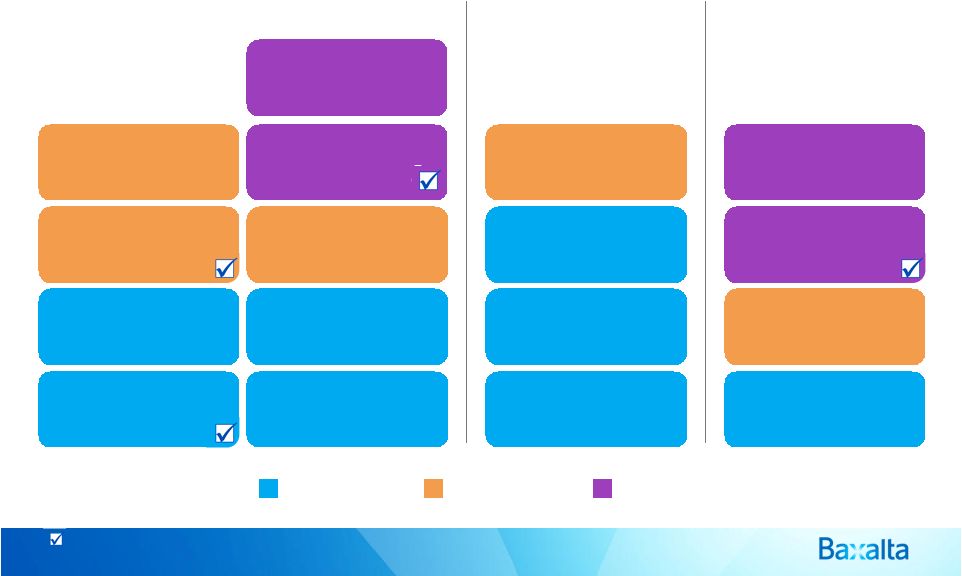
~20 New Launches Expected By 2020
Indicates the product has been approved or launched
Oncology
Immunology
Hematology
ADYNOVATE and Oncology geographic expansion included; excludes
additional externally-sourced assets
ONIVYDE
1 line Metastatic
Pancreatic Cancer
[EU]
ONIVYDE
Pancreatic Cancer
Post-Gemcitabine
[EU]
Etanercept
(BAX 2200)
[EU]
Adalimumab
(BAX 923)
[U.S. & EU]
Imalumab
(BAX 069)
Malignant Ascites
[U.S.]
ONIVYDE
1
line Gastric
Cancer
[EU]
IG 10% HYQVIA
CIDP
[U.S.]
rFVIIa
(BAX 817)
[U.S.]
rADAMTS13
hTTP
(BAX 930)
[U.S.]
Alpha-1
GvHD
[U.S.]
Imalumab (BAX 069)
3 line Metastatic
Colorectal
[U.S.]
ONCASPAR
Lyophilized
ALL
[EU]
Calaspargase
pegol
ALL
[U.S.]
20% IGSC
[U.S. & EU]
ADYNOVATE
(BAX 855)
[Japan]
ONCASPAR
ALL
[Japan]
ONIVYDE
Pancreatic Cancer
Post-Gemcitabine
[Japan]
EHL rFVIII
PSA
(BAX 826)
[U.S.]
2015
2016
2018 -
2020
2017
ONCASPAR
Lyophilized
ALL
[U.S.]
ADYNOVATE
(BAX 855)
[U.S.]
RIXUBIS
[EU]
VONVENDI
(BAX 111)
[U.S.]
FEIBA
Recon Reduction
[U.S.]
OBIZUR CHAWI
Surgery
[U.S.]
GT FIX
(BAX 335)
[U.S.]
ADYNOVATE
(BAX 855)
[EU]
OBIZUR
[EU]
ONCASPAR
ALL
[EU]
st
st
rd |
 Baxalta Performance Update | Q4 2015 | Page 11
Acquisitions
Partnerships
Advancing External Innovation Through
Successful Partnerships And Acquisitions
|
 Baxalta Performance Update | Q4 2015 | Page 12 Leadership • Established $6 billion global biopharmaceutical leader focused on orphan diseases
• Well positioned in attractive and growing markets with differentiated therapies • Strong global channels and patient relationships and potential to broaden access in
emerging markets
Capabilities
• Leader in creating dynamic business models to improve patient access & utilization
• Attractive business development and licensing partner • Best-in-class global biologic manufacturing network with proprietary technology
platforms, such as gene therapy
Value
• Robust and balanced late-stage pipeline spanning core therapeutic disease areas
• Driving acceleration in sales and profitability with ~20 new products by 2020
• Attractive financial profile with compelling cash flow generation and disciplined
capital allocation approach
Baxalta: A Compelling & Unique
Investment Opportunity |
 Baxalta Performance Update | Q3 2015 | Page 2
Baxalta
Q4 2015 Performance Update
Innovation Highlights |
 Baxalta Performance Update | Q4 2015 | Page 14
Building A Robust And Diverse Pipeline:
Key Programs*
Program
Pre-Clinical
Phase I
Phase II
Phase III
Reg. Review
Approved
EHL rFVIII PEG (BAX 855)
EU
Japan
U.S.
VONVENDI (BAX 111)
EU
U.S.
OBIZUR: Acquired Hemophilia A
EU
rADAMTS13 (BAX 930)
FIX Gene Therapy (BAX 335)
EHL rFVIII
PSA (BAX 826)
FVIII Gene Therapy (BAX 888)
Anti-TFPI: Hemophilia
20% IGSC: PID
U.S. & EU
HYQVIA: CIDP
Etanercept
(BAX 2200)
Adalimumab
(BAX 923)
Pivotal
Alpha-1 GvHD
Fc
RIIb
(SM101): SLE
Fc
RIIb
(SM2X1): Myasthenia Gravis
Fc
RIIb
(SM301): Allergic Asthma
ONCASPAR
EU
Calaspargase pegol
ONIVYDE: 2
nd
Line Pancreatic Cancer
EU
ONIVYDE: Gastric 1
st
Line
ONIVYDE: Pancreatic 1
st
Line
Imalumab
(BAX 069): Colorectal
Imalumab (BAX 069): Malignant Ascites
*Key Programs = programs with $200M+ peak sales
potential |
 Baxalta Performance Update | Q4 2015 | Page 15
Broadest Portfolio Of Hemophilia Treatments
Strength Of Hemophilia Portfolio
Delivers Sustainable Growth
• EHL category represents ~35% of U.S. patient share by 2020; ~45% by 2025 • Non-factor therapies penetration expected to be limited - Real-world efficacy and safety unknown - BXLT owns relevant IP in applicable countries related to procoagulant antibodies that bind FIX - Slower adoption OUS - Eclipsed by entry of gene therapy • Continued investment drives hemophilia leadership beyond 2020 - Gene Therapy: BAX 335 and BAX 888 - Early stage SubQ (e.g. anti-TFPI) Focusing On The Most Important Goal: Bleed Protection Portfolio Advancement Towards Elevated & Sustained Factor Levels ADVATE Base FVIII ADYNOVATE BAX 826 Extended Half-Life BAX 335 BAX 888 Gene Therapy >10% shown to be associated with decrease in annual joint bleeds >10% shown to be associated with decrease in annual joint bleeds den Uijl IEM et al. Haemophilia. 2011, 17: 849-853; chart adapted from den Uijl, et al,
2011 |
 Baxalta Performance Update | Q4 2015 | Page 16
Transforming Hemophilia Care
With Gene Therapy
Gene Therapy Offers A Potentially Game-Changing Treatment
Option For Patients •
Elevated trough direct-factor replacement with multi-year
re-dosing potential •
Development hurdles include wider patient eligibility, immune
response, and re-dosing
options •
Baxalta leadership based on AAV8 progress and IP
strength BAX 335 (FIX)
• AAV8 technology with Padua transgene yielding seven-fold increase in activity • 8 patients dosed in clinic - FIX expression was observed in all patients in medium to high dose cohort - 1 patient demonstrated sustained 20% - 25% expression for more than 12 months with no bleeding events • Expected launch timing: 2020 BAX 888 (FVIII) • Leveraging successful AAV8 technology from FIX clinical trials with B-domain deleted transgene • Expect to begin Phase I/II clinical trial in 2016 • Expected launch timing: 2023 |
 Baxalta Performance Update | Q4 2015 | Page 17
Additional Benefits Of FVIII May Not
Be Replicated By Mimetics
Non-Factor Approaches (i.e. ACE 910)
Face Important Safety And Efficacy
Limitations:
• Lower affinity for FIXa and FX compared to FVIII • Only ~10% of the catalytic efficacy of FVIII • Does not bind to the platelet surface like FVIII does • Caused non-neutralizing antibodies in 3 of 18 patients In a primate model study, hyperplasia and vascular proliferation in the joint were found, despite the presence of ACE 910 4 1 Kitazawa et al. Nat Med. 2012;18(10):1570-1574; 2 Soeda et al. Poster presented at WFH World Congress; May 11-15; Melbourne, Australia; 3 Phase 1 study of ACE910 in healthy volunteers and hemophilia A patients; 4 Muto et al. Blood 2014; 124(20): 3165-3171 FVIII Replacement Therapies Set High Bar For Hemophilia Treatments Inflammation Vascular Integrity (aging population) Platelet Function Bone Remodeling Emerging Hypothesis on FVIII Benefits Beyond the Bleed 1 2 1 3 Wound Healing |
 Baxalta Performance Update | Q4 2015 | Page 18
Introducing Novel SuppreMol
Treatments With Significant Potential
IgG Immune
Complex Scavenger
Fc
RIIB
Agonist
(IgG)
IgE
Competitive
Antagonist
Mechanism
Receptor fragment protein
binds to circulating immune
complexes
Monoclonal antibody binds to
inhibitory receptor to actively down
regulate immune response
Inhibits IgE
mediated
allergic response
Indications
Immune complex
mediated diseases
(e.g. SLE, IgA Nephropathy)
Autoimmune diseases with
antibody mediated or more
complex mechanisms
Allergies or allergic
response diseases
Development
Successful Phase IIa
study (SLE)
Pre-clinical
Exploratory R&D
Advancing innovation with novel technology platforms
Addressing patient populations with significant unmet
need Expanding breadth of Immunology business
Targeting attractive markets with significant
revenue potential |
 Baxalta Performance Update | Q4 2015 | Page 19
Exciting Oncology Growth Prospects
Value
Proposition
• Integral component of many ALL treatment guidelines • 90% cure rate for children; 50% in young adults; 30% in adults • High relapse rate in older patients • Standard of care in 1 line ALL therapy for children in U.S. and Germany • Statistically significant survival benefit - 5-FU/LV of 6.1 months versus 4.2 months - 5-FU/LV of 3.1 months versus 1.5 months • Already in ESMO Guidelines • Manageable adverse event and toxicity profile Exciting Potential • Annual sales trending at ~$200M • Accelerates Baxalta’s rapid entry into Oncology; leverages global presence • Strengthens pipeline with additional indications and NME • Complements current partnerships • Priority FDA approval in 6 months • Exclusive OUS rights • Over 15k gemcitabine-exposed mPaCa patients in the EU5 (2 line) • Expand to 1 line treatment and additional indications Recent Milestones • Completed acquisition • Granted EU approval • Granted U.S. approval • Filed in EU (2 line) 2020 Market Opportunity st st nd nd |
 Baxalta Performance Update | Q4 2015 | Page 20
2016 Pipeline Catalysts
Oncology
Immunology
Hematology
BAX 2200
Etanercept
(EU)
ADYNOVATE
(EU)
ADYNOVATE
(U.S. Pediatric)
Regulatory
Filings
Calaspargase Pegol
(Phase III Data)
Clinical
Advancements
BAX 923
(Pivotal: Last Subject
Dosed)
Gene Therapy FIX
(Phase II: Last Subject
Dosed)
Gene Therapy FVIII
(Initiate Phase I)
VONVENDI
Pediatric & Prophylactic
(Initiate Phase III)
20% IGSC
(U.S. & EU)
ADYNOVATE
(Japan)
ONIVYDE
Pancreatic 2 Line
(EU)
Product
Approvals
MyPKFiT
(U.S.)
BAX 826
(Initiate Phase I)
HYQVIA
CIDP
(Initiate Phase III)
Alpha-1
GvHD
(Initiate Phase III)
ONCASPAR
(EU)
Indicates the milestone has been achieved
nd
ONIVYDE
Pancreatic 1 Line
(Initiate Phase III)
st |
 Baxalta Performance Update | Q3 2015 | Page 2
Baxalta
Q4 2015 Performance Update
Financial Summary |
 Baxalta Performance Update | Q4 2015 | Page 22
2H 2015 Adjusted Financial Results*
Q3 2015
Actual Results
Q4 2015
Actual Results
2H 2015
Actual Results
Sales ($ in
Millions) Growth**
$1,595
+13%
$1,763
+10%
$3,358
+12%
Gross Margin
61.9%
63.8%
62.9%
Operating Margin
31.2%
29.0%
30.1%
EBITDA Margin
34.4%
32.1%
33.2%
Tax Rate
22.1%
20.9%
21.5%
Diluted EPS
$0.56
$0.57
$1.13
*Financial results exclude special items and are presented on an
adjusted basis; refer to slides 40 -
46 for information regarding non-GAAP measures used
throughout the presentation **Growth rates are at
constant currency and compare to 2014 pro forma sales |
 Baxalta Performance Update | Q4 2015 | Page 23
Exceeding Guidance Across
Key Financial Metrics*
2H 2015
Guidance
(Investor Conference)
2H 2015
Guidance
(Q3 Conference Call)
2H 2015
Actual Results
Sales Growth**
2% -
3%
8% -
9%
12%
Gross Margin
58%
-
59%
~62%
63%
Operating Margin
~29%
~31%
30%
EBITDA Margin
~33%
~35%
33%
Tax Rate
23% -
24%
~23%
21.5%
Diluted EPS
N/A
$1.11 -
$1.13
$1.13
*Financial results and guidance exclude special items and are
presented on an adjusted basis; refer to slides 40
- 46 for information regarding non-GAAP
measures used throughout the presentation **Growth
rates are at constant currency and compare to 2014 pro forma sales |
 Baxalta Performance Update | Q4 2015 | Page 24
Driving Strong Financial Results:
Q4 And 2H 2015
Adjusted Sales Growth*
% Sales Growth At Constant Currency
Adjusted EPS**
$ Per Diluted Share
Guidance
Q4 2015
10%
2H 2015
12%
Guidance
Q4 2015
$0.57
2H 2015
$1.13
Guidance
Guidance
*Growth rates are at constant currency and compare to 2014 pro
forma sales **Financial results and guidance exclude
special items and are presented on an adjusted basis;
refer to slides 40 -
46 for information regarding non-GAAP measures used
throughout the presentation |
 Baxalta Performance Update | Q4 2015 | Page 25
Enhancing Strong Gross Margin Profile*
2H 2015 Gross Margin
% Of Sales
58% -
59%
~62%
63%
55%
60%
65%
Investor
Conference
Guidance
Revised
Guidance
(Q3 Conference Call)
2H 2015
Actual
Results
Gross Margin Drivers
• Favorable product mix driven by: - Strong sales of higher-margin therapies - ONCASPAR leukemia portfolio acquisition - rFVIII share retention • Modest price improvements • Foreign currency hedge gains Q4 2015 Gross Margin = 63.8% *Financial results and guidance exclude special items and are presented on an adjusted basis;
refer to slides 40 -
46 for information regarding non-GAAP measures used
throughout the presentation |
 Baxalta Performance Update | Q4 2015 | Page 26
Investing To Accelerate Future Growth
R&D
Expense
• Successfully meeting key milestones, advancing clinical trials • Building out medical affairs and R&D infrastructure • Balancing and prioritizing investments across disease areas • Advancing novel therapies through acquisitions and collaborations SG&A Expense • Selectively expanding our specialty sales force • Investing in marketing initiatives to prepare and launch new products: - ADYNOVATE - VONVENDI - Oncology therapies • Integrating ONCASPAR leukemia portfolio acquisition • Adding appropriate level of support to global infrastructure Building A Powerhouse In Product Development Transforming Into A Leading Biotech Company |
 Baxalta Performance Update | Q4 2015 | Page 27
Q1 2016 Financial Guidance
Guidance Reflects:
• Building strong sales momentum across all three businesses • Absorbing expected foreign currency headwinds (i.e., lower hedge gains) in gross margin with positive mix benefits • Investing to drive future growth - Benefiting from expanded specialty sales
force
- Preparing for new product launches - Building out Oncology and global infrastructure - Prioritizing R&D investments Q1 2016 Guidance* Hematology 4% - 5% Immunology 5% - 7% Oncology ~$50Mw
Total Sales Growth
(Constant Currency)
8% -
9%
Total Sales Growth
(Actual Rates)
4% -
5%
Diluted EPS**
$0.44 -
$0.46
*Growth
rates
are
at
constant
currency
unless
indicated
otherwise
and
compare
to
2014
pro
forma
sales
**Financial
guidance
excludes
special
items
and
is
presented
on
an
adjusted
basis;
refer
to
slides
40
-
46
for
information
regarding
non-GAAP
measures
used
throughout
the
presentation |
 Baxalta Performance Update | Q3 2015 | Page 2
Baxalta
Q4 2015 Performance Update
Business Review |
 Baxalta Performance Update | Q4 2015 | Page 29
Hematology
Positioned For Growth
• Strengthening our hematology leadership with broad portfolio of treatment options • Building personalized care through patient-centric innovation • Elevating access to treatment and standards of care globally • Diversifying to transform care in adjacent blood disorders Extending Legacy Of Leadership In Hematology Strengthening leadership and sustainability Differentiated inhibitor portfolio First recombinant Von Willebrand factor Strong global presence and growth Hematology FY 2015 Growth* Q4 2015 Growth* *Growth rates are at constant currency |
 Baxalta Performance Update | Q4 2015 | Page 30
Hematology: Q4 And FY 2015 Results*
Hemophilia
• Enhancing access and elevating standards of care globally • Maintaining leadership with broad portfolio of rFVIII treatment options: - Q4 U.S. sales growth in high single digits - Successful U.S. ADYNOVATE launch (including stocking orders) - Cumulative U.S. patient share loss of 3-4 points - Driving conversion in Brazil and Russia Inhibitor Therapies • FEIBA growth driven by: - Robust demand and conversion to prophylaxis - New tender sales in developing markets - Favorable geographic mix and modest price benefit • Contribution of OBIZUR for acquired hemophilia A Q4 2015 FY 2015 $ In Millions U.S. Int. Total U.S. Int. Total Hemophilia $375 $425 $800 $1,339 $1,501 $2,840 Growth +9% +1% +4% +5% +4% +4% Inhibitor Therapies $85 $145 $230 $295 $492 $787 Growth +25% +8% +14% +35% +9% +16% Hematology $460 $570 $1,030 $1,634 $1,993 $3,627 Growth +12% +2% +6% +9% +5% +7% *Growth rates are at constant currency |
 Baxalta Performance Update | Q4 2015 | Page 31
9%
7%
9%
8%
2%
4%
7%
4%
0%
5%
10%
15%
20%
Q1 14
Q2 14
Q3 14
Q4 14
Q1 15
Q2 15
Q3 15
Q4 15
Hematology: Quarterly Sales Growth
Hemophilia
% Sales Growth At Constant Currency
9%
2%
17%
33%
18%
12%
22%
14%
0%
10%
20%
30%
40%
Q1 14
Q2 14
Q3 14
Q4 14
Q1 15
Q2 15
Q3 15
Q4 15
Inhibitor Therapies
% Sales Growth At Constant Currency
|
 Baxalta Performance Update | Q4 2015 | Page 32
Unique And Attractive Global FVIII Market
Distinct Market Characteristics
• High brand loyalty and very low patient turnover despite eight competitors • Safety and efficacy are top considerations • Trusted safety profile requires years of real-world experience to establish • Individualized patient needs vary by segment • Patients require significant dose customization to achieve zero bleeds • Low patient switching due to concern regarding inhibitor development ~ $6.5B OUS Established Markets OUS Emerging Markets U.S. PUPs Prophylaxis On Demand 2014 Global FVIII Market |
 Baxalta Performance Update | Q4 2015 | Page 33
Positioned To Grow And Lead EHL
• ADYNOVATE launched in U.S. during Q4 2015 - Single-digit price premium to ADVATE on an annual cost of therapy basis - Manufacturing capacity in place to support launch • Strong IP Position - First approval of EHL product utilizing proprietary PEG technology - Exclusive licenses to Nektar Therapeutics FVIII patents and patent applications • U.S. pediatric and EU filing expected in Q1 2016; no inhibitors in pediatric study to date • Japan approval expected in 1H 2016; initiated PUP study in Q4 2015 ADYNOVATE: Blockbuster Potential ADYNOVATE To Stabilize U.S. rFVIII Patient Share Based on ADVATE: global rFVIII leader Extended half-life of 1.4 – 1.5 fold Simple, twice-weekly dosing 95% reduction in median ABR; 40% zero bleeds No patients developed inhibitors Among fastest development in hemophilia
A: ~4 years from Phase I to approval Key Attributes |
 Baxalta Performance Update | Q4 2015 | Page 34
Immunology
Positioned For Growth
• Building leadership in global markets characterized by robust demand • Capitalizing on a broad, differentiated IG portfolio • Improving supply with flexible, cost- effective capacity to support demand • Bolstering future growth with novel treatments Capitalizing On Transformational Differentiation FY 2015 Growth* Q4 2015 Growth* Immunology Capitalizing on transformational differentiation Bolstering future growth with novel treatments Optimizing global footprint with flexible supply Driving global awareness and demand *Growth rates are at constant currency and compare to 2014 pro forma results; 1H 2015 includes pro forma
adjustments |
 Baxalta Performance Update | Q4 2015 | Page 35
Immunology: Q4 And FY 2015 Results*
Immunoglobulin Therapies
• Enhancing penetration in under- treated diseases • Improved supply position • Continued strength of HYQVIA - Increased share in PID segment; annual sales run-rate approaching ~$150 million - Uptake supported by competitive gains; building momentum in EU markets - Difficult growth comparison due to ~$35 million stocking impact in Q4 2014 BioTherapeutics • Strong albumin growth, particularly in China • Alpha-1 therapies benefiting from: - Specialty sales force focus - Improved reimbursement • Increased contract-manufacturing revenues Q4 2015 FY 2015 $ In Millions U.S. Int. Total U.S. Int. Total Immunoglobulin Therapies $370 $103 $473 $1,350 $400 $1,750 Growth +1% +8% +3% +6% +17% +9% BioTherapeutics $69 $138 $207 $258 $508 $766 Growth +11% +28% +22% +6% +21% +16% Immunology $439 $241 $680 $1,608 $908 $2,516 Growth +3% +18% +8% +6% +19% +11% *Growth rates are at constant currency and compare to 2014 pro forma results; 1H 2015 includes pro forma
adjustments |
 Baxalta Performance Update | Q4 2015 | Page 36
2%
3%
-2%
13%
9%
13%
12%
3%
-5%
0%
5%
10%
15%
Q1 14
Q2 14
Q3 14
Q4 14
Q1 15
Q2 15
Q3 15
Q4 15
Immunology: Quarterly Sales Growth
Immunoglobulin Therapies
% Sales Growth At Constant Currency
-11%
15%
21%
19%
24%
4%
14%
22%
-15%
-5%
5%
15%
25%
35%
Q1 14
Q2 14
Q3 14
Q4 14
Q1 15
Q2 15
Q3 15
Q4 15
Pro Forma BioTherapeutics*
% Sales Growth At Constant Currency
*2014 constant currency growth rates do not include pro forma
adjustments |
 Baxalta Performance Update | Q4 2015 | Page 37
Capitalizing On Transformational
Differentiation With HYQVIA
IGSC
~45%
IGIV
~55%
HYQVIA Source Of Patients
Internal Estimates
Global PID Indication: ~8% CAGR*
% By Route Of Administration In 2020
$3.0B
GGL
Cannibalization
~25%
Competitive IV/SC
~50% Naïve ~25% Capturing SubQ Leadership Position With HYQVIA By 2020 *2015 – 2020 CAGR |
 Baxalta Performance Update | Q4 2015 | Page 38
Flexible And Cost-Effective Capacity
Supports Future Demand Growth
0
5
10
15
20
2015
2020
2025
8%+ CAGR
Cost-Effective Expansion
• Disciplined investment in capacity to support 8% annual growth in demand • Internal network combined with Sanquin CMO provides cost-effective and flexible network • Opportunities exist to expand footprint beyond 2022 to support additional growth Baxalta Fractionation Capacity** Liters In Millions Los Angeles, CA Netherlands (Sanquin CMO) Pisa & Rieti, Italy Lessines, Belgium Vienna, Austria Covington, GA* *Expected to be operational in 2018 **Capacity represents internal estimates |
 Baxalta Performance Update | Q4 2015 | Page 39
Oncology
Positioned For Growth
• Capitalizing on an attractive and growing market • Focusing on orphan diseases and targeted populations with significant unmet need • Collaborating with leading R&D partners to provide differentiated treatment options • Leveraging existing global commercial capabilities and footprint Building A Focused, Targeted Oncology Business FY 2015 Sales Q4 2015 Sales Oncology FDA approval reflects significance of unmet medical need Enhancing portfolio with new chemical entities Extracting value with geographic and indication expansions Accelerating innovation in immuno-oncology Calaspargase Pegol |
 GAAP To Pro Forma Non-GAAP Reconciliations |
| Baxalta Performance Update | Q4 2015 | Page 41
Notice To Investors
Non-GAAP Financial Measures:
The financial information included in these schedules includes financial measures that are not calculated in accordance with generally accepted accounting principles (GAAP). Reconciliations of the GAAP to
non-GAAP financial measures can be found on
pages 42 - 46. The non-GAAP financial
measures include “adjusted gross margin”,
“adjusted operating income,” “adjusted EBITDA,” and “adjusted diluted earnings per share”. Non-GAAP financial measures may provide a more complete understanding of the Company’s operations and may facilitate an
additional analysis of the Company’s results
of operations, particularly in evaluating performance from one period to another. The Company has presented “adjusted operating income,” which excludes interest and other (income)
expense and intangible asset amortization; and
“adjusted EBITDA” which, in addition to the previous adjustments, also excludes depreciation expense. Additionally, the non-GAAP financial measures presented exclude the impact of certain special
items, which are excluded because they are highly
variable, difficult to predict, and of a size that may substantially impact the Company’s operations and can facilitate an additional analysis of the Company’s results of operations,
particularly in evaluating performance from one
period to another. Upfront and milestone payments related to collaborative arrangements that have been expensed as research and development (R&D) are uncertain and often result
in a different payment and expense recognition
pattern than internal R&D activities and therefore are typically excluded as special items. Intangible asset amortization is excluded to facilitate an evaluation of current and past operating
performance, particularly in terms of cash returns,
and is similar to how management internally assesses performance. The Company’s management uses non-GAAP financial measures to evaluate the Company’s performance and provides
them to investors as a supplement to the
Company’s reported results, as they believe this information provides additional insight into the Company’s operating performance by disregarding certain nonrecurring items. The
non-GAAP financial measures used by the Company
may be calculated differently from, and therefore may not be comparable to, similarly titled measures used by other companies. In addition, these non-GAAP financial measures should not be
considered in isolation, as a substitute for, or as
superior to, financial measures calculated in accordance with GAAP, and the Company’s financial results calculated in accordance with GAAP and reconciliations to those financial
statements should be carefully
evaluated. |
 Baxalta Performance Update | Q4 2015 | Page 42
Pro Forma Sales Reconciliation: Q4 2015
% Growth @ Actual Rates
% Growth @ Constant Rates
U.S. International Total U.S. International Total U.S. International Total U.S. International Total Hemophilia $375 $425 $800 $343 $491 $834 9% (13%) (4%) 9% 1% 4% Inhibitor Therapies 85 145 230 68 153 221 25% (5%) 4% 25% 8% 14% Hematology $460 $570 $1,030 $411 $644 $1,055 12% (11%) (2%) 12% 2% 6% Immunoglobulin Therapies 370 103 473 366 113 479 1% (9%) (1%) 1% 8% 3% Pro Forma BioTherapeutics 69 138 207 62 121 183 11% 14% 13% 11% 28% 22% Pro Forma Immunology $439 $241 $680 $428 $234 $662 3% 3% 3% 3% 18% 8% Oncology $45 $8 $53 $ - $ - $ - N/M N/M N/M N/M N/M N/M Pro Forma Total Baxalta $944 $819 $1,763 $839 $878 $1,717 13% (7%) 3% 13% 8% 10% % Growth @ Actual Rates % Growth @ Constant Rates U.S. International Total U.S. International Total U.S. International Total U.S. International Total Hemophilia $1,339 $1,501 $2,840 $1,281 $1,703 $2,984 5% (12%) (5%) 5% 4% 4% Inhibitor Therapies 295 492 787 219 525 744 35% (6%) 6% 35% 9% 16% Hematology $1,634 $1,993 $3,627 $1,500 $2,228 $3,728 9% (11%) (3%) 9% 5% 7% Immunoglobulin Therapies 1,350 400 1,750 1,272 405 1,677 6% (1%) 4% 6% 17% 9% Pro Forma BioTherapeutics 258 508 766 244 460 704 6% 10% 9% 6% 21% 16% Pro Forma Immunology $1,608 $908 $2,516 $1,516 $865 $2,381 6% 5% 6% 6% 19% 11% Oncology $73 $14 $87 $ - $ - $ - N/M N/M N/M N/M N/M N/M Pro Forma Total Baxalta $3,315 $2,915 $6,230 $3,016 $3,093 $6,109 10% (6%) 2% 10% 10% 10% Pro Forma Net Sales Reconciliations % Growth @ Actual Rates % Growth @ Constant Rates U.S. International Total U.S. International Total U.S. International Total U.S. International Total BioTherapeutics $69 $138 $207 $62 $87 $149 11% 59% 39% 11% 78% 50% Pro forma MSA revenue - - - - 34 34 Pro Forma BioTherapeutics $69 $138 $207 $62 $121 $183 11% 14% 13% 11% 28% 22% % Growth @ Actual Rates % Growth @ Constant Rates U.S. International Total U.S. International Total U.S. International Total U.S. International Total BioTherapeutics $258 $426 $684 $244 $303 $547 6% 41% 25% 6% 56% 34% Pro forma MSA revenue - 82 $82 - 157 157 Pro Forma BioTherapeutics $258 $508 $766 $244 $460 $704 6% 10% 9% 6% 21% 16% Q4 2015 Q4 2014 YTD 2015 YTD 2014 Q4 2015 Q4 2014 YTD 2015 YTD 2014 |
 Baxalta Performance Update | Q4 2015 | Page 43
Pro Forma Sales Reconciliation: Q3 2015
% Growth @ Actual Rates
% Growth @ Constant Rates
U.S. International Total U.S. International Total U.S. International Total U.S. International Total Hemophilia $337 $390 $727 $318 $437 $755 6% (11%) (4%) 6% 7% 7% Inhibitor Therapies 78 130 208 55 132 187 42% (2%) 11% 42% 14% 22% Hematology $415 $520 $935 $373 $569 $942 11% (9%) (1%) 11% 9% 10% Immunoglobulin Therapies 334 101 435 305 102 407 10% (1%) 7% 10% 19% 12% Pro Forma BioTherapeutics 64 127 191 60 121 181 7% 5% 6% 7% 18% 14% Pro Forma Immunology $398 $228 $626 $365 $223 $588 9% 2% 6% 9% 18% 13% Oncology $28 $6 $34 $ - $ - $ - N/M N/M N/M N/M N/M N/M Pro Forma Total Baxalta $841 $754 $1,595 $738 $792 $1,530 14% (5%) 4% 14% 12% 13% % Growth @ Actual Rates % Growth @ Constant Rates U.S. International Total U.S. International Total U.S. International Total U.S. International Total Hemophilia $964 $1,076 $2,040 $938 $1,212 $2,150 3% (11%) (5%) 3% 5% 4% Inhibitor Therapies 210 347 557 151 372 523 39% (7%) 7% 39% 9% 17% Hematology $1,174 $1,423 $2,597 $1,089 $1,584 $2,673 8% (10%) (3%) 8% 6% 7% Immunoglobulin Therapies 980 297 1,277 906 292 1,198 8% 2% 7% 8% 21% 11% Pro Forma BioTherapeutics 189 370 559 182 339 521 4% 9% 7% 4% 18% 13% Pro Forma Immunology $1,169 $667 $1,836 $1,088 $631 $1,719 7% 6% 7% 7% 19% 12% Oncology $28 $6 $34 $ - $ - $ - N/M N/M N/M N/M N/M N/M Pro Forma Total Baxalta $2,371 $2,096 $4,467 $2,177 $2,215 $4,392 9% (5%) 2% 9% 10% 10% Pro Forma Net Sales Reconciliations % Growth @ Actual Rates % Growth @ Constant Rates U.S. International Total U.S. International Total U.S. International Total U.S. International Total BioTherapeutics $64 $127 $191 $60 $79 $139 7% 61% 37% 7% 81% 49% Pro forma MSA revenue - - - - 42 42 Pro Forma BioTherapeutics $64 $127 $191 $60 $121 $181 7% 5% 6% 7% 18% 14% % Growth @ Actual Rates % Growth @ Constant Rates U.S. International Total U.S. International Total U.S. International Total U.S. International Total BioTherapeutics $189 $288 $477 $182 $216 $398 4% 33% 20% 4% 48% 28% Pro forma MSA revenue - 82 82 - 123 123 Pro Forma BioTherapeutics $189 $370 $559 $182 $339 $521 4% 9% 7% 4% 18% 13% Q3 2015 Q3 2014 YTD 2015 YTD 2014 Q3 2015 Q3 2014 YTD 2015 YTD 2014 |
 Baxalta Performance Update | Q4 2015 | Page 44
GAAP To Non-GAAP Reconciliation:
Gross Margin
$ in millions
Q3 2015
Q4 2015
2H 2015
Gross Margin
$962
$1,082
$2,044
Gross Margin Percentage
60.3%
61.4%
60.9%
Adjustments for special items
25 42
67 Adjusted
Gross Margin $987
$1,124
$2,111
Adjusted Gross Margin Percentage
61.9%
63.8%
62.9% |
 Baxalta Performance Update | Q4 2015 | Page 45
GAAP To Non-GAAP Reconciliation:
Operating Income And EBITDA
GAAP-to-Non-GAAP Reconciliation
Operating Income and EBITDA
$ in millions
Q3 2015
Q4 2015
2H 2015
Pre-tax Income
$354
$123
$477
Pre-tax Income Margin
22.2%
7.0%
14.2%
Adjustments for special items
140
366
506 Adjusted
Pre-tax Income
494
489
983 Adjusted Pre-tax
Income Margin 31.0%
27.7%
29.3%
Remove: Net interest expense
23
22
45 Remove:
Other (income) expense, net
(19)
1 (18)
Adjusted Operating Income
498
512
1,010 Adjusted Operating Income
Margin 31.2%
29.0%
30.1%
Remove: Depreciation
50
54
104 Adjusted
EBITDA $548
$566
$1,114
Adjusted EBITDA Margin
34.4%
32.1%
33.2% |
 Baxalta Performance Update | Q4 2015 | Page 46
GAAP To Non-GAAP Reconciliation:
Diluted EPS
Q3 2015
Q4 2015
2H 2015
Diluted EPS
$0.45
$0.14
$0.59
Adjustments for special items
0.11
0.43
0.54 Adjusted
Diluted EPS $0.56
$0.57
$1.13
Baxalta has also presented guidance for Q1 2016 using the non-GAAP measure of Adjusted Diluted EPS. Baxalta
projects that Q1 2016 GAAP Diluted EPS would be
lower than Q1 2016 Adjusted Diluted EPS by approximately $0.03 per diluted share, with a reconciling item of intangible asset amortization expense. |