Attached files
| file | filename |
|---|---|
| EX-31.2 - EXHIBIT 31.2 - CFO 302 CERTIFICATION - SPX FLOW, Inc. | a201510-kxex312xcfo302cert.htm |
| EX-32.1 - EXHIBIT 32.1 - CEO/CFO 906 CERTIFICATIONS - SPX FLOW, Inc. | a201510-kxex321xceocfo906c.htm |
| EX-23.1 - EXHIBIT 23.1 - CONSENT - SPX FLOW, Inc. | a201510-kxex231xdeloitteco.htm |
| EX-21.1 - EXHIBIT 21.1 - SUBSIDIARIES - SPX FLOW, Inc. | a201510-kxex211xsubsidiari.htm |
| EX-31.1 - EXHIBIT 31.1 - CEO 302 CERTIFICATION - SPX FLOW, Inc. | a201510-kxex311xceo302cert.htm |
UNITED STATES
SECURITIES AND EXCHANGE COMMISSION
Washington, D.C. 20549
FORM 10-K
(Mark One) |
ý ANNUAL REPORT PURSUANT TO SECTION 13 OR 15(D) OF THE SECURITIES EXCHANGE ACT OF 1934 |
For the fiscal year ended December 31, 2015, or |
o TRANSITION REPORT PURSUANT TO SECTION 13 OR 15(d) OF THE SECURITIES EXCHANGE ACT OF 1934 |
For the transition period from to |
Commission file number 1-37393
SPX FLOW, INC.
(Exact Name of Registrant as Specified in Its Charter)
Delaware | 47-3110748 |
(State or Other Jurisdiction of Incorporation or Organization) | (I.R.S. Employer Identification No.) |
13320 Ballantyne Corporate Place Charlotte, NC | 28277 |
(Address of Principal Executive Offices) | (Zip Code) |
Registrant’s Telephone Number, Including Area Code (704) 752-4400
(Former Name, Former Address, and Former Fiscal Year, if Changed Since Last Report)
Title of Each Class | Name of Each Exchange on Which Registered | |
Securities registered pursuant to Section 12(b) of the Act: | Common Stock, Par Value $0.01 | New York Stock Exchange |
Securities registered pursuant to Section 12(g) of the Act: | None | N/A |
Indicate by check mark if the registrant is a well-known seasoned issuer, as defined in Rule 405 of the Securities Act. Yes o No ý Indicate by check mark if the registrant is not required to file reports pursuant to Section 13 or Section 15(d) of the Act. Yes o No ý Indicate by check mark whether the registrant: (1) has filed all reports required to be filed by Section 13 or 15(d) of the Securities Exchange Act of 1934 during the preceding 12 months (or for such shorter period that the registrant was required to file such reports), and (2) has been subject to such filing requirement for the past 90 days. Yes ý No o Indicate by check mark whether the registrant has submitted electronically and posted on its corporate Web site, if any, every Interactive Data File required to be submitted and posted pursuant to Rule 405 of Regulation S-T (§232.405 of this chapter) during the preceding 12 months (or for such shorter period that the registrant was required to submit and post such files). Yes ý No o Indicate by check mark if disclosure of delinquent filers pursuant to Item 405 of Regulation S-K is not contained herein, and will not be contained, to the best of registrant's knowledge, in definitive proxy or information statements incorporated by reference in Part III of this Form 10-K or any amendment to this Form 10-K. ý Indicate by check mark whether the registrant is a large accelerated filer, an accelerated filer, a non-accelerated filer, or a smaller reporting company. See definitions of “large accelerated filer,” “accelerated filer,” and “smaller reporting company” in Rule 12b-2 of the Exchange Act. (Check one): |
Large Accelerated Filer o | Accelerated Filer o | |
Non-Accelerated Filer x | Smaller Reporting Company o | |
(Do not check if a smaller reporting company) | ||
Indicate by check mark whether the registrant is a shell company (as defined in Rule 12b-2 of the Exchange Act). o Yes ý No | ||
As of June 27, 2015 the registrant's common shares were not publicly traded.
Common shares outstanding as of February 5, 2016 were 41,631,344.
Documents incorporated by reference: Portions of the registrant’s definitive proxy statement to be filed within 120 days of the close of the registrant’s fiscal year in connection with the registrant’s Annual Meeting to be held on May 11, 2016 (the "Proxy Statement") are incorporated by reference into Part III of this Annual Report on Form 10-K. |
SPX FLOW, INC. AND SUBSIDIARIES
FORM 10-K INDEX
PART I
ITEM 1. Business
(All currency and share amounts are in millions)
FORWARD-LOOKING STATEMENTS
Some of the statements in this document and any documents incorporated by reference, including any statements as to operational and financial projections, constitute “forward-looking statements” within the meaning of Section 21E of the Securities Exchange Act of 1934, as amended (the “Exchange Act”). These statements relate to future events or our future financial performance and involve known and unknown risks, uncertainties and other factors that may cause our businesses’ or our industries’ actual results, levels of activity, performance or achievements to be materially different from those expressed or implied by any forward-looking statements. Such statements may address our plans, our strategies, our prospects, or changes and trends in our business and the markets in which we operate under the heading “Management’s Discussion and Analysis of Financial Condition and Results of Operations” (“MD&A”) or in other sections of this document. In some cases, you can identify forward-looking statements by terminology such as “may,” “could,” “would,” “should,” “expect,” “plan,” “anticipate,” “intend,” “believe,” “estimate,” “predict,” “project,” “potential” or “continue” or the negative of those terms or similar expressions. Particular risks facing us include business, internal operations, legal and regulatory risks, costs of raw materials, pricing pressures, pension funding requirements, integration of acquisitions and changes in the economy. These statements are only predictions. Actual events or results may differ materially because of market conditions in our industries or other factors, and forward-looking statements should not be relied upon as a prediction of actual results. In addition, management’s estimates of future operating results are based on our current complement of businesses, which is subject to change as management selects strategic markets.
All the forward-looking statements in this document are qualified in their entirety by reference to the factors discussed under the heading “Risk Factors” and in any documents incorporated by reference herein that describe risks and factors that could cause results to differ materially from those projected in these forward-looking statements. We caution you that these risk factors may not be exhaustive. We operate in a continually changing business environment and intend to frequently enter into new businesses and product lines. We cannot predict these new risk factors, and we cannot assess the impact, if any, of these new risk factors on our businesses or the extent to which any factor, or combination of factors, may cause actual results to differ materially from those projected in any forward-looking statements. Accordingly, you should not rely on forward-looking statements as a prediction of actual results. We undertake no obligation to update or publicly revise any forward-looking statements to reflect events or circumstances that arise after the date of this document.
BUSINESS
Spin-Off Transaction
On October 29, 2014, SPX Corporation ("SPX" or the "former Parent") announced that its Board of Directors had unanimously approved a plan to spin off its Flow business, comprising its Flow Technology reportable segment, its Hydraulic Technologies business, certain of its corporate subsidiaries and certain of its corporate assets and liabilities (collectively, SPX FLOW, Inc.), and separate SPX into two distinct, publicly-traded companies (the "Spin-Off").
The Spin-Off was completed by way of a pro rata distribution of SPX FLOW, Inc. ("SPX FLOW," the "Company," "we," "us," or "our") common stock to SPX’s shareholders of record as of the close of business on September 16, 2015, the Spin-Off record date. Each SPX shareholder received, effective as of 11:59 p.m., Eastern time, on September 26, 2015, one share of our common stock for every share of SPX common stock held by such shareholder on the record date. On September 26, 2015, we became a separate publicly-traded company, and SPX did not retain any ownership interest in SPX FLOW. A Registration Statement on Form 10 describing the transaction was filed by SPX FLOW with the U.S. Securities and Exchange Commission (the “SEC”) and was declared effective on September 11, 2015 (as amended through the time of such effectiveness, the “Registration Statement on Form 10”).
1
Our Business
We are a global supplier of highly specialized, engineered solutions with operations in over 35 countries and sales in over 150 countries around the world. Our solutions play a role in helping to meet the global demand in the end markets we serve. Our total revenue in 2015 was $2.4 billion, with approximately 29% from sales into emerging markets.
We serve the food and beverage, power and energy and industrial markets. Our product portfolio of pumps, valves, mixers, filters, air dryers, hydraulic tools, homogenizers, separators and heat exchangers, along with the related aftermarket parts and services, supports global industries, including food and beverage, oil and gas, power generation (including nuclear and conventional), chemical processing, compressed air and mining. From an end market perspective, in 2015, approximately 36% of our revenues were from sales into the food and beverage end markets, approximately 28% were from sales into the power and energy end markets, and approximately 36% were from sales into the industrial end markets. Our core strengths include product breadth, global capabilities and the ability to create custom-engineered solutions for diverse flow processes. Over the past several years, we have strategically expanded our scale, relevance to customers, and global capabilities. We believe there are attractive organic and acquisition opportunities to continue to expand our business.
We focus on a number of operating initiatives, including innovation and new product development, continuous improvement driven by lean methodologies, supply chain management, process efficiency, expansion in emerging markets, information technology infrastructure improvement, and organizational and talent development. These initiatives are designed to, among other things, capture synergies within our businesses to ultimately drive revenue, profit margin and cash flow growth. We believe our businesses are well-positioned for long-term growth based on our operating initiatives, the potential within the current markets served and the potential for expansion into additional markets.
REPORTABLE SEGMENTS
Our business is organized into three reportable segments — Food and Beverage, Power and Energy and Industrial. The following summary describes the products and services offered by each of our reportable segments:
Food and Beverage: Our Food and Beverage reportable segment had revenues of $886.3, $968.9, and $970.0 in 2015, 2014 and 2013, respectively, and backlog of $334.7 and $485.1 as of December 31, 2015 and 2014, respectively. Approximately 92% of the segment's backlog as of December 31, 2015 is expected to be recognized as revenue during 2016. The Food and Beverage reportable segment operates in a regulated, global industry with customers who demand highly engineered, turn-key solutions. Key demand drivers include dairy consumption, emerging market capacity expansion, sustainability and productivity initiatives, customer product innovation and food safety. Key products for the segment include mixing, drying, evaporation and separation systems and components, heat exchangers, and reciprocating and centrifugal pump technologies. Our core brands include Anhydro, APV, Bran+Luebbe, Gerstenberg Schroeder, LIGHTNIN, Seital and Waukesha Cherry-Burrell. The segment's primary competitors are Alfa Laval AB, Fristam Pumps, GEA Group AG, Krones AG, Südmo, Tetra Pak, and various regional companies.
Power and Energy: Our Power and Energy reportable segment had revenues of $723.0, $961.6 and $997.5 in 2015, 2014 and 2013, respectively, and backlog of $399.1 and $475.5 as of December 31, 2015 and 2014, respectively. Approximately 86% of the segment's backlog as of December 31, 2015 is expected to be recognized as revenue during 2016. The Power and Energy reportable segment primarily serves customers in the oil and gas industry and, to a lesser extent, the nuclear and other conventional power industries. A large portion of the segment's revenues are concentrated in oil extraction, production and transportation at existing wells, and pipeline applications. The underlying drivers of this segment include demand for power and energy. Key products for the segment include pumps, valves and the related accessories, while the core brands include APV, Bran+Luebbe, ClydeUnion Pumps, Copes-Vulcan, Dollinger Filtration, LIGHTNIN, M&J Valve, Plenty, and Vokes. The segment's primary competitors are Cameron International Corporation, Ebara Fluid Handling, Flowserve Corporation, ITT Goulds Pumps, KSB AG, and Sulzer Ltd.
Industrial: Our Industrial reportable segment had revenues of $779.2, $839.1 and $837.3 in 2015, 2014 and 2013, respectively, and backlog of $171.2 and $210.1 as of December 31, 2015 and 2014, respectively. Approximately 97% of the segment's backlog as of December 31, 2015 is expected to be recognized as revenue during 2016. The Industrial reportable segment primarily serves customers in the chemical, air treatment, mining, pharmaceutical, marine, shipbuilding, infrastructure construction, general industrial and water treatment industries. Key demand drivers of this segment are tied to macroeconomic conditions and growth in the respective end markets we serve. Key products for the segment are air dryers, filtration equipment, mixers, pumps, hydraulic technologies and heat exchangers. Core brands include Airpel, APV, Bolting Systems, Delair, Deltech, Hankison, Jemaco,
2
Johnson Pump, LIGHTNIN, Power Team, and Stone. The segment's primary competitors are Alfa Laval AB, Chemineer Inc., EKATO, Actuant, Enerpac, IDEX Viking Pump, KSB AG, Parker Domnick Hunter and various regional companies.
See Note 4 to our consolidated and combined financial statements for more information on the results of our reportable segments, including revenues by geographic area.
Acquisitions
We did not acquire any businesses from the date of the Spin-Off through the end of 2015. However, we regularly review and negotiate potential acquisitions in the ordinary course of business, some of which are or may be material. We plan to evaluate potential acquisition opportunities in the future that (a) strengthen our existing businesses, (b) expand our product offerings and technological know-how, and/or (c) provide access to new customers from the standpoint of end markets and/or geographies.
International Operations
We are a multinational corporation with operations in over 35 countries. Sales outside the United States were $1,552.0, $1,835.7 and $1,870.9 in 2015, 2014 and 2013, respectively.
See Note 4 to our consolidated and combined financial statements for more information on our international operations.
Research and Development
We are actively engaged in research and development programs designed to improve existing products and manufacturing methods and to develop new products to better serve our current and future customers. We place particular emphasis on the development of new products that are compatible with, and build upon, our manufacturing and marketing capabilities. We expensed $19.1, $19.8 and $17.7 in 2015, 2014 and 2013, respectively, of research activities relating to the development and improvement of our products.
Intellectual Property
We own approximately 160 domestic and 110 foreign patents, including 8 patents that were issued in 2015, covering a variety of our products and manufacturing methods. We also own a number of registered trademarks. Although in the aggregate our patents and trademarks are of considerable importance in the operation of our business, we do not consider any single patent or trademark to be of such importance that its absence would adversely affect our ability to conduct business as presently constituted. We are both a licensor and licensee of patents. For more information, please refer to "Risk Factors."
Raw Materials
We purchase a wide variety of raw materials, including steel, titanium, copper, nickel and petroleum-based products. Where appropriate, we may enter into long-term supply arrangements or fixed-cost contracts to lower the overall cost of raw materials. In addition, due to our diverse product and service offering, as well as the wide geographic dispersion of our production facilities, we use numerous sources for the raw materials needed in our operations. However, we are not significantly dependent on any one supplier or a limited number of suppliers. Lastly, we continue to centralize certain aspects of supply chain management in an effort to ensure adequate materials are available for production at low cost.
Competition
The markets we serve are highly competitive and fragmented. Our competitors are diverse, ranging from large multi-nationals to regional and local companies. Our principal global competitors include Alfa Laval AB, Flowserve Corporation, GEA Group AG, IDEX Corporation, ITT Gould Pumps, Sulzer Ltd., and Tetra Pak International S.A. We do not have any one competitor with all the same product offerings, nor do we have any one competitor which serves all the same end markets.
Our ability to compete effectively depends on a variety of factors including breadth of product offering, product quality, engineering strength, brand reputation, lead times, ability to deliver on-time, global capabilities, service capabilities, and cost position. As many of our products are sold through distributors and independent representatives, our success also depends on building and partnering with a strong channel network.
3
Environmental Matters
See "MD&A — Critical Accounting Policies and Use of Estimates — Contingent Liabilities," "Risk Factors" and Note 13 to our consolidated and combined financial statements for information regarding environmental matters.
Employment
At December 31, 2015, we had over 8,000 employees. Less than 1% of our U.S. employees are covered under collective bargaining agreements, while certain of our non-U.S. employee groups are covered by various collective labor arrangements. While we generally have experienced satisfactory labor relations, we are subject to potential union campaigns, work stoppages, union negotiations and other potential labor disputes.
Executive Officers
See Part III, Item 10 of this report for information about our executive officers.
Other Matters
No customer or group of customers that, to our knowledge, are under common control accounted for more than 10% of our consolidated and combined revenues for any period presented.
Our businesses maintain sufficient levels of working capital to support customer requirements, particularly inventory. We believe our businesses' sales and payment terms are generally similar to those of our competitors.
The results of many of our businesses closely follow changes in the industries and end markets they serve. In addition, certain of our businesses have seasonal fluctuations. Demand in the oil and gas aftermarket is typically stronger in the second half of the year. Demand for food and beverage systems and related services is highly correlated to timing of large construction contracts, which may cause significant fluctuations in our financial performance from period to period. In aggregate, our businesses generally tend to be stronger in the second half of the year.
Our website address is www.spxflow.com. Information on our website is not incorporated by reference herein. We file reports with the SEC, including annual reports on Form 10-K, quarterly reports on Form 10-Q and current reports on Form 8-K, and certain amendments to these reports. Copies of these reports are available free of charge on our website as soon as reasonably practicable after we file the reports with the SEC. The SEC also maintains a website at www.sec.gov that contains reports, proxy and information statements, and other information regarding issuers that file electronically with the SEC. Additionally, you may read and copy any materials that we file with the SEC at the SEC's Public Reference Room at 100 F Street, NE, Washington, DC 20549. You may obtain information on the operation of the Public Reference Room by calling the SEC at 1-800-SEC-0330.
ITEM 1A. Risk Factors
You should consider the risks described below and elsewhere in our documents filed with the SEC before investing in any of our securities. We may amend, supplement or add to the risk factors described below from time to time in future reports filed with the SEC.
Difficulties presented by international economic, political, legal, accounting and business factors could negatively affect our business.
In 2015, approximately 65% of our revenues were generated outside the United States. We are also expanding our presence in emerging markets. We manage businesses with manufacturing facilities worldwide. Our reliance on non-U.S. revenues and non-U.S. manufacturing bases exposes us to a number of risks, including:
• | Significant competition could come from local or long-term participants in non-U.S. markets who may have significantly greater market knowledge and substantially greater resources than we do; |
• | Local customers may have a preference for locally-produced products; |
• | Credit risk or financial condition of local customers and distributors could affect our ability to market our products or collect receivables; |
4
• | Regulatory or political systems or barriers may make it difficult or impossible to enter or remain in new markets. In addition, these barriers may impact our existing businesses, including making it more difficult for them to grow; |
• | Local political, economic and social conditions, including the possibility of hyperinflationary conditions, political instability, nationalization of private enterprises, or unexpected changes relating to currency could adversely impact our operations; |
• | Customs and tariffs may make it difficult or impossible for us to move our products or assets across borders in a cost-effective manner; |
• | Complications related to shipping, including delays due to weather, labor action, or customs, may impact our profit margins or lead to lost business; |
• | Government embargoes or foreign trade restrictions such as anti-dumping duties, as well as the imposition of trade sanctions by the United States or the European Union against a class of products imported from or sold and exported to, or the loss of "normal trade relations" status with, countries in which we conduct business, could significantly increase our cost of products imported into the United States or Europe or reduce our sales and harm our business; |
• | Environmental and other laws and regulations could increase our costs or limit our ability to run our business; |
• | Our ability to obtain supplies from foreign vendors and ship products internationally may be impaired during times of crisis or otherwise; |
• | Local, regional or worldwide hostilities could impact our operations; and |
• | Distance, language and cultural differences may make it more difficult to manage our business and employees and to effectively market our products and services. |
Any of the above factors or other factors affecting social and economic activity in emerging markets or affecting the movement of people and products into and from these countries to our major markets, including North America and Europe, could have a significant negative effect on our operations.
Many of the markets in which we operate are cyclical or are subject to industry events, and our results have been and could be affected as a result.
Many of the markets in which we operate are subject to general economic cycles or industry events. We have significant exposure to companies operating in or selling to oil and gas markets. Recent declines in the price of oil have depressed demand in these markets, and continued low oil prices may continue or exacerbate the decline in this market. Other of our markets, including food and beverage, chemical, mining, and petrochemical, particularly chemical companies and general industrial companies, are to varying degrees cyclical and have experienced, and may continue to experience, periodic downturns. Cyclical changes and specific industry events could also affect sales of products in our other businesses. Downturns in the business cycles of our different operations may occur at the same time, which could exacerbate any adverse effects on our business. See "Management's Discussion and Analysis of Financial Condition and Results of Operations—Results of Reportable Segments."
Contract timing on large construction projects, including food and beverage systems and projects in the oil and gas industries, may cause significant fluctuations in revenues and profits from period to period.
In addition, certain of our businesses have seasonal fluctuations. Historically, some of our key businesses tend to be stronger in the second half of the year.
Our business depends on capital investment and maintenance expenditures by our customers.
Demand for most of our products and services depends on the level of new capital investment and planned maintenance expenditures by our customers. The level of capital expenditures by our customers fluctuates based on planned expansions, new builds, and repairs, general economic conditions, availability of credit, and expectations of future market behavior. Any of these factors, individually or in the aggregate, could have a material adverse effect on our customers and, in turn, our business, financial condition, results of operations and cash flows.
Our customers could be impacted by commodity availability and price fluctuations.
A number of factors outside our control, including fluctuating commodity prices, impact the demand for our products. Increased commodity prices may increase our customers' cost of doing business, thus causing them to delay or cancel large capital projects.
5
On the other hand, declining commodity prices may cause mines, oil refineries, oil and gas extraction fields and other customers to delay or cancel projects relating to the production of such commodities. Also, oversupply could cause manufacturers to cut back on expenditures. Reduced demand for our products and services could result in the delay or cancellation of existing orders or lead to excess manufacturing capacity, which unfavorably impacts our absorption of fixed manufacturing costs. This reduced demand may also erode average selling prices in the relevant market.
Our ordinary course and future restructuring activities, including our realignment program, could result in additional costs and operational difficulties.
We face risks relating to our efforts to reduce global costs, including those designed to reduce headcount and consolidate our manufacturing footprint. In addition to the typical risks we face, we have announced a global realignment program designed to further optimize our global footprint, streamline business processes and reduce selling, general and administrative expense across operating sites and corporate and global functions over the next two years. The financial costs and savings associated with the realignment program are expected to be well in excess of our historical, ordinary course restructuring activities.
We risk the loss of valuable employees, operational difficulties, product quality, higher than expected restructuring costs, and difficulties arising from negotiations with work councils and other labor groups. We also risk disruption to our customer relationships if we are unable to meet our commitments to them. Further, these actions may take longer than anticipated, prove more costly than expected and distract management from other activities. Finally, we may not fully realize the expected benefits of these activities.
The price and availability of raw materials may adversely affect our business.
We are exposed to a variety of risks relating to the price and availability of raw materials. In recent years, we have faced volatility in the prices of many of our key raw materials, including petroleum-based products, steel and copper. Increases in the prices of raw materials or shortages or allocations of materials may have a material adverse effect on our financial position, results of operations or cash flows, as we may not be able to pass cost increases on to our customers, or our sales may be reduced. We are subject to long-term supplier contracts that may increase our exposure to pricing fluctuations.
Credit and counterparty risks could harm our business.
The financial condition of our customers could affect our ability to market our products or collect receivables. In addition, financial difficulties faced by our customers may lead to cancellation or delay of orders.
Our customers may suffer financial difficulties that make them unable to pay for a project when completed or as payment milestones become due, or they may decide not to pay us, either as a matter of corporate decision-making or in response to changes in local laws and regulations. We cannot assure you that expenses or losses for uncollectible amounts will not have a material adverse effect on our revenues, earnings and cash flows.
Failure to protect or unauthorized use of our intellectual property may harm our business.
Despite our efforts to protect our proprietary rights, unauthorized parties or competitors may copy or otherwise obtain and use our products or technology. The steps we have taken may not prevent unauthorized use of our technology or knowledge, particularly in foreign countries where the laws may not protect our proprietary rights to the same extent as in the United States. Costs incurred to defend our rights may be material.
If we are unable to protect our information systems against data corruption, cyber-based attacks or network security breaches, our operations could be disrupted.
We are increasingly dependent on information technology ("IT") networks and systems, including the Internet, to process, transmit and store electronic information. In particular, we depend on such IT infrastructure for electronic communications among our locations around the world and between our personnel and suppliers and customers, and we rely on the systems and services of a variety of vendors to meet our data processing and communication needs. Despite our implementation of security measures, cybersecurity threats, such as malicious software, phishing attacks, computer viruses and attempts to gain unauthorized access, cannot be completely mitigated. Security breaches of our, our customers' and our vendors' IT infrastructure can create system disruptions, shutdowns or unauthorized disclosure of confidential information, including our intellectual property, trade secrets, customer information or other confidential business information. If we are unable to prevent, detect or adequately respond to such breaches, our operations could be disrupted, our competitiveness could be adversely affected or we may suffer financial damage or loss because of lost or misappropriated information. Such incidents also could require significant management attention and resources and increased costs.
6
Currency conversion risk could have a material impact on our reported results of business operations.
Our operating results are translated into U.S. dollars for reporting purposes. The strengthening or weakening of the U.S. dollar against other currencies in which we conduct business could result in unfavorable translation effects as the results of transactions in foreign countries are translated into U.S. dollars. Increased strength of the U.S. dollar will increase the effective price of our products sold in U.S. dollars into other countries, which may have a material adverse effect on sales or require us to lower our prices, and also decrease our reported revenues or margins related to sales conducted in foreign currencies to the extent we are unable or determine not to increase local currency prices. Likewise, decreased strength of the U.S. dollar could have a material adverse effect stemming from the cost of materials and products purchased overseas.
Failure to comply with the U.S. Foreign Corrupt Practices Act, the U.K. Bribery Act or other applicable anti-bribery laws could have an adverse effect on our business.
The U.S. Foreign Corrupt Practices Act, the U.K. Bribery Act and similar anti-bribery laws in other jurisdictions generally prohibit companies and their intermediaries from making improper payments for the purpose of obtaining or retaining business. Recent years have seen a substantial increase in anti-bribery law enforcement activity with more frequent and aggressive investigations and enforcement proceedings by both the Department of Justice and the SEC, increased enforcement activity by non-U.S. regulators and increases in criminal and civil proceedings brought against companies and individuals. Our policies mandate compliance with anti-bribery laws. However, we operate in certain countries that are recognized as having governmental and commercial corruption. Our internal control policies and procedures may not always protect us from reckless or criminal acts committed by our employees or third-party intermediaries. Violations of these anti-bribery laws may result in criminal or civil sanctions, which could have a material adverse effect on our business, financial condition and results of operations.
We could experience operational difficulties and additional expense related to further implementations of Enterprise Resource Planning ("ERP") software.
We are engaged in a major, multi-year process of upgrading, and where necessary, implementing, a standard ERP software program across many of our business locations. Our expanded ERP software platform has involved, and will continue to involve, substantial expenditures on system hardware and software, as well as design, development and implementation activities. Operational disruptions during the course of these activities could materially impact our operations. For example, our ability to forecast sales demand, ship products, manage our product inventory, and record and report financial and management information on a timely and accurate basis could be impaired if there are significant problems implementing the expansion.
Additionally, our cost estimates related to our new ERP system are based on assumptions which are subject to wide variability, requiring a great deal of judgment.
Changes in tax laws and regulations or other factors could cause our income tax rate to increase, potentially reducing our net income and adversely affecting our cash flows.
As a global manufacturing company, we are subject to taxation in various jurisdictions around the world. In preparing our financial statements, we calculate our effective income tax rate based on current tax laws and regulations and the estimated taxable income within each of these jurisdictions. Our effective income tax rate, however, may be higher due to numerous factors, including changes in tax laws or regulations. An effective income tax rate significantly higher than our expectations could have an adverse effect on our business, results of operations and liquidity.
Officials in some of the jurisdictions in which we do business have proposed, or announced that they are reviewing, tax changes that could potentially increase taxes and other revenue-raising laws and regulations, including those that may be enacted as a result of the OECD Base Erosion and Profit Shifting project. Any such changes in tax laws or regulations could impose new restrictions, costs or prohibitions on existing practices as well as reduce our net income and adversely affect our cash flows.
Cost overruns, delays, penalties or liquidated damages could negatively impact our results, particularly with respect to long-term fixed-price contracts.
Substantially all our revenues are recorded and earned under fixed-price arrangements. A portion of our revenues and earnings is generated through long-term contracts. We recognize revenues for the majority of these long-term contracts using the percentage-of-completion method of accounting whereby revenues and expenses, and thereby profit, in a given period are determined based on our estimates as to the project status and the costs remaining to complete a particular project. During 2015, 2014 and 2013, approximately 20.5%, 20.7% and 21.8%, respectively, of our total revenues were recorded under the percentage-of-completion method.
7
Estimates of total revenues and cost at completion are subject to many variables, including the length of time to complete a contract. In addition, contract delays may negatively impact these estimates and our revenues and earnings results for affected periods.
To the extent that we underestimate the remaining cost or time to complete a project, we may overstate the revenues and profit in a particular period. Further, certain of these contracts provide for penalties or liquidated damages for failure to timely perform our obligations under the contract, or require that we, at our expense, correct and remedy to the satisfaction of the other party certain defects. Because substantially all of our long-term contracts are at a fixed price, we face the risk that cost overruns, delays, penalties or liquidated damages may exceed, erode or eliminate our expected profit margin, or cause us to record a loss on our projects.
The loss of key personnel and an inability to attract and retain qualified employees could have a material adverse effect on our operations.
We are dependent on the continued services of our leadership team. The loss of these personnel without adequate replacement could have a material adverse effect on our operations. Additionally, we need qualified managers and skilled employees with technical and manufacturing industry experience in many locations in order to operate our business successfully. From time to time, there may be a shortage of skilled labor, which may make it more difficult and expensive for us to attract and retain qualified employees. If we were unable to attract and retain sufficient numbers of qualified individuals or our costs to do so were to increase significantly, our operations could be materially adversely affected.
We operate in highly competitive markets. Our failure to compete effectively could harm our business.
We sell our products in highly competitive markets, which could result in pressure on our profit margins and limit our ability to maintain or increase the market share of our products. We compete on a number of fronts, including on the basis of product offerings, technical capabilities, quality, service and pricing. We have a number of competitors with substantial technological and financial resources, brand recognition and established relationships with global service providers. Some of our competitors have low cost structures, support from local governments, or both. In addition, new competitors may enter the markets in which we participate. Competitors may be able to offer lower prices, additional products or services or a more attractive mix of products or services, or services or incentives that we cannot or will not match. These competitors may be in a stronger position to respond quickly to new or emerging technologies and may be able to undertake more extensive marketing campaigns, and make more attractive offers to potential customers, employees and strategic partners. In addition, competitive environments in slow-growth markets, to which some of our businesses have exposure, have been inherently more influenced by pricing and domestic and global economic conditions. To remain competitive, we must invest in manufacturing, marketing, customer service and support and our distribution networks. We cannot assure you that we will have sufficient resources to continue to make the investment required to maintain or increase our market share or that our investments will be successful. If we do not compete successfully, our business, financial condition, results of operations and cash flows could be materially adversely affected.
Our strategy to outsource various elements of the products and services we sell subjects us to the business risks of our suppliers and subcontractors, which could have a material adverse impact on our operations.
In areas where we depend on third-party suppliers and subcontractors for outsourced products, components or services, we are subject to the risk of customer dissatisfaction with the quality or performance of the products or services we sell due to supplier or subcontractor failure. In addition, business difficulties experienced by a third-party supplier or subcontractor can lead to the interruption of our ability to obtain outsourced products or services and ultimately our inability to supply products or services to our customers. Third-party supplier and subcontractor business interruptions can include, but are not limited to, work stoppages, union negotiations and other labor disputes. Current or future economic conditions could also impact the ability of suppliers and subcontractors to access credit and, thus, impair their ability to provide us quality products or services in a timely manner, or at all.
We are subject to laws, regulations and potential liability relating to claims, complaints and proceedings, including those relating to environmental and other matters.
We are subject to various laws, ordinances, regulations and other requirements of government authorities in the United States and other nations. With respect to acquisitions, divestitures and continuing operations, we may acquire or retain liabilities of which we are not aware, or which are of a different character or magnitude than expected. Additionally, changes in laws, ordinances, regulations or other governmental policies may significantly increase our expenses and liabilities.
In addition, costs associated with regulatory compliance can be difficult to predict. If we underestimate the time or costs required to comply with our legal and regulatory obligations, our actual costs may significantly exceed our projections, which could impact our results of operations.
8
We are subject to domestic and international environmental protection laws and regulations with respect to our business operations and are operating in compliance with, or taking action aimed at ensuring compliance with, these laws and regulations. We cannot assure you that our compliance obligations with environmental protection laws and regulations, individually or in the aggregate, will not have a material adverse effect on our financial position, results of operations or cash flows.
Numerous claims, complaints and proceedings arising in the ordinary course of business, including those relating to litigation matters (e.g., class actions, derivative lawsuits and contracts, intellectual property and competitive claims), environmental matters, and risk management matters (e.g., product and general liability, personal injury claims, automobile, and workers' compensation claims), have been filed or are pending against us and certain of our subsidiaries. From time to time, we face actions by governmental authorities, both in and outside the United States. Additionally, we may become subject to significant claims of which we are currently unaware or the claims of which we are aware may result in our incurring a significantly greater liability than we anticipate. Our insurance may be insufficient or unavailable (e.g., because of insurer insolvency, a significant adverse change in claim experience, or insurance coverage is not available in applicable insured periods) to protect us against potential loss exposures.
We devote significant time and expense to defend against the various claims, complaints and proceedings brought against us, and we cannot assure you that the expenses or distractions from operating our businesses arising from these defenses will not increase materially.
We cannot assure you that our accruals and rights to indemnity and insurance will be sufficient, that recoveries from insurance or indemnification claims will be available or that any of our current or future claims or other matters will not have a material adverse effect on our financial position, results of operations or cash flows.
See "Management's Discussion and Analysis of Financial Condition and Results of Operations-Critical Accounting Policies and Use of Estimates-Contingent Liabilities" and Note 13 to our consolidated and combined financial statements for further discussion.
If the fair value of any of our reporting units is insufficient to recover the carrying value of the goodwill and other intangibles of the respective reporting unit, a material non-cash charge to earnings could result.
At December 31, 2015, we had goodwill and other intangible assets, net, of $1,602.8. We conduct annual impairment testing to determine if we will be able to recover all or a portion of the carrying value of goodwill and indefinite-lived intangibles. In addition, we review goodwill and indefinite-lived intangible assets for impairment more frequently if impairment indicators arise. If the fair value is insufficient to recover the carrying value of our goodwill and indefinite-lived intangibles, we may be required to record a material non-cash charge to earnings.
The fair values of our reporting units generally are based on discounted cash flow projections that are believed to be reasonable under current and forecasted circumstances, the results of which form the basis for making judgments about the recoverability of carrying values of the reported net assets of our reporting units. Other considerations are also incorporated, including comparable price multiples. Many of our businesses closely follow changes in the industries and end markets that they serve. For example, following recent declines in the price of oil and the resultant impact on oil markets, the results of our interim goodwill impairment test conducted at the end of 2015 indicated the estimated fair value of the Power and Energy reporting unit exceeded its carrying value by less than 5%. Accordingly, we consider estimates and judgments that affect future cash flow projections, including principal methods of competition such as volume, price, service, product performance and technical innovations and estimates associated with cost reduction initiatives, capacity utilization, and assumptions for inflation and foreign currency changes. We monitor impairment indicators across all of our businesses. Significant changes in market conditions and estimates or judgments used to determine expected future cash flows that indicate a reduction in carrying value may give rise to impairments in the period that the change becomes known.
Our failure to successfully complete acquisitions could negatively affect us.
We may not be able to consummate desired acquisitions, which could materially impact our growth rate, results of operations, future cash flows and stock price. Our ability to achieve our goals depends upon, among other things, our ability to identify and successfully acquire companies, businesses and product lines, to effectively integrate them and to achieve cost savings and other synergies. We may also be unable to raise additional funds necessary to consummate these acquisitions. In addition, decreases in our stock price may adversely affect our ability to consummate acquisitions. Competition for acquisitions in our business areas may be significant and result in higher prices for businesses, including businesses that we may target, which may also affect our acquisition rate or benefits achieved from our acquisitions.
9
Dispositions or our failure to successfully complete dispositions could negatively affect us.
Dispositions involve a number of risks and present financial, managerial and operational challenges, including diversion of management attention from running our core businesses, increased expense associated with the dispositions, potential disputes with the customers or suppliers of the disposed businesses, potential disputes with the acquirers of the disposed businesses and a potential dilutive effect on our earnings per share.
If dispositions are not completed in a timely manner, there may be a negative effect on our cash flows and/or our ability to execute our strategy.
Our failure to successfully integrate acquisitions could have a negative effect on our operations; our acquisitions could cause financial difficulties.
Our acquisitions could involve a number of risks and present financial, managerial and operational challenges, including:
• | Adverse effects on our reported operating results due to charges to earnings, including impairment charges associated with goodwill and other intangibles; |
• | Diversion of management attention from core business operations; |
• | Integration of technology, operations, personnel and financial and other systems; |
• | Increased expenses; |
• | Increased foreign operations, often with unique issues relating to corporate culture, compliance with legal and regulatory requirements and other challenges; |
• | Assumption of known and unknown liabilities and exposure to litigation; |
• | Increased levels of debt or dilution to existing shareholders; and |
• | Potential disputes with the sellers of acquired businesses, technology, services or products. |
In addition, internal controls over financial reporting of acquired companies may not be compliant with required standards. Issues may exist that could rise to the level of significant deficiencies or, in some cases, material weaknesses, particularly with respect to foreign companies or non-public U.S. companies.
Our integration activities may place substantial demands on our management, operational resources and financial and internal control systems. Customer dissatisfaction or performance problems with an acquired business, technology, service or product could also have a material adverse effect on our reputation and business.
We may not achieve the expected cost savings and other benefits of any acquisitions.
We strive for and expect to achieve cost savings in connection with our acquisitions, including: (i) manufacturing process and supply chain rationalization, (ii) streamlining redundant administrative overhead and support activities, and (iii) restructuring and repositioning sales and marketing organizations to eliminate redundancies. Cost savings are inherently difficult to predict, and we cannot assure you that we will achieve expected, or any, cost savings. In addition, we cannot assure you that unforeseen factors will not offset the estimated cost savings or other benefits from our future acquisitions. As a result, anticipated benefits could be delayed, differ significantly from our estimates and the other information contained in this report, or not be realized.
We are subject to potential work stoppages, labor disputes and other matters associated with our labor force, which may adversely impact our operations and cause us to incur incremental costs.
We have various collective labor arrangements covering certain U.S. and non-U.S. employee groups. We are subject to potential work stoppages and other potential labor disputes. Further, we may be subject to work stoppages, which are beyond our control, at our suppliers or customers.
Our technology is important to our success, and failure to develop new products may result in a significant competitive disadvantage.
We believe the development of our intellectual property rights is critical to the success of our business. In order to maintain our market positions and margins, we need to continually develop and introduce high quality, technologically advanced
10
and cost-effective products on a timely basis, in many cases in multiple jurisdictions around the world. The failure to do so could result in a significant competitive disadvantage.
Cost reduction actions may affect our business.
Cost reduction actions often result in charges against earnings. These charges can vary significantly from period to period and, as a result, we may experience fluctuations in our reported net income and earnings per share due to the timing of restructuring actions.
Our current and planned products may contain defects or errors that are detected only after delivery to customers. If that occurs, our reputation may be harmed and we may face additional costs.
We cannot assure you that our product development, manufacturing and integration testing will be adequate to detect all defects, errors, failures and quality issues that could impact customer satisfaction or result in claims against us with regard to our products. As a result, we may have, and from time to time have had, to replace certain components and/or provide remediation in response to the discovery of defects in products that are shipped. The occurrence of any defects, errors, failures or quality issues could result in cancellation of orders, product returns, diversion of our resources, legal actions by our customers or our customers' end users and other losses to us or to any of our customers or end users, and could also result in the loss of or delay in market acceptance of our products and loss of sales, which would harm our business and adversely affect our revenues and profitability.
Increases in the number of shares of our outstanding common stock could adversely affect our common stock price or dilute our earnings per share.
Sales of a substantial number of shares of common stock into the public market, or the perception that these sales could occur, could have a material adverse effect on our stock price. As of December 31, 2015, we had the ability to issue up to an additional 2.9 shares as restricted stock shares, restricted stock units, or stock options under our SPX FLOW Stock Compensation Plan. Additionally, we may issue a significant number of additional shares, in connection with acquisitions or otherwise. We also may issue a significant number of additional shares through other mechanisms. Additional shares granted and/or issued would have a dilutive effect on our earnings per share.
Provisions in our corporate documents and Delaware law may delay or prevent a change in control of our company, and accordingly, we may not consummate a transaction that our shareholders consider favorable.
Provisions of our Certificate of Incorporation and By-laws may inhibit changes in control of our company not approved by our Board. These provisions include, for example: a staggered board of directors; a prohibition on shareholder action by written consent; a requirement that special shareholder meetings be called only by our Chairman, President or Board; advance notice requirements for shareholder proposals and nominations; limitations on shareholders' ability to amend, alter or repeal the By-laws; enhanced voting requirements for certain business combinations involving substantial shareholders; the authority of our Board to issue, without shareholder approval, preferred stock with terms determined in its discretion; and limitations on shareholders' ability to remove directors. In addition, we are afforded the protections of Section 203 of the Delaware General Corporation Law, which could have similar effects. In general, Section 203 prohibits us from engaging in a "business combination" with an "interested shareholder" (each as defined in Section 203) for at least three years after the time the person became an interested shareholder unless certain conditions are met. These protective provisions could result in our not consummating a transaction that our shareholders consider favorable or discourage entities from attempting to acquire us, potentially at a significant premium to our then-existing stock price.
Our indebtedness may affect our business and may restrict our operating flexibility.
At December 31, 2015, we had $1,037.3 in total indebtedness. On that same date, we had $440.5 of available borrowing capacity under our revolving credit facilities, after giving effect to $9.5 reserved for outstanding letters of credit, and $50.0 of available borrowing capacity under our trade receivables financing arrangement. In addition, at December 31, 2015, we had $227.7 of available issuance capacity under our foreign credit instrument facilities after giving effect to $272.3 reserved for outstanding letters of credit. At December 31, 2015, our cash and equivalents balance was $295.9. See MD&A and Note 10 to our consolidated and combined financial statements for further discussion. We may incur additional indebtedness in the future, including indebtedness incurred to finance, or assumed in connection with, acquisitions. We may renegotiate or refinance our senior credit facilities, senior notes or other debt facilities, or enter into additional agreements that have different or more stringent terms. The level of our indebtedness could:
• | Impact our ability to obtain new, or refinance existing, indebtedness on favorable terms or at all; |
11
• | Limit our ability to obtain, or obtain on favorable terms, additional debt financing for working capital, capital expenditures or acquisitions; |
• | Limit our flexibility in reacting to competitive and other changes in the industry and economic conditions; |
• | Limit our ability to pay dividends on our common stock; |
• | Coupled with a substantial decrease in net operating cash flows due to economic developments or adverse developments in our business, make it difficult to meet debt service requirements; and |
• | Expose us to interest rate fluctuations to the extent existing borrowings are, and any new borrowings may be, at variable rates of interest, which could result in higher interest expense and interest payments in the event of increases in interest rates. |
Our ability to make scheduled payments of principal or pay interest on, or to refinance, our indebtedness and to satisfy our other debt obligations will depend upon our future operating performance, which may be affected by general economic, financial, competitive, legislative, regulatory, business and other factors beyond our control. In addition, we cannot assure you that future borrowings or equity financing will be available for the payment or refinancing of our indebtedness. If we are unable to service our indebtedness, whether in the ordinary course of business or upon an acceleration of such indebtedness, we may pursue one or more alternative strategies, such as restructuring or refinancing our indebtedness, selling assets, reducing or delaying capital expenditures, revising implementation of or delaying strategic plans or seeking additional equity capital. Any of these actions could have a material adverse effect on our business, financial condition, results of operations and stock price. In addition, we cannot assure that we would be able to take any of these actions, that these actions would enable us to continue to satisfy our capital requirements, or that these actions would be permitted under the terms of our various debt agreements.
Numerous banks in many countries are syndicate members in our credit facility. Failure of one or more of our larger lenders, or several of our smaller lenders, could significantly reduce availability of our credit, which could harm our liquidity.
We may not be able to finance future needs or adapt our business plan to react to changes in economic or business conditions because of restrictions placed on us by our senior credit facilities and any existing or future instruments governing our other indebtedness.
Our senior credit facilities, the indenture governing our senior notes and agreements governing our other indebtedness contain, or future or revised instruments may contain, various restrictions and covenants that limit our ability to make distributions or other payments to our investors and creditors unless certain financial tests or other criteria are satisfied. We also must comply with certain specified financial ratios and tests. Our subsidiaries may also be subject to restrictions on their ability to make distributions to us. In addition, our senior credit facilities, indenture governing our senior notes and agreements governing our other indebtedness contain or may contain additional affirmative and negative covenants. Material existing restrictions are described more fully in the MD&A and Note 10 to our consolidated and combined financial statements. Each of these restrictions could affect our ability to operate our business and may limit our ability to take advantage of potential business opportunities, such as acquisitions.
If we do not comply with the covenants and restrictions contained in our senior credit facilities, indenture governing our senior notes and agreements governing our other indebtedness, we could default under those agreements, and the debt, together with accrued interest, could be declared due and payable. If we default under our senior credit facilities, the lenders could cause all our outstanding debt obligations under our senior credit facilities to become due and payable or require us to repay the indebtedness under these facilities. If our debt is accelerated, we may not be able to repay or refinance our debt. In addition, any default under our senior credit facilities, indenture governing our senior notes or agreements governing our other indebtedness could lead to an acceleration of debt under other debt instruments that contain cross-acceleration or cross-default provisions. If the indebtedness under our senior credit facilities is accelerated, we may not have sufficient assets to repay amounts due under our senior credit facilities, senior notes or other debt securities then outstanding. Our ability to comply with these provisions of our senior credit facilities, indenture governing our senior notes and agreements governing our other indebtedness will be affected by changes in the economic or business conditions or other events beyond our control. Complying with our covenants may also cause us to take actions that are not favorable to us and may make it more difficult for us to successfully execute our business strategy and compete, including against companies that are not subject to such restrictions.
12
Risks Related to our Recent Spin-Off
We may not be able to engage in certain corporate transactions.
To preserve the intended tax-free treatment of the Spin-Off, under our Tax Matters Agreement with SPX, for a period of two years following the Spin-Off, we generally will be prohibited from taking certain actions that would prevent the Spin-Off from qualifying as a transaction that generally is tax-free to SPX and SPX’s shareholders, for U.S. federal income tax purposes, under Sections 355 and 368(a)(1)(D) of the Code.
These restrictions, which generally relate to acquisitions of our stock and similar transactions, may limit our ability to pursue certain strategic transactions or other transactions that we may otherwise believe to be in the best interests of our shareholders or that might increase the value of our business.
We are subject to additional costs and demands on management as an independent, publicly-owned company.
As a public entity, we are subject to the reporting requirements of the Exchange Act and requirements of the Sarbanes-Oxley Act of 2002 (the "Sarbanes-Oxley Act"). These requirements may place a strain on our systems and resources. The Exchange Act requires that we file annual, quarterly and current reports about our business and financial condition. Under the Sarbanes-Oxley Act, we must maintain effective disclosure controls and procedures and internal control over financial reporting, which requires significant resources and management oversight. We have implemented additional procedures and processes to address the standards and requirements applicable to public companies. To comply with these requirements, we may need to upgrade our systems; implement additional financial and management controls, reporting systems and procedures; and hire additional accounting and finance staff. We expect to incur additional annual expenses for the purpose of addressing these requirements, and those expenses may be significant. These activities may divert management's attention from other business concerns, which could have a material adverse effect on our financial position, results of operations or cash flows.
In connection with our Spin-Off, SPX will indemnify us for certain liabilities and we will indemnify SPX for certain liabilities. If we are required to act on these indemnities to SPX, we may need to divert cash to meet those obligations and our financial results could be negatively impacted. The SPX indemnity may not be sufficient to insure us against the full amount of liabilities for which we will be allocated responsibility, and SPX may not be able to satisfy its indemnification obligations in the future.
Pursuant to the Separation and Distribution Agreement, the Employee Matters Agreement and the Tax Matters Agreement between us and SPX, SPX has agreed to indemnify us for certain liabilities, and we have agreed to indemnify SPX for certain liabilities, in each case for uncapped amounts. Such indemnities may be significant and could negatively impact our business, particularly our indemnity to SPX regarding the intended tax-free treatment of the Spin-Off. Third parties could also seek to hold us responsible for any of the liabilities that SPX has agreed to retain. Further, the indemnity from SPX may not be sufficient to protect us against the full amount of such liabilities, and SPX may not be able to fully satisfy its indemnification obligations. Moreover, even if we ultimately succeed in recovering from SPX any amounts for which we are held liable, we may be temporarily required to bear these losses ourselves. Each of these risks could negatively affect our business, financial condition, results of operations and cash flows.
The Spin-Off may expose us to potential liabilities arising out of state and federal fraudulent conveyance laws and legal dividend requirements.
The Spin-Off is subject to review under various state and federal fraudulent conveyance laws. Fraudulent conveyance laws generally provide that an entity engages in a constructive fraudulent conveyance when (1) the entity transfers assets and does not receive fair consideration or reasonably equivalent value in return, and (2) the entity (a) is insolvent at the time of the transfer or is rendered insolvent by the transfer, (b) has unreasonably small capital with which to carry on its business, or (c) intends to incur or believes it will incur debts beyond its ability to repay its debts as they mature. An unpaid creditor or an entity acting on behalf of a creditor (including, without limitation, a trustee or debtor-in-possession in a bankruptcy by us or SPX or any of our respective subsidiaries) may bring a lawsuit alleging that the Spin-Off or any of the related transactions constituted a constructive fraudulent conveyance. If a court accepts these allegations, it could impose a number of remedies, including, without limitation, voiding our claims against SPX, requiring our shareholders to return to SPX some or all of the shares of our common stock issued in the Spin-Off, or providing SPX with a claim for money damages against us in an amount equal to the difference between the consideration received by SPX and the fair market value of our company at the time of the Spin-Off.
The measure of insolvency for purposes of the fraudulent conveyance laws will vary depending on which jurisdiction's law is applied. Generally, an entity would be considered insolvent if (1) the present fair saleable value of its assets is less than the amount of its liabilities (including contingent liabilities); (2) the present fair saleable value of its assets is less than its probable liabilities on its debts as such debts become absolute and matured; (3) it cannot pay its debts and other liabilities (including contingent liabilities and other commitments) as they mature; or (4) it has unreasonably small capital for the business in which
13
it is engaged. We cannot assure you what standard a court would apply to determine insolvency or that a court would determine that we, SPX or any of our respective subsidiaries were solvent at the time of or after giving effect to the Spin-Off.
The distribution of our common stock is also subject to review under state corporate distribution statutes. Under the General Corporation Law of the State of Delaware (the "DGCL"), a corporation may only pay dividends to its shareholders either (1) out of its surplus (net assets minus capital) or (2) if there is no such surplus, out of its net profits for the fiscal year in which the dividend is declared and/or the preceding fiscal year.
Although we believe that we and SPX were each solvent at the time of the Spin-Off (including immediately after the distribution of shares of SPX FLOW common stock), that we are able to repay our debts as they mature and have sufficient capital to carry on our businesses, and that the distribution was made entirely out of surplus in accordance with Section 170 of the DGCL, we cannot assure you that a court would reach the same conclusions in determining whether SPX or we were insolvent at the time of, or after giving effect to, the Spin-Off, or whether lawful funds were available for the separation and the distribution to SPX's shareholders.
A court could require that we assume responsibility for obligations allocated to SPX under the Separation and Distribution Agreement.
Under the Separation and Distribution Agreement, both we and SPX are responsible for the debts, liabilities and other obligations related to the business or businesses which it owns and operates. Although we do not expect to be liable for any obligations that are not allocated to us under the Separation and Distribution Agreement, a court could disregard the allocation agreed to between the parties, and require that we assume responsibility for obligations allocated to SPX (including, for example, environmental liabilities), particularly if SPX were to refuse or were unable to pay or perform the allocated obligations.
We are subject to continuing contingent tax liabilities of SPX.
Under the Code and U.S. Treasury Regulations, each corporation that was a member of the SPX consolidated group for U.S. federal income tax purposes during any taxable period (or portion thereof) ending on or before the effective time of the Spin-Off is jointly and severally liable for the entire U.S. federal income tax liability of the SPX consolidated group for that taxable period subsequent to the year ended December 31, 2011. Our Tax Matters Agreement with SPX generally allocates economic responsibility for taxes of the SPX consolidated group to SPX. However, if SPX is unable to pay any such taxes, we could be liable for the entire amount of such taxes, which would include taxes arising out of the Spin-Off if SPX were to take an action (over which we may have no control) that causes the Spin-Off to be taxable to SPX.
Certain of our executive officers and directors may have actual or potential conflicts of interest because of their current or former positions in SPX or their ownership of SPX equity.
Certain of our executive officers and directors are former directors, officers or employees of SPX and thus have professional relationships with SPX’s executive officers and directors. One of our directors, our Chairman, continues to serve on the board of directors of SPX following the Spin-Off. In addition, the majority of our executive officers and directors have a financial interest in SPX as a result of their beneficial ownership of SPX equity. These relationships and financial interests may create, or may create the appearance of, conflicts of interest when these directors and officers face decisions that could have different implications for SPX than for us.
We might have been able to receive better terms from unaffiliated third parties than the terms we receive in our agreements with SPX.
The agreements related to the Spin-Off, including the Separation and Distribution Agreement, the Employee Matters Agreement, the Tax Matters Agreement, the Transition Services Agreement, the Trademark License Agreement, and any other agreements, were negotiated in the context of our separation from SPX while we were still part of SPX. Although these agreements are intended to be on an arm's-length basis, they may not reflect terms that would have resulted from arm's-length negotiations among unaffiliated third parties. The terms of the agreements negotiated in the context of our separation concern, among other things, allocations of assets, liabilities, rights, indemnifications and other obligations among SPX and us.
ITEM 1B. Unresolved Staff Comments
None.
14
ITEM 2. Properties
The following is a summary of our principal properties as of December 31, 2015:
Approximate Square Footage | ||||||||||
Location | No. of Facilities | Owned | Leased | |||||||
(in millions) | ||||||||||
Food and Beverage | 3 U.S. states and 10 foreign countries | 19 | 0.7 | 0.7 | ||||||
Power and Energy | 5 U.S. states and 9 foreign countries | 26 | 2.0 | 0.6 | ||||||
Industrial | 6 U.S. states and 13 foreign countries | 30 | 1.1 | 0.7 | ||||||
Total | 75 | 3.8 | 2.0 | |||||||
In addition to manufacturing plants, we own our corporate office in Charlotte, NC, and lease our Asia Pacific center in Shanghai, China, our European shared service center in Manchester, United Kingdom and various sales, service and other locations throughout the world. We consider these properties, as well as the related machinery and equipment, to be well maintained and suitable and adequate for their intended purposes.
The following table lists the locations of our primary manufacturing and engineering facilities as of December 31, 2015:
Americas | EMEA | Asia Pacific | ||
Burlington, Canada | Annecy, France | Ahmedabad, India | ||
Delavan, WI | Assen, Netherlands | Auckland, New Zealand | ||
Goldsboro, NC | Brixworth, U.K. | Bangalore, India | ||
Hanover Park, IL | Budapest, Hungary | Busan, South Korea | ||
Houston, TX | Bydgoszcz, Poland | Jaipur, India | ||
McKean, PA | Capetown, South Africa | Melbourne, Australia | ||
Newport, NC | De Lier, Netherlands | New Delhi, India | ||
Ocala, FL | Ekero, Sweden | Pune, India | ||
Rochester, NY | Erpe-Mere, Belgium | Singapore | ||
Rockford, IL | Etten-Leur, Netherlands | Sydney, Australia | ||
Santiago, Chile | Eygelshoven, Netherlands | Tokyo, Japan | ||
Sao Paulo, Brazil | Glasgow, U.K. | Xidu, China | ||
Johannesburg, South Africa | ||||
Killarney, Ireland | ||||
Kolding, Denmark | ||||
Moers, Germany | ||||
Newbury, U.K. | ||||
Norderstedt, Germany | ||||
Orebro, Sweden | ||||
Penistone, U.K. | ||||
Santorso, Italy | ||||
Silkeborg, Denmark | ||||
Soeborg, Denmark | ||||
Unna, Germany | ||||
15
ITEM 3. Legal Proceedings
We are subject to legal proceedings and claims that arise in the normal course of business. We believe these matters are either without merit or of a kind that should not have a material effect, individually or in the aggregate, on our financial position, results of operations or cash flows; however, we cannot assure you that these proceedings or claims will not have a material effect on our financial position, results of operations or cash flows.
See "Risk Factors," "MD&A — Critical Accounting Policies and Estimates — Contingent Liabilities," and Note 13 to our consolidated and combined financial statements for further discussion of legal proceedings.
ITEM 4. Mine Safety Disclosures
Not applicable.
16
PART II
ITEM 5. Market For Registrant's Common Equity, Related Stockholder Matters and Issuer Purchases of Equity Securities
Our common stock is traded on the New York Stock Exchange ("NYSE") under the symbol "FLOW."
The number of shareholders of record of our common stock as of February 5, 2016 was 3,490.
The following table sets forth the reported high and low trading prices for our common stock during the fourth quarter of fiscal 2015, beginning September 28, 2015, the date that our common stock began open trading, as reported on the NYSE.
High | Low | ||||||
2015: | |||||||
4th Quarter | $ | 42.06 | $ | 25.49 | |||
Any dividends in future periods, including declaration, record and payment dates, will be at the discretion of our Board of Directors and will depend on, among other things, our results of operations, ongoing capital needs, financial condition and other factors that the Board of Directors may deem relevant, as well as our ability to declare and pay dividends.
Issuer Purchases of Equity Securities
The following table summarizes the repurchases of common stock during the three months ended December 31, 2015:
Period | Total Number of Shares Purchased(1) | Average Price Per Share | Total Number of Shares Purchased as Part of a Publicly Announced Plan or Program | Maximum Approximate Dollar Value of Shares That May Yet be Purchased Under the Plan or Program | ||||||||
9/27/15 - 10/31/15 | 42,274 | $ | 34.43 | — | ||||||||
11/1/15 - 11/30/15 | — | — | ||||||||||
12/1/15 - 12/31/15 | — | — | ||||||||||
Total | 42,274 | |||||||||||
(1) Reflects the surrender to us of shares of common stock to satisfy tax withholding obligations in connection with the vesting of restricted stock units | ||||||||||||
17
Company Performance
This graph shows a comparison of cumulative total returns for SPX FLOW, the S&P 500 Index and the S&P Composite 1500 Industrials Index beginning on September 28, 2015, the date that our common stock began open trading, assuming an initial investment of $100.
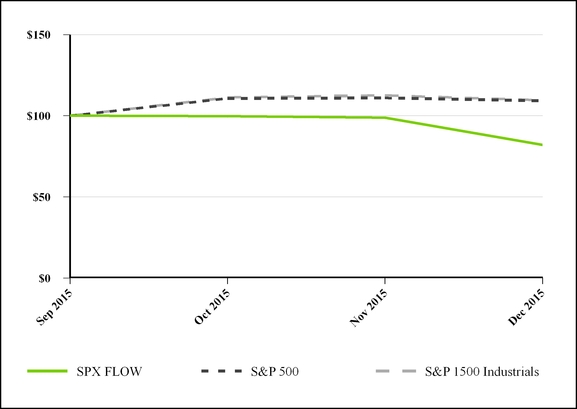
Sep 2015 | Oct 2015 | Nov 2015 | Dec 2015 | ||||||||||||
SPX FLOW | $ | 100.00 | $ | 99.71 | $ | 98.82 | $ | 82.10 | |||||||
S&P 500 | 100.00 | 110.65 | 110.98 | 109.20 | |||||||||||
S&P 1500 Industrials | 100.00 | 111.26 | 112.61 | 109.60 | |||||||||||
ITEM 6. Selected Financial Data
The following table presents our selected historical consolidated and combined financial data as of and for each of the years in the five-year period ended December 31, 2015. Our historical consolidated and combined financial statements, prior to the Spin-Off, include certain expenses of SPX that were charged to us for certain corporate centralized functions and programs, including information technology, payroll services, shared services for accounting, supply chain and manufacturing operations, and business and health insurance coverage. In addition, for purposes of preparing the consolidated and combined financial statements prior to the Spin-Off, a portion of SPX’s total corporate costs were allocated to such financial statements, with the allocations related primarily to (i) the support provided by SPX's executive management, finance and accounting, legal, risk management, and human resource functions and (ii) costs associated with SPX's Charlotte, NC corporate headquarters and its Asia Pacific corporate center in Shanghai, China. Our historical consolidated and combined financial statements, prior to the Spin-Off, also do not reflect the allocation of certain assets and liabilities between SPX and us. Consequently, the financial information included here may not necessarily reflect our financial position, results of operations and cash flows in the future or what our financial condition, results of operations and cash flows would have been had we been an independent, publicly-traded company during the periods presented.
18
The selected historical consolidated and combined financial data presented below should be read in conjunction with our audited combined financial statements included in our Registration Statement on Form 10, as well as our audited consolidated and combined financial statements and accompanying notes and "Management's Discussion and Analysis of Financial Condition and Results of Operations" included elsewhere in this Annual Report on Form 10-K.
(in millions, except per share amounts)
As of and for the year ended December 31, | |||||||||||||||||||
Summary of operations: | 2015 | 2014 | 2013 | 2012 | 2011 | ||||||||||||||
Revenues(1) | $ | 2,388.5 | $ | 2,769.6 | $ | 2,804.8 | $ | 2,846.3 | $ | 2,197.2 | |||||||||
Operating income(2)(3) | 145.5 | 254.6 | 231.2 | 188.9 | 185.2 | ||||||||||||||
Other income (expense), net(4) | 9.8 | 2.2 | (5.2 | ) | (3.4 | ) | (36.8 | ) | |||||||||||
Interest expense, net(5) | (18.1 | ) | (23.4 | ) | (34.7 | ) | (56.0 | ) | (51.3 | ) | |||||||||
Income before income taxes | 137.2 | 233.4 | 191.3 | 129.5 | 97.1 | ||||||||||||||
Income tax provision(6) | (49.8 | ) | (97.5 | ) | (58.8 | ) | (0.6 | ) | (37.6 | ) | |||||||||
Net income | 87.4 | 135.9 | 132.5 | 128.9 | 59.5 | ||||||||||||||
Less: Net income (loss) attributable to noncontrolling interests | (0.1 | ) | 1.4 | 1.5 | 2.0 | 1.2 | |||||||||||||
Net income attributable to SPX FLOW, Inc. | $ | 87.5 | $ | 134.5 | $ | 131.0 | $ | 126.9 | $ | 58.3 | |||||||||
Basic income per share of common stock | $ | 2.14 | $ | 3.30 | $ | 3.21 | $ | 3.11 | $ | 1.43 | |||||||||
Diluted income per share of common stock | $ | 2.14 | $ | 3.29 | $ | 3.20 | $ | 3.10 | $ | 1.42 | |||||||||
Other financial data: | |||||||||||||||||||
Total assets(7) | $ | 3,309.4 | $ | 4,028.1 | $ | 4,490.7 | $ | 3,918.4 | $ | 3,614.2 | |||||||||
Total debt(8) | 1,037.3 | 1,021.1 | 1,006.4 | 805.8 | 819.1 | ||||||||||||||
Other long-term obligations | 275.4 | 342.8 | 382.7 | 402.3 | 345.5 | ||||||||||||||
SPX FLOW, Inc. shareholders' equity | 1,259.1 | 1,925.4 | 2,238.9 | 1,832.9 | 1,621.6 | ||||||||||||||
Noncontrolling interests | 11.5 | 13.4 | 11.6 | 9.0 | 7.4 | ||||||||||||||
Capital expenditures | 57.0 | 40.7 | 23.4 | 26.3 | 22.6 | ||||||||||||||
Depreciation and amortization | 61.9 | 65.8 | 69.9 | 67.3 | 45.0 | ||||||||||||||
(1) | On December 22, 2011, we completed the acquisition of Clyde Union (Holdings) S.a.r.l. ("Clyde Union"). Revenues for Clyde Union for the period from January 1, 2011 to the date of acquisition, which are not included above, totaled $434.2. |
(2) | During 2015, we recognized Special Charges totaling $23.0 related to the ongoing consolidation and relocation of two manufacturing facilities, located in Germany and Denmark, to an existing facility in Poland. |
During 2015, 2014, 2013, 2012 and 2011, we recognized expense related to changes in the fair value of plan assets, actuarial gains/losses, and settlement/curtailment gains/losses of $6.3, $25.8, $2.0, $25.4 and $0.5, respectively, associated with our and SPX's pension and postretirement benefit plans. See Note 8 to our consolidated and combined financial statements for further discussion of employee benefit plans sponsored by us and sponsored by SPX.
(3) | During 2015, we recorded impairment charges of $15.0 and $0.6 related to the trademarks of certain businesses within our Power and Energy and Food and Beverage reportable segments, respectively, and $7.1 related to certain technology assets of a business within our Food and Beverage reportable segment. |
During 2014, we recorded impairment charges of $7.3 and $4.4 related to the trademarks of certain businesses within our Power and Energy and Industrial reportable segments, respectively.
During 2013, we recorded impairment charges of $3.4 and $1.3 related to the trademarks of certain businesses within our Power and Energy and Food and Beverage reportable segments, respectively.
During 2012, we recorded an impairment charge of $2.0 related to the trademarks of a business within our Power and Energy reportable segment.
See Note 7 to our consolidated and combined financial statements for further discussion of impairment charges associated with intangible assets.
(4) | In 2011, we recorded a charge of $34.6 related to a foreign currency forward contract that was entered into to hedge the purchase price of the Clyde Union acquisition. |
(5) | During 2015, 2014, 2013, 2012 and 2011, we recognized interest expense, net, of $2.2, $25.8, $36.3, $55.6 and $52.4 on related party notes receivable and payable in which SPX, or its affiliates that were not part of the Spin-Off, were the counterparties. |
19
(6) | During 2015, the income tax provision was impacted by tax charges of $11.7 related to dividends from foreign subsidiaries, partially offset by tax benefits of (i) $5.1 related to net changes in uncertain tax positions, (ii) $2.8 related to tax rate decreases in Italy and the U.K. and (iii) $2.0 related to foreign exchange losses recognized for income tax purposes with respect to a foreign branch. |
During 2014, the income tax provision was impacted by tax charges of (i) $18.7 related to increases in valuation allowances recorded against certain foreign deferred income tax assets, and (ii) $18.6 related to the repatriation of certain earnings of our non-U.S. subsidiaries. The impact of these items was partially offset by $3.8 of tax benefits related to various audit settlements and statute expirations.
During 2012, the income tax provision was impacted by income tax benefits of $18.3 associated with various audit closures and settlements, statute expirations, and other changes in the accrual for uncertain tax positions, with the most notable being the closure of the German tax examination for the years 2005 through 2009.
(7) | Included in total assets as of December 31, 2014, 2013, 2012 and 2011 are related party notes receivable of $707.1, $763.4, $5.6 and $12.1, respectively. |
(8) | Included in total debt as of December 31, 2014, 2013, 2012 and 2011 are related party notes payable of $1,003.1, $988.4, $775.8 and $758.0, respectively. |
ITEM 7. Management’s Discussion and Analysis of Financial Condition and Results of Operations
(All currency and share amounts are in millions)
The following should be read in conjunction with the other sections of this Annual Report on Form 10-K, including our audited consolidated and combined financial statements and the related notes and "Our Business." The following discussion contains certain forward-looking statements that involve risks, uncertainties and assumptions. Our actual results could differ materially from the results contemplated by these forward-looking statements due to a number of factors including, but not limited to, those discussed under the heading "Risk Factors."
Our audited consolidated and combined financial statements, which we discuss below, reflect our historical financial condition, results of operations and cash flows. The financial information discussed below and included in this Annual Report on Form 10-K, however, may not necessarily reflect what our financial condition, results of operations or cash flows would have been had we been operated as a separate, independent entity during the periods presented, or what our financial condition, results of operations and cash flows may be in the future.
EXECUTIVE OVERVIEW
Spin-off Transaction
On September 26, 2015, SPX completed the previously announced Spin-Off of SPX FLOW, comprising SPX's Flow Technology reportable segment, its Hydraulic Technologies business, various related legal entities, and certain of its corporate assets and liabilities through the pro rata distribution of all shares of SPX FLOW common stock to SPX’s stockholders of record as of 5:00 p.m., New York City time, on September 16, 2015. Accordingly, SPX distributed to its stockholders one share of SPX FLOW common stock, par value $0.01 per share, for every one share of SPX common stock outstanding (the “Distribution”).
Summary of Operating Results
The following summary is intended to provide a few highlights of the discussion and analysis that follows (all comparisons are to the related period in the prior year):
Revenues
• | In 2015, decreased 13.8% to $2,388.5, primarily as a result of the strengthening of the U.S. dollar during the period and lower sales of power and energy pumps, largely reflecting the impact of lower oil prices. |
• | In 2014, decreased 1.3% to $2,769.6, primarily as a result of lower sales of power and energy pumps, partially offset by increased sales of food and beverage systems. |
• | In 2013, decreased 1.5% to $2,804.8, primarily as a result of lower sales of power and energy pumps and industrial heat exchangers, partially offset by an increase in sales of valves, closures and other components into the oil and gas end market, as well as increased sales of systems and components into the food and beverage end market. |
20
Income before Income Taxes
• | In 2015, decreased $96.2, or 41.2%, to $137.2, primarily as a result of a decline in segment profitability, increases in impairments of intangible assets, special charges and third party interest expense, partially offset by declines in pension and postretirement expense and related party interest expense. |
• | In 2014, increased $42.1, or 22.0%, to $233.4, primarily as a result of the improvement in income for our reportable segments, partially offset by an increase in pension and postretirement expense. |
• | In 2013, increased $61.8, or 47.7%, to $191.3, primarily as a result of the improvement in income for our reportable segments, and a reduction in pension and postretirement expense. |
Cash Flows from Operations
• | In 2015, decreased to $213.6 (from $302.6 in 2014), primarily as a result of a decline in segment profitability. |
• | In 2014, increased to $302.6 (from $263.3 in 2013), primarily as a result of the improved profitability noted above. |
• | In 2013, increased to $263.3 (from $150.6 in 2012), primarily as a result of reductions in working capital at our Clyde Union business and, to a lesser extent, the improved profitability noted above. |
RESULTS OF OPERATIONS
Cyclicality of End Markets, Seasonality and Competition -The financial results of our businesses closely follow changes in the industries and end markets they serve. In addition, certain businesses have seasonal fluctuations. Demand in the oil and gas aftermarket is typically stronger in the second half of the year. Also, capital spending on original equipment by our customers in the oil and gas industries is heavily influenced by current and expected oil and gas prices. The significant decline in oil prices from the latter half of 2014 and continuing throughout 2015, as well as the recent volatility in oil prices and the uncertainty in future oil prices, continue to impact both operational and capital spending by end customers in our Power and Energy reportable segment. Revenues from food and beverage systems and related services are highly correlated to timing on large construction contracts, which may cause significant fluctuations in our financial performance from period to period. The reduction in dairy commodity prices and increased production of dry powder dairy products, particularly related to the China market, has resulted in delayed or deferred capital spending by many end customers in our Food and Beverage reportable segment. As a result, we expect an organic decline of approximately 10% for both our Power and Energy and Food and Beverage reportable segments on a year-over-year basis.
Although our businesses operate in highly competitive markets, our competitive position cannot be determined accurately in the aggregate or by segment since our competitors do not offer all the same product lines or serve all the same markets. In addition, specific reliable comparative figures are not available for many of our competitors. In most product groups, competition comes from numerous concerns, both large and small. The principal methods of competition are service, product performance, technical innovation and price. These methods vary with the type of product sold. We believe we compete effectively on the basis of each of these factors. See "Our Business" for a discussion of our competitors.
Non-GAAP Measures - Organic revenue growth (decline) presented herein is defined as revenue growth (decline) excluding the effects of foreign currency fluctuations and acquisitions. We believe this metric is a useful financial measure for investors in evaluating our operating performance for the periods presented, as, when read in conjunction with our revenues, it presents a useful tool to evaluate our ongoing operations and provides investors with a tool they can use to evaluate our management of assets held from period to period. In addition, organic revenue growth (decline) is one of the factors we use in internal evaluations of the overall performance of our business. This metric, however, is not a measure of financial performance under accounting principles generally accepted in the United States (“GAAP”), should not be considered a substitute for net revenue growth (decline) as determined in accordance with GAAP and may not be comparable to similarly titled measures reported by other companies.
21
Years Ended December 31, 2015, 2014 and 2013
The following table provides selected financial information for the years ended December 31, 2015, 2014 and 2013, including the reconciliation of organic revenue decline to net revenue decline:
Year ended December 31, | |||||||||||||||||
2015 | 2014 | 2013 | 2015 vs. 2014% | 2014 vs. 2013% | |||||||||||||
Revenues | $ | 2,388.5 | $ | 2,769.6 | $ | 2,804.8 | (13.8 | ) | (1.3 | ) | |||||||
Gross profit | 792.2 | 936.5 | 898.0 | (15.4 | ) | 4.3 | |||||||||||
% of revenues | 33.2 | % | 33.8 | % | 32.0 | % | |||||||||||
Selling, general and administrative | 558.0 | 629.9 | 618.9 | (11.4 | ) | 1.8 | |||||||||||
% of revenues | 23.4 | % | 22.7 | % | 22.1 | % | |||||||||||
Intangible amortization | 23.4 | 26.1 | 27.2 | (10.3 | ) | (4.0 | ) | ||||||||||
Impairment of intangible assets | 22.7 | 11.7 | 4.7 | 94.0 | 148.9 | ||||||||||||
Special charges, net | 42.6 | 14.2 | 16.0 | 200.0 | (11.3 | ) | |||||||||||
Other income (expense), net | 9.8 | 2.2 | (5.2 | ) | 345.5 | * | |||||||||||
Related party interest expense, net | (2.2 | ) | (25.8 | ) | (36.3 | ) | (91.5 | ) | (28.9 | ) | |||||||
Other interest income (expense), net | (15.9 | ) | 2.4 | 1.6 | * | 50.0 | |||||||||||
Income before income taxes | 137.2 | 233.4 | 191.3 | (41.2 | ) | 22.0 | |||||||||||
Income tax provision | (49.8 | ) | (97.5 | ) | (58.8 | ) | (48.9 | ) | 65.8 | ||||||||
Net income | 87.4 | 135.9 | 132.5 | (35.7 | ) | 2.6 | |||||||||||
Less: Net income (loss) attributable to noncontrolling interests | (0.1 | ) | 1.4 | 1.5 | (107.1 | ) | (6.7 | ) | |||||||||
Net income attributable to SPX FLOW, Inc. | $ | 87.5 | $ | 134.5 | $ | 131.0 | (34.9 | ) | 2.7 | ||||||||
Components of consolidated and combined revenue decline: | |||||||||||||||||
Organic decline | (6.1 | ) | (1.1 | ) | |||||||||||||
Foreign currency | (7.7 | ) | (0.2 | ) | |||||||||||||
Net revenue decline | (13.8 | ) | (1.3 | ) | |||||||||||||
____________________________________________________________
* Not meaningful for comparison purposes.
Revenues - For 2015, the decrease in revenues, compared to 2014, was due to the strengthening of the U.S. dollar against various foreign currencies during the period and, to a lesser extent, a decrease in organic revenue. The decrease in organic revenue was due primarily to lower sales of power and energy pumps, largely reflecting the impact of lower oil prices. See "Results of Reportable Segments" for additional details.
For 2014, the decrease in revenues, compared to 2013, was due to a decline in organic revenue and, to a lesser extent, the strengthening of the U.S. dollar during the period against certain foreign currencies. The decline in organic revenue was due primarily to lower sales of power and energy pumps, partially offset by increased sales of food and beverage systems. See "Results of Reportable Segments" for additional details.
Gross Profit - The decrease in gross profit and gross profit as a percentage of revenue during 2015, compared to 2014, was primarily attributable to our Power and Energy reportable segment and due to the revenue decline noted above, partially offset by the effects of (i) improved operational performance within the Food and Beverage reportable segment and (ii) cost reductions associated with restructuring initiatives implemented during 2014 primarily within the Power and Energy reportable segment. See "Results of Reportable Segments" for additional details.
The increase in gross profit and gross profit as a percentage of revenue during 2014, compared to 2013, was primarily attributable to our Power and Energy reportable segment and was the result of improved operational execution and favorable sales mix, as well as cost reductions associated with restructuring initiatives implemented during the latter half of 2013 and the first half of 2014.
Selling, General and Administrative (“SG&A”) Expense - Prior to the Spin-Off in September 2015, SG&A expense included allocations of general corporate expenses from SPX, including pension and postretirement expense and stock-based compensation expense. See Note 1 to our consolidated and combined financial statements for further details on our methodology for allocating corporate-related costs prior to the Spin-Off. For 2015, the decrease in SG&A expense, compared to 2014, was due primarily to the impact of a stronger U.S. dollar during the period, a decrease in pension and postretirement expense of $21.4 and a decrease in incentive compensation expense, partially offset by an increase in stock-based compensation expense of $5.8
22
during the period (see “Corporate and Other Expenses” for additional details). The decrease in incentive compensation expense was due to lower profitability in 2015, compared to 2014.
For 2014, the increase in SG&A expense, compared to 2013, was due primarily to an increase in pension and postretirement expense of $24.2, partially offset by cost reductions from restructuring actions completed in 2013 and 2014. The increase in pension and postretirement expense resulted primarily from our allocated share of the increase in actuarial losses recorded by SPX on its pension and postretirement plans during 2014. These actuarial losses were due primarily to reductions in discount rates and changes in mortality assumptions used to measure SPX's pension and postretirement obligations, as well as settlement losses associated with certain of SPX's plans.
Intangible Amortization - For 2015 and 2014, respectively, the decrease in intangible amortization, compared to 2014 and 2013, respectively, was due primarily to the impact of foreign currency translation.
Impairment of Intangible Assets - During 2015, we recorded impairment charges of (i) $15.0 related to the trademarks of a business within our Power and Energy reportable segment primarily resulting from the impact of lower oil prices on the purchasing patterns of our customers in the oil and gas markets, and (ii) $7.7 related to certain technology assets and trademarks associated with a business in our Food and Beverage reportable segment due primarily to a decline in order rates and projected future revenues for products derived from such technology.
During 2014, we recorded impairment charges of $7.3 and $4.4 related to the trademarks of certain businesses within our Power and Energy and Industrial reportable segments, respectively.
During 2013, we recorded impairment charges of $3.4 and $1.3 related to the trademarks of certain businesses within our Power and Energy and Food and Beverage reportable segments, respectively.
See Note 7 to our consolidated and combined financial statements for further discussion of impairment charges.
Special Charges, net - Special charges, net, related primarily to restructuring initiatives to consolidate manufacturing, distribution, sales and administrative facilities, reduce workforce, and rationalize certain product lines, as well as asset impairment charges. See Note 5 to our consolidated and combined financial statements for the details of actions taken in 2015, 2014 and 2013. The components of special charges, net, were as follows:
Year ended December 31, | |||||||||||
2015 | 2014 | 2013 | |||||||||
Employee termination costs | $ | 38.5 | $ | 11.6 | $ | 13.5 | |||||
Facility consolidation costs | 2.5 | 0.6 | 1.0 | ||||||||
Other cash costs (recoveries), net | — | 0.5 | (0.2 | ) | |||||||
Non-cash asset write-downs | 1.6 | 1.5 | 1.7 | ||||||||
Total(1) | $ | 42.6 | $ | 14.2 | $ | 16.0 | |||||
(1) | Includes $23.0 in 2015 related to the ongoing consolidation and relocation of two manufacturing facilities, located in Germany and Denmark, to an existing facility in Poland. |
Other Income (Expense), net - Other income, net, for 2015 was composed of net gains on asset sales and other of $8.0, a foreign currency ("FX") gain of $1.1 and investment-related earnings of $0.7.
Other income, net, for 2014 was composed primarily of investment-related earnings of $6.0 and gains on FX embedded derivatives of $2.6, partially offset by (i) FX transaction losses of $2.8 and (ii) losses on FX forward contracts of $2.4. The $6.0 of investment-related earnings represented unrealized gains on our investment in equity securities. See Note 14 to our consolidated and combined financial statements for additional details.
Other expense, net, for 2013 was composed primarily of FX transaction losses of $6.6 and losses on FX embedded derivatives of $0.4, partially offset by gains on FX forward contracts of $1.2.
Related Party Interest Expense, net - Related party interest expense, net, was comprised of interest on notes receivable and notes payable with SPX (and certain other of its affiliates that were not part of the Spin-Off) serving as the counterparties. See Note 15 to our consolidated and combined financial statements for additional details on our related party notes.
Related party interest expense, net, for 2015, 2014 and 2013 was comprised of $28.4, $72.9 and $61.1 of interest expense, respectively, partially offset by $26.2, $47.1 and $24.8 of interest income, respectively. The decrease in related party interest expense in 2015, compared to 2014, reflects primarily the extinguishments of notes payable by way of capital contributions during both the second and third quarters of 2015. The decrease in related party interest income in 2015, compared to 2014, reflects the
23
transfer or cancellation of notes receivable with SPX during September 2015, as well as lower average interest rates as compared to the prior year. All related party notes payable were extinguished by way of capital contribution to the Company by SPX, and all related party notes receivable were transferred to SPX or canceled by the Company, prior to the Spin-Off.
The increase in related party interest expense in 2014, compared to 2013, as noted above, primarily was due to net borrowings from SPX during 2013 of $142.3, while there were no borrowings from SPX under related party notes payable during 2014 and repayments of such notes payable were only $6.7. The increase in related party interest income in 2014, compared to 2013, was due primarily to increased interest associated with advances we made to SPX of $743.3 during the second and fourth quarters of 2013.
Other Interest Income (Expense), net - Other interest income (expense), net, is comprised primarily of interest expense on (i) our senior credit facilities and senior notes, primarily incurred during the fourth quarter of 2015, after the Spin-Off, and (ii) capital lease obligations and miscellaneous lines of credit during all periods presented, offset by interest income on cash and equivalents. See Note 10 to our consolidated and combined financial statements for additional details on our third-party debt.
Interest expense, net, during 2015 included $14.4 related to our senior credit facilities and senior notes, which were entered into or became obligations of the Company in connection with the Spin-Off. Excluding the interest on the senior credit facilities and senior notes, the reduction in interest income, net, during 2015, compared to 2014, was due primarily to a decrease of $3.1 in interest income associated with cash and equivalents. The increase in interest income, net, during 2014, compared to 2013, was not significant.
Income Tax Provision - During 2015, we recorded an income tax provision of $49.8 on $137.2 of income before income taxes, resulting in an effective tax rate of 36.3%. The effective tax rate for 2015 was impacted by tax charges of $11.7 related to dividends from foreign subsidiaries, partially offset by tax benefits of (i) $5.1 related to net changes in uncertain tax positions, (ii) $2.8 related to tax rate decreases in Italy and the U.K. and (iii) $2.0 related to foreign exchange losses recognized for income tax purposes with respect to a foreign branch.
During 2014, we recorded an income tax provision of $97.5 on $233.4 of income before income taxes, resulting in an effective tax rate of 41.8%. The effective tax rate for 2014 was impacted by (i) an income tax charge of $18.7 related to increases in valuation allowances recorded against certain foreign deferred income tax assets and (ii) an income tax charge of $18.6 related to the repatriation of certain earnings of our non-U.S. subsidiaries, partially offset by $3.8 of income tax benefits related to various audit settlements and statute expirations.
During 2013, we recorded an income tax provision of $58.8 on $191.3 of income before income taxes, resulting in an effective tax rate of 30.7%. The effective tax rate for 2013 was impacted by an income tax charge of $3.9 related to net increases in valuation allowances recorded against certain foreign deferred income tax assets, partially offset by $2.0 of income tax benefits related to various audit settlements and statute expirations and $0.7 of income tax benefits associated with the Research and Experimentation Credit generated in 2012.
RESULTS OF REPORTABLE SEGMENTS
The following information should be read in conjunction with our consolidated and combined financial statements and related notes.
Non-GAAP Measures—Throughout the following discussion of reportable segments, we use "organic revenue" growth (decline) to facilitate explanation of the operating performance of our reportable segments. Organic revenue growth (decline) is a non-GAAP financial measure, and is not a substitute for net revenue growth (decline). Refer to the explanation of this measure and purpose of use by management under "Results of Operations-Non-GAAP Measures."
24
Food and Beverage
Year ended December 31, | 2015 vs. 2014 % | 2014 vs. 2013 % | |||||||||||||||
2015 | 2014 | 2013 | |||||||||||||||
Revenues | $ | 886.3 | $ | 968.9 | $ | 970.0 | (8.5 | ) | (0.1 | ) | |||||||
Income | 106.9 | 99.3 | 90.4 | 7.7 | 9.8 | ||||||||||||
% of revenues | 12.1 | % | 10.2 | % | 9.3 | % | |||||||||||
Components of revenue decline: | |||||||||||||||||
Organic growth | 1.2 | 1.0 | |||||||||||||||
Foreign currency | (9.7 | ) | (1.1 | ) | |||||||||||||
Net revenue decline | (8.5 | ) | (0.1 | ) | |||||||||||||
Revenues - For 2015, the decrease in revenues, compared to 2014, was due primarily to the strengthening of the U.S. dollar against various foreign currencies, partially offset by an increase in organic revenue. The increase in organic revenue was driven by higher sales of systems in Europe and Asia Pacific, partially offset by reduced sales of component parts in North America.
For 2014, the decrease in revenues, compared to 2013, was due to a strengthening of the U.S. dollar during the period against various foreign currencies, largely offset by an increase in organic revenue. The increase in organic revenue was due primarily to higher sales of systems and components in Europe.
Income - For 2015, income and margin increased, compared to 2014, primarily as a result of improved operational execution on large systems projects and the organic revenue growth noted above.
For 2014, income and margin increased, compared to 2013, primarily as a result of cost reductions associated with restructuring initiatives at various locations in Europe and, to a lesser extent, improved operational execution and a more favorable sales mix within the segment’s European operations.
Backlog - The segment had backlog of $334.7 and $485.1 as of December 31, 2015 and 2014, respectively. Of the $150.4 year-over-year decline in backlog, $111.3 was attributable to an organic decline and $39.1 was attributable primarily to the impact of a stronger U.S. dollar. The organic decline was primarily due to a lower level of system orders in 2015 as reduced dairy commodity prices and increased production of dry powder dairy products, particularly related to the China market, delayed or deferred capital spending decisions by many end customers. Approximately 92% of the segment's backlog as of December 31, 2015 is expected to be recognized as revenue during 2016.
Power and Energy
Year ended December 31, | 2015 vs. 2014 % | 2014 vs. 2013 % | |||||||||||||||
2015 | 2014 | 2013 | |||||||||||||||
Revenues | $ | 723.0 | $ | 961.6 | $ | 997.5 | (24.8 | ) | (3.6 | ) | |||||||
Income | 87.5 | 168.7 | 127.4 | (48.1 | ) | 32.4 | |||||||||||
% of revenues | 12.1 | % | 17.5 | % | 12.8 | % | |||||||||||
Components of revenue decline: | |||||||||||||||||
Organic decline | (18.7 | ) | (5.0 | ) | |||||||||||||
Foreign currency | (6.1 | ) | 1.4 | ||||||||||||||
Net revenue decline | (24.8 | ) | (3.6 | ) | |||||||||||||
Revenues - For 2015, the decrease in revenues, compared to 2014, was due primarily to the decrease in organic revenue and, to a lesser extent, the strengthening of the U.S. dollar during the period against various foreign currencies. The decline in organic revenue was due largely to the impact of low, volatile and uncertain oil prices which significantly reduced both operational and capital spending by end customers, particularly for projects related to upstream oil applications.
For 2014, the decrease in revenues, compared to 2013, was due to a decline in organic revenue, partially offset by the weakening of the U.S. dollar during the period against the Great Britain Pound (‘‘GBP’’). The decline in organic revenue was due primarily to lower sales of pumps, as the segment entered 2014 with a lower backlog (as compared to 2013) which we believe resulted from our more selective approach to large orders.
Income - For 2015, income and margin decreased, compared to 2014, primarily due to the decline in revenue mentioned above, as well as competitive price pressures and lower utilization rates at certain of our manufacturing locations. These declines
25
in income and margin were offset partially by the effects of cost reductions associated with restructuring initiatives implemented during 2014 within the segment's Clyde Union business.
For 2014, income and margin increased, compared to 2013, primarily due to improved operational execution, favorable sales mix during the period which we attribute to our more selective approach to large orders, and cost reductions associated with restructuring initiatives implemented during the latter half of 2013 and the first half of 2014 at our Clyde Union business.
Backlog - The segment had backlog of $399.1 and $475.5 as of December 31, 2015 and 2014, respectively. Of the $76.4 year-over-year decline in backlog, $52.9 was attributable to an organic decline, primarily due to the impact of lower oil prices mentioned above and $23.5 was attributable primarily to the impact of a stronger U.S. dollar. Approximately 86% of the segment's backlog as of December 31, 2015 is expected to be recognized as revenue during 2016.
Industrial
Year ended December 31, | 2015 vs. 2014 % | 2014 vs. 2013 % | |||||||||||||||
2015 | 2014 | 2013 | |||||||||||||||
Revenues | $ | 779.2 | $ | 839.1 | $ | 837.3 | (7.1 | ) | 0.2 | ||||||||
Income | 107.3 | 123.0 | 119.3 | (12.8 | ) | 3.1 | |||||||||||
% of revenues | 13.8 | % | 14.7 | % | 14.2 | % | |||||||||||
Components of revenue growth (decline): | |||||||||||||||||
Organic growth | — | 1.4 | |||||||||||||||
Foreign currency | (7.1 | ) | (1.2 | ) | |||||||||||||
Net revenue growth (decline) | (7.1 | ) | 0.2 | ||||||||||||||
Revenues - For 2015, the decrease in revenues, compared to 2014, was due to the strengthening of the U.S. dollar against various foreign currencies.
For 2014, the increase in revenues, compared to 2013, was due to an increase in organic revenue, partially offset by the strengthening of the U.S. dollar during the period against various foreign currencies. The increase in organic revenues was due primarily to higher sales of heat exchangers, dehydration equipment and pumps, partially offset by lower sales of mixers.
Income - For 2015, income and margin decreased, compared to 2014, primarily due to the revenue decline noted above and lower sales of generally higher margin hydraulic tools and equipment, which were impacted by a decline of activity in oil and gas markets.
For 2014, income and margin increased, compared to 2013, primarily due to a more favorable sales mix during 2014.
Backlog - The segment had backlog of $171.2 and $210.1 as of December 31, 2015 and 2014, respectively. Of the $38.9 year-over-year decline in backlog, $26.2 was attributable to an organic decline and $12.7 was attributable primarily to the impact of a stronger U.S. dollar. Approximately 97% of the segment's backlog as of December 31, 2015 is expected to be recognized as revenue during 2016.
CORPORATE AND OTHER EXPENSES
Year ended December 31, | 2015 vs. 2014 % | 2014 vs. 2013 % | |||||||||||||||
2015 | 2014 | 2013 | |||||||||||||||
Total consolidated and combined revenues | $ | 2,388.5 | $ | 2,769.6 | $ | 2,804.8 | (13.8 | ) | (1.3 | ) | |||||||
Corporate expense | 54.3 | 58.3 | 59.8 | (6.9 | ) | (2.5 | ) | ||||||||||
% of revenues | 2.3 | % | 2.1 | % | 2.1 | % | |||||||||||
Stock-based compensation expense | 25.8 | 20.0 | 17.4 | 29.0 | 14.9 | ||||||||||||
Pension and postretirement expense | 10.8 | 32.2 | 8.0 | (66.5 | ) | 302.5 | |||||||||||
Corporate Expense - Corporate expense generally relates to the cost of our Charlotte, NC corporate headquarters and our Asia Pacific center in Shanghai, China for the period subsequent to the Spin-Off in September 2015. Corporate expense includes allocations of general corporate expenses from SPX that largely relate to the cost of corporate functions and/or resources provided by SPX for periods prior to the Spin-Off. See Note 1 to our consolidated and combined financial statements for further details on our methodology for allocating corporate-related costs prior to the Spin-Off.
26
The decrease in corporate expense during 2015, compared to 2014, was primarily due to a decline in incentive compensation expense associated with lower profitability in 2015, compared to 2014.
The decrease in corporate expense during 2014, compared to 2013, was primarily due to lower marketing expenses.
Stock-based Compensation Expense - Stock-based compensation expense for the period subsequent to the Spin-Off in September 2015 represents the cost associated with eligible employees who participate in SPX FLOW-sponsored stock compensation plans. For periods prior to the Spin-Off, stock-based compensation represents the cost associated with the eligible employees of the Company, as well as an allocation of a portion of the costs associated with the eligible corporate employees of SPX, who participated in SPX-sponsored stock compensation plans. See Note 1 to our consolidated and combined financial statements for further details on our methodology for determining SPX FLOW's allocated portion of SPX corporate-related costs prior to the Spin-Off.
During the year ended December 31, 2015, we recognized compensation cost of $2.8 related to the increase in fair value of certain stock-based compensation awards for employees, none of whom were named executive officers, as a result of a modification of those awards which became effective upon completion of the Spin-Off.
See Note 12 to our consolidated and combined financial statements for further details on SPX's stock-based compensation plans, the modification of stock-based compensation awards as well as the conversion of SPX-sponsored awards to SPX FLOW-sponsored awards that occurred in connection with the Spin-Off.
The increase in stock-based compensation expense for 2014, compared to 2013, was primarily the result of an increase in the fair value of the 2014 restricted stock share and restricted stock unit awards, as the weighted-average fair value of the 2014 awards was approximately 41% higher than the 2013 awards.
Pension and Postretirement Expense - SPX sponsors a number of pension and postretirement plans. In addition, we also sponsor pension and postretirement plans. For all of these plans, changes in the fair value of plan assets and actuarial gains and losses are recognized to earnings in the fourth quarter of each year as a component of net periodic benefit expense, unless earlier remeasurement is required. The remaining components of pension and postretirement expense, primarily service and interest costs and expected return on plan assets, are recorded on a quarterly basis.
Pension and postretirement expense for the period subsequent to the Spin-Off in September 2015 represents net periodic benefit expense associated with plans that SPX FLOW sponsors. For periods prior to the Spin-Off, pension and postretirement expense represents net periodic benefit expense associated with the plans we sponsor as well as an allocation of a portion of the net periodic benefit expense associated with the plans sponsored by SPX. See Note 1 to our consolidated and combined financial statements for further details on our methodology for allocating corporate-related costs prior to the Spin-Off.
During 2015, pension and postretirement expense decreased, compared to 2014, primarily as a result of a decrease in actuarial losses associated with the plans we sponsor (in 2015) compared to the plans sponsored by SPX and those that we sponsor (in 2014).
During 2014, pension and postretirement expense increased, compared to 2013, primarily as a result of an increase in actuarial losses associated with both the plans sponsored by SPX and those that we sponsor.
See Note 8 to our consolidated and combined financial statements for further details on our and SPX’s pension and postretirement plans.
LIQUIDITY AND FINANCIAL CONDITION
Listed below are the cash flows from (used in) operating, investing, and financing activities, as well as the net change in cash and equivalents, for the years ended December 31, 2015, 2014 and 2013.
27
Cash Flow
Year ended December 31, | |||||||||||
2015 | 2014 | 2013 | |||||||||
Cash flows from operating activities | $ | 213.6 | $ | 302.6 | $ | 263.3 | |||||
Cash flows used in investing activities | (44.8 | ) | (34.0 | ) | (752.0 | ) | |||||
Cash flows from (used in) financing activities | (68.1 | ) | (297.8 | ) | 388.3 | ||||||
Change in cash and equivalents due to changes in foreign currency exchange rates | (21.4 | ) | (12.0 | ) | (4.8 | ) | |||||
Net change in cash and equivalents | $ | 79.3 | $ | (41.2 | ) | $ | (105.2 | ) | |||
Years Ended December 31, 2015 and 2014
Operating Activities—During 2015, the decrease in cash flows from operating activities, compared to 2014, was primarily attributable to a decline in segment profitability.
Investing Activities—During 2015, cash flows used in investing activities were comprised primarily of capital expenditures of $57.0 associated generally with upgrades of manufacturing facilities and information technology, partially offset by proceeds from asset sales and other of $12.5. Cash flows used in investing activities during 2014 were comprised primarily of capital expenditures of $40.7 associated generally with upgrades of manufacturing facilities and replacement of equipment, partially offset by proceeds from asset sales and other of $7.3.
Financing Activities —During 2015, cash flows used in financing activities related primarily to net transfers to SPX of $453.9, repayments of related party notes payable of $5.4, and payments of financing fees of $6.2, partially offset by net borrowings under our senior credit facilities of $400.0. Cash flows used in financing activities during 2014 related primarily to net transfers to SPX of $291.6 and repayments of related party notes payable of $6.7.
Change in Cash and Equivalents due to Changes in Foreign Currency Exchange Rates - The decrease in cash and equivalents due to foreign currency exchange rates of $21.4 and $12.0 in 2015 and 2014, respectively, reflected primarily a reduction in U.S. dollar equivalent balances of foreign-denominated cash and equivalents as a result of the strengthening of the U.S. dollar against various foreign currencies in 2015 and against primarily the Euro in 2014.
Years Ended December 31, 2014 and 2013
Operating Activities—During 2014, the increase in cash flows from operating activities, compared to 2013, was due primarily to improved profitability.
Investing Activities—During 2014, cash flows used in investing activities were comprised primarily of capital expenditures of $40.7, partially offset by proceeds from asset sales and other of $7.3. Cash flows used in investing activities during 2013 were comprised primarily of loans to SPX of $743.3 and capital expenditures of $23.4, partially offset by proceeds from asset sales and other of $12.0.
Financing Activities —During 2014, cash flows used in financing activities related primarily to net transfers to SPX of $291.6, while cash flows from financing activities in 2013 related primarily to net transfers from SPX of $261.3 and net borrowings from SPX (and certain of its affiliates that were not part of the Spin-Off) of $142.3.
Change in Cash and Equivalents due to Changes in Foreign Currency Exchange Rates—The decrease in cash and equivalents due to foreign currency exchange rates of $12.0 and $4.8 in 2014 and 2013, respectively, reflected primarily a reduction in U.S. dollar equivalent balances of Euro- and GBP-denominated cash and equivalents, as a result of the strengthening of the U.S. dollar against these currencies during the respective periods.
28
Borrowings and Availability
Borrowings —Debt (other than related party notes payable, discussed further in Note 15 of our consolidated and combined financial statements) at December 31, 2015 and 2014 comprised the following:
December 31, | |||||||
2015 | 2014 | ||||||
Term loan(1) | $ | 400.0 | $ | — | |||
6.875% senior notes, due in August 2017 | 600.0 | — | |||||
Other indebtedness(2) | 37.3 | 18.0 | |||||
Total debt | 1,037.3 | 18.0 | |||||
Less: short-term debt | 28.0 | 6.0 | |||||
Less: current maturities of long-term debt | 10.3 | 1.7 | |||||
Total long-term debt | $ | 999.0 | $ | 10.3 | |||
(1) | The term loan of $400.0 is repayable in quarterly installments of 5.0% annually, beginning with our third quarter of 2016, with the remaining balance repayable in full on September 24, 2020. |
(2) | Primarily includes capital lease obligations of $9.3 and $12.0 and balances under a purchase card program of $23.6 and $0.0 as of December 31, 2015 and 2014, respectively. The purchase card program allows for payment beyond the normal payment terms for goods and services acquired under the program. As this arrangement extends the payment of these purchases beyond their normal payment terms through third-party lending institutions, we have classified these amounts as short-term debt. |
Senior Credit Facilities
On September 1, 2015, we entered into senior credit facilities with a syndicate of lenders that provide for committed senior secured financing in the aggregate amount of $1.35 billion, consisting of the following, each with a final maturity of September 24, 2020:
• | A term loan facility in an aggregate principal amount of $400.0; |
• | A domestic revolving credit facility, available for loans and letters of credit, in an aggregate principal amount up to $250.0; |
• | A global revolving credit facility, available for loans (and performance letters of credit and guarantees up to the equivalent of $100.0) in Euros, GBP and other currencies, in an aggregate principal amount up to the equivalent of $200.0; |
• | A participation multi-currency foreign credit instrument facility, available for performance letters of credit and guarantees, in an aggregate principal amount up to the equivalent of $250.0; and |
• | A bilateral multi-currency foreign credit instrument facility, available for performance letters of credit and guarantees, in an aggregate principal amount up to the equivalent of $250.0. |
Senior Notes
On September 22, 2015, in anticipation of the completion of the Spin-Off, we entered into a supplemental indenture and issued substitute global notes in connection with our substitution for SPX as the obligor of $600.0 aggregate principal amount of 6.875% senior notes. These notes mature in August 2017, with interest payable on March 1 and September 1 of each year. The notes are redeemable, in whole or in part, at any time prior to maturity at a price equal to 100% of the principal amount thereof plus an applicable premium, plus accrued and unpaid interest. If we experience certain types of change of control transactions, we must offer to repurchase the notes at 101% of the aggregate principal amount of the notes repurchased, plus accrued and unpaid interest. These notes are unsecured and rank equally with all our existing and future unsubordinated unsecured senior indebtedness, but are effectively junior to our senior credit facilities. The indenture governing these notes contains covenants that, among other things, limit our ability to incur liens, enter into sale and leaseback transactions and consummate some mergers. Payment of the principal, interest and premium (if any) on the notes is guaranteed on a senior unsecured basis by our domestic subsidiaries.
Availability
As of December 31, 2015, we had $440.5 of available borrowing capacity under our revolving credit facilities after giving effect to $9.5 reserved for outstanding letters of credit, and $50.0 of available borrowing capacity under our trade receivables
29
financing arrangement. In addition, as of December 31, 2015, we had $227.7 of available issuance capacity under our foreign credit instrument facilities after giving effect to $272.3 reserved for outstanding letters of credit.
Refer to Note 10 to our consolidated and combined financial statements for further information on our borrowings as of December 31, 2015.
Financial Instruments
We measure our financial assets and liabilities on a recurring basis, and nonfinancial assets and liabilities on a non-recurring basis, at fair value. Fair value is the price that would be received to sell an asset or paid to transfer a liability in an orderly transaction between market participants at the measurement date. We utilize market data or assumptions that we believe market participants would use in pricing the asset or liability, including assumptions about risk and the risks inherent in the inputs to the valuation technique. These inputs can be readily observable quoted prices in active markets for identical assets or liabilities (Level 1), significant other observable inputs (Level 2) or significant unobservable inputs (Level 3).
Our derivative financial assets and liabilities include FX forward contracts and FX embedded derivatives measured at fair value using observable market inputs such as forward rates, interest rates, our own credit risk and our counterparties' credit risks. Based on these inputs, the derivative assets and liabilities are classified within Level 2 of the valuation hierarchy. Based on our continued ability to enter into forward contracts, we consider the markets for our fair value instruments active.
As of December 31, 2015, there had been no significant impact to the fair value of our derivative liabilities due to our own credit risk as the related instruments were collateralized under our senior credit facilities. Similarly, there had been no significant impact to the fair value of our derivative assets based on our evaluation of our counterparties' credit risks.
We primarily use the income approach, which uses valuation techniques to convert future amounts to a single present amount. Assets and liabilities measured at fair value on a recurring basis are further discussed below.
Currency Forward Contracts and Currency Forward Embedded Derivatives
We manufacture and sell our products in a number of countries and, as a result, are exposed to movements in foreign currency exchange rates. Our objective is to preserve the economic value of non-functional currency-denominated cash flows and to minimize the impact of changes as a result of currency fluctuations (see Note 11 to our consolidated and combined financial statements). Our principal currency exposures relate to the Euro, Chinese Yuan and GBP.
We had FX forward contracts with an aggregate notional amount of $44.7 and $84.4 outstanding as of December 31, 2015 and 2014, respectively, with all such contracts scheduled to mature within one year. We also had FX embedded derivatives with an aggregate notional amount of $31.6 and $53.4 at December 31, 2015 and 2014, respectively, with scheduled maturities of $30.8 and $0.8 within one and two years, respectively. The unrealized loss, net of tax, recorded in accumulated other comprehensive loss related to FX forward contracts was less than $0.1 as of December 31, 2015 and 2014. The net gains (losses) recorded in "Other income (expense), net" related to foreign currency gains (losses) totaled $1.1, $(2.6), and $(5.8) for the years ended December 31, 2015, 2014 and 2013, respectively.
The net fair values of our FX forward contracts and FX embedded derivatives were $0.5 (asset) and $0.6 (liability) at December 31, 2015 and 2014, respectively.
Other Fair Value Financial Assets and Liabilities
The carrying amounts of cash and equivalents and receivables (excluding related party notes receivable) reported in our consolidated and combined balance sheets approximate fair value due to the short-term nature of those instruments. At December 31, 2014, the aggregate estimated fair value of our related party notes receivable was approximately $758.0, compared to the aggregate carrying value of $707.1. There were no related party notes receivable outstanding as of December 31, 2015.
The fair value of our debt instruments (excluding capital leases), based on borrowing rates available to us at December 31, 2015 for similar debt, was $1,065.5, compared to our carrying value of $1,028.0. There were no related party notes payable outstanding as of December 31, 2015.
As of December 31, 2014, the fair value of our debt instruments (excluding capital leases and related party notes payable), based on borrowing rates available to us at December 31, 2014 for similar debt, was $6.0, compared to our carrying value of $6.0. The aggregate estimated fair value of our related party notes payable was approximately $1,127.0, compared to the aggregate carrying value of $1,003.1.
30
Concentrations of Credit Risk
Financial instruments that potentially subject us to significant concentrations of credit risk consist of cash and equivalents, trade accounts receivable, and FX forward contracts. These financial instruments, other than trade accounts receivable, are placed with high-quality financial institutions throughout the world. We periodically evaluate the credit standing of these financial institutions.
We maintain cash levels in bank accounts that, at times, may exceed federally-insured limits. We have not experienced, and believe we are not exposed to significant risk of, loss in these accounts.
We have credit loss exposure in the event of nonperformance by counterparties to the above financial instruments, but have no other off-balance-sheet credit risk of accounting loss. We anticipate that counterparties will be able to fully satisfy their obligations under the contracts. We do not obtain collateral or other security to support financial instruments subject to credit risk, but we do monitor the credit standing of counterparties.
Concentrations of credit risk arising from trade accounts receivable are due to selling to customers in a particular industry. Credit risks are mitigated by performing ongoing credit evaluations of our customers' financial conditions and obtaining collateral, advance payments, or other security when appropriate. No one customer, or group of customers that to our knowledge are under common control, accounted for more than 10% of our revenues for any period presented.
Cash and Other Commitments
We use operating leases to finance certain equipment, vehicles and properties. At December 31, 2015, we had $77.0 of future minimum rental payments under operating leases with remaining non-cancelable terms in excess of one year.
Capital expenditures for 2015 totaled $57.0, compared to $40.7 and $23.4 in 2014 and 2013, respectively. Capital expenditures in 2015 related primarily to upgrades to manufacturing facilities and information technology. We expect 2016 capital expenditures to approximate $60, with a significant portion related to upgrades of manufacturing facilities and information technology. While the impact of continued market volatility cannot be predicted, we believe we have sufficient operating flexibility, cash reserves and funding sources to maintain adequate amounts of liquidity and to meet our future operating cash needs and internal growth opportunities.
In 2015, we made contributions and direct benefit payments of $2.5 to our defined benefit pension and postretirement plans. We expect to make $68.4 of minimum required funding contributions and direct benefit payments in 2016, consisting primarily of expected direct pension benefit payments to certain former officers of the Company. Our pension plans have not experienced any liquidity difficulties or counterparty defaults due to the volatility in the credit markets. Our foreign pension funds experienced a positive return on assets of approximately 7.0% in 2015. See Note 8 to our consolidated and combined financial statements for further disclosure of expected future contributions and benefit payments.
On a net basis, we paid $35.9, $11.4 and $19.0 in income taxes in 2015, 2014 and 2013, respectively. The amount of income taxes we pay annually is dependent on various factors, including the timing of certain deductions. Deductions and the amount of income taxes can and do vary from year to year. See Note 9 to our consolidated and combined financial statements for further disclosure of earnings held by foreign subsidiaries, amounts considered permanently reinvested, and our intentions with respect to repatriation of earnings.
As of December 31, 2015, except as discussed in Note 13 to our consolidated and combined financial statements and in the contractual obligations table below, we did not have any material guarantees, off-balance sheet arrangements or purchase commitments.
We continually review each of our businesses in order to determine their long-term strategic fit. These reviews could result in selected acquisitions to expand an existing business or result in the disposition of an existing business. See "Risk Factors," "Results of Reportable Segments" included in this "Management's Discussion and Analysis of Financial Condition and Results of Operations," and "Business" for an understanding of the risks, uncertainties and trends facing our businesses.
Global Realignment Program
On February 10, 2016, we announced our intent to further optimize our global footprint, streamline business processes and reduce selling, general and administrative expense through a global realignment program. The two year realignment program is intended to reduce costs across operating sites and corporate and global functions, in part by making structural changes which allow us to operate more efficiently. We plan to have approximately $105 in cash outflows in support of our realignment program in 2016. Additionally, we expect to recognize pre-tax charges to earnings of approximately $100 in the aggregate over the next two years. These realignment actions are expected to be substantially complete by the end of 2017.
31
Contractual Obligations
The following is a summary of our primary contractual obligations as of December 31, 2015:
Total | Due Within 1 Year | Due in 1-3 Years | Due in 3-5 Years | Due After 5 Years | |||||||||||||||
Short-term debt obligations | $ | 28.0 | $ | 28.0 | $ | — | $ | — | $ | — | |||||||||
Long-term debt obligations | 1,009.3 | 10.3 | 645.0 | 350.8 | 3.2 | ||||||||||||||
Pension and postretirement benefit plan contributions and payments(1) | 152.5 | 68.4 | 5.9 | 12.5 | 65.7 | ||||||||||||||
Purchase and other contractual obligations(2) | 262.5 | 252.0 | 8.0 | 2.5 | — | ||||||||||||||
Future minimum operating lease payments(3) | 77.0 | 21.8 | 26.2 | 14.3 | 14.7 | ||||||||||||||
Interest payments | 108.7 | 50.6 | 44.5 | 13.1 | 0.5 | ||||||||||||||
Total contractual cash obligations(4) | $ | 1,638.0 | $ | 431.1 | $ | 729.6 | $ | 393.2 | $ | 84.1 | |||||||||
(1) | Estimated minimum required pension contributions and pension and postretirement benefit payments are based on actuarial estimates using current assumptions for, among other things, discount rates, expected long-term rates of return on plan assets (where applicable), rates of compensation increases, and health care cost trend rates. See Note 8 to our consolidated and combined financial statements for additional information on expected future contributions and benefit payments. |
(2) | Represents contractual commitments to purchase goods and services at specified dates. |
(3) | Represents rental payments under operating leases with remaining non-cancelable terms in excess of one year. |
(4) | Contingent obligations, such as environmental accruals and those relating to uncertain tax positions, generally do not have specific payment dates and accordingly have been excluded from the above table. Based on the outcome of certain examinations or as a result of the expiration of statutes of limitations for certain jurisdictions, we believe that within the next 12 months it is reasonably possible that our previously unrecognized tax benefits could decrease by $1.0 to $3.0. In addition, the above table does not include potential payments under our derivative financial instruments. |
We believe that our cash flows, together with cash and equivalents on hand, provide us with the ability to fund our operations and make planned capital expenditure payments for at least the next twelve months. However, such cash flows are dependent upon our future operating performance which, in turn, is subject to prevailing economic conditions and to financial, business and other factors, including the conditions of our markets, some of which are beyond our control. If, in the future, we cannot generate sufficient cash from operations to meet any future debt service obligations, we would need to refinance such debt obligations, obtain additional financing or sell assets. We cannot assure you that our business will generate cash from operations, or that we will be able to obtain financing from other sources, sufficient to satisfy any such debt service or other requirements.
Critical Accounting Policies and Use of Estimates
The preparation of financial statements in accordance with GAAP requires us to make estimates and assumptions that affect the reported amounts of assets, liabilities, revenues and expenses, and disclosure of contingent assets and liabilities. The accounting policies that we believe are most critical to the portrayal of our financial condition and results of operations and that require our most difficult, subjective or complex judgments in estimating the effect of inherent uncertainties are listed below. This section should be read in conjunction with Notes 1 and 2 to our consolidated and combined financial statements, which include a detailed discussion of these and other accounting policies.
Long-Term Contract Accounting
Certain of our businesses recognize revenues and profits from long-term construction/installation contracts under the percentage-of-completion method of accounting. The percentage-of-completion method requires estimates of future revenues and costs over the full term of product delivery. We measure the percentage-of-completion principally by the contract costs incurred to date as a percentage of the estimated total costs for that contract at completion. Under the percentage-of-completion method, we recognized revenues of $490.7, $573.1 and $612.8 during the years ended December 31, 2015, 2014 and 2013, respectively.
We record any provision for estimated losses on uncompleted long-term contracts in the period in which the losses are determined. In the case of customer change orders for uncompleted long-term contracts, we include estimated recoveries for work performed in forecasting ultimate profitability on these contracts. Due to uncertainties inherent in the estimation process, it is reasonably possible that completion costs, including those arising from contract penalty provisions and final contract settlements, will be revised during the duration of a contract. These revisions to costs and income are recognized in the period in which the revisions are determined.
32
Our estimation process for determining revenues and costs for contracts accounted for under the percentage-of-completion method is based upon (i) our historical experience, (ii) the professional judgment and knowledge of our engineers, project managers, and operations and financial professionals, and (iii) an assessment of the key underlying factors (see below) that impact the revenues and costs of our long-term contracts. Each long-term contract is unique, but typically similar enough to other contracts that we can effectively leverage our experience. As our long-term contracts generally range from six to eighteen months in duration, we typically reassess the estimated revenues and costs of these contracts on a quarterly basis, but may reassess more often as situations warrant. We record changes in estimates of revenues and costs when identified using the cumulative catch-up method prescribed under the Revenue Recognition Topic of the Codification.
We believe the underlying factors used to estimate our costs to complete and percentage-of-completion are sufficiently reliable to provide a reasonable estimate of revenue and profit; however, due to the length of time over which revenue streams are generated and costs are incurred, along with the judgment required in developing the underlying factors, the variability of revenue and cost can be significant. Factors that may affect revenue and costs relating to long-term contracts include, but are not limited to, the following:
• | Sales Price Incentives and Sales Price Escalation Clauses—Sales price incentives and sales price escalations that are reasonably assured and reasonably estimable are recorded over the performance period of the contract. Otherwise, these amounts are recorded when awarded. |
• | Cost Recovery for Product Design Changes and Claims—On occasion, design specifications may change during the course of the contract. Any additional costs arising from these changes may be supported by change orders, or we may submit a claim to the customer. Change orders are accounted for as described above. See below for our accounting policies related to claims. |
• | Material Availability and Costs—Our estimates of material costs generally are based on existing supplier relationships, adequate availability of materials, prevailing market prices for materials and, in some cases, long-term supplier contracts. Changes in our supplier relationships, delays in obtaining materials, or changes in material prices can have an impact on our cost and profitability estimates. |
• | Use of Sub-Contractors—Our arrangements with sub-contractors are generally based on fixed prices; however, our estimates of the cost and profitability can be impacted by sub-contractor delays, customer claims arising from sub-contractor performance issues, or a sub-contractor's inability to fulfill its obligations. |
• | Labor Costs and Anticipated Productivity Levels—Where applicable, we include the impact of labor improvements in our estimation of costs, such as in cases where we expect a favorable learning curve over the duration of the contract. In these cases, if the improvements do not materialize, costs and profitability could be adversely impacted. Additionally, to the extent we are more or less productive than originally anticipated, estimated costs and profitability may also be impacted. |
• | Effect of Foreign Currency Fluctuations—Fluctuations between currencies in which our long-term contracts are denominated and the currencies under which contract costs are incurred can have an impact on profitability. When the impact on profitability is potentially significant, we may (but generally do not) enter into FX forward contracts or prepay certain vendors for raw materials to manage the potential exposure. See Note 11 to our consolidated and combined financial statements for additional details on our FX forward contracts. |
Costs and estimated earnings in excess of billings on uncompleted contracts arise when revenues have been recorded but the amounts have not been billed under the terms of the contracts. These amounts are recoverable from customers upon various measures of performance, including achievement of certain milestones, completion of specified units or completion of the contract.
We periodically make claims against customers, suppliers and sub-contractors associated with alleged non-performance and other disputes over contractual terms. Claims related to long-term contracts are recognized as additional revenues or as a reduction of costs only after we have determined that collection is probable and the amount is reasonably estimable. Claims made by us may involve negotiation and, in certain cases, litigation or other dispute-resolution processes. In the event we incur litigation or other dispute-resolution costs in connection with claims, these costs are expensed as incurred, although we may seek to recover these costs. Claims against us are recognized when a loss is considered probable and amounts are reasonably estimable.
Impairment of Goodwill and Indefinite-Lived Intangible Assets
Goodwill and indefinite-lived intangible assets are not amortized, but instead are subject to annual impairment testing. We monitor the results of each of our reporting units as a means of identifying trends and/or matters that may impact their financial
33
results and, thus, be an indicator of a potential impairment. The trends and/or matters that we specifically monitor for each of our reporting units are as follows:
• | Significant variances in financial performance (e.g., revenues, earnings and cash flows) in relation to expectations and historical performance; |
• | Significant changes in end markets or other economic factors; |
• | Significant changes or planned changes in our use of a reporting unit's assets; and |
• | Significant changes in customer relationships and competitive conditions. |
The identification and measurement of goodwill impairment involves the estimation of the fair value of reporting units. We consider a number of factors, including the input of an independent appraisal firm, in conducting the impairment testing of our reporting units. We perform our impairment testing by comparing the estimated fair value of the reporting unit to the carrying value of the reported net assets, with such testing occurring during the fourth quarter of each year in conjunction with our annual financial planning process (or more frequently if impairment indicators arise), based primarily on events and circumstances existing as of the end of the third quarter. Fair value is generally based on the income approach using a calculation of discounted cash flows, based on the most recent financial projections for the reporting units. The revenue growth rates included in the financial projections are our best estimates based on current and forecasted market conditions, and the profit margin assumptions are projected by each reporting unit based on current cost structure and, when applicable, anticipated net cost reductions.
The calculation of fair value for our reporting units incorporates many assumptions including future growth rates, profit margin and discount factors. Changes in economic and operating conditions impacting these assumptions could result in impairment charges in future periods.
We perform our annual trademarks impairment testing during the fourth quarter, or on a more frequent basis if there are indications of potential impairment. The fair values of our trademarks are determined by applying estimated royalty rates to projected revenues, with the resulting cash flows discounted at a rate of return that reflects current market conditions. During 2015, 2014 and 2013, we recorded impairment charges of $15.6, $11.7 and $4.7, respectively, related to trademarks of certain of our businesses. In addition, during 2015, we recorded an impairment charge of $7.1 related to certain technology assets of a business. We determined the impairment for technology assets by comparing the future discounted cash flows associated with the technology assets to their carrying values. Other changes in the gross values of trademarks and other identifiable intangible assets related primarily to foreign currency translation.
Refer to Note 7 to our consolidated and combined financial statements for further information on our 2015 goodwill and indefinite-lived intangible assets as of and for the year ended December 31, 2015.
Employee Benefit Plans
For both the plans we sponsor and the plans sponsored by SPX, changes in the fair value of plan assets and actuarial gains and losses are recognized to earnings in the fourth quarter of each year, unless earlier remeasurement is required. The remaining components of pension and postretirement expense, primarily service and interest costs and expected return on plan assets, are recorded on a quarterly basis.
Neither our pension plans nor the pension plans sponsored by SPX have experienced any significant impact on liquidity or counterparty exposure due to the volatility in the credit markets.
The costs and obligations associated with these plans are determined based on actuarial valuations. The critical assumptions used in determining these obligations and related expenses are discount rates and healthcare cost projections. These critical assumptions are calculated based on relevant data and appropriate market indicators, and are evaluated at least annually in consultation with outside actuaries. Other assumptions involving demographic factors such as retirement patterns, mortality, turnover and the rate of increase in compensation levels are evaluated periodically and are updated to reflect actual experience and expectations for the future. While we believe that the assumptions used are appropriate, actual results may differ.
The discount rate enables the expected future cash flows to be stated at a present value on the measurement date. This rate is the yield on high-quality fixed income investments at the measurement date. A lower discount rate increases the present value of benefit obligations and increases pension expense. Including the effects of recognizing actuarial gains and losses into earnings as described above, a 50 basis point increase (decrease) in the discount rate on the plans we sponsor would have decreased (increased) our 2015 pension expense by approximately $4.3.
34
See Note 8 to our consolidated and combined financial statements for further information on our accounting for pension and postretirement benefit plans.
Income Taxes
For purposes of our consolidated and combined financial statements, our income tax provision has been determined as if we filed income tax returns on a stand-alone basis for periods prior to the Spin-Off. Our tax results from periods prior to the Spin-Off as presented in the consolidated and combined financial statements may not be reflective of the results that we will generate in the future. In jurisdictions where we were included in the tax returns filed by SPX or its subsidiaries that were not part of the Spin-Off, any income taxes payable resulting from the related income tax provision were reflected in our combined balance sheet as of December 31, 2014 and through the Spin-Off date within "Former parent company investment."
Deferred tax assets and liabilities reflect the net tax effects of temporary differences between the carrying amounts of assets and liabilities for financial reporting purposes and the amounts used for income tax purposes. We periodically assess whether deferred tax assets will be realized and the adequacy of deferred tax liabilities, including the results of tax audits or estimates and judgments used.
Realization of deferred tax assets involves estimates regarding (1) the timing and amount of the reversal of taxable temporary differences, (2) expected future taxable income, and (3) the impact of tax planning strategies. We believe that it is more likely than not that we may not realize the benefit of certain deferred tax assets and, accordingly, have established a valuation allowance against them. In assessing the need for a valuation allowance, we consider all available positive and negative evidence, including past operating results, projections of future taxable income and the feasibility of and potential changes to ongoing tax planning strategies. The projections of future taxable income include a number of estimates and assumptions regarding our volume, pricing and costs. Although realization is not assured for the remaining deferred tax assets, we believe it is more likely than not that the remaining deferred tax assets will be realized through future taxable earnings or alternative tax strategies. However, deferred tax assets could be reduced in the near term if our estimates of taxable income are significantly reduced or tax strategies are no longer viable.
We review our income tax positions on a continuous basis and record a provision for potential uncertain tax positions when we determine that an uncertain position meets the criteria of the Income Taxes Topic of the Codification. As events change or resolutions occur, adjustments are made to amounts previously provided, such as in the case of audit settlements with taxing authorities. We believe we have adequately provided for any reasonably foreseeable outcome related to these matters.
Our future results may include favorable or unfavorable adjustments to our estimated tax liabilities due to closure of income tax examinations, statute expirations, new regulatory or judicial pronouncements, changes in tax laws, changes in projected levels of taxable income, future tax planning strategies, or other relevant events. See Note 9 to our consolidated and combined financial statements for additional details regarding our uncertain tax positions.
Contingent Liabilities
We are subject to litigation matters that arise in the normal course of business. We believe these matters are either without merit or of a kind that should not have a material effect, individually or in the aggregate, on our financial position, results of operations or cash flows.
We are subject to domestic and international environmental protection laws and regulations with respect to our business operations and are operating in compliance with, or taking action aimed at ensuring compliance with, these laws and regulations. None of our compliance obligations with environmental protection laws and regulations, individually or in the aggregate, is expected to have a material adverse effect on our financial position, results of operations or cash flows.
New Accounting Pronouncements
See Note 3 to our consolidated and combined financial statements for a discussion of recent accounting pronouncements.
ITEM 7A. Quantitative and Qualitative Disclosures about Market Risk
We are exposed to market risk related to changes in interest rates, foreign currency exchange rates and commodity raw material prices, and we selectively use financial instruments to manage certain of these risks. We do not enter into financial instruments for speculative or trading purposes; however, these instruments may be deemed speculative if the future cash flows originally hedged are no longer probable of occurring as anticipated. Our currency exposures vary, but are primarily concentrated in the Euro, Chinese Yuan and GBP. We generally do not hedge currency translation exposures. Our exposures for commodity
35
raw materials vary, with the highest concentration relating to steel, copper, and oil. See Note 11 to our consolidated and combined financial statements for further details.
The following table provides information, as of December 31, 2015, about our primary outstanding debt obligations and presents principal cash flows by expected maturity dates, weighted-average interest rates and fair values.
Expected Maturity Date Through December 31, | |||||||||||||||||||||||||||||||
2016 | 2017 | 2018 | 2019 | 2020 | Thereafter | Total | Fair Value | ||||||||||||||||||||||||
6.875% senior notes | $ | — | $ | 600.0 | $ | — | $ | — | $ | — | $ | — | $ | 600.0 | $ | 637.5 | |||||||||||||||
Average interest rate | 6.875 | % | |||||||||||||||||||||||||||||
Term loan | 10.0 | 20.0 | 20.0 | 20.0 | 330.0 | — | 400.0 | 400.0 | |||||||||||||||||||||||
Average interest rate | 2.170 | % | |||||||||||||||||||||||||||||
We believe that cash and equivalents, cash flows from operations, and availability under revolving credit facilities and our trade receivables financing arrangement will be sufficient to fund working capital needs, planned capital expenditures, dividend payments (if declared), other operational cash requirements and required debt service obligations for at least the next 12 months.
We had FX forward contracts with an aggregate notional amount of $44.7 outstanding as of December 31, 2015, with all such contracts scheduled to mature within one year. We had FX embedded derivatives with an aggregate notional amount of $31.6 outstanding as of December 31, 2015, with scheduled maturities of $30.8 and $0.8 within one and two years, respectively. The gross fair values of our FX forward contracts and FX embedded derivatives, in aggregate, were $2.0 (gross assets) and $1.5 (gross liabilities) as of December 31, 2015.
36
ITEM 8. Financial Statements And Supplementary Data
SPX FLOW, INC. AND SUBSIDIARIES
INDEX TO CONSOLIDATED AND COMBINED FINANCIAL STATEMENTS
Report of Independent Registered Public Accounting Firm - Deloitte & Touche LLP | |
Consolidated and Combined Statements of Operations for the Years Ended December 31, 2015, 2014 and 2013 | |
Consolidated and Combined Statements of Comprehensive Income (Loss) for the Years Ended December 31, 2015, 2014 and 2013 | |
Consolidated and Combined Balance Sheets as of December 31, 2015 and 2014 | |
Consolidated and Combined Statements of Equity for the Years Ended December 31, 2015, 2014 and 2013 | |
Consolidated and Combined Statements of Cash Flows for the Years Ended December 31, 2015, 2014 and 2013 | |
Notes to Consolidated and Combined Financial Statements | |
All schedules are omitted because they are not applicable, not required or because the required information is included in our consolidated and combined financial statements or notes thereto.
37
Report of Independent Registered Public Accounting Firm
To the Shareholders and Board of Directors of SPX FLOW, Inc.:
We have audited the accompanying consolidated and combined balance sheets of SPX FLOW, Inc. and subsidiaries (the “Company”) as of December 31, 2015 and 2014, and the related consolidated and combined statements of operations, comprehensive income (loss), equity, and cash flows for each of the three years in the period ended December 31, 2015. These financial statements are the responsibility of the Company’s management. Our responsibility is to express an opinion on these financial statements based on our audits.
We conducted our audits in accordance with the standards of the Public Company Accounting Oversight Board (United States). Those standards require that we plan and perform the audit to obtain reasonable assurance about whether the financial statements are free of material misstatement. The Company is not required to have, nor were we engaged to perform, an audit of its internal control over financial reporting. Our audits included consideration of internal control over financial reporting as a basis for designing audit procedures that are appropriate in the circumstances, but not for the purpose of expressing an opinion on the effectiveness of the Company’s internal control over financial reporting. Accordingly, we express no such opinion. An audit also includes examining, on a test basis, evidence supporting the amounts and disclosures in the financial statements, assessing the accounting principles used and significant estimates made by management, as well as evaluating the overall financial statement presentation. We believe that our audits provide a reasonable basis for our opinion.
In our opinion, such consolidated and combined financial statements present fairly, in all material respects, the financial position of SPX FLOW, Inc. and subsidiaries as of December 31, 2015 and 2014 and the results of their operations and their cash flows for each of the three years in the period ended December 31, 2015, in conformity with accounting principles generally accepted in the United States of America.
/s/ Deloitte & Touche LLP
Charlotte, North Carolina
February 12, 2016
38
SPX FLOW, INC. AND SUBSIDIARIES
CONSOLIDATED AND COMBINED STATEMENTS OF OPERATIONS
(in millions, except per share amounts)
Year ended December 31, | |||||||||||
2015 | 2014 | 2013 | |||||||||
Revenues | $ | 2,388.5 | $ | 2,769.6 | $ | 2,804.8 | |||||
Costs and expenses: | |||||||||||
Cost of products sold | 1,596.3 | 1,833.1 | 1,906.8 | ||||||||
Selling, general and administrative | 558.0 | 629.9 | 618.9 | ||||||||
Intangible amortization | 23.4 | 26.1 | 27.2 | ||||||||
Impairment of intangible assets | 22.7 | 11.7 | 4.7 | ||||||||
Special charges, net | 42.6 | 14.2 | 16.0 | ||||||||
Operating income | 145.5 | 254.6 | 231.2 | ||||||||
Other income (expense), net | 9.8 | 2.2 | (5.2 | ) | |||||||
Related party interest expense, net | (2.2 | ) | (25.8 | ) | (36.3 | ) | |||||
Other interest income (expense), net | (15.9 | ) | 2.4 | 1.6 | |||||||
Income before income taxes | 137.2 | 233.4 | 191.3 | ||||||||
Income tax provision | (49.8 | ) | (97.5 | ) | (58.8 | ) | |||||
Net income | 87.4 | 135.9 | 132.5 | ||||||||
Less: Net income (loss) attributable to noncontrolling interests | (0.1 | ) | 1.4 | 1.5 | |||||||
Net income attributable to SPX FLOW, Inc. | $ | 87.5 | $ | 134.5 | $ | 131.0 | |||||
Basic income per share of common stock | $ | 2.14 | $ | 3.30 | $ | 3.21 | |||||
Diluted income per share of common stock | $ | 2.14 | $ | 3.29 | $ | 3.20 | |||||
Weighted-average number of common shares outstanding — basic | 40.863 | 40.809 | 40.809 | ||||||||
Weighted-average number of common shares outstanding — diluted | 40.960 | 40.932 | 40.932 | ||||||||
The accompanying notes are an integral part of these statements.
39
SPX FLOW, INC. AND SUBSIDIARIES
CONSOLIDATED AND COMBINED STATEMENTS OF COMPREHENSIVE INCOME (LOSS)
(in millions)
Year ended December 31, | |||||||||||
2015 | 2014 | 2013 | |||||||||
Net income | $ | 87.4 | $ | 135.9 | $ | 132.5 | |||||
Other comprehensive income (loss), net: | |||||||||||
Net unrealized losses on qualifying cash flow hedges, net of tax benefit of $0.4 in 2013 | — | — | (0.6 | ) | |||||||
Pension liability adjustment, net of tax provision of $0.0 and $0.1 in 2015 and 2014, respectively | (0.1 | ) | 0.2 | — | |||||||
Net unrealized gains (losses) on available-for-sale securities | — | 3.7 | (0.6 | ) | |||||||
Foreign currency translation adjustments | (165.0 | ) | (202.5 | ) | 10.8 | ||||||
Other comprehensive income (loss), net | (165.1 | ) | (198.6 | ) | 9.6 | ||||||
Total comprehensive income (loss) | (77.7 | ) | (62.7 | ) | 142.1 | ||||||
Less: Total comprehensive income (loss) attributable to noncontrolling interests | (1.7 | ) | 3.1 | 0.7 | |||||||
Total comprehensive income (loss) attributable to SPX FLOW, Inc. | $ | (76.0 | ) | $ | (65.8 | ) | $ | 141.4 | |||
The accompanying notes are an integral part of these statements.
40
SPX FLOW, INC. AND SUBSIDIARIES
CONSOLIDATED AND COMBINED BALANCE SHEETS
(in millions, except share data)
December 31, 2015 | December 31, 2014 | ||||||
ASSETS | |||||||
Current assets: | |||||||
Cash and equivalents | $ | 295.9 | $ | 216.6 | |||
Accounts receivable, net | 483.9 | 591.9 | |||||
Related party accounts receivable | — | 16.6 | |||||
Inventories, net | 305.2 | 330.0 | |||||
Other current assets | 72.4 | 36.4 | |||||
Deferred income taxes | — | 52.6 | |||||
Total current assets | 1,157.4 | 1,244.1 | |||||
Property, plant and equipment: | |||||||
Land | 37.7 | 30.8 | |||||
Buildings and leasehold improvements | 224.9 | 158.6 | |||||
Machinery and equipment | 483.9 | 350.0 | |||||
746.5 | 539.4 | ||||||
Accumulated depreciation | (314.1 | ) | (267.0 | ) | |||
Property, plant and equipment, net | 432.4 | 272.4 | |||||
Goodwill | 1,023.4 | 1,081.0 | |||||
Intangibles, net | 579.4 | 659.3 | |||||
Other assets | 116.8 | 64.2 | |||||
Related party notes receivable | — | 707.1 | |||||
TOTAL ASSETS | $ | 3,309.4 | $ | 4,028.1 | |||
LIABILITIES AND EQUITY | |||||||
Current liabilities: | |||||||
Accounts payable | $ | 227.1 | $ | 252.0 | |||
Related party accounts payable | — | 11.9 | |||||
Accrued expenses | 467.3 | 426.1 | |||||
Income taxes payable | 31.7 | 35.4 | |||||
Short-term debt | 28.0 | 6.0 | |||||
Current maturities of long-term debt | 10.3 | 1.7 | |||||
Current maturities of related party notes payable | — | 36.8 | |||||
Total current liabilities | 764.4 | 769.9 | |||||
Long-term debt | 999.0 | 10.3 | |||||
Related party notes payable | — | 966.3 | |||||
Deferred and other income taxes | 142.0 | 234.1 | |||||
Other long-term liabilities | 133.4 | 108.7 | |||||
Total long-term liabilities | 1,274.4 | 1,319.4 | |||||
Commitments and contingent liabilities (Note 13) | |||||||
Equity: | |||||||
SPX FLOW, Inc. shareholders’ equity: | |||||||
Preferred stock, no par value, 3,000,000 shares authorized, and no shares issued and outstanding | — | — | |||||
Common stock, $0.01 par value, 300,000,000 shares authorized, 41,429,014 issued and 41,386,740 outstanding at December 31, 2015, and no shares issued and outstanding at December 31, 2014 | 0.4 | — | |||||
Paid-in capital | 1,621.7 | — | |||||
Retained earnings | 21.1 | — | |||||
Accumulated other comprehensive loss | (382.7 | ) | (219.2 | ) | |||
Common stock in treasury (42,274 shares at December 31, 2015, and no shares at December 31, 2014) | (1.4 | ) | — | ||||
Former parent company investment | — | 2,144.6 | |||||
Total SPX FLOW, Inc. shareholders' equity | 1,259.1 | 1,925.4 | |||||
Noncontrolling interests | 11.5 | 13.4 | |||||
Total equity | 1,270.6 | 1,938.8 | |||||
TOTAL LIABILITIES AND EQUITY | $ | 3,309.4 | $ | 4,028.1 | |||
The accompanying notes are an integral part of these statements.
41
SPX FLOW, INC. AND SUBSIDIARIES
CONSOLIDATED AND COMBINED STATEMENTS OF EQUITY
(in millions)
Common Stock | Paid-In Capital | Retained Earnings | Accumulated Other Comprehensive Loss | Common Stock in Treasury | Former Parent Company Investment | Total SPX FLOW, Inc. Shareholders' Equity | Noncontrolling Interests | Total Equity | ||||||||||||||||||||||||||||||
Shares Outstanding | Par | |||||||||||||||||||||||||||||||||||||
Balance at December 31, 2012 | — | $ | — | $ | — | $ | — | $ | (29.3 | ) | $ | — | $ | 1,862.2 | $ | 1,832.9 | $ | 9.0 | $ | 1,841.9 | ||||||||||||||||||
Net income | — | — | — | — | — | — | 131.0 | 131.0 | 1.5 | 132.5 | ||||||||||||||||||||||||||||
Other comprehensive income (loss), net | — | — | — | — | 10.4 | — | — | 10.4 | (0.8 | ) | 9.6 | |||||||||||||||||||||||||||
Net transfers from parent | — | — | — | — | — | — | 264.6 | 264.6 | — | 264.6 | ||||||||||||||||||||||||||||
Other changes in noncontrolling interests | — | — | — | — | — | — | — | — | 1.9 | 1.9 | ||||||||||||||||||||||||||||
Balance at December 31, 2013 | — | — | — | — | (18.9 | ) | — | 2,257.8 | 2,238.9 | 11.6 | 2,250.5 | |||||||||||||||||||||||||||
Net income | — | — | — | — | — | — | 134.5 | 134.5 | 1.4 | 135.9 | ||||||||||||||||||||||||||||
Other comprehensive income (loss), net | — | — | — | — | (200.3 | ) | — | — | (200.3 | ) | 1.7 | (198.6 | ) | |||||||||||||||||||||||||
Net transfers to parent | — | — | — | — | — | — | (247.7 | ) | (247.7 | ) | — | (247.7 | ) | |||||||||||||||||||||||||
Dividends attributable to noncontrolling interests | — | — | — | — | — | — | — | — | (0.5 | ) | (0.5 | ) | ||||||||||||||||||||||||||
Other changes in noncontrolling interests | — | — | — | — | — | — | — | — | (0.8 | ) | (0.8 | ) | ||||||||||||||||||||||||||
Balance at December 31, 2014 | — | — | — | — | (219.2 | ) | — | 2,144.6 | 1,925.4 | 13.4 | 1,938.8 | |||||||||||||||||||||||||||
Net income (loss) | — | — | — | 21.1 | — | — | 66.4 | 87.5 | (0.1 | ) | 87.4 | |||||||||||||||||||||||||||
Other comprehensive loss, net | — | — | — | — | (163.5 | ) | — | — | (163.5 | ) | (1.6 | ) | (165.1 | ) | ||||||||||||||||||||||||
Net transfers to parent | — | — | — | — | — | — | (592.3 | ) | (592.3 | ) | — | (592.3 | ) | |||||||||||||||||||||||||
Reclassification of former parent company investment to common stock and paid-in capital | 41.3 | 0.4 | 1,618.3 | — | — | — | (1,618.7 | ) | — | — | — | |||||||||||||||||||||||||||
Incentive plan activity | 0.1 | — | 1.7 | — | — | — | — | 1.7 | — | 1.7 | ||||||||||||||||||||||||||||
Stock-based compensation expense | — | — | 5.4 | — | — | — | — | 5.4 | — | 5.4 | ||||||||||||||||||||||||||||
Restricted stock and restricted stock unit vesting, including related tax benefit of $3.6 and net of tax withholdings | — | — | (3.7 | ) | — | — | (1.4 | ) | — | (5.1 | ) | — | (5.1 | ) | ||||||||||||||||||||||||
Dividends attributable to noncontrolling interests | — | — | — | — | — | — | — | — | (0.2 | ) | (0.2 | ) | ||||||||||||||||||||||||||
Balance at December 31, 2015 | 41.4 | $ | 0.4 | $ | 1,621.7 | $ | 21.1 | $ | (382.7 | ) | $ | (1.4 | ) | $ | — | $ | 1,259.1 | $ | 11.5 | $ | 1,270.6 | |||||||||||||||||
The accompanying notes are an integral part of these statements.
42
SPX FLOW, INC. AND SUBSIDIARIES
CONSOLIDATED AND COMBINED STATEMENTS OF CASH FLOWS
(in millions)
Year ended December 31, | |||||||||||
2015 | 2014 | 2013 | |||||||||
Cash flows from operating activities: | |||||||||||
Net income | $ | 87.4 | $ | 135.9 | $ | 132.5 | |||||
Adjustments to reconcile net income to net cash from operating activities: | |||||||||||
Special charges, net | 42.6 | 14.2 | 16.0 | ||||||||
Impairment of intangible assets | 22.7 | 11.7 | 4.7 | ||||||||
Deferred and other income taxes | (25.4 | ) | 22.4 | (10.3 | ) | ||||||
Depreciation and amortization | 61.9 | 65.8 | 69.9 | ||||||||
Pension and other employee benefits | 11.3 | 9.4 | 5.0 | ||||||||
Stock-based compensation | 5.4 | — | — | ||||||||
Gain on asset sales and other, net | (8.0 | ) | — | — | |||||||
Changes in operating assets and liabilities: | |||||||||||
Accounts receivable and other assets | 47.4 | 64.4 | 35.4 | ||||||||
Inventories | (2.5 | ) | (9.6 | ) | 13.1 | ||||||
Accounts payable, accrued expenses and other | (14.9 | ) | 2.0 | 11.4 | |||||||
Cash spending on restructuring actions | (14.3 | ) | (13.6 | ) | (14.4 | ) | |||||
Net cash from operating activities | 213.6 | 302.6 | 263.3 | ||||||||
Cash flows used in investing activities: | |||||||||||
Amounts advanced for related party notes receivable | — | — | (743.3 | ) | |||||||
Repayments of related party notes receivable | — | — | 5.6 | ||||||||
Proceeds from asset sales and other, net | 12.5 | 7.3 | 12.0 | ||||||||
Increase in restricted cash | (0.3 | ) | (0.6 | ) | — | ||||||
Other investments | — | — | (2.9 | ) | |||||||
Capital expenditures | (57.0 | ) | (40.7 | ) | (23.4 | ) | |||||
Net cash used in investing activities | (44.8 | ) | (34.0 | ) | (752.0 | ) | |||||
Cash flows from (used in) financing activities: | |||||||||||
Borrowings under senior credit facilities | 534.0 | — | — | ||||||||
Repayments of senior credit facilities | (134.0 | ) | — | — | |||||||
Borrowings under trade receivables agreement | 34.0 | — | — | ||||||||
Repayments of trade receivables agreement | (34.0 | ) | — | — | |||||||
Borrowings under related party notes payable | — | — | 147.5 | ||||||||
Repayments of related party notes payable | (5.4 | ) | (6.7 | ) | (5.2 | ) | |||||
Borrowings under other financing arrangements | 6.1 | 5.7 | 3.1 | ||||||||
Repayments of other financing arrangements | (7.0 | ) | (3.9 | ) | (20.3 | ) | |||||
Minimum withholdings paid on behalf of employees for net share settlements, net | (1.5 | ) | — | — | |||||||
Financing fees paid | (6.2 | ) | — | — | |||||||
Change in noncontrolling interests in subsidiary | — | (0.8 | ) | 1.9 | |||||||
Dividends paid to noncontrolling interests in subsidiary | (0.2 | ) | (0.5 | ) | — | ||||||
Change in former parent company investment | (453.9 | ) | (291.6 | ) | 261.3 | ||||||
Net cash from (used in) financing activities | (68.1 | ) | (297.8 | ) | 388.3 | ||||||
Change in cash and equivalents due to changes in foreign currency exchange rates | (21.4 | ) | (12.0 | ) | (4.8 | ) | |||||
Net change in cash and equivalents | 79.3 | (41.2 | ) | (105.2 | ) | ||||||
Combined cash and equivalents, beginning of period | $ | 216.6 | $ | 257.8 | $ | 363.0 | |||||
Consolidated and combined cash and equivalents, end of period | $ | 295.9 | $ | 216.6 | $ | 257.8 | |||||
Supplemental disclosure of cash flow information: | |||||||||||
Interest paid | $ | 5.8 | $ | 3.7 | $ | 4.3 | |||||
Income taxes paid, net of refunds of $3.2, $6.2 and $4.8 in 2015, 2014 and 2013, respectively | $ | 35.9 | $ | 11.4 | $ | 19.0 | |||||
Non-cash investing and financing activity: | |||||||||||
Debt assumed | $ | 622.4 | $ | — | $ | — | |||||
The accompanying notes are an integral part of these statements.
43
SPX FLOW, INC. AND SUBSIDIARIES
NOTES TO CONSOLIDATED AND COMBINED FINANCIAL STATEMENTS
(in millions, except share data)
(1) | BACKGROUND, BASIS OF PRESENTATION AND SUMMARY OF SIGNIFICANT ACCOUNTING POLICIES |
SPX FLOW, Inc. (“SPX FLOW,” ‘‘the Company,’’ “we,” “us,” or “our”) operates in three business segments and was wholly owned by SPX Corporation (“SPX” or the “former Parent”) until September 26, 2015, when SPX distributed 100% of our outstanding common stock to the SPX shareholders through a tax-free spin-off transaction (the “Spin-Off”).
The Company engineers, designs, manufactures and markets products and solutions used to process, blend, filter, dry, meter and transport fluids with a focus on original equipment installation, including turn-key systems, modular systems and components, as well as comprehensive aftermarket components and support services. Primary component offerings include engineered pumps, valves, mixers, plate heat exchangers, dehydration and filtration technologies, and industrial tools and hydraulic units. The Company primarily serves customers in the food and beverage, power and energy and industrial end markets.
Background
On October 29, 2014, SPX announced that its Board of Directors had unanimously approved a plan to spin off its Flow business, comprising its Flow Technology reportable segment, its Hydraulic Technologies business, certain of its corporate subsidiaries and certain of its corporate assets and liabilities (collectively, SPX FLOW, Inc.), and separate SPX into two distinct, publicly-traded companies. The Spin-Off was completed by way of a pro rata distribution of our common stock to SPX’s shareholders of record as of the close of business on September 16, 2015, the Spin-Off record date. Each SPX shareholder received, effective as of 11:59 p.m., Eastern time, on September 26, 2015, one share of our common stock for every share of SPX common stock held by such shareholder on the record date. On September 26, 2015, SPX FLOW became a separate publicly-traded company, and SPX did not retain any ownership interest in SPX FLOW. A Registration Statement on Form 10 describing the transaction was filed by SPX FLOW with the U.S. Securities and Exchange Commission (the “SEC”) and was declared effective on September 11, 2015 (as amended through the time of such effectiveness, the “Registration Statement on Form 10”).
Basis of Presentation
Our consolidated balance sheet as of December 31, 2015 consists of the consolidated balances of SPX FLOW as prepared on a stand-alone basis. Our combined balance sheet as of December 31, 2014, and consolidated and combined statements of operations, comprehensive income (loss), equity, and cash flows for the years ended December 31, 2015, 2014 and 2013, have been prepared on a “carve out” basis for the periods and dates prior to the Spin-Off and include adjustments for certain transactions that occurred concurrently upon completion of the Spin-Off (see Notes 8 and 12) as well as stand-alone results for the period subsequent to the date of the Spin-Off. These consolidated and combined financial statements have been derived from the consolidated financial statements and accounting records of SPX and SPX FLOW and prepared in conformity with accounting principles generally accepted in the United States ("GAAP"). Consequently, the financial information included herein may not necessarily reflect our financial position, results of operations and cash flows in the future or what our financial condition, results of operations and cash flows would have been had we been an independent, publicly-traded company during the periods presented.
The consolidated and combined statements of operations include costs for certain centralized functions and programs provided and/or administered by SPX prior to the Spin-Off that were charged directly to SPX’s business units, including business units of SPX FLOW. These centralized functions and programs included, but were not limited to, information technology, payroll services, shared services for accounting, supply chain and manufacturing operations, and business and health insurance coverage. Prior to the Spin-Off and during the years ended December 31, 2015, 2014 and 2013, $81.0, $109.0 and $77.0 respectively, of such costs were directly charged to the Company's business units and were included in selling, general and administrative expenses in the accompanying consolidated and combined statements of operations.
In addition, for purposes of preparing these consolidated and combined financial statements on a “carve out” basis, a portion of SPX’s total corporate expenses have been allocated to SPX FLOW. These expense allocations include the cost of corporate functions and/or resources provided by SPX including, but not limited to, executive management, finance and accounting, legal, and human resources support, and the cost of our Charlotte, NC corporate headquarters and our Asia Pacific center in Shanghai, China, and included the related benefit costs associated with such functions, such as pension and postretirement benefits and stock-based compensation. Prior to the Spin-Off and in the years ended December 31, 2015, 2014 and 2013, the Company was allocated $50.7, $95.9 and $73.9, respectively, of such general corporate and related benefit costs, which were primarily included within selling, general and administrative expenses in the consolidated and combined statements of operations.
44
SPX FLOW, INC. AND SUBSIDIARIES
NOTES TO CONSOLIDATED AND COMBINED FINANCIAL STATEMENTS (CONTINUED)
(in millions, except share data)
In addition to pre-Spin-Off allocation of costs associated with SPX's corporate functions, including the related benefit costs, the consolidated and combined financial statements include an allocation of corporate-related special charges. Costs were allocated to the Company based on direct usage when identifiable or, when not directly identifiable, on the basis of proportional revenues of the Company to SPX's consolidated revenues from continuing operations. Management considers the basis on which the expenses have been allocated to reasonably reflect the utilization of services provided to or the benefit received by the Company during the periods presented. The allocations may not, however, reflect the expenses the Company would have incurred if the Company had been a stand-alone company for the periods presented.
Pre-Spin-Off cash and equivalents held by SPX at the corporate level that were not specifically identifiable to the Company have not been reflected in the Company's combined financial statements prior to the date of the Spin-Off. Cash transfers between SPX and the Company (other than related to notes receivable and payable, as discussed further below) were accounted for through former parent company investment. Cash and equivalents in the combined financial statements prior to the date of the Spin-Off represent cash and equivalents held locally by the Company's entities. SPX's third-party debt and the related interest expense were not allocated to us for any of the periods presented as we were not the legal obligor of such debt.
All intercompany transactions have been eliminated. All transactions between the Company and SPX (including its affiliates that were not part of the Spin-Off) have been included in these combined financial statements prior to the date of Spin-Off. For those transactions historically settled in cash between the Company and SPX (including its affiliates that were not part of the Spin-Off), the Company has reflected such balances in the combined balance sheet as of December 31, 2014 as "Related party accounts receivable" or "Related party accounts payable." The aggregate net effect of such transactions not historically settled in cash between the Company and SPX has been reflected in the combined balance sheet as of December 31, 2014 as "Former parent company investment" and in the combined statements of cash flows prior to the date of the Spin-Off as "Change in former parent company investment." In addition, prior to the Spin-Off, the Company had amounts due from and due to SPX (and its affiliates that were not part of the Spin-Off) supported by promissory notes. The respective amounts have been reflected in the Company's combined balance sheet as of December 31, 2014 as "Related party notes receivable" and "Related party notes payable," while the respective interest income and interest expense amounts recognized prior to the Spin-Off have been reflected in "Related party interest expense, net" within the Company's consolidated and combined statements of operations.
Certain operating cash flow amounts in the accompanying combined statements of cash flows for the years ended December 31, 2014 and 2013 have been reclassified to conform to the current year presentation.
The Company operates on a calendar year-end.
Transition Services Agreement - Post-Spin-Off
On September 26, 2015 in connection with the Spin-Off, we entered into a transition services agreement with SPX, under which SPX or certain of its subsidiaries provide us, and we provide SPX or certain of its subsidiaries, with certain services to help ensure an orderly transition following the Spin-Off (the "Transition Services Agreement").
The services SPX agreed to provide to us include information technology, human resources, finance and financial reporting and other administrative services. The services we have agreed to provide to SPX include information technology, human resources, finance and financial reporting, tax compliance, facility access and other administrative services. The charges for these services are intended to allow SPX or us, as applicable, to recover the direct and indirect costs incurred in providing such services. The Transition Services Agreement generally provides for a term of services starting at the Spin-Off date and continuing for a period of up to twelve months following the Spin-Off. Other than with respect to certain fixed-term pass-through services, the applicable recipient of services may terminate any transition services it is receiving upon prior notice to the other party, upon thirty days' notice, with any extension or renewal of the Transition Services Agreement or the services provided thereunder requiring mutual agreement between SPX and us.
Amounts related to services provided and received by us subsequent to the Spin-Off were not significant.
Other Agreements with SPX - Post-Spin-Off
In connection with the Spin-Off, we entered into other definitive agreements with SPX that, among other matters, set forth the terms and conditions of the Spin-Off and provide a framework for our relationship with SPX after the Spin-Off. A summary of the material terms of these agreements can be found in the "Certain Relationships and Related Party Transactions" section of the Information Statement of the Company, attached as Exhibit 99.1 to our Registration Statement on Form 10.
45
SPX FLOW, INC. AND SUBSIDIARIES
NOTES TO CONSOLIDATED AND COMBINED FINANCIAL STATEMENTS (CONTINUED)
(in millions, except share data)
Summary of Significant Accounting Policies
Our significant accounting policies are described below, as well as in other Notes that follow.
Foreign Currency Translation and Transactions—The financial statements of our foreign subsidiaries are translated into U.S. dollars in accordance with the Foreign Currency Matters Topic of the Financial Accounting Standards Board Codification ("Codification" or "ASC"). Balance sheet accounts are translated at the current rate at the end of each period and income statement accounts are translated at the average rate for each period. Gains and losses on foreign currency translations are reflected as a separate component of equity and other comprehensive income (loss). Foreign currency transaction gains and losses, as well as gains and losses related to foreign currency forward contracts and currency forward embedded derivatives, are included in "Other income (expense), net," with the related net gains (losses) totaling $1.1, $(2.6) and $(5.8) in 2015, 2014 and 2013, respectively.
Cash Equivalents—We consider highly liquid money market investments with original maturities of three months or less at the date of purchase to be cash equivalents.
Revenue Recognition—We recognize revenues from product sales upon shipment to the customer (e.g., FOB shipping point) or, to a lesser extent, upon receipt by the customer (e.g., FOB destination), in accordance with the agreed upon customer terms. Revenues from service contracts and long-term maintenance arrangements are recognized on a straight-line basis over the agreement period.
Amounts billed for shipping and handling are included in revenues. Costs incurred for shipping and handling are recorded in "Cost of products sold." Taxes assessed by governmental authorities that are directly imposed on a revenue-producing transaction between a seller and a customer are presented on a net basis (excluded from revenues) in our consolidated and combined statements of operations.
We recognize revenue from long-term construction/installation contracts under the percentage-of-completion method of accounting. The percentage-of-completion is measured principally by the percentage of costs incurred to date for each contract to the estimated total costs for such contract at completion. We recognize revenues for similar short-term contracts using the completed-contract method of accounting.
Provisions for any estimated losses on uncompleted long-term contracts are made in the period in which such losses are determined. In the case of customer change orders for uncompleted long-term contracts, estimated recoveries are included for work performed in forecasting ultimate profitability on certain contracts. Due to uncertainties inherent in the estimation process, it is reasonably possible that completion costs, including those arising from contract penalty provisions and final contract settlements, will be revised in the near-term. Such revisions to costs and income are recognized in the period in which the revisions are determined.
Costs and estimated earnings in excess of billings arise when revenues have been recorded but the amounts have not been billed under the terms of the contracts. These amounts are recoverable from customers upon various measures of performance, including achievement of certain milestones, completion of specified units or completion of the contract. Claims related to long-term contracts are recognized as revenue only after we have determined that collection is probable and the amount can be reliably estimated. Claims made by us involve negotiation and, in certain cases, litigation or other dispute-resolution processes. In the event we incur litigation or other dispute-resolution costs in connection with claims, such costs are expensed as incurred, although we may seek to recover these costs. Claims against us are recognized when a loss is considered probable and amounts are reasonably estimable.
We recognized $490.7, $573.1 and $612.8 in revenues under the percentage-of-completion method for the years ended December 31, 2015, 2014 and 2013, respectively. Costs and estimated earnings on uncompleted contracts, from their inception, and related amounts billed as of December 31, 2015 and 2014 were as follows:
December 31, | |||||||
2015 | 2014 | ||||||
Costs incurred on uncompleted contracts | $ | 1,392.8 | $ | 1,424.9 | |||
Estimated earnings to date | 324.2 | 324.1 | |||||
1,717.0 | 1,749.0 | ||||||
Less: Billings to date | (1,682.5 | ) | (1,691.8 | ) | |||
Net costs and estimated earnings in excess of billings | $ | 34.5 | $ | 57.2 | |||
46
SPX FLOW, INC. AND SUBSIDIARIES
NOTES TO CONSOLIDATED AND COMBINED FINANCIAL STATEMENTS (CONTINUED)
(in millions, except share data)
These amounts are included in the accompanying consolidated and combined balance sheets at December 31, 2015 and 2014 as shown below. Amounts for billed retainages and receivables to be collected in excess of one year are not significant for the periods presented.
December 31, | |||||||
2015 | 2014 | ||||||
Costs and estimated earnings in excess of billings(1) | $ | 87.4 | $ | 139.5 | |||
Billings in excess of costs and estimated earnings on uncompleted contracts(2) | (52.9 | ) | (82.3 | ) | |||
Net costs and estimated earnings in excess of billings | $ | 34.5 | $ | 57.2 | |||
(1) | Reported as a component of "Accounts receivable, net." |
(2) Reported as a component of "Accrued expenses."
Research and Development Costs—The Company conducts research and development activities for the purpose of developing and improving new products. The related expenditures are expensed as incurred and totaled $19.1, $19.8 and $17.7 in 2015, 2014 and 2013, respectively, and are classified within selling, general and administrative expense within the consolidated and combined statements of operations.
Property, Plant and Equipment—Property, plant and equipment ("PP&E") is stated at cost, less accumulated depreciation. We use the straight-line method for computing depreciation expense over the useful lives of PP&E, which do not exceed 40 years for buildings and range from 3 to 15 years for machinery and equipment. Depreciation expense, including amortization of capital leases, was $38.5, $39.7 and $42.7 for the years ended December 31, 2015, 2014 and 2013, respectively. Leasehold improvements are amortized over the life of the related asset or the life of the lease, whichever is shorter.
Impairments of PP&E, which represent non-cash asset write-downs, typically arise from business restructuring decisions that lead to the disposition of assets no longer required in the restructured business. For these situations, we recognize a loss when the carrying amount of an asset exceeds the sum of the undiscounted cash flows expected to result from the use and eventual disposition of the asset. Fair values for assets subject to impairment testing are determined primarily by management, taking into consideration various factors including third-party appraisals, quoted market prices and previous experience. If an asset remains in service at the decision date, the asset is written down to its fair value, if impaired, and the net book value is depreciated over its remaining economic useful life. When we commit to a plan to sell an asset, including the initiation of a plan to locate a buyer, and it is probable that the asset will be sold within one year based on its current condition and sales price, depreciation of the asset is discontinued and the asset is classified as an asset held for sale. In addition, the asset is written down to its fair value less any selling costs, if impaired.
Income Taxes—For purposes of our combined financial statements prior to the date of the Spin-Off, our income tax provision was determined as if we filed income tax returns on a stand-alone basis. The Company's tax results as presented in the consolidated and combined financial statements from periods prior to the Spin-Off may not be reflective of the results that the Company will generate in the future. In jurisdictions where the Company has been included in the tax returns filed by SPX or its subsidiaries that were not part of the Spin-Off, any income taxes payable resulting from the related income tax provision were reflected in the combined balance sheet as of December 31, 2014 and through the date of the Spin-Off within "Former parent company investment." Deferred income tax assets and liabilities, as presented in the consolidated and combined balance sheets, reflect the net tax effects of temporary differences between the carrying amounts of assets and liabilities for financial reporting purposes and the amounts used for income tax purposes. We periodically assess whether deferred tax assets will be realized and the adequacy of deferred tax liabilities, including the results of local, state, federal or foreign statutory tax audits or estimates and judgments used.
Derivative Financial Instruments—We use foreign currency forward contracts to manage our exposures to fluctuating currency exchange rates. Derivatives are recorded on the balance sheet and measured at fair value. For derivatives designated as hedges of the fair value of assets or liabilities, the changes in fair values of both the derivatives and the hedged items are recorded in current earnings. For derivatives designated as cash flow hedges, the effective portion of the changes in fair value of the derivatives is recorded in accumulated other comprehensive loss ("AOCL") and subsequently recognized in earnings when the hedged items impact earnings. Changes in the fair value of derivatives not designated as hedges, and the ineffective portion of cash flow hedges, are recorded in current earnings. We do not enter into financial instruments for speculative or trading purposes.
47
SPX FLOW, INC. AND SUBSIDIARIES
NOTES TO CONSOLIDATED AND COMBINED FINANCIAL STATEMENTS (CONTINUED)
(in millions, except share data)
For those transactions that are designated as cash flow hedges, on the date the derivative contract is entered into, we document our hedge relationship, including identification of the hedging instruments and the hedged items, as well as our risk management objectives and strategies for undertaking the hedge transaction. We also assess, both at inception and quarterly thereafter, whether such derivatives are highly effective in offsetting changes in the fair value of the hedged item. See Notes 11 and 14 for further information.
Cash flows from hedging activities are included in the same category as the items being hedged, which are primarily operating activities.
Former Parent Company Investment—Former parent company investment in the combined balance sheet as of December 31, 2014 represents SPX's historical investment in us, our accumulated net earnings after taxes and the net effect of the transactions with and allocations from SPX. See "Basis of Presentation" above and Note 15 for additional information.
Goodwill and Other Intangible Assets—Consistent with the requirements of the Intangible—Goodwill and Other Topic of the Codification, the fair values of our reporting units generally are estimated using discounted cash flow projections that we believe to be reasonable under current and forecasted circumstances, the results of which form the basis for making judgments about the recoverability of carrying values of the net assets of our reporting units. Other considerations are also incorporated, including comparable industry price multiples. The financial results of our businesses closely follow changes in the industries and end markets that they serve. Accordingly, we consider estimates and judgments that affect the future cash flow projections, including principal methods of competition such as volume, price, service, product performance and technical innovations and estimates associated with cost improvement initiatives, capacity utilization and assumptions for inflation and foreign currency changes. Any significant change in market conditions and estimates or judgments used to determine expected future cash flows that indicate a reduction in carrying value may give rise to impairment in the period that the change becomes known.
We perform our annual goodwill impairment testing during the fourth quarter in conjunction with our annual financial planning process, with such testing based primarily on events and circumstances existing as of the end of the third quarter. In addition, we test goodwill for impairment on a more frequent basis if there are indications of potential impairment.
We perform our annual trademarks impairment testing during the fourth quarter in conjunction with our annual financial planning process, or on a more frequent basis if there are indications of potential impairment. The fair values of our trademarks are determined by applying estimated royalty rates to projected revenues, with the resulting cash flows discounted at a rate of return that reflects current market conditions. The basis for these projected revenues is the annual operating plan for each of the related businesses.
Investments in Unconsolidated Companies—Investments in unconsolidated companies where we exercise significant influence but do not have control are accounted for using the equity method. In determining whether we are the primary beneficiary of a variable interest entity ("VIE"), we perform a qualitative analysis that considers the design of the VIE, the nature of our involvement and the variable interests held by other parties to determine which party has the power to direct the activities of the VIE that most significantly impact the entity's economic performance, and which party has the obligation to absorb losses or the right to receive benefits that could potentially be significant to the VIE. We have interests in VIEs, primarily joint ventures, in which we are the primary beneficiary. The financial position, results of operations and cash flows of our VIEs are not material, individually or in the aggregate, in relation to our consolidated and combined financial statements.
(2) USE OF ESTIMATES
The preparation of our consolidated and combined financial statements in conformity with GAAP requires us to make estimates and assumptions. These estimates and assumptions affect the reported amounts of assets and liabilities, the disclosure of contingent assets and liabilities at the date of the consolidated and combined financial statements, and the reported amounts of revenues (e.g., our percentage-of-completion estimates described above) and expenses during the reporting period. We evaluate these estimates and judgments on an ongoing basis and base our estimates on experience, current and expected future conditions, third-party evaluations and various other assumptions that we believe are reasonable under the circumstances. The results of these estimates form the basis for making judgments about the carrying values of assets and liabilities as well as identifying and assessing the accounting treatment with respect to commitments and contingencies. Actual results may differ from the estimates and assumptions used in the consolidated and combined financial statements and related notes.
Listed below are certain significant estimates and assumptions used in the preparation of our consolidated and combined financial statements. Certain other estimates and assumptions are further explained in the related notes.
48
SPX FLOW, INC. AND SUBSIDIARIES
NOTES TO CONSOLIDATED AND COMBINED FINANCIAL STATEMENTS (CONTINUED)
(in millions, except share data)
Accounts Receivable Allowances—We provide allowances for estimated losses on uncollectible accounts based on our historical experience and the evaluation of the likelihood of success in collecting specific customer receivables. In addition, we maintain allowances for customer returns, discounts and invoice pricing discrepancies, with such allowances primarily based on historical experience. Summarized below is the activity for these allowance accounts.
Year ended December 31, | |||||||||||
2015 | 2014 | 2013 | |||||||||
Balance at beginning of year | $ | 22.0 | $ | 21.7 | $ | 23.3 | |||||
Allowances provided | 15.6 | 14.7 | 12.0 | ||||||||
Write-offs, net of recoveries, credits issued and other | (14.0 | ) | (14.4 | ) | (13.6 | ) | |||||
Balance at end of year | $ | 23.6 | $ | 22.0 | $ | 21.7 | |||||
Inventory—We estimate losses for excess and/or obsolete inventory and the net realizable value of inventory based on the aging and historical utilization of the inventory and the evaluation of the likelihood of recovering the inventory costs based on anticipated demand and selling price.
Long-Lived Assets and Intangible Assets Subject to Amortization—We continually review whether events and circumstances subsequent to the acquisition of any long-lived assets, or intangible assets subject to amortization, have occurred that indicate the remaining estimated useful lives of those assets may warrant revision or that the remaining balance of those assets may not be fully recoverable. If events and circumstances indicate that the long-lived assets should be reviewed for possible impairment, we use projections to assess whether future cash flows on an undiscounted basis related to the assets are likely to exceed the related carrying amount. We will record an impairment charge to the extent that the carrying value of the assets exceed their fair values as determined by valuation techniques appropriate in the circumstances, which could include the use of similar projections on a discounted basis.
In determining the estimated useful lives of definite-lived intangibles, we consider the nature, competitive position, life cycle position, and historical and expected future operating cash flows of each acquired asset, as well as our commitment to support these assets through continued investment and legal infringement protection.
Goodwill and Indefinite-Lived Intangible Assets—We test goodwill and indefinite-lived intangible assets for impairment annually during the fourth quarter and continually assess whether a triggering event has occurred to determine whether the carrying value exceeds the implied fair value. The fair value of reporting units is based generally on discounted projected cash flows, but we also consider factors such as comparable industry price multiples. We employ cash flow projections that we believe to be reasonable under current and forecasted circumstances, the results of which form the basis for making judgments about the carrying values of the reported net assets of our reporting units. The financial results of many of our businesses closely follow changes in the industries and end markets that they serve. Accordingly, we consider estimates and judgments that affect the future cash flow projections, including principal methods of competition, such as volume, price, service, product performance and technical innovations, as well as estimates associated with cost reduction initiatives, capacity utilization and assumptions for inflation and foreign currency changes. Actual results may differ from these estimates under different assumptions or conditions. See Note 7 for further information, including discussion of impairment charges recorded in 2015, 2014 and 2013, and an interim impairment test in the fourth quarter of 2015.
Accrued Expenses—We make estimates and judgments in establishing accruals as required under GAAP. Summarized in the table below are the components of accrued expenses at December 31, 2015 and 2014.
December 31, | |||||||
2015 | 2014 | ||||||
Unearned revenue(1) | $ | 155.8 | $ | 203.9 | |||
Employee benefits | 172.6 | 95.4 | |||||
Warranty | 14.0 | 17.4 | |||||
Other(2) | 124.9 | 109.4 | |||||
Total | $ | 467.3 | $ | 426.1 | |||
49
SPX FLOW, INC. AND SUBSIDIARIES
NOTES TO CONSOLIDATED AND COMBINED FINANCIAL STATEMENTS (CONTINUED)
(in millions, except share data)
(1) | Unearned revenue includes billings in excess of costs and estimated earnings on uncompleted contracts accounted for under the percentage-of-completion method of revenue recognition, customer deposits and unearned amounts on service contracts. |
(2) | Other consists of various items including, among other items, accrued commissions, accrued sales and value-added taxes, and accruals for restructuring, interest and freight costs. |
Legal—It is our policy to accrue for estimated losses from legal actions or claims when events exist that make the realization of the losses probable and they can be reasonably estimated. We do not discount legal obligations or reduce them by anticipated insurance recoveries.
Environmental Remediation Costs—We expense costs incurred to investigate and remediate environmental issues unless they extend the economic useful lives of related assets. We record liabilities when it is probable that an obligation has been incurred and the amounts can be reasonably estimated. Our environmental accruals cover anticipated costs, including investigation, remediation and operation and maintenance of clean-up sites. Our estimates are based primarily on investigations and remediation plans established by independent consultants, regulatory agencies and potentially responsible third parties. We generally do not discount environmental obligations or reduce them by anticipated insurance recoveries.
Self-Insurance—SPX is self-insured for certain of its workers' compensation, automobile, product, general liability, disability and health costs and, thus, records an accrual for its retained liability. SPX's businesses, including the business units of the Company, were charged directly for their estimated share of the cost of these self-insured programs prior to the Spin-Off, with the Company's share of the cost included in our consolidated and combined statements of operations for such periods. In addition, the Company's estimated share of SPX's retained liability for these programs was reflected in our combined balance sheet as of December 31, 2014 within "Accrued expenses." SPX FLOW is self-insured for such costs and the Company's liability for these programs is reflected in our consolidated balance sheet as of December 31, 2015 within "Accrued expenses."
Warranty—In the normal course of business, we issue product warranties for specific products and provide for the estimated future warranty cost in the period in which the sale is recorded. We provide for the estimate of warranty cost based on contract terms and historical warranty loss experience that is periodically adjusted for recent actual experience. Because warranty estimates are forecasts that are based on the best available information, actual claims costs may differ from amounts provided. In addition, due to the seasonal fluctuations at certain of our businesses, the timing of warranty provisions and the usage of warranty accruals can vary period to period. We make adjustments to initial obligations for warranties as changes in the obligations become reasonably estimable. The following is an analysis of our product warranty accrual for the periods presented:
Year ended December 31, | |||||||||||
2015 | 2014 | 2013 | |||||||||
Balance at beginning of year | $ | 18.4 | $ | 20.4 | $ | 23.2 | |||||
Provisions | 10.3 | 13.5 | 8.1 | ||||||||
Usage | (12.6 | ) | (14.2 | ) | (10.8 | ) | |||||
Currency translation adjustment | (1.3 | ) | (1.3 | ) | (0.1 | ) | |||||
Balance at end of year | 14.8 | 18.4 | 20.4 | ||||||||
Less: Current portion of warranty | 14.0 | 17.4 | 20.2 | ||||||||
Non-current portion of warranty | $ | 0.8 | $ | 1.0 | $ | 0.2 | |||||
Income Taxes—We review our income tax positions on a continuous basis and accrue for potential uncertain tax positions in accordance with the Income Taxes Topic of the Codification. Accruals for these uncertain tax positions are classified as "Deferred and other income taxes" in the accompanying consolidated and combined balance sheets based on an expectation as to the timing of when the matter will be resolved. As events change or resolutions occur, these accruals are adjusted, such as in the case of audit settlements with taxing authorities. For tax positions where it is more likely than not that a tax benefit will be sustained, we record the largest amount of tax benefit with a greater than 50% likelihood of being realized upon ultimate settlement with a taxing authority, assuming such authority has full knowledge of all relevant information. These reviews also entail analyzing the realization of deferred tax assets. We establish a valuation allowance against deferred tax assets when, based on all available evidence, we believe that it is more likely than not that we will not realize a benefit associated with such assets.
Employee Benefit Plans—Certain of our employees participate in defined benefit pension and other postretirement plans we sponsor and, prior to the date of the Spin-Off, participated in plans sponsored by SPX. The expense for these plans is derived from an actuarial calculation based on the plans' provisions and assumptions regarding discount rates and rates of increase
50
SPX FLOW, INC. AND SUBSIDIARIES
NOTES TO CONSOLIDATED AND COMBINED FINANCIAL STATEMENTS (CONTINUED)
(in millions, except share data)
in compensation levels. Discount rates for most of the plans are based on representative bond indices. Rates of increase in compensation levels are established based on expectations of current and foreseeable future increases in compensation. Independent actuaries are consulted in determining these assumptions. See Note 8 for further discussion of our accounting for pension and postretirement benefits.
(3) NEW ACCOUNTING PRONOUNCEMENTS
The following is a summary of new accounting pronouncements that apply or may apply to our business.
In May 2014, the Financial Accounting Standards Board (the "FASB") issued a new standard on revenue recognition that outlines a single comprehensive model for entities to use in accounting for revenue arising from contracts with customers and supersedes most current revenue recognition guidance, including industry-specific guidance. The new standard requires a number of disclosures intended to enable users of financial statements to understand the nature, amount, timing and uncertainty of revenue, and the related cash flows. The standard is effective for interim and annual reporting periods beginning after December 15, 2017. We are currently evaluating the effect that this new standard will have on our consolidated and combined financial statements.
In April 2015, the FASB issued a new standard that requires debt issuance costs related to a recognized debt liability to be reported in the balance sheet as a direct deduction from the carrying amount of that debt liability, consistent with debt discounts. The standard is effective for interim and annual reporting periods beginning after December 15, 2015, and shall be applied retrospectively. We do not expect the adoption of this standard to have a material impact on our consolidated and combined financial statements.
In April 2015, the FASB issued an amendment to existing guidance that, among other changes, permits an entity that has a significant event in an interim period that requires a remeasurement of defined benefit plan assets and obligations to remeasure such assets and obligations using the month-end date that is closest to the date of the significant event, rather than the date of the plan event. Although earlier application is permitted, the amendment is effective for interim and annual reporting periods beginning after December 15, 2015, and shall be applied prospectively. The impact of the adoption of this amendment on our consolidated and combined financial statements will be based on any future significant events of our defined benefit plans.
In November 2015, the FASB issued an amendment to existing guidance that eliminates the current requirement for an entity to separate deferred income tax assets and liabilities into current and non-current amounts on the balance sheet. To simplify the presentation of deferred income taxes, this amendment requires that deferred tax assets and liabilities be classified as non-current amounts. We early adopted this amendment effective December 31, 2015 without retrospective application to prior periods.
(4) INFORMATION ON REPORTABLE SEGMENTS, CORPORATE EXPENSE AND OTHER
We are a global supplier of highly specialized, engineered solutions with operations in over 35 countries and sales in over 150 countries around the world. Many of our solutions play a role in helping to meet global demand for processed foods and beverages and power and energy, particularly in emerging markets. In 2015, an estimated 29% of our revenues were from sales into emerging markets.
We have three reportable segments: Food and Beverage, Power and Energy, and Industrial. In determining our segments, we apply the threshold criteria of the Segment Reporting Topic of the Codification to operating income or loss of each segment before considering impairment and special charges, pension and postretirement expense/income, stock-based compensation and other indirect corporate expenses. This is consistent with the way our chief operating decision maker evaluates the results of each segment.
Revenues by reportable segment and geographic area represent sales to unaffiliated customers, and no one customer or group of customers that, to our knowledge, are under common control accounted for more than 10% of our consolidated and combined revenues for any period presented. Intercompany revenues among our reportable segments are not significant. Identifiable assets by reportable segment are those used in the respective operations of each.
51
SPX FLOW, INC. AND SUBSIDIARIES
NOTES TO CONSOLIDATED AND COMBINED FINANCIAL STATEMENTS (CONTINUED)
(in millions, except share data)
Food and Beverage
The Food and Beverage reportable segment operates in a regulated, global industry with customers who demand highly engineered, turn-key solutions. Key demand drivers include dairy consumption, emerging market capacity expansion, sustainability and productivity initiatives, customer product innovation and food safety. Key products for the segment include mixing, drying, evaporation and separation systems and components, heat exchangers, and reciprocating and centrifugal pump technologies. Our core brands include Anhydro, APV, Bran+Luebbe, Gerstenberg Schroeder, LIGHTNIN, Seital, and Waukesha Cherry-Burrell.
Power and Energy
The Power and Energy reportable segment primarily serves customers in the oil and gas industry and, to a lesser extent, the nuclear and other conventional power industries. A large portion of the segment's revenues are concentrated in oil extraction, production and transportation at existing wells and pipeline applications. The underlying drivers of this segment include demand for power and energy. Key products for the segment include pumps, valves and related accessories, while the core brands include APV, Bran+Luebbe, ClydeUnion Pumps, Copes-Vulcan, Dollinger Filtration, LIGHTNIN, M&J Valve, Plenty, and Vokes.
Industrial
The Industrial reportable segment primarily serves customers in the chemical, air treatment, mining, pharmaceutical, marine, shipbuilding, infrastructure construction, general industrial and water treatment industries. Key demand drivers of this segment are tied to macroeconomic conditions and growth in the respective end markets we serve. Key products for the segment are air dryers, filtration equipment, mixers, pumps, hydraulic technologies and heat exchangers. Core brands include Airpel, APV, Bolting Systems, Delair, Deltech, Hankison, Jemaco, Johnson Pump, LIGHTNIN, Power Team, and Stone.
Corporate Expense
Corporate expense generally relates to the cost of our Charlotte, NC corporate headquarters and our Asia Pacific center in Shanghai, China for the period subsequent to the Spin-Off, and includes allocations of the cost of corporate functions and/or resources provided by SPX prior to the Spin-Off. See Note 1 for a discussion of the methodology used to allocate corporate-related costs prior to the Spin-Off.
52
SPX FLOW, INC. AND SUBSIDIARIES
NOTES TO CONSOLIDATED AND COMBINED FINANCIAL STATEMENTS (CONTINUED)
(in millions, except share data)
Financial data for our reportable segments as of or for the years ended December 31, 2015, 2014 and 2013 were as follows:
As of or for the Year Ended December 31, | |||||||||||
2015 | 2014 | 2013 | |||||||||
Revenues: | |||||||||||
Food and Beverage | $ | 886.3 | $ | 968.9 | $ | 970.0 | |||||
Power and Energy | 723.0 | 961.6 | 997.5 | ||||||||
Industrial | 779.2 | 839.1 | 837.3 | ||||||||
Total revenues | $ | 2,388.5 | $ | 2,769.6 | $ | 2,804.8 | |||||
Income: | |||||||||||
Food and Beverage | $ | 106.9 | $ | 99.3 | $ | 90.4 | |||||
Power and Energy | 87.5 | 168.7 | 127.4 | ||||||||
Industrial | 107.3 | 123.0 | 119.3 | ||||||||
Total income for reportable segments | 301.7 | 391.0 | 337.1 | ||||||||
Corporate expense | 54.3 | 58.3 | 59.8 | ||||||||
Stock-based compensation expense | 25.8 | 20.0 | 17.4 | ||||||||
Pension and postretirement expense | 10.8 | 32.2 | 8.0 | ||||||||
Impairment of intangible assets | 22.7 | 11.7 | 4.7 | ||||||||
Special charges, net | 42.6 | 14.2 | 16.0 | ||||||||
Consolidated and combined operating income | $ | 145.5 | $ | 254.6 | $ | 231.2 | |||||
Capital expenditures: | |||||||||||
Food and Beverage | $ | 24.5 | $ | 12.8 | $ | 7.3 | |||||
Power and Energy | 19.1 | 16.3 | 7.3 | ||||||||
Industrial | 5.1 | 6.9 | 7.6 | ||||||||
Other(1) | 8.3 | 4.7 | 1.2 | ||||||||
Total capital expenditures | $ | 57.0 | $ | 40.7 | $ | 23.4 | |||||
Depreciation and amortization: | |||||||||||
Food and Beverage | $ | 17.3 | $ | 21.6 | $ | 20.8 | |||||
Power and Energy | 27.9 | 29.7 | 32.2 | ||||||||
Industrial | 14.0 | 14.2 | 16.4 | ||||||||
Other(1) | 2.7 | 0.3 | 0.5 | ||||||||
Total depreciation and amortization | $ | 61.9 | $ | 65.8 | $ | 69.9 | |||||
Identifiable assets: | |||||||||||
Food and Beverage | $ | 925.0 | $ | 969.6 | $ | 1,122.4 | |||||
Power and Energy | 1,455.0 | 1,567.8 | 1,736.5 | ||||||||
Industrial | 638.7 | 662.5 | 724.9 | ||||||||
Other(2) | 290.7 | 828.2 | 906.9 | ||||||||
Total identifiable assets | $ | 3,309.4 | $ | 4,028.1 | $ | 4,490.7 | |||||
Geographic areas: | |||||||||||
Revenues(3): | |||||||||||
United States | $ | 836.5 | $ | 933.9 | $ | 933.9 | |||||
United Kingdom | 316.5 | 417.5 | 482.7 | ||||||||
China | 140.1 | 137.5 | 152.1 | ||||||||
France | 136.3 | 176.8 | 155.3 | ||||||||
Germany | 119.0 | 140.7 | 130.5 | ||||||||
Denmark | 116.0 | 185.4 | 204.1 | ||||||||
Other | 724.1 | 777.8 | 746.2 | ||||||||
Total revenues | $ | 2,388.5 | $ | 2,769.6 | $ | 2,804.8 | |||||
53
SPX FLOW, INC. AND SUBSIDIARIES
NOTES TO CONSOLIDATED AND COMBINED FINANCIAL STATEMENTS (CONTINUED)
(in millions, except share data)
As of or for the Year Ended December 31, | |||||||||||
2015 | 2014 | 2013 | |||||||||
Tangible long-lived assets: | |||||||||||
United States | $ | 312.7 | $ | 119.0 | $ | 108.3 | |||||
Other | 236.5 | 217.6 | 285.3 | ||||||||
Total tangible long-lived assets | $ | 549.2 | $ | 336.6 | $ | 393.6 | |||||
(1) | Relates to corporate PP&E or PP&E that is utilized by all of our reportable segments along with related depreciation expense. |
(2) | Relates primarily to assets (e.g., cash and PP&E at December 31, 2015, and cash and related party notes receivable at December 31, 2014 and 2013) of the corporate subsidiaries that are included in these consolidated and combined financial statements. |
(3) | Revenues are included in the above geographic areas based on the country that recorded the customer revenue. |
(5) SPECIAL CHARGES, NET
As part of our business strategy, we periodically right-size and consolidate operations to improve long-term results. Additionally, from time to time, we alter our business model to better serve customer demand, discontinue lower-margin product lines and rationalize and consolidate manufacturing capacity. Our restructuring and integration decisions are based, in part, on discounted cash flows and are designed to achieve our goals of reducing structural footprint and maximizing profitability. As a result of our strategic review process, we recorded net special charges of $42.6, $14.2 and $16.0 in 2015, 2014 and 2013, respectively. These net special charges were primarily related to restructuring initiatives to consolidate manufacturing and sales facilities, reduce workforce, and rationalize certain product lines, as well as tangible asset impairment charges.
The components of the charges have been computed based on expected cash payouts, including severance and other employee benefits based on existing severance policies, local laws, and other estimated exit costs, and our estimate of the realizable value of the affected tangible and intangible assets.
Liabilities for exit costs including, among other things, severance, other employee benefit costs, and operating lease obligations on idle facilities, are measured initially at their fair value and recorded when incurred.
With the exception of certain multi-year operating lease obligations and other contractual obligations, which are not material to our consolidated and combined financial statements, we anticipate that liabilities related to restructuring actions as of December 31, 2015 will be paid within one year from the period in which the action was initiated.
Special charges for the years ended December 31, 2015, 2014 and 2013 are described in more detail below and in the applicable sections that follow:
Year ended December 31, | |||||||||||
2015 | 2014 | 2013 | |||||||||
Employee termination costs | $ | 38.5 | $ | 11.6 | $ | 13.5 | |||||
Facility consolidation costs | 2.5 | 0.6 | 1.0 | ||||||||
Other cash costs (recoveries), net | — | 0.5 | (0.2 | ) | |||||||
Non-cash asset write-downs | 1.6 | 1.5 | 1.7 | ||||||||
Total | $ | 42.6 | $ | 14.2 | $ | 16.0 | |||||
2015 Charges:
Employee Termination Costs | Facility Consolidation Costs | Other Cash Costs (Recoveries), Net | Non-Cash Asset Write-downs | Total Special Charges | |||||||||||||||
Food and Beverage | $ | 25.1 | $ | 0.3 | $ | 0.1 | $ | 0.3 | $ | 25.8 | |||||||||
Power and Energy | 7.8 | 0.3 | (0.1 | ) | 0.1 | 8.1 | |||||||||||||
Industrial | 3.4 | 1.9 | — | 0.7 | 6.0 | ||||||||||||||
Other | 2.2 | — | — | 0.5 | 2.7 | ||||||||||||||
Total | $ | 38.5 | $ | 2.5 | $ | — | $ | 1.6 | $ | 42.6 | |||||||||
54
SPX FLOW, INC. AND SUBSIDIARIES
NOTES TO CONSOLIDATED AND COMBINED FINANCIAL STATEMENTS (CONTINUED)
(in millions, except share data)
Food and Beverage—Charges for 2015 related primarily to severance and other costs associated with (i) the ongoing consolidation and relocation of a manufacturing facility in Germany to an existing facility in Poland and, to a much lesser extent, (ii) restructuring initiatives in South America and the U.S. Once completed, these restructuring activities are expected to result in the termination of approximately 250 employees. Charges for 2015 also included asset impairment charges of $0.3 related to certain tangible long-lived assets.
Power and Energy—Charges for 2015 related primarily to severance and other costs associated with actions taken to (i) reduce the cost base of the segment in response to oil price declines that began in the latter half of 2014 and have continued throughout 2015, which has resulted in a reduction in capital spending by our customers in the oil and gas industries, and (ii) realign certain sites around core service markets. Once completed, these restructuring activities are expected to result in the termination of approximately 90 employees. Charges for 2015 also included asset impairment charges of $0.1 related to certain tangible long-lived assets.
Industrial—Charges for 2015 related primarily to severance and other costs associated with (i) the ongoing consolidation and relocation of a manufacturing facility in Denmark to an existing facility in Poland and (ii) a reorganization of the commercial and operational structure of certain of the segment's business in Europe and the U.S. Once completed, these restructuring activities are expected to result in the termination of approximately 180 employees. Charges for 2015 also included asset impairment charges of $0.7 related to certain tangible long-lived assets.
Other—Charges for 2015 related primarily to (i) a restructuring of the Company's corporate development function subsequent to the Spin-Off and (ii) an allocation of special charges associated with SPX's corporate functions and activities prior to the Spin-Off. Charges for 2015 also included asset impairment charges of $0.5 related to certain information technology assets. See Note 1 for a discussion of the methodology used to allocate corporate-related costs prior to the Spin-Off.
Expected charges still to be incurred under actions approved as of December 31, 2015 are approximately $15.4.
2014 Charges:
Employee Termination Costs | Facility Consolidation Costs | Other Cash Costs (Recoveries), Net | Non-Cash Asset Write-downs | Total Special Charges | |||||||||||||||
Food and Beverage | $ | 3.4 | $ | 0.5 | $ | — | $ | 0.7 | $ | 4.6 | |||||||||
Power and Energy | 5.7 | — | 0.8 | 0.8 | 7.3 | ||||||||||||||
Industrial | 1.6 | 0.1 | (0.3 | ) | — | 1.4 | |||||||||||||
Other | 0.9 | — | — | — | 0.9 | ||||||||||||||
Total | $ | 11.6 | $ | 0.6 | $ | 0.5 | $ | 1.5 | $ | 14.2 | |||||||||
Food and Beverage—Charges for 2014 related primarily to severance and other costs associated with the reorganization of the segment's commercial organization in Europe, which resulted in the termination of 25 employees. Charges for 2014 also included asset impairment charges of $0.7 related to certain tangible long-lived assets.
Power and Energy—Charges for 2014 related primarily to severance and other costs associated with restructuring initiatives at various locations in Europe and the U.S. These actions were taken primarily to reduce the cost base of Clyde Union, as we continued to integrate this business into the segment, and resulted in the termination of 49 employees. Charges for 2014 also included asset impairment charges of $0.8 related to certain Clyde Union tangible long-lived assets in the U.S.
Industrial—Charges for 2014 related primarily to severance and other costs associated with the reorganization of the Johnson Pump management structure in Europe, as well as facility consolidation in the U.S., and resulted in the termination of 26 employees.
Other—Charges for 2014 related primarily to an allocation of special charges associated with SPX's corporate functions and activities. See Note 1 for a discussion of the methodology used to allocate corporate-related costs prior to the Spin-Off.
55
SPX FLOW, INC. AND SUBSIDIARIES
NOTES TO CONSOLIDATED AND COMBINED FINANCIAL STATEMENTS (CONTINUED)
(in millions, except share data)
2013 Charges:
Employee Termination Costs | Facility Consolidation Costs | Other Cash Costs (Recoveries), Net | Non-Cash Asset Write-downs | Total Special Charges | |||||||||||||||
Food and Beverage | $ | 2.6 | $ | — | $ | (0.3 | ) | $ | 0.7 | $ | 3.0 | ||||||||
Power and Energy | 8.0 | 0.5 | — | 0.9 | 9.4 | ||||||||||||||
Industrial | 1.4 | 0.5 | — | 0.1 | 2.0 | ||||||||||||||
Other | 1.5 | — | 0.1 | — | 1.6 | ||||||||||||||
Total | $ | 13.5 | $ | 1.0 | $ | (0.2 | ) | $ | 1.7 | $ | 16.0 | ||||||||
Food and Beverage—Charges for 2013 related primarily to severance and other costs associated with the operational realignment of the segment's reporting structure which resulted in the termination of 43 employees. Charges for 2013 also included asset impairment charges of $0.7 related to the exit of facilities in Denmark and the U.K.
Power and Energy—Charges for 2013 related primarily to severance and other costs associated with restructuring initiatives at various locations in Europe and the U.S. These actions were taken primarily to reduce the cost base of Clyde Union, as we continued to integrate the business into the segment. These activities resulted in the termination of 416 employees. Charges for 2013 also included asset impairment charges of $0.9 related to the exit of a Clyde Union facility in the U.S.
Industrial—Charges for 2013 related primarily to severance and other costs associated with restructuring initiatives at various locations in Europe and Asia Pacific, as well as the closure of a facility in the U.S. These activities resulted in the termination of 30 employees.
Other—Charges for 2013 related primarily to severance costs incurred in connection with the consolidation of certain overhead support functions that were dedicated to the Company's operations and an allocation of special charges associated with SPX's corporate functions and activities. See Note 1 for a discussion of the methodology used to allocate corporate-related costs prior to the Spin-Off.
The following is an analysis of our restructuring liabilities for the years ended December 31, 2015, 2014 and 2013:
December 31, | |||||||||||
2015 | 2014 | 2013 | |||||||||
Balance at beginning of year | $ | 9.2 | $ | 10.1 | $ | 10.4 | |||||
Special charges (1) | 41.0 | 12.7 | 14.3 | ||||||||
Utilization — cash | (14.3 | ) | (13.6 | ) | (14.4 | ) | |||||
Currency translation adjustment and other | (3.0 | ) | — | (0.2 | ) | ||||||
Balance at end of year | $ | 32.9 | $ | 9.2 | $ | 10.1 | |||||
(1) | The years ended December 31, 2015, 2014 and 2013 excluded $1.6, $1.5 and $1.7, respectively, of asset impairment and non-cash charges allocated from SPX that impacted special charges but not the restructuring liabilities. |
(6) INVENTORIES, NET
Inventories at December 31, 2015 and 2014 comprised the following:
December 31, | |||||||
2015 | 2014 | ||||||
Finished goods | $ | 87.5 | $ | 98.2 | |||
Work in process | 88.8 | 99.1 | |||||
Raw materials and purchased parts | 135.2 | 140.5 | |||||
Total FIFO cost | 311.5 | 337.8 | |||||
Excess of FIFO cost over LIFO inventory value | (6.3 | ) | (7.8 | ) | |||
Total inventories | $ | 305.2 | $ | 330.0 | |||
56
SPX FLOW, INC. AND SUBSIDIARIES
NOTES TO CONSOLIDATED AND COMBINED FINANCIAL STATEMENTS (CONTINUED)
(in millions, except share data)
Inventories include material, labor and factory overhead costs and are reduced, when necessary, to estimated net realizable values. Certain domestic inventories are valued using the last-in, first-out (“LIFO”) method. These inventories were approximately 5% and 6% of total inventory at December 31, 2015 and 2014, respectively. Other inventories are valued using the first-in, first-out (“FIFO”) method.
(7) GOODWILL AND OTHER INTANGIBLE ASSETS
Goodwill
The changes in the carrying amount of goodwill, by reportable segment for the year ended December 31, 2015, were as follows:
December 31, 2014 | Goodwill Resulting from Business Combinations | Impairments | Foreign Currency Translation and Other | December 31, 2015 | |||||||||||||||
Food and Beverage | $ | 293.7 | $ | — | $ | — | $ | (23.8 | ) | $ | 269.9 | ||||||||
Power and Energy | 562.9 | — | — | (24.0 | ) | 538.9 | |||||||||||||
Industrial(1) | 224.4 | — | — | (9.8 | ) | 214.6 | |||||||||||||
Total | $ | 1,081.0 | $ | — | $ | — | $ | (57.6 | ) | $ | 1,023.4 | ||||||||
(1) The carrying amount of goodwill included $67.7 of accumulated impairments as of December 31, 2015 and 2014. | |||||||||||||||||||
The changes in the carrying amount of goodwill, by reportable segment for the year ended December 31, 2014, were as follows:
December 31, 2013 | Goodwill Resulting from Business Combinations | Impairments | Foreign Currency Translation and Other | December 31, 2014 | |||||||||||||||
Food and Beverage | $ | 326.1 | $ | — | $ | — | $ | (32.4 | ) | $ | 293.7 | ||||||||
Power and Energy | 595.0 | — | — | (32.1 | ) | 562.9 | |||||||||||||
Industrial(1) | 243.9 | — | — | (19.5 | ) | 224.4 | |||||||||||||
Total | $ | 1,165.0 | $ | — | $ | — | $ | (84.0 | ) | $ | 1,081.0 | ||||||||
(1) The carrying amount of goodwill included $67.7 of accumulated impairments as of December 31, 2014 and 2013. | |||||||||||||||||||
Consistent with our accounting policy stated in Note 1, we performed our annual goodwill impairment testing as of the first day of our fiscal fourth quarter of 2015, which indicated the estimated fair value of our Power and Energy reporting unit exceeded its carrying value by approximately 10%. The estimated fair value of each of our other reporting units significantly exceeded its respective book value.
Over the course of the fourth quarter, global oil prices continued to decline, resulting in delayed customer order patterns. Based on these slower order rates at the end of the fourth quarter, we lowered the 2016 forecasted revenue and profitability of our Power and Energy segment. The combination of adverse market conditions, lower order trends, and resultant impact to our 2016 forecast subsequent to our annual goodwill impairment test led management to conclude an interim impairment test of our Power and Energy reporting unit was necessary as of December 31, 2015.
The results of our interim goodwill impairment test indicated the estimated fair value of the Power and Energy reporting unit exceeded its carrying value by approximately 3%, while the carrying value of the Power and Energy segment goodwill was $538.9. Key assumptions included in our analysis were the following:
• | Fourth quarter 2015 order trends remain flat for the first half of 2016, with modest recovery in the second half of 2016. |
• | Targeted cost savings are executable in 2016, with resulting cash savings beginning before the end of 2016. |
• | A discount rate of 11% was applied to determine our income method fair values. |
57
SPX FLOW, INC. AND SUBSIDIARIES
NOTES TO CONSOLIDATED AND COMBINED FINANCIAL STATEMENTS (CONTINUED)
(in millions, except share data)
• | Current and forward EBITDA multiples remain consistent with oil and gas industry transactions observed over the prior twelve months. |
A change in any of the assumptions used in testing Power and Energy's goodwill for impairment (e.g., projected revenue and profit growth rates, discount rate, expected control premium, etc.) could result in Power and Energy's estimated fair value being less than the carrying value of its net assets. For example, a one-hundred basis point increase in the discount rate used in determining Power and Energy's discounted cash flows would result in Power and Energy's fair value being approximately $50 lower than the carrying value of its net assets.
Adverse changes to or a failure to achieve these business plans, further deterioration of macroeconomic conditions including oil remaining at historical lows into the second half of 2016, and/or significant declines in industry multiples could result in a future impairment.
Other Intangibles, Net
Identifiable intangible assets were as follows:
December 31, 2015 | December 31, 2014 | ||||||||||||||||||||||
Gross Carrying Value | Accumulated Amortization | Net Carrying Value | Gross Carrying Value | Accumulated Amortization | Net Carrying Value | ||||||||||||||||||
Intangible assets with determinable lives: | |||||||||||||||||||||||
Customer relationships | $ | 344.0 | $ | (94.1 | ) | $ | 249.9 | $ | 363.2 | $ | (83.5 | ) | $ | 279.7 | |||||||||
Technology | 122.1 | (38.0 | ) | 84.1 | 141.7 | (36.3 | ) | 105.4 | |||||||||||||||
Patents | 6.7 | (4.6 | ) | 2.1 | 6.8 | (4.3 | ) | 2.5 | |||||||||||||||
Other | 13.0 | (10.3 | ) | 2.7 | 14.4 | (10.8 | ) | 3.6 | |||||||||||||||
485.8 | (147.0 | ) | 338.8 | 526.1 | (134.9 | ) | 391.2 | ||||||||||||||||
Trademarks with indefinite lives | 240.6 | — | 240.6 | 268.1 | — | 268.1 | |||||||||||||||||
Total | $ | 726.4 | $ | (147.0 | ) | $ | 579.4 | $ | 794.2 | $ | (134.9 | ) | $ | 659.3 | |||||||||
Amortization expense was $23.4, $26.1 and $27.2 for the years ended December 31, 2015, 2014 and 2013, respectively. Estimated amortization expense related to these intangible assets is $22.8 in 2016, 2017, 2018, 2019, and 2020.
At December 31, 2015, the net carrying value of intangible assets with determinable lives consisted of the following by reportable segment: $241.7 in Power and Energy, $59.5 in Food and Beverage, and $37.6 in Industrial. Trademarks with indefinite lives consisted of the following by reportable segment: $105.9 in Food and Beverage, $74.0 in Power and Energy, and $60.7 in Industrial.
During 2015, we recorded an impairment charge of $15.0 related to trademarks of a business within our Power and Energy reportable segment primarily resulting from the impact of lower oil prices on the purchasing patterns of our customers in the oil and gas markets. During the third quarter of 2015, sequential orders in our Power and Energy segment declined nearly 20%, which reduced our estimates of future revenues. In the fourth quarter of 2015, we recorded an impairment charge of $7.7 related to certain technology assets and trademarks associated with a business in our Food and Beverage reportable segment. We estimated the fair value of our trademarks by applying estimated royalty rates to projected revenues, with the resulting cash flows discounted at a rate of return that reflects current market conditions. We determined the impairment for technology assets by comparing the future discounted cash flows associated with the technology assets to their carrying values. Other changes in the gross carrying values of trademarks and other identifiable intangible assets during 2015 relate to foreign currency translation.
During 2014, we recorded impairment charges of $7.3 and $4.4 related to the trademarks of certain businesses within our Power and Energy and Industrial reportable segments, respectively.
During 2013, we recorded impairment charges of $3.4 and $1.3 related to the trademarks of certain businesses within our Power and Energy and Food and Beverage reportable segments, respectively.
58
SPX FLOW, INC. AND SUBSIDIARIES
NOTES TO CONSOLIDATED AND COMBINED FINANCIAL STATEMENTS (CONTINUED)
(in millions, except share data)
(8) EMPLOYEE BENEFIT PLANS
Defined Benefit Plans
Overview—SPX FLOW sponsors a number of defined benefit pension plans and a postretirement plan. In addition, SPX sponsors defined benefit pension and postretirement plans. For all of these plans, changes in the fair value of plan assets and actuarial gains and losses are recognized to earnings in the fourth quarter of each year, unless earlier remeasurement is required. The remaining components of pension and postretirement expense, primarily service and interest costs and expected return on plan assets, are recorded on a quarterly basis.
Pension and postretirement expense includes net periodic benefit expense associated with defined benefit pension and postretirement plans we sponsor, as well as an allocation of a portion of the net periodic benefit expense associated with the plans sponsored by SPX in the periods prior to the Spin-Off.
Plans Sponsored by SPX FLOW—We sponsor defined benefit pension plans that cover certain employees in foreign countries, principally in Europe, and we assumed certain domestic nonqualified pension and postretirement obligations from SPX and formed a new domestic nonqualified pension plan in connection with the Spin-Off. The formation of the new domestic nonqualified pension plan resulted in the remeasurement of such obligations as of September 26, 2015 which resulted in recognition of an actuarial loss of $7.4 during 2015, recorded as a component of “Selling, general and administrative” expense in the accompanying consolidated and combined statements of operations.
Plans Sponsored by SPX—Certain of the Company’s U.S. and U.K. salaried and hourly paid employees participate in defined benefit pension plans and certain U.S. salaried and hourly paid employees participate in other postretirement benefit plans, such as health and life insurance plans, that are sponsored by SPX. Subsequent to the Spin-Off, SPX remained the sponsor of these plans. As such, liabilities associated with these plans have not been reflected in our consolidated and combined balance sheets. Our consolidated and combined statements of operations include expense allocations related to these plans for participants who are, or were, employees of the Company, as well as an allocation of expenses for SPX corporate personnel. The amount of net periodic benefit cost allocated to the Company related to the plans sponsored by SPX was $1.2, $22.8 and $3.0 for the years ended December 31, 2015, 2014 and 2013, respectively, and is reflected within "Selling, general and administrative" expense and, to a lesser extent, "Cost of products sold," in the consolidated and combined statements of operations. See Note 1 for a discussion of the methodology used to allocate corporate-related costs prior to the Spin-Off.
Clyde Union—Upon the acquisition of Clyde Union in December 2011, we assumed participation in a multiemployer benefit plan under the terms of a collective-bargaining agreement that covers Clyde Union’s domestic union-represented employees. The risks of participating in these multiemployer plans are different from single-employer plans in the following respects:
• | Assets contributed to the multiemployer plan by us may be used to provide benefits to employees of other participating employers; |
• | If a participating employer stops contributing to the plan, the unfunded obligations of the plan may be borne by the remaining participating employers; and |
• | If we choose to stop participating in the multiemployer plan, we may be required to pay an amount based on the underfunded status of the plan, referred to as a withdrawal liability. |
We participate in the following multiemployer benefit plan:
Pension Fund | EIN Pension Plan Number | Pension Protection Act Zone Status - 2015 | Financial Improvement Plan/Rehabilitation Plan Status Pending | 2015 Contributions | 2014 Contributions | Surcharge Imposed | Expiration Date of Collective Bargaining Agreement | |||||||
IAM | 51-6031295-002 | Green | No | $— | $0.1 | No | August 10, 2017 | |||||||
The contributions made by Clyde Union during 2015 and 2014 were not more than 5% of the total contributions made to the IAM National Pension Fund, National Pension Plan (‘‘IAM’’). In 2011, the IAM began applying an election for funding relief which allows the IAM to amortize the investment losses incurred for the plan year ended December 31, 2008 over a period
59
SPX FLOW, INC. AND SUBSIDIARIES
NOTES TO CONSOLIDATED AND COMBINED FINANCIAL STATEMENTS (CONTINUED)
(in millions, except share data)
of up to 29 years (as opposed to 15 years that would otherwise have been required). Furthermore, in accordance with the election, the current asset valuation method has been updated to recognize the investment losses incurred during the 2008 plan year over a ten-year period as opposed to the previous period of five years.
The plan year-end date for all our plans is December 31. Below is further discussion regarding our plans, including information on plan assets, employer contributions and benefit payments, obligations and funded status, and periodic pension and postretirement benefit expense.
Plan assets—Our investment strategy is based on the protection and long-term growth of principal while mitigating overall investment risk. Our foreign defined benefit pension plans’ assets, with fair values of $4.2 and $4.1 at December 31, 2015 and 2014, respectively, are invested in insurance contracts and classified as Level 3 assets in the fair value hierarchy. During 2015 and 2014, there were no transfers between levels of the fair value hierarchy for any of our plans, and no shares of SPX FLOW or SPX common stock were held by our defined benefit pension plans as of December 31, 2015 and 2014. Our domestic nonqualified pension and postretirement benefit plans are unfunded and have no plan assets.
Employer Contributions—Many of our foreign plan obligations are unfunded in accordance with local laws. These plans have no assets and instead are funded by us on a pay as you go basis in the form of direct benefit payments. In 2015, we made contributions of $0.2 to our foreign plans that are funded. In addition, we made direct benefit payments of $2.3 related to our foreign plans that are unfunded. Our domestic nonqualified pension and postretirement plans are funded by us on a pay as you go basis. There were no direct benefit payments related to these plans in 2015.
In 2016, we expect to make minimum required funding contributions of $0.2 and direct benefit payments of $2.2 to our foreign pension plans and direct benefit payments of $66.0 related to our domestic nonqualified pension and postretirement benefit plans. The direct benefit payments to our domestic nonqualified pension and postretirement benefit plans consist primarily of expected pension payments to certain former officers of the Company.
Estimated Future Benefit Payments—Following is a summary, as of December 31, 2015, of the estimated future benefit payments for our foreign and domestic pension plans and our domestic postretirement plan in each of the next five fiscal years and in the aggregate for five fiscal years thereafter. Benefit payments are paid from plan assets or directly by us for our unfunded plans.
Foreign Pension Benefits | Domestic Pension Benefits | Domestic Postretirement Benefits | |||||||||
2016 | $ | 2.2 | $ | 65.9 | $ | 0.1 | |||||
2017 | 2.6 | — | 0.1 | ||||||||
2018 | 2.7 | — | 0.1 | ||||||||
2019 | 2.6 | — | 0.1 | ||||||||
2020 | 2.8 | 6.5 | 0.1 | ||||||||
Subsequent five years | 12.6 | — | 0.6 | ||||||||
The expected future benefit payments for our plans are estimated based on the same assumptions used at December 31, 2015 to measure our obligations and include benefits attributable to estimated future employee service, to the extent applicable.
60
SPX FLOW, INC. AND SUBSIDIARIES
NOTES TO CONSOLIDATED AND COMBINED FINANCIAL STATEMENTS (CONTINUED)
(in millions, except share data)
Obligations and Funded Status—The funded status of our pension plans is dependent upon many factors, including returns on invested assets and the level of market interest rates. The following tables show the foreign pension plans’ funded status and amounts recognized in our consolidated and combined balance sheets:
Foreign Pension Plans | |||||||
2015 | 2014 | ||||||
Change in projected benefit obligation: | |||||||
Projected benefit obligation - beginning of year | $ | 59.4 | $ | 59.3 | |||
Service cost | 1.2 | 1.2 | |||||
Interest cost | 1.3 | 1.7 | |||||
Actuarial (gains) losses | (1.8 | ) | 6.7 | ||||
Plan amendment | — | (0.2 | ) | ||||
Benefits paid | (2.4 | ) | (2.9 | ) | |||
Foreign exchange and other | (6.1 | ) | (6.4 | ) | |||
Projected benefit obligation - end of year | $ | 51.6 | $ | 59.4 | |||
Foreign Pension Plans | |||||||
2015 | 2014 | ||||||
Change in plan assets: | |||||||
Fair value of plan assets - beginning of year | $ | 4.1 | $ | 4.2 | |||
Actual return on plan assets | 0.3 | 0.2 | |||||
Contributions (employer and employee) | 0.2 | 0.3 | |||||
Benefits paid | (0.1 | ) | (0.1 | ) | |||
Foreign exchange and other | (0.3 | ) | (0.5 | ) | |||
Fair value of plan assets - end of year | $ | 4.2 | $ | 4.1 | |||
Funded status at year-end | (47.4 | ) | (55.3 | ) | |||
Amounts recognized in the consolidated and combined balance sheets consist of: | |||||||
Accrued expenses | (2.0 | ) | (2.1 | ) | |||
Other long-term liabilities | (45.4 | ) | (53.2 | ) | |||
Net amount recognized | $ | (47.4 | ) | $ | (55.3 | ) | |
Amount recognized in accumulated other comprehensive loss (pre-tax) consists of net prior service credits | $ | — | $ | (0.1 | ) | ||
The funded status of the domestic nonqualified pension obligations we assumed from SPX in connection with the Spin-Off was ($73.9) as of December 31, 2015, with $64.9 and $9.0 of liabilities associated with this nonqualified, unfunded pension plan reflected within “Accrued expenses” and “Other long-term liabilities”, respectively, in the accompanying consolidated balance sheet as of December 31, 2015. The obligations of this plan totaled $72.2 as of September 26, 2015, and increased by $0.8, $0.5 and $0.9 due to service cost, interest cost, and actuarial losses recognized, respectively, during the fourth quarter of 2015, partially offset by recognition of a curtailment gain of $0.5 related to the termination of a former participant in this plan during the fourth quarter of 2015.
The funded status and accumulated benefit obligation of our domestic postretirement benefit plans were ($3.2) and ($5.8) at December 31, 2015 and 2014, respectively, with $0.1 and $0.4 recognized in "Accrued expenses," respectively, and $3.1 and $5.4 recognized in "Other long-term liabilities," respectively, in the accompanying consolidated and combined balance sheets at those dates.
The accumulated benefit obligation for each foreign pension plan exceeded the fair value of its plan assets at December 31, 2015 and 2014. The accumulated benefit obligation for all foreign pension plans was $48.3 and $56.2 at December 31, 2015 and 2014, respectively. The accumulated benefit obligation for the domestic nonqualified pension plan was $72.5 at December 31, 2015.
61
SPX FLOW, INC. AND SUBSIDIARIES
NOTES TO CONSOLIDATED AND COMBINED FINANCIAL STATEMENTS (CONTINUED)
(in millions, except share data)
Components of Net Periodic Pension and Postretirement Benefit Expense—Net periodic pension benefit expense for our foreign pension plans included the following components:
Year ended December 31, | |||||||||||
2015 | 2014 | 2013 | |||||||||
Service cost | $ | 1.2 | $ | 1.2 | $ | 1.1 | |||||
Interest cost | 1.3 | 1.7 | 1.8 | ||||||||
Expected return on plan assets | (0.1 | ) | (0.2 | ) | (0.1 | ) | |||||
Amortization of unrecognized prior service costs (credits) | (0.1 | ) | 0.1 | — | |||||||
Recognized net actuarial (gains) losses(1) | (2.0 | ) | 6.7 | 2.4 | |||||||
Total net periodic pension benefit expense | $ | 0.3 | $ | 9.5 | $ | 5.2 | |||||
(1) Consists of reported actuarial (gains) losses and the difference between actual and expected returns on plan assets. | |||||||||||
The net periodic pension benefit expense for the domestic nonqualified pension plan we assumed in connection with the Spin-Off was $9.1 for 2015, comprised of service cost of $0.8, interest cost of $0.5, and recognized net actuarial losses of $8.3, partially offset by recognition of a curtailment gain of $0.5 related to the termination of a former participant of this plan during the fourth quarter of 2015. Net periodic postretirement benefit (income) expense for our domestic postretirement plans was $0.2, ($0.1) and ($0.1) for the years ended December 31, 2015, 2014 and 2013, respectively.
Assumptions—Actuarial assumptions used in accounting for our foreign pension plans and, for the domestic nonqualified pension plan we assumed from SPX for the period since the Spin-Off, were as follows:
Year ended December 31, | |||||||||||
Foreign Pension Plans | Domestic Pension Plan | ||||||||||
2015 | 2014 | 2013 | 2015 | ||||||||
Weighted-average actuarial assumptions used in determining net periodic pension expense: | |||||||||||
Discount rate | 2.20 | % | 3.16 | % | 3.38 | % | 2.86 | % | |||
Rate of increase in compensation levels | 2.88 | % | 2.87 | % | 2.73 | % | 3.75 | % | |||
Expected long-term rate of return on assets | 2.29 | % | 2.88 | % | 2.97 | % | N/A | ||||
Weighted-average actuarial assumptions used in determining year-end benefit obligations: | |||||||||||
Discount rate | 2.09 | % | 2.20 | % | 3.16 | % | 3.01 | % | |||
Rate of increase in compensation levels | 2.85 | % | 2.88 | % | 2.87 | % | 2.50 | % | |||
We review pension assumptions annually. Pension income or expense for the year is determined using assumptions as of the beginning of the year (except for the effects of recognizing changes in the fair value of plan assets and actuarial gains and losses in the fourth quarter of each year), while the funded status is determined using assumptions as of the end of the year. We determined assumptions and established them at the respective balance sheet date using the following principles: (i) the expected long-term rate of return on plan assets is established based on forward looking long-term expectations of asset returns over the expected period to fund participant benefits based on the target investment mix of our plans; (ii) the discount rate is determined by matching the expected projected benefit obligation cash flows for each of the plans to a yield curve that is representative of long-term, high-quality (rated AA or higher) fixed income debt instruments as of the measurement date; and (iii) the rate of increase in compensation levels is established based on our expectations of current and foreseeable future increases in compensation. In addition, we consider advice from independent actuaries.
62
SPX FLOW, INC. AND SUBSIDIARIES
NOTES TO CONSOLIDATED AND COMBINED FINANCIAL STATEMENTS (CONTINUED)
(in millions, except share data)
Actuarial assumptions used in accounting for our domestic postretirement plans were as follows:
Year ended December 31, | ||||||||
2015 | 2014 | 2013 | ||||||
Assumed health care cost trend rates: | ||||||||
Health care cost trend rate for next year | 6.60 | % | 6.50 | % | 6.50 | % | ||
Rate to which the cost trend rate is assumed to decline (the ultimate trend rate) | 5.00 | % | 5.00 | % | 5.00 | % | ||
Year that the rate reaches the ultimate trend rate | 2024 | 2019 | 2017 | |||||
Discount rate used in determining net periodic postretirement benefit expense | 3.53 | % | 3.78 | % | 3.02 | % | ||
Discount rate used in determining year-end postretirement benefit obligation | 4.66 | % | 3.87 | % | 3.78 | % | ||
The accumulated postretirement benefit obligation was determined using the terms and conditions of our plans, together with relevant actuarial assumptions and health care cost trend rates. It is our policy to review the postretirement assumptions annually. The assumptions are determined by us and are established based on our prior experience and our expectations that future rates will decline. In addition, we consider advice from independent actuaries.
Defined Contribution Retirement Plan
In connection with the Spin-Off, we established a defined contribution retirement plan (the ‘‘DC Plan’’) pursuant to Section 401(k) of the U.S. Internal Revenue Code to which eligible U.S. employees of the Company may voluntarily contribute. Under the DC Plan, such employees may contribute up to 50% of their compensation into the DC Plan and the Company matches a portion of participating employees’ contributions. The Company’s matching contributions are primarily made in newly issued shares of SPX FLOW common stock and are issued at the prevailing market price. The matching contributions vest with the employee immediately upon the date of the match and there are no restrictions on the resale of SPX FLOW common stock held by employees. Amounts contributed under the DC Plan for the period subsequent to the Spin-Off were $1.7.
Prior to the Spin-Off, eligible employees could participate in SPX's defined contribution retirement plan pursuant to the above guidelines. The amount of cost directly charged to the Company related to matching contributions under the DC Plan was $4.7, $5.9 and $6.0 for the years ended December 31, 2015, 2014 and 2013, respectively. In addition, the Company was allocated $1.1, $1.2 and $0.9 of cost for matching contributions for SPX corporate personnel for the years ended December 31, 2015, 2014 and 2013, respectively.
(9) INCOME TAXES
For purposes of our consolidated and combined financial statements, income taxes have been calculated as if we filed income tax returns on a stand-alone basis for periods prior to the Spin-Off. The Company’s U.S. operations and certain of its non-U.S. operations historically were included in the tax returns of SPX or its subsidiaries that were not part of the Spin-Off. Therefore, the Company’s tax results from periods prior to the Spin-Off, as presented in the consolidated and combined financial statements, may not be reflective of the results that the Company will generate in the future. In jurisdictions where the Company was included in the tax returns filed by SPX or its subsidiaries that were not part of the Spin-Off, any income taxes payable resulting from the related income tax provision were reflected in the combined balance sheet as of December 31, 2014 and through the date of the Spin-Off within ‘‘Former parent company investment.’’
63
SPX FLOW, INC. AND SUBSIDIARIES
NOTES TO CONSOLIDATED AND COMBINED FINANCIAL STATEMENTS (CONTINUED)
(in millions, except share data)
Income before income taxes and the provision for (benefit from) income taxes consisted of the following:
Year ended December 31, | |||||||||||
2015 | 2014 | 2013 | |||||||||
Income before income taxes: | |||||||||||
United States | $ | 110.0 | $ | 95.1 | $ | 109.7 | |||||
Foreign | 27.2 | 138.3 | 81.6 | ||||||||
$ | 137.2 | $ | 233.4 | $ | 191.3 | ||||||
Provision for (benefit from) income taxes: | |||||||||||
Current: | |||||||||||
United States | $ | 55.5 | $ | 65.0 | $ | 33.1 | |||||
Foreign | 19.7 | 10.1 | 36.0 | ||||||||
Total current | 75.2 | 75.1 | 69.1 | ||||||||
Deferred and other: | |||||||||||
United States | (13.1 | ) | (13.1 | ) | 4.6 | ||||||
Foreign | (12.3 | ) | 35.5 | (14.9 | ) | ||||||
Total deferred and other | (25.4 | ) | 22.4 | (10.3 | ) | ||||||
Total provision | $ | 49.8 | $ | 97.5 | $ | 58.8 | |||||
The reconciliation of income tax computed at the U.S. federal statutory tax rate to our effective income tax rate was as follows:
Year ended December 31, | ||||||||
2015 | 2014 | 2013 | ||||||
Tax at U.S. federal statutory rate | 35.0 | % | 35.0 | % | 35.0 | % | ||
State and local taxes, net of U.S. federal benefit | 1.7 | 1.4 | 1.8 | |||||
U.S. credits and exemptions | (1.6 | ) | (1.5 | ) | (1.9 | ) | ||
Foreign earnings taxed at lower rates | (5.5 | ) | (6.5 | ) | (10.0 | ) | ||
Adjustments to uncertain tax positions | (1.7 | ) | (2.3 | ) | 2.5 | |||
Changes in valuation allowance | 3.8 | 9.6 | 3.6 | |||||
Tax on repatriation of foreign earnings | 7.3 | 6.8 | — | |||||
Other | (2.7 | ) | (0.7 | ) | (0.3 | ) | ||
36.3 | % | 41.8 | % | 30.7 | % | |||
64
SPX FLOW, INC. AND SUBSIDIARIES
NOTES TO CONSOLIDATED AND COMBINED FINANCIAL STATEMENTS (CONTINUED)
(in millions, except share data)
Significant components of our deferred tax assets and liabilities were as follows:
As of December 31, | |||||||
2015 | 2014 | ||||||
Deferred tax assets: | |||||||
Net operating loss and credit carryforwards | $ | 199.2 | $ | 206.5 | |||
Pension, other postretirement and postemployment benefits | 36.8 | 10.6 | |||||
Payroll and compensation | 36.2 | 18.5 | |||||
Working capital accruals | 23.3 | 25.9 | |||||
Basis difference in assets | — | 17.2 | |||||
Other | 42.2 | 17.9 | |||||
Total deferred tax assets | 337.7 | 296.6 | |||||
Valuation allowance | (70.3 | ) | (110.9 | ) | |||
Net deferred tax assets | 267.4 | 185.7 | |||||
Deferred tax liabilities: | |||||||
Accelerated depreciation | 20.0 | — | |||||
Intangible assets recorded in acquisitions | 173.6 | 197.9 | |||||
Basis difference in affiliates | 176.0 | 142.3 | |||||
Other | 2.7 | 6.2 | |||||
Total deferred tax liabilities | 372.3 | 346.4 | |||||
$ | (104.9 | ) | $ | (160.7 | ) | ||
General Matters
Deferred income taxes reflect the net tax effects of temporary differences between the carrying amounts of assets and liabilities for financial reporting purposes and the amounts used for income tax purposes. We periodically assess deferred tax assets to determine if they will likely be realized and the adequacy of deferred tax liabilities, incorporating the results of local, state, federal and foreign tax audits in our estimates and judgments.
At December 31, 2015, we had the following tax loss carryforwards available: tax loss carryforwards of various foreign jurisdictions of approximately $732.0 and state tax loss carryforwards of approximately $27.7. Of these amounts, approximately $4.3 expires in 2016 and $55.1 expires at various times between 2017 and 2034. The remaining carryforwards have no expiration date.
Realization of deferred tax assets, including those associated with net operating loss and credit carryforwards, is dependent upon generating sufficient taxable income in the appropriate tax jurisdiction. We believe that it is more likely than not that we may not realize the benefit of certain of these deferred tax assets and, accordingly, have established a valuation allowance against certain of these deferred tax assets. Although realization is not assured for the remaining deferred tax assets, we believe it is more likely than not that the deferred tax assets will be realized through future taxable earnings or tax planning strategies. However, deferred tax assets could be reduced in the near term if our estimates of taxable income are significantly reduced or tax planning strategies are no longer viable. The valuation allowance decreased by $40.6 in 2015 and increased by $6.0 in 2014. Of the net changes in 2015 and 2014, $5.2 and $22.3 were recognized as an increase in tax expense. The decrease in the valuation allowance during 2015 was primarily due to the sale of certain legal entities and the impact of a stronger U.S. dollar on foreign currency-denominated balances, which exceeded the increase in tax expense. The increase in the valuation allowance during 2014 was largely offset by a decrease to the valuation allowance resulting from the impact of a stronger U.S. dollar on foreign currency-denominated balances.
The amount of income tax that we pay annually is dependent on various factors, including the timing of certain deductions. These deductions can vary from year to year and, consequently, the amount of income taxes paid in future years will vary from the amounts paid in prior years.
Undistributed Foreign Earnings
In general, it is our practice and intention to reinvest the earnings of our non-U.S. subsidiaries in those operations. However, during the fourth quarter of 2015, we elected to repatriate sufficient foreign source income for U.S. tax purposes to allow us to utilize our 2015 foreign tax credits and provided U.S. taxes of $4.2 related to the dividend. In anticipation of the
65
SPX FLOW, INC. AND SUBSIDIARIES
NOTES TO CONSOLIDATED AND COMBINED FINANCIAL STATEMENTS (CONTINUED)
(in millions, except share data)
Spin-Off, we elected, during the fourth quarter of 2014, to repatriate certain earnings of our non-U.S. subsidiaries and, thus, provided for U.S. and foreign withholding taxes of $18.6 on such foreign dividends and undistributed earnings that were no longer considered to be indefinitely reinvested. In addition, there are discrete amounts of foreign earnings (approximately $56.2) that we plan to repatriate in the future.
As of December 31, 2015, we had not recorded a provision for U.S. or foreign withholding taxes on approximately $822.1 of the excess of the amount for financial reporting over the tax basis of investments in foreign subsidiaries that are essentially permanent in duration. Generally, such amounts become subject to U.S. taxation upon the remittance of dividends and under certain other circumstances. It is not practicable to estimate the amount of a deferred tax liability related to the undistributed earnings of these foreign subsidiaries, in the event that these earnings are no longer considered to be indefinitely reinvested, due to the hypothetical nature of the calculation.
Unrecognized Tax Benefits
As of December 31, 2015, we had gross unrecognized tax benefits of $25.4 (net unrecognized tax benefits of $12.4), of which $12.4, if recognized, would impact our effective tax rate. Similarly, at December 31, 2014 and 2013, we had gross unrecognized tax benefits of $27.3 (net unrecognized tax benefits of $14.5) and $31.5 (net unrecognized benefits of $17.4), respectively.
We classify interest and penalties related to unrecognized tax benefits as a component of our income tax provision. As of December 31, 2015, gross accrued interest totaled $1.6 (net accrued interest of $1.5), while the related amounts as of December 31, 2014 and 2013 were $1.8 (net accrued interest of $1.6) and $2.4 (net accrued interest of $2.0), respectively. Our income tax provision for the years ended December 31, 2015, 2014 and 2013 included gross interest (income) expense of $(0.1), $0.7 and $0.9, respectively. There were no significant penalties recorded during any year presented.
Based on the outcome of certain examinations or as a result of the expiration of statutes of limitations for certain jurisdictions, we believe that within the next 12 months it is reasonably possible that our previously unrecognized tax benefits could decrease by $1.0 to $3.0. The previously unrecognized tax benefits relate to a variety of tax issues, including transfer pricing and non-U.S. income tax matters.
The aggregate changes in the balance of unrecognized tax benefits for the years ended December 31, 2015, 2014 and 2013 were as follows:
Year ended December 31, | |||||||||||
2015 | 2014 | 2013 | |||||||||
Unrecognized tax benefit - opening balance | $ | 27.3 | $ | 31.5 | $ | 26.9 | |||||
Gross increases - tax positions in prior period | 3.6 | 7.3 | 0.1 | ||||||||
Gross decreases - tax positions in prior period | (5.9 | ) | (8.2 | ) | (1.4 | ) | |||||
Gross increases - tax positions in current period | 5.3 | 4.6 | 6.9 | ||||||||
Settlements | — | (0.7 | ) | (0.2 | ) | ||||||
Lapse of statute of limitations | (4.3 | ) | (6.8 | ) | (0.9 | ) | |||||
Change due to foreign currency exchange rates | (0.6 | ) | (0.4 | ) | 0.1 | ||||||
Unrecognized tax benefit - ending balance | $ | 25.4 | $ | 27.3 | $ | 31.5 | |||||
The unrecognized tax benefits described above represent amounts that were included in tax returns filed by the Company. Historically, a portion of the Company's operations were included in tax returns filed by SPX or its subsidiaries that were not part of the Spin-Off. As a result, some uncertain tax positions related to the Company's operations resulted in unrecognized tax benefits that are potential obligations of SPX or its subsidiaries that were part of the Spin-Off. Because activities that gave rise to these unrecognized tax benefits related to the Company's operations, the impact of these items was recorded to "Income tax provision" within our consolidated and combined statements of operations, with the offset recorded to "Former parent company investment" within our combined balance sheets prior to the Spin-Off date, which have been reclassified to "Paid-in capital" as of December 31, 2015.
In addition, some of the Company's tax returns have included the operations of SPX subsidiaries that were not part of the Spin-Off. In certain of these cases, these subsidiaries' activities gave rise to unrecognized tax benefits for which the Company could be potentially liable. When required under the Income Taxes Topic of the Codification, we have recorded a liability for these uncertain tax positions within our consolidated and combined balance sheets. However, since the potential obligations
66
SPX FLOW, INC. AND SUBSIDIARIES
NOTES TO CONSOLIDATED AND COMBINED FINANCIAL STATEMENTS (CONTINUED)
(in millions, except share data)
were the result of activities associated with operations that were not part of the Spin-Off, we have not reflected any related amounts within our "Income tax provision," but have instead recorded the amounts directly to "Former parent company investment" within our combined balance sheets prior to the Spin-Off date, which have been reclassified to "Paid-in capital" as of December 31, 2015.
Other Tax Matters
During 2015, we recorded an income tax provision of $49.8 on $137.2 of pre-tax income, resulting in an effective tax rate of 36.3%. The effective tax rate for 2015 was impacted by tax charges of $11.7 related to dividends from foreign subsidiaries, partially offset by tax benefits of (i) $5.1 related to net changes in uncertain tax positions, (ii) $2.8 related to tax rate decreases in Italy and the U.K. and (iii) $2.0 related to foreign exchange losses recognized for income tax purposes with respect to a foreign branch.
During 2014, our income tax provision was impacted by the following income tax charges: (i) $18.7 related to increases in valuation allowances recorded against certain foreign deferred income tax assets, and (ii) $18.6 related to the repatriation of certain earnings of our non-U.S. subsidiaries. The impact of these items was partially offset by $3.8 of tax benefits related to various audit settlements and statute expirations.
During 2013, our income tax provision was impacted by $3.9 related to net increases in valuation allowances recorded against certain foreign deferred income tax assets, partially offset by the following benefits: (i) $2.0 related to various audit settlements and statute expirations, and (ii) $0.7 associated with the Research and Experimentation Credit generated in 2012.
We review our income tax positions on a continuous basis and record a provision for potential uncertain positions when we determine that an uncertain position meets the criteria of the Income Taxes Topic of the Codification. As events change and resolutions occur, adjustments are made to amounts previously provided, such as in the case of audit settlements with taxing authorities.
In connection with the Spin-Off, we and SPX entered into a Tax Matters Agreement which, among other matters, addresses the allocation of certain tax adjustments that might arise upon examination of the 2013, 2014 and the pre-Spin-Off portion of the 2015 federal income tax returns of SPX. None of those returns are currently under examination, and we believe any contingencies have been adequately provided for.
State income tax returns generally are subject to examination for a period of three to five years after filing the respective tax returns. The impact on such tax returns of any federal changes remains subject to examination by various states for a period of up to one year after formal notification to the states. We have various state income tax returns in the process of examination or administrative appeal. We believe any uncertain tax positions related to these examinations have been adequately provided for.
We have various non-U.S. income tax returns under examination. The most significant of these are in Denmark for the 2006 and 2007 tax years and in Germany for the 2010 through 2013 tax years. We believe that any uncertain tax positions related to these examinations have been adequately provided for.
An unfavorable resolution of one or more of the above matters could have a material adverse effect on our results of operations or cash flows in the quarter and year in which an adjustment is recorded or the tax is due or paid. As audits and examinations are still in process or we have not yet reached the final stages of the appeals process, the timing of the ultimate resolution and any payments that may be required for the above matters cannot be determined at this time.
67
SPX FLOW, INC. AND SUBSIDIARIES
NOTES TO CONSOLIDATED AND COMBINED FINANCIAL STATEMENTS (CONTINUED)
(in millions, except share data)
(10) INDEBTEDNESS
Debt (other than related party notes payable, which are discussed in Note 15) at December 31, 2015 and 2014 was comprised of the following:
December 31, | |||||||
2015 | 2014 | ||||||
Term loan(1) | $ | 400.0 | $ | — | |||
6.875% senior notes, due in August 2017 | 600.0 | — | |||||
Other indebtedness(2) | 37.3 | 18.0 | |||||
Total debt | 1,037.3 | 18.0 | |||||
Less: short-term debt | 28.0 | 6.0 | |||||
Less: current maturities of long-term debt | 10.3 | 1.7 | |||||
Total long-term debt | $ | 999.0 | $ | 10.3 | |||
(1) | The term loan of $400.0 is repayable in quarterly installments of 5.0% annually, beginning with our third quarter of 2016, with the remaining balance repayable in full on September 24, 2020. |
(2) | Primarily includes capital lease obligations of $9.3 and $12.0 and balances under a purchase card program of $23.6 and $0.0 as of December 31, 2015 and 2014, respectively. The purchase card program allows for payment beyond the normal payment terms for goods and services acquired under the program. As this arrangement extends the payment of these purchases beyond their normal payment terms through third-party lending institutions, we have classified these amounts as short-term debt. |
Maturities of long-term debt payable during each of the five years subsequent to December 31, 2015 are $10.3, $620.6, $24.4, $20.4 and $330.4, respectively.
Senior Credit Facilities
On September 1, 2015, we entered into senior credit facilities with a syndicate of lenders that provide for committed senior secured financing in the aggregate amount of $1.35 billion, consisting of the following, each with a final maturity of September 24, 2020:
• | A term loan facility in an aggregate principal amount of $400.0; |
• | A domestic revolving credit facility, available for loans and letters of credit, in an aggregate principal amount up to $250.0; |
• | A global revolving credit facility, available for loans (and performance letters of credit and guarantees up to the equivalent of $100.0) in Euros, Great Britain Pound and other currencies, in an aggregate principal amount up to the equivalent of $200.0; |
• | A participation multi-currency foreign credit instrument facility, available for performance letters of credit and guarantees, in an aggregate principal amount up to the equivalent of $250.0; and |
• | A bilateral multi-currency foreign credit instrument facility, available for performance letters of credit and guarantees, in an aggregate principal amount up to the equivalent of $250.0. |
We also may seek additional commitments, without consent from the existing lenders, to add an incremental term loan facility and/or increase the commitments in respect of the domestic revolving credit facility, the global revolving credit facility, the participation foreign credit instrument facility, and/or the bilateral foreign credit instrument facility by an aggregate principal amount not to exceed (x) $500.0 plus (y) an unlimited amount so long as, immediately after giving effect thereto, our Consolidated Senior Secured Leverage Ratio (as defined in the credit agreement generally as the ratio of consolidated total debt (excluding the face amount of undrawn letters of credit, bank undertakings, or analogous instruments and net of cash and cash equivalents in excess of $50.0) at the date of determination secured by liens to consolidated adjusted EBITDA, as defined in the credit agreement, for the four fiscal quarters ended most recently before such date) does not exceed 2.75 to 1.00 plus (z) an amount equal to all voluntary prepayments of the term loan facility and voluntary prepayments accompanied by permanent commitment reductions of the revolving credit facilities and foreign credit instrument facilities.
We are the borrower under all of the senior credit facilities, and certain of our foreign subsidiaries are (and we may designate other foreign subsidiaries to be) borrowers under the global revolving credit facility and the foreign credit instrument
68
SPX FLOW, INC. AND SUBSIDIARIES
NOTES TO CONSOLIDATED AND COMBINED FINANCIAL STATEMENTS (CONTINUED)
(in millions, except share data)
facilities. All borrowings and other extensions of credit under our senior credit facilities are subject to the satisfaction of customary conditions, including absence of defaults and accuracy in material respects of representations and warranties.
The interest rates applicable to loans under our senior credit facilities are, at our option, equal to either (x) an alternate base rate (the highest of (a) the federal funds effective rate plus 0.5%, (b) the prime rate of Bank of America, N.A., and (c) the one-month LIBOR rate plus 1.0%) or (y) a reserve-adjusted LIBOR rate for dollars (Eurodollar) plus, in each case, an applicable margin percentage, which varies based on our Consolidated Leverage Ratio (as defined in the credit agreement generally as the ratio of consolidated total debt (excluding the face amount of undrawn letters of credit, bank undertakings or analogous instruments and net of cash and cash equivalents in excess of $50.0) at the date of determination to consolidated adjusted EBITDA, as defined in the credit agreement, for the four fiscal quarters ended most recently before such date). We may elect interest periods of one, two, three or six months (and, if consented to by all relevant lenders, nine or twelve months) for Eurodollar borrowings. The per annum fees charged and the interest rate margins applicable to Eurodollar and alternate base rate loans are as follows:
Consolidated Leverage Ratio | Domestic Revolving Commitment Fee | Global Revolving Commitment Fee | Letter of Credit Fee | Foreign Credit Commitment Fee | Foreign Credit Instrument Fee | LIBOR Loans | ABR Loans | |||||||||||||||||||
Greater than or equal to 3.00 to 1.00 | 0.350 | % | 0.350 | % | 2.000 | % | 0.350 | % | 1.250 | % | 2.000 | % | 1.000 | % | ||||||||||||
Between 2.00 to 1.00 and 3.00 to 1.00 | 0.300 | % | 0.300 | % | 1.750 | % | 0.300 | % | 1.000 | % | 1.750 | % | 0.750 | % | ||||||||||||
Between 1.50 to 1.00 and 2.00 to 1.00 | 0.275 | % | 0.275 | % | 1.500 | % | 0.275 | % | 0.875 | % | 1.500 | % | 0.500 | % | ||||||||||||
Between 1.00 to 1.00 and 1.50 to 1.00 | 0.250 | % | 0.250 | % | 1.375 | % | 0.250 | % | 0.800 | % | 1.375 | % | 0.375 | % | ||||||||||||
Less than 1.00 to 1.00 | 0.225 | % | 0.225 | % | 1.250 | % | 0.225 | % | 0.750 | % | 1.250 | % | 0.250 | % | ||||||||||||
The fees for bilateral foreign credit commitments are as specified above for foreign credit commitments unless otherwise agreed with the bilateral foreign issuing lender. We also pay fronting fees on the outstanding amounts of letters of credit and foreign credit instruments (in the participation facility) at rates of 0.125% per annum and 0.25% per annum, respectively.
Our senior credit facilities require mandatory prepayments in amounts equal to the gross proceeds from the sale or other disposition of, including from any casualty to, or governmental taking of, property in excess of specified values (other than in the ordinary course of business and subject to other exceptions) by the Company or its subsidiary guarantors. Mandatory prepayments are applied to repay, first, amounts outstanding under any term loans and, then, amounts outstanding under the global revolving credit facility and the domestic revolving credit facility (without reducing the commitments thereunder). No prepayment is required generally to the extent the net proceeds are reinvested (or committed to be reinvested) in permitted acquisitions, permitted investments or assets to be used in our business within 360 days (and if committed to be reinvested, actually reinvested within 180 days after the end of such 360-day period) of the receipt of such proceeds. We may voluntarily prepay loans under our senior credit facilities, in whole or in part, without premium or penalty. Any voluntary prepayment of loans is subject to reimbursement of the lenders’ breakage costs in the case of a prepayment of Eurodollar rate borrowings other than on the last day of the relevant interest period.
Indebtedness under our senior credit facilities is guaranteed by:
• | Each existing and subsequently acquired or organized domestic material subsidiary with specified exceptions; and |
• | The Company with respect to the obligations of our foreign borrower subsidiaries under the global revolving credit facility, the participation foreign credit instrument facility and the bilateral foreign credit instrument facility. |
Indebtedness under our senior credit facilities is secured by a first priority pledge and security interest in 100% of the capital stock of our domestic subsidiaries (with certain exceptions) held by the Company or its domestic subsidiary guarantors and 65% of the capital stock of our material first-tier foreign subsidiaries (with certain exceptions). If our corporate credit rating is less than ‘‘Ba2’’ (or not rated) by Moody’s and less than ‘‘BB’’ (or not rated) by S&P, then the Company and its domestic subsidiary guarantors are required to grant security interests, mortgages and other liens on substantially all their assets. If the Company’s corporate credit rating is ‘‘Baa3’’ or better by Moody’s or ‘‘BBB-’’ or better by S&P and no defaults would exist, then all collateral security will be released and the indebtedness under our senior credit facilities will be unsecured.
69
SPX FLOW, INC. AND SUBSIDIARIES
NOTES TO CONSOLIDATED AND COMBINED FINANCIAL STATEMENTS (CONTINUED)
(in millions, except share data)
Our senior credit facilities require that we maintain:
• | A Consolidated Interest Coverage Ratio (as defined in the credit agreement generally as the ratio of consolidated adjusted EBITDA for the four fiscal quarters ended on such date to consolidated cash interest expense for such period) as of the last day of any fiscal quarter of at least 3.50 to 1.00; and |
• | A Consolidated Leverage Ratio, as defined in the credit agreement, as of the last day of any fiscal quarter of not more than 3.25 to 1.00 (or 3.50 to 1.00 for the four fiscal quarters after certain permitted acquisitions). |
Our senior credit facilities also contain covenants that, among other things, restrict our ability to incur additional indebtedness, grant liens, make investments, loans, guarantees, or advances, make restricted junior payments, including dividends, redemptions of capital stock, and voluntary prepayments or repurchase of certain other indebtedness, engage in mergers, acquisitions or sales of assets, enter into sale and leaseback transactions, or engage in certain transactions with affiliates, and otherwise restrict certain corporate activities. Our senior credit facilities contain customary representations, warranties, affirmative covenants and events of default.
We are permitted under the senior credit facilities to repurchase our capital stock and pay cash dividends in an unlimited amount if our Consolidated Leverage Ratio, as defined in the credit agreement, is (after giving pro forma effect to such payments) less than 2.50 to 1.00. If our Consolidated Leverage Ratio is (after giving pro forma effect to such payments) greater than or equal to 2.50 to 1.00, the aggregate amount of such repurchases and dividend declarations cannot exceed (a) $100.0 in any fiscal year plus (b) an additional amount for all such repurchases and dividend declarations made after September 1, 2015 equal to the Available Amount (as defined in the credit agreement as the sum of (i) $300.0 plus (ii) a positive amount equal to 50% of cumulative Consolidated Net Income (as defined in the credit agreement, generally as consolidated net income subject to certain adjustments solely for the purposes of determining this basket) during the period from September 1, 2015, to the end of the most recent fiscal quarter preceding the date of such repurchase or dividend declaration for which financial statements have been (or were required to be) delivered (or, in case such Consolidated Net Income is a deficit, minus 100% of such deficit) plus or minus (iii) certain other amounts specified in the credit agreement).
At December 31, 2015, we had $440.5 of available borrowing capacity under our revolving credit facilities after giving effect to $9.5 reserved for outstanding letters of credit. In addition, at December 31, 2015, we had $227.7 of available issuance capacity under our foreign credit instrument facilities after giving effect to $272.3 reserved for outstanding letters of credit.
The weighted-average interest rate of outstanding borrowings under our senior credit facilities was approximately 2.2% at December 31, 2015.
Senior Notes
On September 22, 2015, in anticipation of the completion of the Spin-Off, we entered into a supplemental indenture and issued substitute global notes in connection with our substitution for SPX as the obligor of $600.0 aggregate principal amount of 6.875% senior notes. These notes mature in August 2017, with interest payable on March 1 and September 1 of each year. The notes are redeemable, in whole or in part, at any time prior to maturity at a price equal to 100% of the principal amount thereof plus an applicable premium, plus accrued and unpaid interest. If we experience certain types of change of control transactions, we must offer to repurchase the notes at 101% of the aggregate principal amount of the notes repurchased, plus accrued and unpaid interest. These notes are unsecured and rank equally with all our existing and future unsubordinated unsecured senior indebtedness, but are effectively junior to our senior credit facilities. The indenture governing these notes contains covenants that, among other things, limit our ability to incur liens, enter into sale and leaseback transactions and consummate some mergers. Payment of the principal, interest and premium (if any) on the notes is guaranteed on a senior unsecured basis by our domestic subsidiaries.
Other
On September 22, 2015, we entered into a trade receivables financing arrangement under which we can borrow, on a continuous basis, up to $50.0, as available. The facility contains representations, warranties, covenants and indemnities customary for facilities of this type. The facility does not contain any covenants that we view as materially constraining to the activities of our business. This arrangement has a final maturity of September 21, 2018. At December 31, 2015, there were no borrowings outstanding under this facility.
At December 31, 2015, in addition to the revolving lines of credit described above, we had approximately $5.5 of letters of credit outstanding under separate arrangements in China and India.
70
SPX FLOW, INC. AND SUBSIDIARIES
NOTES TO CONSOLIDATED AND COMBINED FINANCIAL STATEMENTS (CONTINUED)
(in millions, except share data)
At December 31, 2015, we were in compliance with all covenants of our senior credit facilities and our senior notes.
(11) DERIVATIVE FINANCIAL INSTRUMENTS
We manufacture and sell our products in a number of countries and, as a result, are exposed to movements in foreign currency exchange rates. Our objective is to preserve the economic value of non-functional currency-denominated cash flows and to minimize the impact of changes as a result of currency fluctuations. Our principal currency exposures relate to the Euro, Chinese Yuan and Great Britain Pound.
From time to time, we enter into forward contracts to manage the exposure on contracts with forecasted transactions denominated in non-functional currencies and to manage the risk of transaction gains and losses associated with assets/liabilities denominated in currencies other than the functional currency of certain subsidiaries ("FX forward contracts"). In addition, some of our contracts contain currency forward embedded derivatives ("FX embedded derivatives"), because the currency of exchange is not "clearly and closely" related to the functional currency of either party to the transaction. Certain of our FX forward contracts are designated as cash flow hedges. To the extent these derivatives are effective in offsetting the variability of the hedged cash flows, changes in the derivatives' fair value are not included in current earnings, but are included in AOCL. These changes in fair value are reclassified into earnings as a component of revenues or cost of products sold, as applicable, when the forecasted transaction impacts earnings. In addition, if the forecasted transaction is no longer probable, the cumulative change in the derivatives' fair value is recorded as a component of "Other income (expense), net" in the period in which the transaction is no longer considered probable of occurring. To the extent a previously designated hedging transaction is no longer an effective hedge, any ineffectiveness measured in the hedging relationship is recorded in earnings in the period in which it occurs.
We had FX forward contracts with an aggregate notional amount of $44.7 and $84.4 outstanding as of December 31, 2015 and 2014, respectively, with all such contracts scheduled to mature within one year. We also had FX embedded derivatives with an aggregate notional amount of $31.6 and $53.4 at December 31, 2015 and 2014, respectively, with scheduled maturities of $30.8 and $0.8 within one and two years, respectively. The unrealized loss, net of tax, recorded in AOCL related to FX forward contracts was less than $0.1 as of December 31, 2015 and 2014. The net gains (losses) recorded in "Other income (expense), net" related to foreign currency gains (losses) totaled $1.1, ($2.6) and ($5.8) for the years ended December 31, 2015, 2014 and 2013, respectively.
We enter into arrangements designed to provide the right of setoff in the event of counterparty default or insolvency, and have elected to offset the fair values of our FX forward contracts in our consolidated and combined balance sheets. The gross fair values of our FX forward contracts and FX embedded derivatives, in aggregate, were $2.0 and $0.5 (gross assets) and $1.5 and $1.1 (gross liabilities) at December 31, 2015 and 2014, respectively.
Concentrations of Credit Risk
Financial instruments that potentially subject us to significant concentrations of credit risk consist of cash and equivalents, trade accounts receivable, and FX forward contracts. These financial instruments, other than trade accounts receivable, are placed with high-quality financial institutions throughout the world. We periodically evaluate the credit standing of these financial institutions.
We maintain cash levels in bank accounts that, at times, may exceed federally-insured limits. We have not experienced, and believe we are not exposed to significant risk of, loss in these accounts.
We have credit loss exposure in the event of nonperformance by counterparties to the above financial instruments, but have no other off-balance-sheet credit risk of accounting loss. We anticipate that counterparties will be able to fully satisfy their obligations under the contracts. We do not obtain collateral or other security to support financial instruments subject to credit risk, but we do monitor the credit standing of counterparties.
Concentrations of credit risk arising from trade accounts receivable are due to selling to customers in a particular industry. Credit risks are mitigated by performing ongoing credit evaluations of our customers' financial conditions and obtaining collateral, advance payments, or other security when appropriate. No one customer, or group of customers that to our knowledge are under common control, accounted for more than 10% of our revenues for any period presented.
71
SPX FLOW, INC. AND SUBSIDIARIES
NOTES TO CONSOLIDATED AND COMBINED FINANCIAL STATEMENTS (CONTINUED)
(in millions, except share data)
(12) EQUITY AND STOCK-BASED COMPENSATION
Income Per Share
Prior to the Spin-Off, SPX FLOW had no common shares outstanding. On September 26, 2015, 41.322 SPX FLOW common shares were distributed to SPX shareholders in conjunction with the Spin-Off. For comparative purposes, basic shares outstanding reflect this amount in all periods presented prior to the Spin-Off. For purposes of computing dilutive shares, unvested SPX FLOW awards at the Spin-Off date were assumed to have been issued and outstanding from January 1, 2015. The resulting number of weighted-average dilutive shares has been used in all periods presented prior to the Spin-Off. The following table sets forth the number of weighted average shares outstanding used in the computation of basic and diluted income per share:
Year ended December 31, | ||||||||
2015 | 2014 | 2013 | ||||||
Weighted-average shares outstanding, basic | 40.863 | 40.809 | 40.809 | |||||
Dilutive effect of share-based awards | 0.097 | 0.123 | 0.123 | |||||
Weighted-average shares outstanding, dilutive(1) | 40.960 | 40.932 | 40.932 | |||||
(1) | For the years ended December 31, 2015, 2014 and 2013, 0.474, 0.479 and 0.479, respectively, of unvested restricted stock shares/units were not included in the computation of diluted income per share because required market thresholds for vesting (as discussed below) were not met. For the year ended December 31, 2015, 0.389 of stock options were not included in the computation of diluted income per share because their exercise price was greater than the average market price of common shares. There were no stock options outstanding during 2014 or 2013. |
Stock-Based Compensation
Prior to the Spin-Off, eligible employees of the Company participated in SPX’s share-based compensation plan pursuant to which they were granted share-based awards of SPX stock. SPX’s share-based compensation plan includes awards for restricted stock shares, restricted stock units and stock options. Compensation expense for share-based awards recorded by the Company prior to the Spin-Off includes the expense associated with the employees historically attributable to the Company’s operations, as well as an allocation of stock-based compensation expense for SPX’s corporate employees who provided certain centralized support functions.
SPX restricted stock shares, SPX restricted stock units, and SPX stock options were granted to eligible employees in accordance with applicable equity compensation plan documents and agreements. Subject to participants' continued employment and other plan terms and conditions, the restrictions lapse and awards generally vest over a period of time, generally one or three years. In some instances, such as death, disability, or retirement, stock may vest concurrently with or following an employee's termination. A substantial portion of the SPX restricted stock shares and SPX restricted stock unit awards granted in 2014 and 2013 vest based on performance thresholds.
Eligible employees received target performance awards in 2014 and 2013 in which the employee can earn between 25% and 125% of the target performance award in the event the award meets the required vesting criteria. Vesting for the 2014 and 2013 target performance awards is based on SPX shareholder return versus the S&P Composite 1500 Industrials Index over three-year periods ending December 31, 2016 and December 31, 2015, respectively. Awards granted in 2015 did not contain such target performance conditions.
Each eligible non-officer employee also received awards in 2015, 2014 and 2013 that vest ratably over three years, subject only to the passage of time. Officers of SPX received awards in 2015, 2014 and 2013 that vest ratably over three years, subject to an internal performance metric.
SPX restricted stock shares and SPX restricted stock units that do not vest within the applicable vesting period are forfeited.
In connection with the Spin-Off, outstanding equity-based awards granted to SPX FLOW employees under the SPX plan were converted into awards of the Company using a formula designed to preserve the intrinsic value of the awards immediately prior to the Spin-Off. This conversion did not result in additional compensation expense. Additionally, certain restricted stock units granted to employees, none of whom were named executive officers, in 2013 and 2014 were modified at the Spin-Off date to provide a minimum vesting equivalent to 50% of the underlying shares at the end of the applicable remaining
72
SPX FLOW, INC. AND SUBSIDIARIES
NOTES TO CONSOLIDATED AND COMBINED FINANCIAL STATEMENTS (CONTINUED)
(in millions, except share data)
service periods. Compensation expense related to the modification is $4.0, of which $2.8 was recognized in the year ended December 31, 2015, with the remaining $1.2 to be recognized over the remaining service periods of the related awards.
The recognition of compensation expense for SPX share-based awards is based on their grant-date fair values. The fair value of each award is amortized over the lesser of the award's requisite or derived service period, which is generally up to three years. For the years ended December 31, 2015, 2014 and 2013, we recognized compensation expense related to share-based programs in “Selling, general and administrative” expense in the accompanying consolidated and combined statements of operations as follows:
Year ended December 31, | |||||||||||
2015 | 2014 | 2013 | |||||||||
Expense associated with individuals attributable to SPX FLOW's operations | $ | 9.6 | $ | 5.2 | $ | 6.3 | |||||
Allocation of expense historically associated with SPX's corporate employees(1) | 13.4 | 14.8 | 11.1 | ||||||||
Expense related to modification as of Spin-Off date | 2.8 | — | — | ||||||||
Stock-based compensation expense | 25.8 | 20.0 | 17.4 | ||||||||
Income tax benefit | (9.5 | ) | (7.3 | ) | (6.4 | ) | |||||
Stock-based compensation expense, net of income tax benefit | $ | 16.3 | $ | 12.7 | $ | 11.0 | |||||
(1) | See Note 1 for a discussion of the methodology used to allocate corporate-related costs prior to the Spin-Off. |
Restricted Stock Share and Restricted Stock Unit Awards
The Monte Carlo simulation model valuation technique was used to determine the fair value of SPX's restricted stock shares and restricted stock units that contain a "market condition." The Monte Carlo simulation model utilizes multiple input variables that determine the probability of satisfying the market condition stipulated in the award and calculates the fair value of each restricted stock share and restricted stock unit award. The following assumptions were used in determining the fair value of the awards granted on the dates indicated below (awards granted during 2015 did not contain a market condition):
Annual Expected Stock Price Volatility | Annual Expected Dividend Yield | Risk-free Interest Rate | Correlation Between Total Shareholder Return for SPX and the S&P Index | ||||||||
January 2, 2014: | |||||||||||
SPX Corporation | 33.7 | % | 1.02 | % | 0.76 | % | 0.7631 | ||||
S&P Composite 1500 Industrials Index | 19.9 | % | n/a | 0.76 | % | ||||||
January 2, 2013: | |||||||||||
SPX Corporation | 36.3 | % | 1.42 | % | 0.37 | % | 0.7778 | ||||
S&P Composite 1500 Industrials Index | 22.4 | % | n/a | 0.37 | % | ||||||
Annual expected stock price volatility was based on the three-year SPX historical volatility. The annual expected dividend yield was based on annual expected SPX dividend payments and the stock price on the date of grant. The average risk-free interest rate was based on the one-year through three-year daily treasury yield curve rate as of the grant date.
73
SPX FLOW, INC. AND SUBSIDIARIES
NOTES TO CONSOLIDATED AND COMBINED FINANCIAL STATEMENTS (CONTINUED)
(in millions, except share data)
In connection with the Spin-Off, certain former corporate employees of SPX became employees of the Company. The following table summarizes the unvested restricted stock share and restricted stock unit activity (i) from December 31, 2012 through September 26, 2015, for the Company's employees with SPX awards before the Spin-Off, and (ii) the resulting, converted SPX FLOW awards after the Spin-Off and activity from September 26, 2015 through December 31, 2015:
SPX - Prior to Spin-Off: | Unvested Restricted Stock Shares and Restricted Stock Units | Weighted-Average Grant-Date Fair Value Per Share | |
Outstanding at December 31, 2012 | 0.385 | $55.18 | |
Granted | 0.115 | 62.90 | |
Vested | (0.118) | 54.85 | |
Forfeited and other | (0.112) | 53.97 | |
Outstanding at December 31, 2013 | 0.270 | 59.10 | |
Granted | 0.071 | 89.37 | |
Vested | (0.066) | 59.78 | |
Forfeited and other | (0.126) | 59.39 | |
Outstanding at December 31, 2014 | 0.149 | 72.93 | |
Granted | 0.075 | 85.47 | |
Vested | (0.035) | 79.92 | |
Forfeited and other | (0.019) | 63.45 | |
Outstanding at September 26, 2015, immediately prior to Spin-Off | 0.170 | $79.65 | |
SPX FLOW - Post Spin-Off: | |||
Conversion of SPX Plan awards to SPX FLOW Stock Plan awards on September 26, 2015 | 1.154 | $53.32 | |
Granted | 0.069 | 26.05 | |
Vested | (0.091) | 61.34 | |
Forfeited and other | (0.004) | 59.93 | |
Outstanding at December 31, 2015 | 1.128 | $51.13 | |
As of December 31, 2015, there was $16.0 of unrecognized compensation cost related to SPX FLOW's restricted stock share and restricted stock unit compensation arrangements, including the effects of the modification discussed above. We expect this cost to be recognized over a weighted-average period of 1.7 years.
Stock Options
On January 2, 2015, eligible employees of the Company were granted 0.034 options in SPX stock, all of which were outstanding (but not exercisable) from that date up to the Spin-Off. The weighted-average exercise price per share of these options was $85.87 and the maximum contractual term of these options is 10 years. There were no SPX stock options outstanding during the years ended December 31, 2014 and 2013.
The weighted-average grant-date fair value per share of the SPX stock options granted on January 2, 2015 was $27.06. The fair value of each SPX option grant was estimated using the Black-Scholes option-pricing model with the following assumptions:
Annual expected SPX stock price volatility | 36.53 | % |
Annual expected SPX dividend yield | 1.75 | % |
Risk-free interest rate | 1.97 | % |
Expected life of SPX stock option (in years) | 6.0 | |
Annual expected stock price volatility was based on the six-year historical volatility of SPX stock. The annual expected dividend yield was based on annual expected SPX dividend payments and SPX's stock price on the date of grant. The average risk-free interest rate was based on the seven-year treasury constant maturity rate. The expected SPX option life was based on a three-year pro-rata vesting schedule and represents the period of time that awards are expected to be outstanding.
74
SPX FLOW, INC. AND SUBSIDIARIES
NOTES TO CONSOLIDATED AND COMBINED FINANCIAL STATEMENTS (CONTINUED)
(in millions, except share data)
In connection with the Spin-Off, certain former corporate employees of SPX became employees of the Company. The number of outstanding SPX FLOW stock options, after reflecting (i) SPX stock options that had been granted to former corporate employees of SPX on January 2, 2015, and (ii) the conversion of SPX stock options to SPX FLOW stock options, was 0.396. After reflecting 0.025 of forfeitures during the fourth quarter of 2015, there were 0.371 of SPX FLOW stock options outstanding as of December 31, 2015, of which 0.242 were exercisable. As a result of the conversion of the stock options, the weighted-average exercise price per share of the SPX FLOW stock options is $61.29 and the weighted-average grant-date fair value per share of the SPX FLOW stock options is $19.33. Other terms of the SPX FLOW stock options are the same as those discussed above.
As of December 31, 2015, there was $0.9 of unrecognized compensation cost related to SPX FLOW stock options. We expect this cost to be recognized over a weighted-average period of 2.1 years.
Accumulated Other Comprehensive Loss
The changes in the components of AOCL, net of tax, for the years ended December 31, 2015 and 2014 were as follows:
Foreign Currency Translation Adjustment | Net Unrealized Gains (Losses) on Available-for-Sale Securities | Pension Liability Adjustment(1) | Total | ||||||||||||
Balance at December 31, 2013 | $ | (15.1 | ) | $ | (3.7 | ) | $ | (0.1 | ) | $ | (18.9 | ) | |||
Other comprehensive income (loss) before reclassifications | (204.2 | ) | 3.6 | 0.1 | (200.5 | ) | |||||||||
Amounts reclassified from accumulated other comprehensive loss | — | 0.1 | 0.1 | 0.2 | |||||||||||
Current-period other comprehensive income (loss) | (204.2 | ) | 3.7 | 0.2 | (200.3 | ) | |||||||||
Balance at December 31, 2014 | (219.3 | ) | — | 0.1 | (219.2 | ) | |||||||||
Other comprehensive loss before reclassifications | (163.4 | ) | — | — | (163.4 | ) | |||||||||
Amounts reclassified from accumulated other comprehensive income | — | — | (0.1 | ) | (0.1 | ) | |||||||||
Current-period other comprehensive loss | (163.4 | ) | — | (0.1 | ) | (163.5 | ) | ||||||||
Balance at December 31, 2015 | $ | (382.7 | ) | $ | — | $ | — | $ | (382.7 | ) | |||||
(1) | Net of tax benefit of $0 and $0.1 as of December 31, 2014 and 2013, respectively. The balances as of December 31, 2014 and 2013 include unamortized prior service credits (costs). |
Amounts reclassified from AOCL related to pension liability adjustments were recorded in “Selling, general and administrative” expense in the accompanying consolidated and combined statements of operations for the years ended December 31, 2015 and 2014. Amounts reclassified from AOCL related to available-for-sale securities were recorded in "Other income (expense), net" in the accompanying combined statement of operations for the year ended December 31, 2014.
Common Stock in Treasury
Subsequent to the Spin-Off, "Common stock in treasury" was increased by $1.4 for common stock that was surrendered by recipients of restricted stock as a means of funding the related minimum income tax withholding requirements.
(13) COMMITMENTS AND CONTINGENT LIABILITIES
Leases
We lease certain manufacturing facilities, offices, sales and service locations, machinery and equipment, vehicles and office equipment under various leasing programs accounted for as operating and capital leases, some of which include scheduled rent increases stated in the lease agreement. We do not have any significant leases that require rental payments based on contingent events nor have we received any significant lease incentive payments.
75
SPX FLOW, INC. AND SUBSIDIARIES
NOTES TO CONSOLIDATED AND COMBINED FINANCIAL STATEMENTS (CONTINUED)
(in millions, except share data)
Operating Leases
The future minimum rental payments under operating leases with remaining non-cancelable terms in excess of one year are:
Year Ending December 31, | ||||
2016 | $ | 21.8 | ||
2017 | 15.0 | |||
2018 | 11.2 | |||
2019 | 7.9 | |||
2020 | 6.4 | |||
Thereafter | 14.7 | |||
Total minimum payments | $ | 77.0 | ||
Total operating lease expense, inclusive of rent based on scheduled rent increases and rent holidays recognized on a straight-line basis, was $31.9 in 2015, $35.0 in 2014 and $36.1 in 2013.
Capital Leases
Future minimum lease payments under capital lease obligations are:
Year Ending December 31, | ||||
2016 | $ | 1.0 | ||
2017 | 1.2 | |||
2018 | 4.6 | |||
2019 | 0.6 | |||
2020 | 0.6 | |||
Thereafter | 3.7 | |||
Total minimum payments | 11.7 | |||
Less: interest | (2.4 | ) | ||
Capital lease obligations as of December 31, 2015 | 9.3 | |||
Less: current maturities as of December 31, 2015 | 0.3 | |||
Long-term portion as of December 31, 2015 | $ | 9.0 | ||
Our current and long-term capital lease obligations as of December 31, 2014 were $1.7 and $10.3, respectively.
Assets held through capital lease agreements at December 31, 2015 and 2014 comprise the following:
December 31, | |||||||
2015 | 2014 | ||||||
Buildings | $ | 6.0 | $ | 17.4 | |||
Machinery and equipment | 1.4 | 10.6 | |||||
Other | — | 3.3 | |||||
Total | 7.4 | 31.3 | |||||
Less: accumulated depreciation | (2.0 | ) | (10.4 | ) | |||
Net book value | $ | 5.4 | $ | 20.9 | |||
Litigation and Contingent Liabilities
We are subject to litigation matters that arise in the normal course of business. We believe these matters are either without merit or of a kind that should not have a material effect, individually or in the aggregate, on our financial position, results of operations or cash flows.
We are subject to domestic and international environmental protection laws and regulations with respect to our business operations and are operating in compliance with, or taking action aimed at ensuring compliance with, these laws and regulations.
76
SPX FLOW, INC. AND SUBSIDIARIES
NOTES TO CONSOLIDATED AND COMBINED FINANCIAL STATEMENTS (CONTINUED)
(in millions, except share data)
We believe our compliance obligations with environmental protection laws and regulations should not have a material effect, individually or in the aggregate, on our financial position, results of operations or cash flows.
(14) FAIR VALUE
Fair value is the price that would be received to sell an asset or paid to transfer a liability in an orderly transaction between market participants at the measurement date. In the absence of active markets for the identical assets or liabilities, such measurements involve developing assumptions based on market observable data and, in the absence of such data, internal information consistent with what market participants would use in a hypothetical transaction that occurs at the measurement date. Observable inputs reflect market data obtained from independent sources, while unobservable inputs reflect our market assumptions. Preference is given to observable inputs. These two types of inputs create the following fair value hierarchy:
• | Level 1 — Quoted prices for identical instruments in active markets. |
• | Level 2 — Quoted prices for similar instruments in active markets; quoted prices for identical or similar instruments in markets that are not active; and model-derived valuations whose inputs are observable or whose significant value drivers are observable. |
• | Level 3 — Significant inputs to the valuation model are unobservable. |
There were no changes during the periods presented to the valuation techniques we use to measure asset and liability fair values on a recurring basis. There were no transfers between the three levels of the fair value hierarchy during the periods presented.
The following section describes the valuation methodologies we use to measure different financial instruments at fair value on a recurring basis.
Derivative Financial Instruments
Our derivative financial assets and liabilities include FX forward contracts and FX embedded derivatives, valued using valuation models based on observable market inputs such as forward rates, interest rates, our own credit risk and the credit risk of our counterparties, which comprise investment-grade financial institutions. Based on these inputs, the derivative assets and liabilities are classified within Level 2 of the valuation hierarchy. We have not made any adjustments to the inputs obtained from the independent sources. Based on our continued ability to enter into forward contracts, we consider the markets for our fair value instruments active. We primarily use the income approach, which uses valuation techniques to convert future amounts to a single present amount.
As of December 31, 2015 and 2014, the gross fair values of our derivative financial assets and liabilities, in aggregate, were $2.0 and $0.5 (gross assets) and $1.5 and $1.1 (gross liabilities), respectively. As of December 31, 2015, there had been no significant impact to the fair value of our derivative liabilities due to our own credit risk as the related instruments are collateralized under our senior credit facilities. Similarly, there had been no significant impact to the fair value of our derivative assets based on our evaluation of our counterparties’ credit risks.
Investments in Equity Securities
Certain of our investments in equity securities that are not readily marketable are accounted for under the fair value option and are classified as Level 3 assets in the fair value hierarchy, with such values determined by multidimensional pricing models. These models consider market activity based on modeling of securities with similar credit quality, duration, yield and structure. A variety of inputs are used, including benchmark yields, reported trades, non-binding broker/dealer quotes, issuer spread and reference data including market research publications. Market indicators, industry and economic events are also considered. We have not made any adjustments to the inputs obtained from the independent sources. At December 31, 2015 and 2014, these assets had a fair value of $8.1 and $7.4, respectively.
77
SPX FLOW, INC. AND SUBSIDIARIES
NOTES TO CONSOLIDATED AND COMBINED FINANCIAL STATEMENTS (CONTINUED)
(in millions, except share data)
The table below presents a reconciliation of our investment in equity securities measured at fair value on a recurring basis using significant unobservable inputs (Level 3) for the years ended December 31, 2015 and 2014, including net unrealized gains recorded to “Other income (expense), net."
Year ended December 31, | |||||||
2015 | 2014 | ||||||
Balance at beginning of year | $ | 7.4 | $ | 1.4 | |||
Unrealized gains recorded to earnings | 0.7 | 6.0 | |||||
Balance at end of year | $ | 8.1 | $ | 7.4 | |||
Goodwill, Indefinite-Lived Intangible and Other Long-Lived Assets
Certain of our non-financial assets are subject to impairment analysis, including long-lived assets, indefinite-lived intangible assets and goodwill. We review the carrying amounts of such assets whenever events or changes in circumstances indicate that the carrying amounts may not be recoverable or at least annually for indefinite-lived intangible assets and goodwill. Any resulting impairment would require that the asset be recorded at its fair value. During 2015, certain trademarks associated with businesses within our Power and Energy and Food and Beverage reportable segments and certain technology assets associated with a business within our Food and Beverage reportable segment were impaired based on their respective fair value measurements. Refer to Note 7 for further discussion pertaining to our annual and interim evaluation of goodwill and other intangible assets for impairment.
During 2015, 2014 and 2013, we recorded impairment charges of $22.7, $11.7 and $4.7, respectively, related to the trademarks (and, in 2015, technology assets) of certain businesses within our Power and Energy, Food and Beverage and Industrial reportable segments as we determined that the fair values of such trademarks (and, in 2015, technology assets) were less than the carrying values. See Note 7 for additional information regarding such impairment charges.
Indebtedness and Other
The estimated fair values of other financial liabilities (excluding capital leases and related party notes payable) not measured at fair value on a recurring basis as of December 31, 2015 and 2014 were as follows:
December 31, 2015 | December 31, 2014 | ||||||||||||||
Carrying Amount | Fair Value | Carrying Amount | Fair Value | ||||||||||||
Term loan | $ | 400.0 | $ | 400.0 | $ | — | $ | — | |||||||
Senior notes | 600.0 | 637.5 | — | — | |||||||||||
Other indebtedness | 28.0 | 28.0 | 6.0 | 6.0 | |||||||||||
The following methods and assumptions were used in estimating the fair value of these financial instruments:
• | The fair values of the senior notes and term loan were determined using Level 2 inputs within the fair value hierarchy and were based on quoted market prices for the same or similar instruments or on current rates offered to us for debt with similar maturities, subordination and credit default expectations. |
• | The fair value of our other indebtedness approximated carrying value due primarily to the short-term nature of these instruments. |
As of December 31, 2014, the aggregate estimated fair value of our related party notes payable was approximately $1,127.0, compared to the aggregate carrying value of $1,003.1. There were no related party notes payable outstanding as of December 31, 2015.
The carrying amounts of cash and equivalents and receivables (excluding related party notes receivable) reported in our consolidated and combined balance sheets approximate fair value due to the short-term nature of those instruments. As of December 31, 2014, the aggregate estimated fair value of our related party notes receivable was approximately $758.0, compared to the aggregate carrying value of $707.1. There were no related party notes receivable outstanding as of December 31, 2015.
78
SPX FLOW, INC. AND SUBSIDIARIES
NOTES TO CONSOLIDATED AND COMBINED FINANCIAL STATEMENTS (CONTINUED)
(in millions, except share data)
(15) RELATED PARTY TRANSACTIONS
Allocation of General Corporate Expenses
The consolidated and combined statements of operations include expenses for certain centralized functions and other programs provided and/or administered by SPX charged directly to business units of the Company. In addition, for purposes of preparing these consolidated and combined financial statements for periods prior to the Spin-Off on a "carve-out" basis, a portion of SPX's total corporate expenses have been allocated to the Company. A detailed description of the methodology used to allocate corporate-related costs is included in Note 1.
Related Party Notes
As of December 31, 2014, the Company had related party notes receivable of $707.1, with SPX serving as the counterparty. These related party notes were transferred to SPX or canceled by the Company with a corresponding decrease to "Former parent company investment" of $669.7 during the third quarter of 2015. We recorded interest income of $26.2, $47.1 and $24.8 for the years ended December 31, 2015, 2014 and 2013, respectively, related to these notes. The related party notes receivable had a weighted-average interest rate of approximately 6.0% as of December 31, 2014. There were no related party notes receivable outstanding as of December 31, 2015.
As of December 31, 2014, the Company had related party notes payable of $1,003.1, with SPX (and certain other of its affiliates that were not part of the Spin-Off) serving as the counterparties. During the nine months ended September 26, 2015, these related party notes payable were extinguished by way of capital contributions to the Company by SPX. As a result, related party notes payable were reduced by $991.3 with a corresponding increase to "Former parent company investment" during the nine months ended September 26, 2015. In aggregate, we recorded interest expense of $28.4, $72.9 and $61.1 for the years ended December 31, 2015, 2014 and 2013, respectively, related to these notes. The related party notes payable had a weighted-average interest rate of approximately 7.0% as of December 31, 2014. There were no related party notes payable outstanding as of December 31, 2015.
79
SPX FLOW, INC. AND SUBSIDIARIES
NOTES TO CONSOLIDATED AND COMBINED FINANCIAL STATEMENTS (CONTINUED)
(in millions, except share data)
(16) QUARTERLY RESULTS (UNAUDITED)
First(2) | Second | Third | Fourth(2) | ||||||||||||||||||||||||||||
2015 | 2014 | 2015 | 2014 | 2015 | 2014 | 2015 | 2014 | ||||||||||||||||||||||||
Revenues | $ | 571.2 | $ | 659.3 | $ | 615.1 | $ | 706.3 | $ | 589.5 | $ | 681.5 | $ | 612.7 | $ | 722.5 | |||||||||||||||
Gross profit | 188.3 | 208.7 | 211.2 | 238.9 | 197.9 | 234.9 | 194.8 | 254.0 | |||||||||||||||||||||||
Net income (loss) (1) | 23.1 | 19.6 | 46.7 | 37.8 | (4.2 | ) | 56.3 | 21.8 | 22.2 | ||||||||||||||||||||||
Less: Net income (loss) attributable to noncontrolling interests | (0.3 | ) | (0.4 | ) | (0.4 | ) | 0.6 | (0.1 | ) | 0.8 | 0.7 | 0.4 | |||||||||||||||||||
Net income (loss) attributable to SPX FLOW, Inc. | $ | 23.4 | $ | 20.0 | $ | 47.1 | $ | 37.2 | $ | (4.1 | ) | $ | 55.5 | $ | 21.1 | $ | 21.8 | ||||||||||||||
Basic income (loss) per share of common stock | $ | 0.57 | $ | 0.49 | $ | 1.15 | $ | 0.91 | $ | (0.10 | ) | $ | 1.36 | $ | 0.52 | $ | 0.53 | ||||||||||||||
Diluted income (loss) per share of common stock | $ | 0.57 | $ | 0.49 | $ | 1.15 | $ | 0.91 | $ | (0.10 | ) | $ | 1.36 | $ | 0.51 | $ | 0.53 | ||||||||||||||
(1) | During the fourth quarter of 2015, we recognized a gain, net of taxes, of $1.3, related to changes in the fair value of plan assets, actuarial gains/losses, and curtailment gains associated with our pension and postretirement plans. During the third quarter of 2015, we recognized a loss, net of taxes, of ($5.0), related to changes in the fair value of plan assets, actuarial gains/losses, and curtailment gains associated with our and SPX’s pension plans. The third quarter loss resulted primarily from the formation of a new SPX FLOW domestic nonqualified pension plan in connection with the Spin-Off and its related remeasurement and, to a lesser extent, our allocated share of a curtailment gain and actuarial loss related to an amendment to certain of SPX’s U.S. pension plans to freeze all benefits for active non-union participants. |
During the fourth and third quarters of 2015, we recorded impairment charges, net of taxes, of $5.4 and $10.9, respectively, related to the trademarks and certain technology assets of certain businesses within our Food and Beverage and Power and Energy reportable segments.
During the third quarter of 2015, we recognized Special Charges, net of taxes, of $16.5 related to the ongoing consolidation and relocation of two manufacturing facilities, located in Germany and Denmark, to an existing facility in Poland.
During the third quarter of 2015 and fourth quarter of 2014, we recorded income tax charges of $7.4 and $18.6, respectively, related to repatriation of certain earnings of our non-U.S. subsidiaries. During the second quarter of 2014, we recorded an income tax charge of $17.0 resulting from increases in valuation allowances recorded against certain deferred income tax assets.
During the fourth and first quarters of 2014, we recognized a loss, net of taxes, of ($16.5) and ($1.1), respectively, related to changes in fair value of plan assets, actuarial losses, and settlement losses associated with our and an allocated share of SPX’s pension and postretirement plans. The fourth quarter settlement loss related to the partial annuitization of SPX’s U.K. Pension Plan and the first quarter settlement loss related to a lump-sum payment action related to one of SPX’s U.S. pension plans.
During the fourth quarter of 2014, we recorded impairment charges, net of taxes, of $9.2 related to the trademarks of certain businesses within our Power and Energy and Industrial reportable segments.
(2) | We establish actual interim closing dates using a fiscal calendar, which requires our businesses to close their books on the Saturday closest to the end of the first calendar quarter, with the second and third quarters being 91 days in length. Our fourth quarter ends on December 31. The interim closing dates for the first, second and third quarters of 2015 were March 28, June 27 and September 26, compared to the respective March 29, June 28 and September 27, 2014 dates. This practice only affects the quarterly reporting periods and not the annual reporting period. We had one less day in the first quarter of 2015 and one more day in the fourth quarter of 2015 than in the respective 2014 periods. |
(17) SUBSEQUENT EVENTS
Global Realignment Program
On February 10, 2016, the Company announced its intent to further optimize its global footprint, streamline business processes and reduce selling, general and administrative expense through a global realignment program. The two year realignment program is intended to reduce costs across operating sites and corporate and global functions, in part by making structural changes which will allow the Company to operate more efficiently.
80
ITEM 9. Changes In and Disagreements with Accountants on Accounting and Financial Disclosure
None.
ITEM 9A. Controls and Procedures
Evaluation of Disclosure Controls and Procedures
SPX FLOW management, including the Chief Executive Officer and Chief Financial Officer, conducted an evaluation of the effectiveness of the Company's disclosure controls and procedures (as such term is defined in Rules 13a-15(e) and 15d-15(e) under the Securities Exchange Act of 1934, as amended (the "Exchange Act")), as of December 31, 2015. Based on that evaluation, the Chief Executive Officer and Chief Financial Officer concluded as of December 31, 2015, that the Company's disclosure controls and procedures were effective in ensuring that information required to be disclosed by the Company in reports that it files or submits under the Exchange Act has been recorded, processed, summarized and reported, within the time periods specified in the Commission's rules and forms, and that such information has been accumulated and communicated to the Company's management including its Chief Executive Officer and Chief Financial Officer, as appropriate, to allow timely decisions regarding required disclosure.
Management's Report on Internal Control Over Financial Reporting
This Annual Report on Form 10-K does not include a report of management’s assessment regarding internal control over financial reporting or an attestation report of the Company’s registered public accounting firm due to a transition period established by the rules of the SEC for newly public companies.
Changes in Internal Control Over Financial Reporting
Before the Spin-Off, the Company relied on certain financial information and resources of SPX to manage aspects of the Company’s business and to report financial results. These resources included executive management, investor relations, corporate communications, finance and accounting, legal, and human resources support, benefit plan administration and reporting, general management, real estate, treasury, insurance and risk management, and oversight functions, such as the Board of Directors and internal audit, including those functions required for Sarbanes-Oxley compliance. In conjunction with the Spin-Off, the Company enhanced its own financial, administrative, and other support systems. The Company formed its accounting, reporting, legal, and internal audit departments and reformed its policies and systems, as needed, to meet all regulatory requirements on a stand-alone basis. While most of these changes in staffing, policies and systems were accomplished prior to December 31, 2015, we continue to review, document and test our internal controls over financial reporting, and may from time to time make changes aimed at enhancing their effectiveness and to ensure that our systems evolve with our business. These efforts may lead to changes in our internal control over financial reporting.
ITEM 9B. Other Information
None.
PART III
ITEM 10. Directors, Executive Officers and Corporate Governance
a) Directors of the Company.
This information is included in our definitive proxy statement for the 2016 Annual Meeting of Stockholders under the heading "Election of Directors" and is incorporated herein by reference.
b) Executive Officers of the Company.
Marcus G. Michael, 52, is President and Chief Executive Officer, having succeeded Christopher J. Kearney effective January 1, 2016. He was also named a director at that time. He was previously President of our Food and Beverage segment. Prior to the Spin-Off, he was President, Flow Technology—Food and Beverage of SPX Corporation, and was appointed an officer of SPX in December 2014. He joined SPX Corporation in 2003 and prior to his most recent position held various senior
81
positions within the company, including President of the company’s global evaporative and dry cooling businesses and President of Flow Technology’s EMEA region. Prior to joining SPX Corporation, Mr. Michael held positions at General Electric and TDK Corporation.
Jeremy W. Smeltser, 41, is Vice President and Chief Financial Officer. He was previously Vice President and Chief Financial Officer of SPX Corporation, where he served in various roles, most recently as Vice President and Chief Financial Officer, Flow Technology, and became an officer of SPX Corporation in April 2009. He joined SPX Corporation in 2002 from Ernst & Young LLP, where he was an audit manager in Tampa, Florida. Prior to that, he held various positions with Arthur Andersen LLP, in Tampa, Florida, and Chicago, Illinois, focused primarily on assurance services for global manufacturing clients.
Stephen A. Tsoris, 58, is Vice President, Secretary and General Counsel. He was previously Vice President, Secretary and General Counsel of SPX Corporation since April 2015. Mr. Tsoris joined SPX Corporation in 2008 as the assistant general counsel, corporate development, where he played a major role in many significant acquisitions, divestitures and strategic ventures. Prior to joining SPX Corporation, he was a partner at Gardner Carton & Douglas LLP where in addition to working with a wide spectrum of clients across many industries, he supported SPX Corporation on over fifty M&A transactions.
David A. Kowalski, 57, is President, Global Manufacturing Operations. He was previously President, Global Manufacturing Operations of SPX Corporation since August 2013. Since August 2011, he also has served as President of the SPX Industrial Products group of businesses. He joined SPX Corporation in 1999 as the Vice President and General Manager of Tools and Equipment at Service Solutions and was named President of Service Solutions in 2004. He became the segment President, Test and Measurement, and an officer of the company in August 2005. Before joining SPX, he held positions with American National Can Company, J.I. Case, Picker International and Warner Swasey.
Anthony A. Renzi, 67, is President, Power and Energy. He was previously President, Flow Technology—Power and Energy of SPX Corporation, and was appointed an officer of the company in December 2014. He joined SPX Corporation in 2003 and prior to his most recent position, he held various senior positions within the company, including President, SPX Dehydration and Filtration; President, SPX Process Equipment; President, APV; Senior Vice President, Global Operations; and President, Flow Technology—Clyde Union and Americas region. Prior to joining SPX Corporation, Mr. Renzi held positions at James Burn International, Clopay, Breed Technologies, Sundstrand and General Electric.
David J. Wilson, 47, is President, Industrial. He was previously President, Flow Technology—Industrial, of SPX Corporation and was appointed an officer of the company in December 2014. He joined SPX Corporation in 1998 and prior to his most recent position, he held various senior positions within the company, including President, Asia Pacific region for both Flow Technology and the company’s Service Solutions business, and Vice President, Business Development for the Thermal Equipment and Services segment. Prior to joining SPX Corporation, Mr. Wilson held operating and engineering leadership positions at Polaroid Corporation.
Belinda G. Hyde, 45, is Vice President and Chief Human Resources Officer. She was previously Vice President and Chief Human Resources Officer of SPX Corporation since July 2015. Ms. Hyde served as the Senior Vice President and Chief Human Resources Officer of Schnitzer Steel Industries, Inc. from October 2011 until joining SPX Corporation. Prior to joining Schnitzer, Ms. Hyde was Vice President of Human Resources with Celanese Corporation from 2008 to 2011. Previously, she led the talent management, development, and communications functions for biotech Life Technologies from 2005 to 2008. Ms. Hyde also worked at Dell Computer from 2000 to 2005 in a variety of human resources leadership positions.
Kevin J. Eamigh, 45, is the Chief Information Officer and Vice President, Global Business Services, with overall strategic and operational responsibility of the global Information Technologies and Shared Services organizations, the role he previously held at SPX Corporation. Mr. Eamigh joined SPX Corporation in 2000 and held various positions within information technology services and business management. He was named Chief Information Officer of SPX Corporation in 2009 and accepted the additional responsibility of the Shared Services organization in June 2012. He was appointed an officer of SPX Corporation in July 2015. Mr. Eamigh joined SPX Corporation in 2000 and has since served in various other positions within information technology services and business management. Mr. Eamigh began his career with IBM in Dallas, TX prior to co-founding PrimeSource Technologies, a business technology consulting firm based in Scottsdale, AZ.
c) Section 16(a) Beneficial Ownership Reporting Compliance.
This information is included in our definitive proxy statement for the 2016 Annual Meeting of Stockholders under the heading "Section 16(a) Beneficial Ownership Reporting Compliance" and is incorporated herein by reference.
82
d) Code of Ethics.
This information is included in our definitive proxy statement for the 2016 Annual Meeting of Stockholders under the heading "Corporate Governance" and is incorporated herein by reference.
e) Other Matters.
Information regarding our Audit Committee and Nominating and Governance Committee is set forth in our definitive proxy statement for the 2016 Annual Meeting of Stockholders under the headings "Corporate Governance" and "Board Committees" and is incorporated herein by reference.
ITEM 11. Executive Compensation
This information is included in our definitive proxy statement for the 2016 Annual Meeting of Stockholders under the headings "Executive Compensation" and "Director Compensation" and is incorporated herein by reference.
ITEM 12. Security Ownership of Certain Beneficial Owners and Management and Related Stockholder Matters
This information is included in our definitive proxy statement for the 2016 Annual Meeting of Stockholders under the headings "Ownership of Common Stock" and "Equity Compensation Plan Information" and is incorporated herein by reference.
ITEM 13. Certain Relationships and Related Transactions, and Director Independence
This information is included in our definitive proxy statement for the 2016 Annual Meeting of Stockholders under the heading "Corporate Governance" and is incorporated herein by reference.
ITEM 14. Principal Accountant Fees and Services
This information is included in our definitive proxy statement for the 2016 Annual Meeting of Stockholders under the heading "Ratification of the Appointment of Independent Public Accountants" and is incorporated herein by reference.
83
PART IV
ITEM 15. Exhibits and Financial Statement Schedules
The following documents are filed as part of this Form 10-K:
1. | All financial statements. See Index to Consolidated and Combined Financial Statements on page 37 of this Form 10-K. |
2. | Financial Statement Schedules. None required. See page 37 of this Form 10-K. |
3. | Exhibits. See Index to Exhibits. |
84
SIGNATURES
Pursuant to the requirements of Section 13 or 15(d) of the Securities Exchange Act of 1934, the Registrant has duly caused this report to be signed on its behalf by the undersigned, thereunto duly authorized on this 12th day of February, 2016.
SPX FLOW, Inc. | ||||
(Registrant) | ||||
By | /s/ Jeremy W. Smeltser | |||
Jeremy W. Smeltser | ||||
Vice President and Chief Financial Officer | ||||
85
POWER OF ATTORNEY
The undersigned officers and directors of SPX FLOW, Inc. hereby severally constitute Marcus G. Michael and Jeremy W. Smeltser and each of them singly our true and lawful attorneys, with full power to them and each of them singly, to sign for us in our names in the capacities indicated below the Annual Report on Form 10-K filed herewith and any and all amendments thereto, and generally do all such things in our name and on our behalf in our capacities as officers and directors to enable SPX FLOW, Inc. to comply with the provisions of the U.S. Securities and Exchange Commission, hereby ratifying and confirming our signatures as they may be signed by our said attorneys, or any one of them on the Annual Report on Form 10-K and any and all amendments thereto.
Pursuant to the requirements of the Securities Exchange Act of 1934, this report has been signed below by the following persons on behalf of the Registrant and in the capacities indicated on this 12th day of February, 2016.
/s/ Marcus G. Michael | /s/ Jeremy W. Smeltser | |
Marcus G. Michael | Jeremy W. Smeltser | |
President, Chief Executive Officer and Director | Vice President and Chief Financial Officer | |
/s/ Jaime M. Easley | /s/ Christopher J. Kearney | |
Jaime M. Easley | Christopher J. Kearney | |
Corporate Controller and Chief Accounting Officer | Non-Executive Chairman of the Board of Directors | |
/s/ Anne K. Altman | /s/ Patrick D. Campbell | |
Anne K. Altman | Patrick D. Campbell | |
Director | Director | |
/s/ Emerson U. Fullwood | /s/ Robert F. Hull, Jr. | |
Emerson U. Fullwood | Robert F. Hull, Jr. | |
Director | Director | |
/s/ Terry S. Lisenby | /s/ David V. Singer | |
Terry S. Lisenby | David V. Singer | |
Director | Director | |
86
INDEX TO EXHIBITS
Item No. | Description | |
2.1 | Separation and Distribution Agreement, dated as of September 22, 2015, by and between SPX FLOW, Inc. and SPX Corporation, incorporated by reference from the Company’s Current Report on Form 8-K filed on September 28, 2015 (file no. 1-37393). | |
3.1 | Amended and Restated Certificate of Incorporation of SPX FLOW, Inc., incorporated by reference from the Company’s Current Report on Form 8-K filed on September 28, 2015 (file no. 1-37393). | |
3.2 | Certificate of Change of Registered Agent and/or Registered Office, incorporated by reference from the Company’s Current Report on Form 8-K filed on October 26, 2015 (file no. 1-37393). | |
3.3 | Amended and Restated Bylaws of SPX FLOW, Inc., incorporated by reference from the Company’s Current Report on Form 8-K filed on September 28, 2015 (file no. 1-37393). | |
4.1 | Indenture, dated as of August 16, 2010 between SPX Corporation, the Initial Subsidiary Guarantors (as defined therein), and U.S. Bank National Association, as trustee, incorporated herein by reference from the SPX Corporation Current Report on Form 8-K filed on August 17, 2010 (file no. 1-6948). | |
4.2 | First Supplemental Indenture, dated as of January 23 2014, among SPX Corporation, the Additional Guarantors (as defined therein), and U.S. Bank National Association, as Trustee, to the Indenture dated as of August 16, 2010, incorporated herein by reference from the SPX Corporation Current Report on Form 8-K filed on January 24, 2014 (file no. 1-6948). | |
4.3 | Second Supplemental Indenture, dated as of November 7, 2014, among SPX Corporation, the Subsidiary Guarantors (as defined therein), and U.S. Bank National Association, as Trustee, to the Indenture, dated as of August 16, 2010, incorporated herein by reference from SPX Corporation's Current Report on Form 8-K filed on November 10, 2014 (file no. 1-6948). | |
4.4 | Third Supplemental Indenture, dated as of September 22, 2015, by and between SPX FLOW, Inc. and U.S. Bank National Association, as Trustee, to the Indenture dated as of August 16, 2010, incorporated by reference from the Company’s Current Report on Form 8-K filed on September 28, 2015 (file no. 1-37393). | |
4.5 | Fourth Supplemental Indenture, dated as of September 24, 2015, by and among SPX FLOW, Inc., the Guarantors (as defined herein) and U.S. Bank National Association, as Trustee, to the Indenture dated as of August 16, 2010, incorporated by reference from the Company’s Current Report on Form 8-K filed on September 28, 2015 (file no. 1-37393). | |
10.1 | Transition Services Agreement, dated as of September 26, 2015, by and between SPX FLOW, Inc. and SPX Corporation, incorporated by reference from the Company’s Current Report on Form 8-K filed on September 28, 2015 (file no. 1-37393). | |
10.2 | Tax Matters Agreement, dated as of September 26, 2015, by and between SPX FLOW, Inc. and SPX Corporation, incorporated by reference from the Company’s Current Report on Form 8-K filed on September 28, 2015 (file no. 1-37393). | |
10.3 | Employee Matters Agreement, dated as of September 26, 2015, by and between SPX FLOW, Inc. and SPX Corporation, incorporated by reference from the Company’s Current Report on Form 8-K filed on September 28, 2015 (file no. 1-37393). | |
10.4 | Trademark License Agreement, dated as of September 26, 2015, by and between SPX FLOW, Inc. and SPX Corporation, incorporated by reference from the Company’s Current Report on Form 8-K filed on September 28, 2015 (file no. 1-37393). | |
10.5* | SPX FLOW Stock Compensation Plan, incorporated by reference from the Company’s Current Report on Form 8-K filed on September 28, 2015 (file no. 1-37393). | |
10.6* | Form of SPX FLOW Stock Option Award Agreement, incorporated by reference from the Company’s Current Report on Form 8-K filed on September 28, 2015 (file no. 1-37393). | |
10.7* | Form of SPX FLOW Restricted Stock Unit Award Agreement, incorporated by reference from the Company’s Current Report on Form 8-K filed on September 28, 2015 (file no. 1-37393). | |
10.8* | Form of SPX FLOW Restricted Stock Award Agreement, incorporated by reference from the Company’s Current Report on Form 8-K filed on September 28, 2015 (file no. 1-37393). | |
10.9* | SPX FLOW Executive Annual Bonus Plan, incorporated by reference from the Company’s Current Report on Form 8-K filed on September 28, 2015 (file no. 1-37393). | |
10.10* | SPX FLOW Supplemental Retirement Plan for Top Management, incorporated by reference from the Company’s Current Report on Form 8-K filed on September 28, 2015 (file no. 1-37393). | |
87
Item No. | Description | |
10.11* | SPX FLOW Life Insurance Plan for Key Managers, incorporated by reference from the Company’s Current Report on Form 8-K filed on September 28, 2015 (file no. 1-37393). | |
10.12* | SPX FLOW Supplemental Retirement Savings Plan, incorporated by reference from the Company’s Current Report on Form 8-K filed on September 28, 2015 (file no. 1-37393). | |
10.13* | SPX FLOW Executive Long-Term Disability Plan, incorporated by reference from the Company’s Current Report on Form 8-K filed on September 28, 2015 (file no. 1-37393). | |
10.14* | Form of Assignment and Assumption of and Amendment to Employment Agreement, incorporated by reference from the Company’s Current Report on Form 8-K filed on September 28, 2015 (file no. 1-37393). | |
10.15* | Form of Assignment and Assumption of and Amendment to Change of Control Agreement, incorporated by reference from the Company’s Current Report on Form 8-K filed on September 28, 2015 (file no. 1-37393). | |
10.16 | Credit Agreement, dated as of September 1, 2015, among SPX FLOW, Inc., the Foreign Subsidiary Borrowers party thereto, Bank of America, N.A., as Administrative Agent, Deutsche Bank AG Deutschlandgeschäft Branch, as Foreign Trade Facility Agent, and the other agents and lenders party thereto, incorporated by reference from SPX Corporation’s Current Report on Form 8-K filed on September 1, 2015 (file no. 1-6948). | |
10.17* | Form of SPX FLOW Confidentiality and Non-Competition Agreement, incorporated by reference from the Company’s Quarterly Report on Form 10-Q for the period ended September 26, 2015 (file no. 1-37393). | |
10.18* | Amendment to the SPX FLOW Supplemental Retirement Savings Plan, incorporated by reference from the Company’s Quarterly Report on Form 10-Q for the period ended September 26, 2015 (file no. 1-37393). | |
10.19* | Separation Agreement Between J. Michael Whitted and SPX FLOW, Inc., incorporated herein by reference from the Company’s Form 8-K/A filed December 31, 2015 (file no. 1-37393). | |
10.20* | Employment Agreement between Marcus G. Michael and SPX FLOW, Inc., incorporated herein by reference from the Company’s Form 8-K/A filed January 8, 2016 (file no. 1-37393). | |
10.21* | Change of Control Agreement between Marcus G. Michael and SPX FLOW, Inc., incorporated herein by reference from the Company’s Form 8-K/A filed January 8, 2016 (file no. 1-37393). | |
10.22* | Amended and Restated Employment Agreement between SPX Corporation and Christopher J. Kearney, incorporated herein by reference from the SPX Corporation Annual Report on Form 10-K for the year ended December 31, 2008 (file no. 1-6948). | |
10.23* | Amended and Restated Employment Agreement between SPX Corporation and Robert B. Foreman, incorporated herein by reference from the SPX Corporation Annual Report on Form 10-K for the year ended December 31, 2008 (file no. 1-6948). | |
10.24* | Amended and Restated Employment Agreement between SPX Corporation and David A. Kowalski, incorporated herein by reference from the SPX Corporation Annual Report on Form 10-K for the year ended December 31, 2008 (file no. 1-6948). | |
10.25* | Employment Agreement between SPX Corporation and Jeremy W. Smeltser, incorporated herein by reference to the SPX Corporation Quarterly Report on Form 10-Q for the quarter ended June 27, 2009 (file no. 1-6948). | |
10.26* | Employment Agreement between SPX Corporation and J. Michael Whitted, incorporated herein by reference to SPX Corporation's Quarterly Report on Form 10-Q for the quarter ended June 27, 2009 (file no. 1-6948). | |
10.27* | Amendment to Change of Control Agreement between SPX Corporation and J. Michael Whitted, incorporated herein by reference to SPX Corporation's Quarterly Report on Form 10-Q for the quarter ended June 27, 2009 (file no. 1-6948). | |
10.28* | Change of Control Agreement between Christopher J. Kearney and SPX Corporation, as amended and restated December 2, 2013, incorporated herein by reference from SPX Corporation's Current Report on Form 8-K filed on December 5, 2013 (file no. 1-6948). | |
10.29* | Change of Control Agreement between Jeremy W. Smeltser and SPX Corporation, as amended and restated December 2, 2013, incorporated herein by reference from SPX Corporation's Current Report on Form 8-K filed on December 5, 2013 (file no. 1-6948). | |
10.30* | Change of Control Agreement between Robert B. Foreman and SPX Corporation, as amended and restated December 2, 2013, incorporated herein by reference from SPX Corporation's Current Report on Form 8-K filed on December 5, 2013 (file no. 1-6948). | |
10.31* | Change of Control Agreement between David A. Kowalski and SPX Corporation, as amended and restated December 2, 2013, incorporated herein by reference from SPX Corporation's Current Report on Form 8-K filed on December 5, 2013 (file no. 1-6948). | |
88
Item No. | Description | |
10.32* | Change of Control Agreement between J. Michael Whitted and SPX Corporation, as amended and restated December 2, 2013, incorporated herein by reference from SPX Corporation's Current Report on Form 8-K filed on December 5, 2013 (file no. 1-6948). | |
10.33* | Form of Waiver of Certain Employment Agreement Provisions by each of Christopher J. Kearney, Jeremy W. Smeltser, Robert B. Foreman, David A. Kowalski, Kevin L. Lilly, and J. Michael Whitted, dated December 2, 2013, incorporated herein by reference from SPX Corporation's Current Report on Form 8-K filed on December 5, 2013 (file no. 1-6948). | |
10.34* | Form of Change of Control Agreement between each of Eugene J. Lowe III, Marcus G. Michael, Anthony A. Renzi, Stephen A. Tsoris, Belinda G. Hyde, Kevin J. Eamigh and David J. Wilson, and SPX Corporation, incorporated herein by reference from the SPX Corporation Annual Report on Form 10-K for the year ended December 31, 2014 (file no. 1-6948). | |
11.1 | Statement regarding computation of earnings per share. See consolidated and combined statements of operations on page 39 of this Form 10-K. | |
21.1 | Subsidiaries. | |
23.1 | Consent of Independent Registered Public Accounting Firm. | |
24.1 | Power of Attorney on page 86 of this Annual Report on Form 10-K. | |
31.1 | Certification of Chief Executive Officer pursuant to Section 302 of the Sarbanes-Oxley Act of 2002. | |
31.2 | Certification of Chief Financial Officer pursuant to Section 302 of the Sarbanes-Oxley Act of 2002. | |
32.1 | Certification of Chief Executive Officer and Chief Financial Officer pursuant to 18 U.S.C. Section 1350, adopted pursuant to Section 906 of the Sarbanes-Oxley Act of 2002. | |
101.1 | SPX FLOW, Inc. financial information from its Form 10-K for the annual period ended December 31, 2015, formatted in XBRL, including: (i) Consolidated and Combined Statements of Operations for the years ended December 31, 2015, 2014, and 2013; (ii) Consolidated and Combined Statements of Comprehensive Income (Loss) for the years ended December 31, 2015, 2014, and 2013; (iii) Consolidated and Combined Balance Sheets as of December 31, 2015 and 2014; (iv) Consolidated and Combined Statements of Equity for the years ended December 31, 2015, 2014, and 2013; (v) Consolidated and Combined Statements of Cash Flows for the years ended December 31, 2015, 2014, and 2013; and (vi) Notes to Consolidated and Combined Financial Statements. | |
__________________________________________________________________
* Denotes management contract or compensatory plan or arrangement.
89