Attached files
| file | filename |
|---|---|
| 8-K - SOUTHWEST IOWA RENEWABLE ENERGY, LLC 8-K 2-12-2016 - SOUTHWEST IOWA RENEWABLE ENERGY, LLC | form8k.htm |
Exhibit 99.1

Southwest Iowa Renewable Energy 2016 Annual Meeting
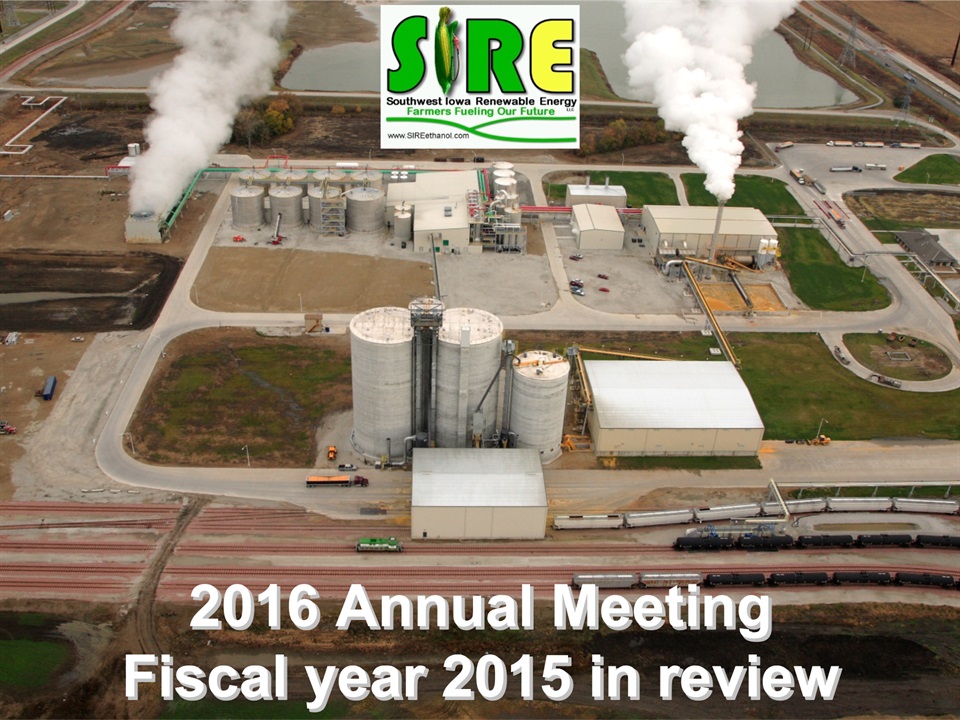
2016 Annual MeetingFiscal year 2015 in review
This presentation contains certain forward-looking statements within the meaning of the Private Securities Litigation Reform Act of 1995. Such statements are made in good faith by Southwest Iowa Renewable Energy, LLC (“SIRE,” “us” or “we”) and are identified by including terms such as “may,” “will,” “should,” “expects,” “anticipates,” “estimates,” “plans,” or similar language. In connection with these safe-harbor provisions, SIRE has identified in its annual report on Form 10-K, and in its other filings with the SEC, important factors that could cause actual results to differ materially from those contained in any forward-looking statement made by or on behalf of SIRE, including, without limitation, the risk and nature of our business and the effects of general economic conditions on us. We may experience significant fluctuations in future operating results due to a number of economic conditions, including, but not limited to, competition in the ethanol industry, commodity market risks, financial market risks, counter-party risks, and risks associated with changes to federal policy or regulation. The cautionary statements and risk factors in this disclaimer and our Form 10-K expressly qualify all of SIRE’s forward-looking statements in this presentation. The forward-looking statements contained in this presentation are included in the safe harbor protection provided by Section 27A of the Securities Act of 1933. SIRE further cautions that such factors are not exhaustive or exclusive. SIRE does not undertake to update any forward-looking statement which may be made from time to time by or on behalf of SIRE unless an update is required by applicable securities laws. Forward-Looking Statements and Disclaimer

Sire leadership team
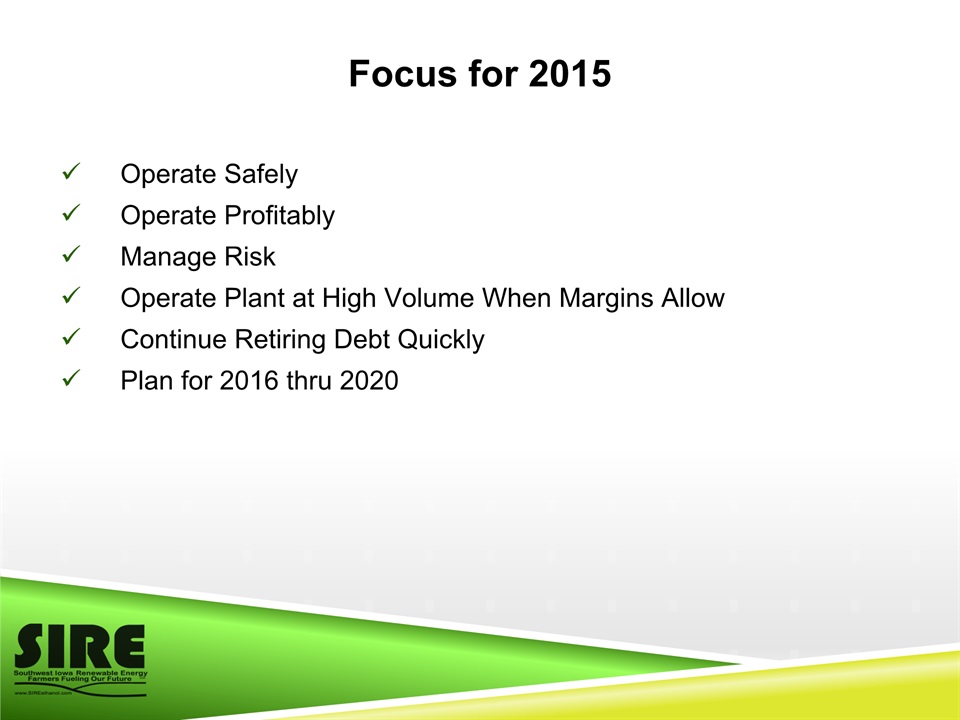
Focus for 2015 Operate SafelyOperate ProfitablyManage RiskOperate Plant at High Volume When Margins Allow Continue Retiring Debt QuicklyPlan for 2016 thru 2020

Total Days Without a Lost Time Day Accident
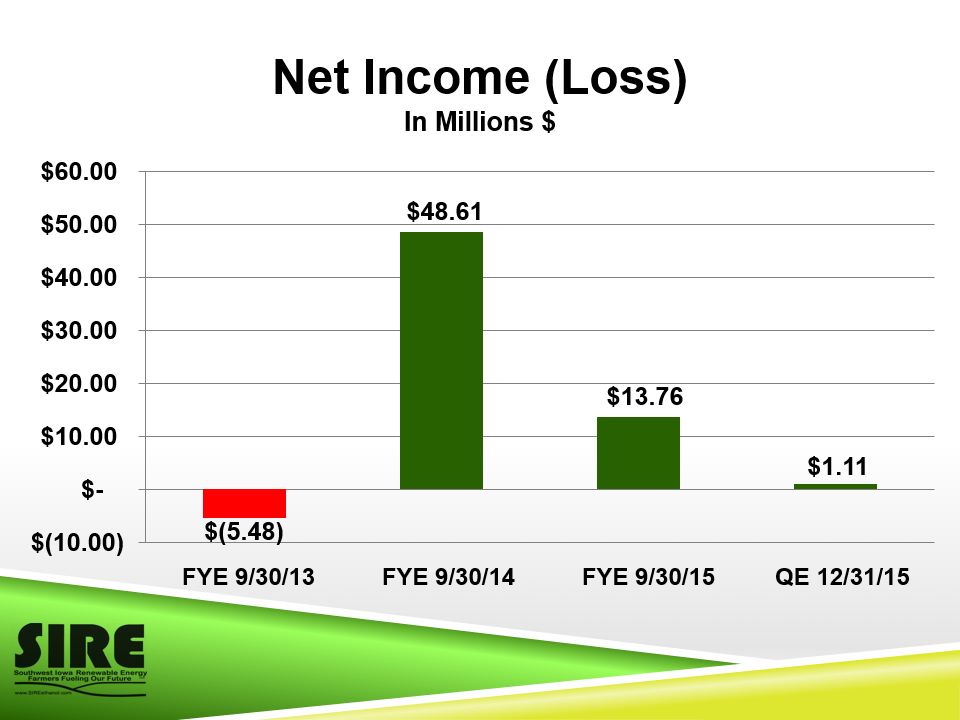
Net Income (Loss)In Millions $ FYE 9/30/13 FYE 9/30/14 FYE 9/30/15 QE 12/31/15
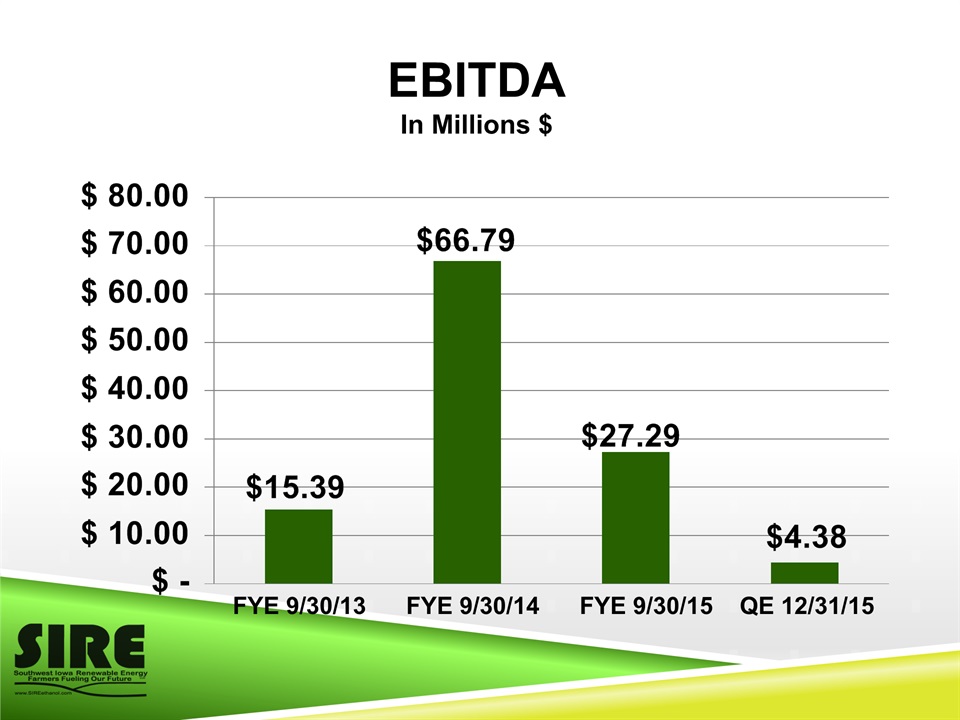
EBITDA In Millions $ FYE 9/30/13 FYE 9/30/14 FYE 9/30/15 QE 12/31/15
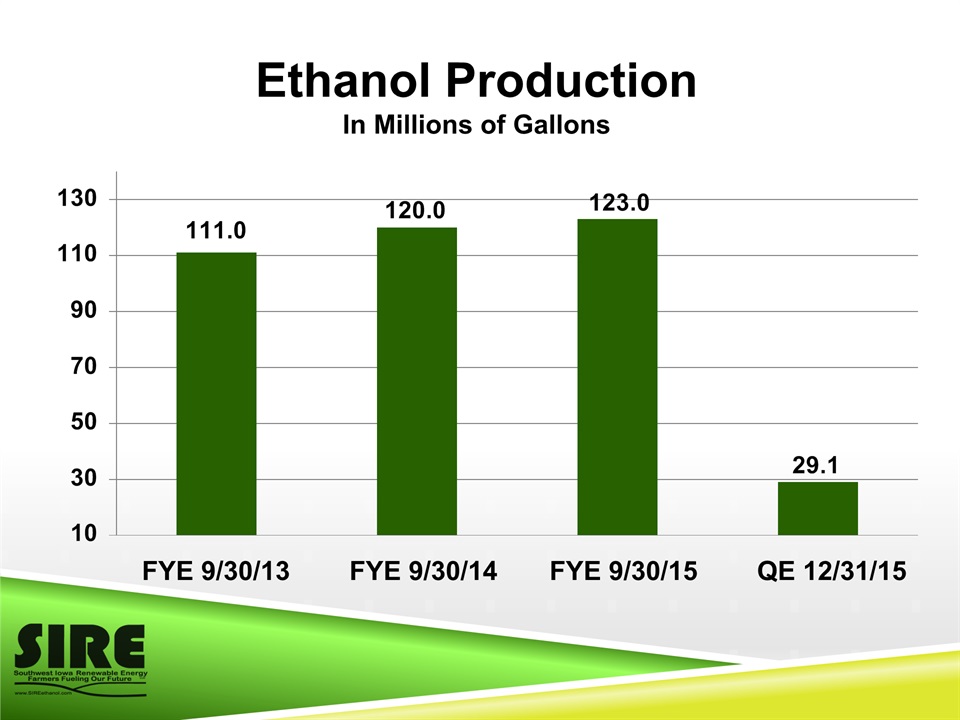
Ethanol ProductionIn Millions of Gallons FYE 9/30/13 FYE 9/30/14 FYE 9/30/15 QE 12/31/15
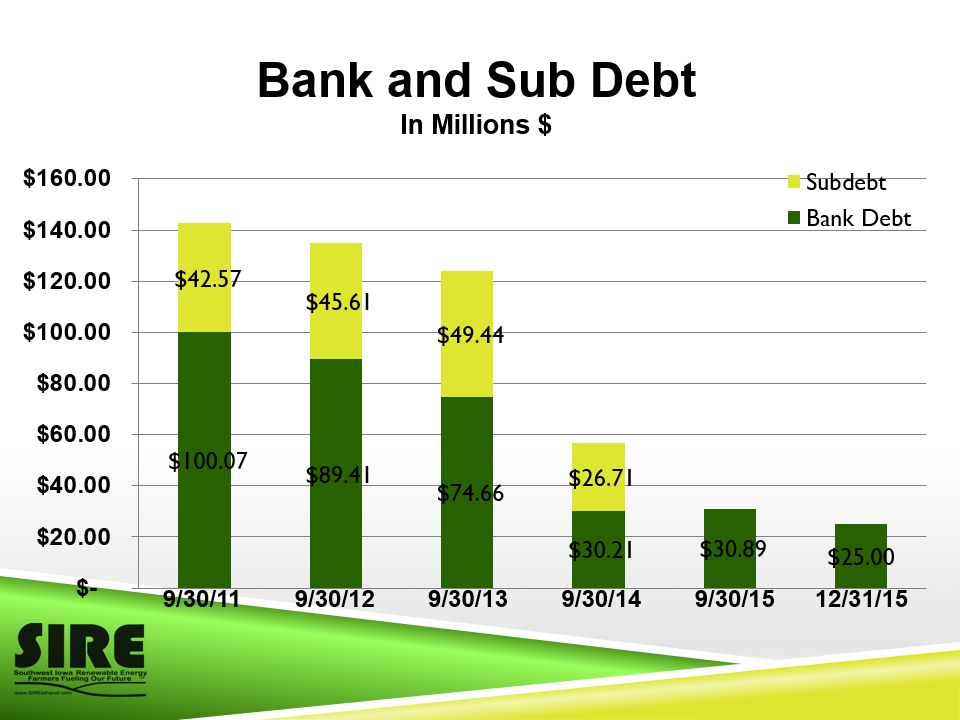
Bank and Sub Debt In Millions $ 9/30/11 9/30/12 9/30/13 9/30/14 9/30/15 12/31/15
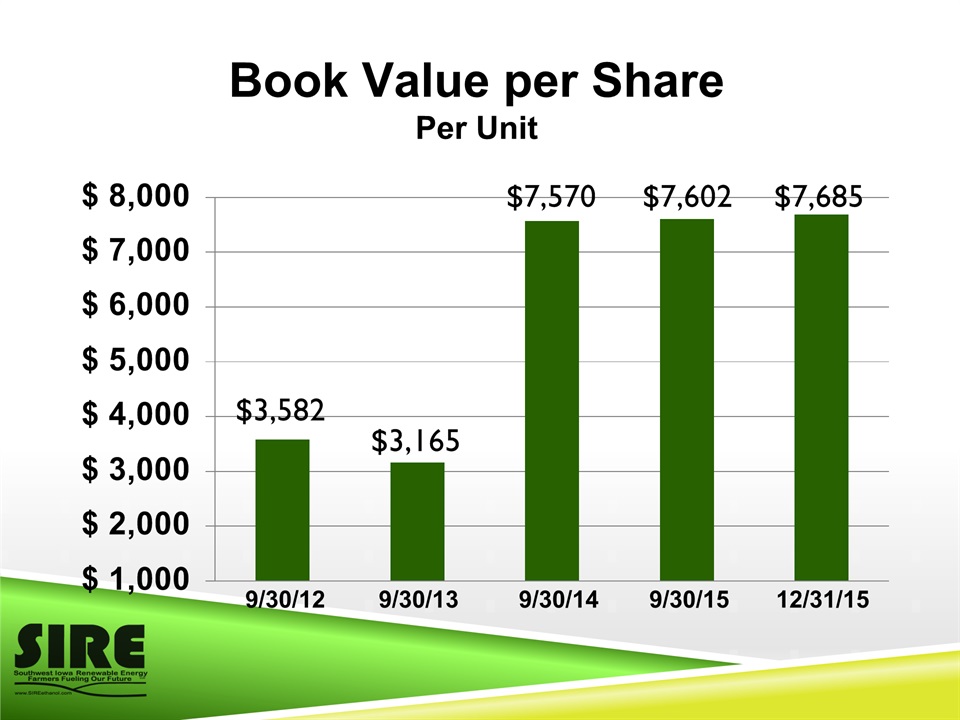
Book Value per SharePer Unit 9/30/12 9/30/13 9/30/14 9/30/15 12/31/15
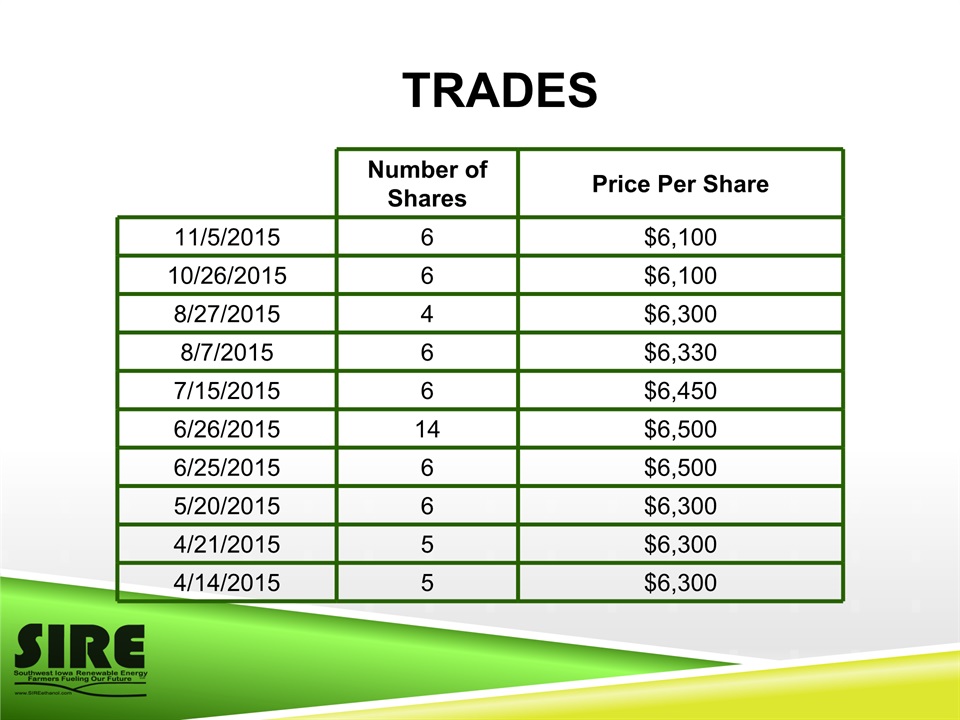
Trades Number of Shares Price Per Share 11/5/2015 6 $6,100 10/26/2015 6 $6,100 8/27/2015 4 $6,300 8/7/2015 6 $6,330 7/15/2015 6 $6,450 6/26/2015 14 $6,500 6/25/2015 6 $6,500 5/20/2015 6 $6,300 4/21/2015 5 $6,300 4/14/2015 5 $6,300
Our 2 new grain bins
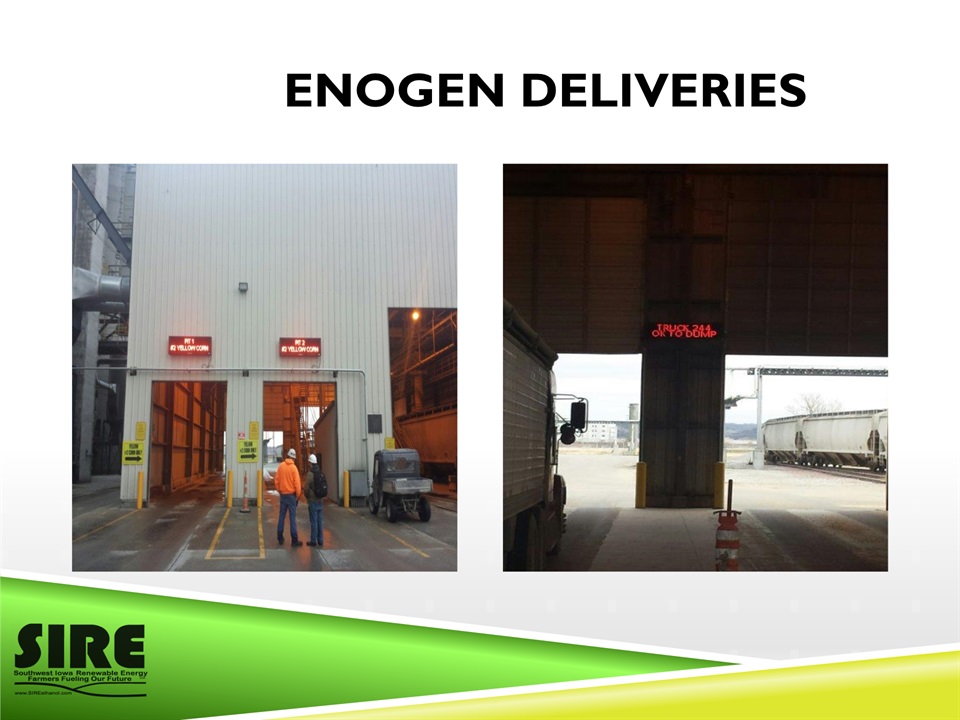
Enogen deliveries

CORN OIL ONE CONSTRUCTION
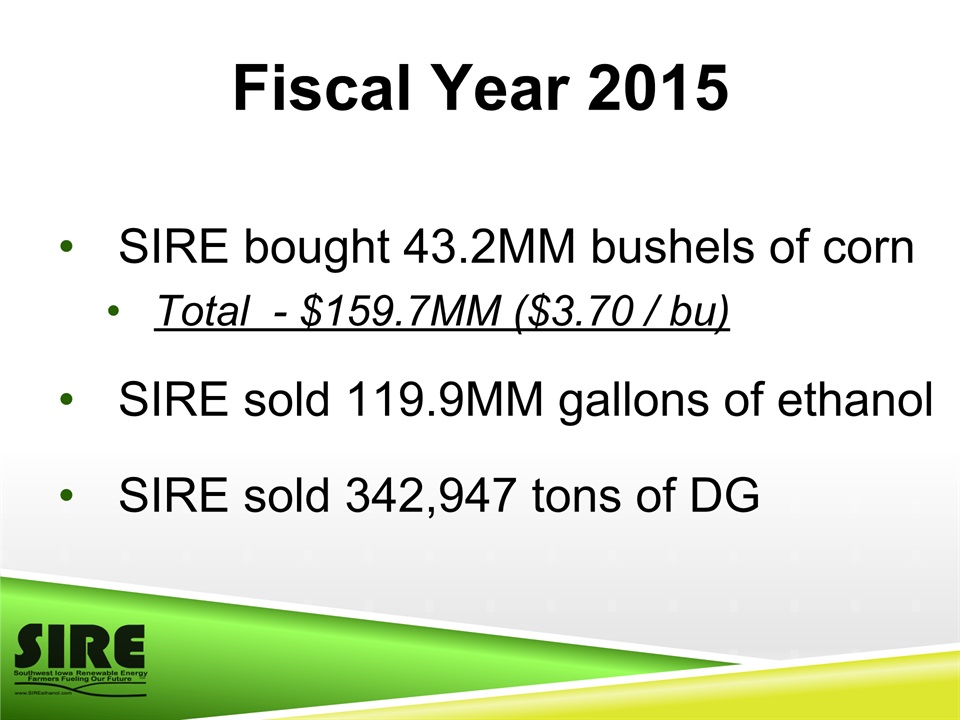
SIRE bought 43.2MM bushels of cornTotal - $159.7MM ($3.70 / bu)SIRE sold 119.9MM gallons of ethanolSIRE sold 342,947 tons of DG Fiscal Year 2015

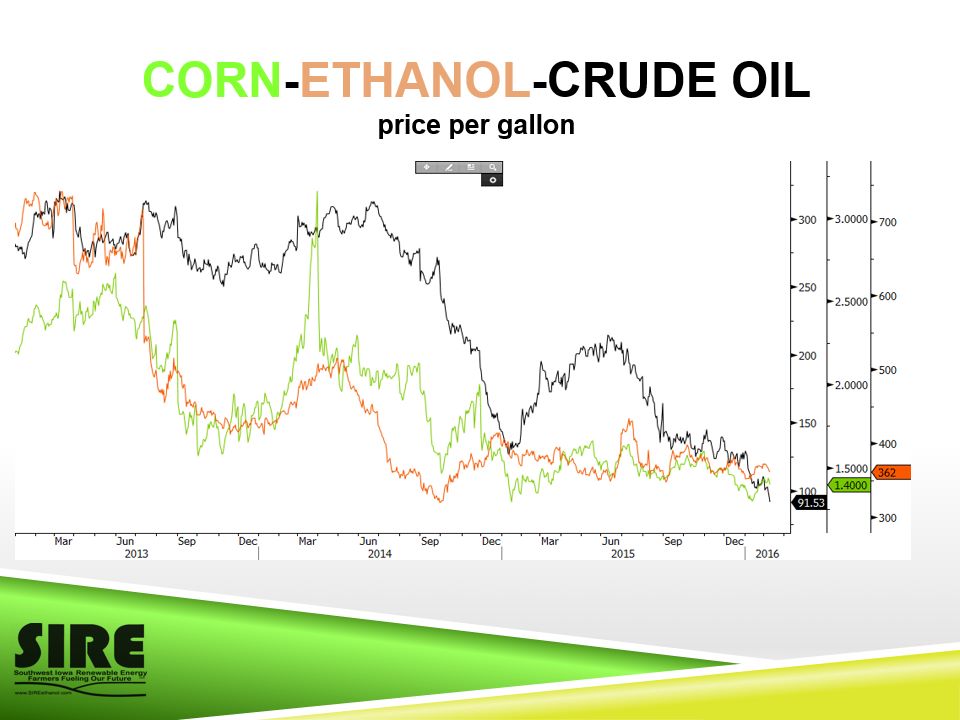
CORN-ETHANOL-CRUDE OILprice per gallon

Focus for 2016 Return to ShareholdersOperate SafelyOperate ProfitablyDiversification Manage RiskLow Cost Ethanol ProducerEnergy - PrecondensorYield – Precondensor and an additional FermentorPlan for 2016 thru 2020Questions ?

Financial Summary January 2016
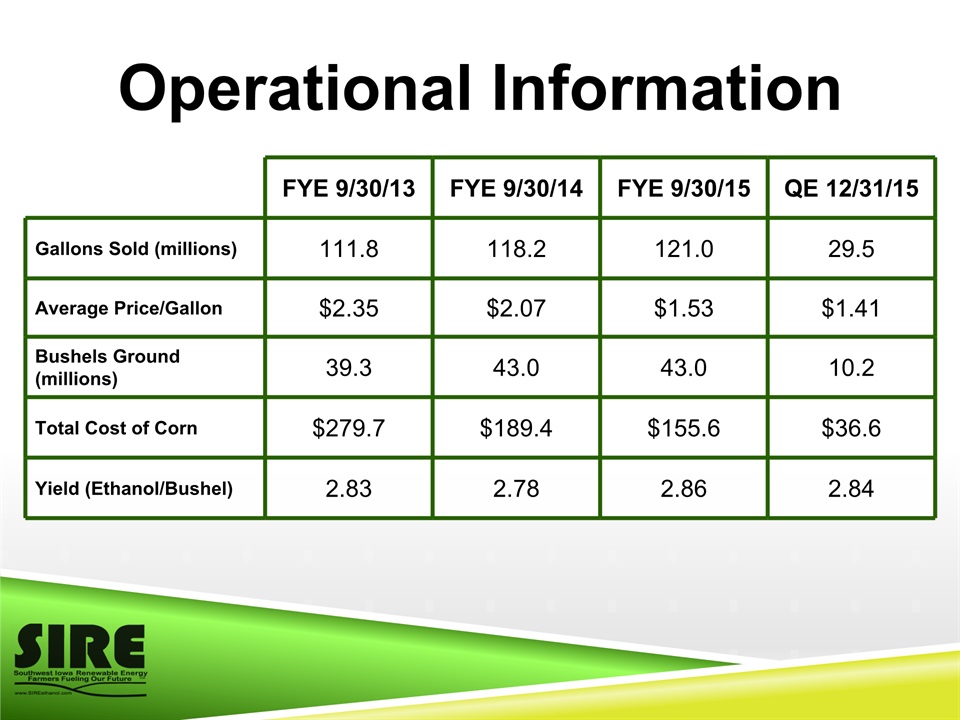
Operational Information FYE 9/30/13 FYE 9/30/14 FYE 9/30/15 QE 12/31/15 Gallons Sold (millions) 111.8 118.2 121.0 29.5 Average Price/Gallon $2.35 $2.07 $1.53 $1.41 Bushels Ground (millions) 39.3 43.0 43.0 10.2 Total Cost of Corn $279.7 $189.4 $155.6 $36.6 Yield (Ethanol/Bushel) 2.83 2.78 2.86 2.84
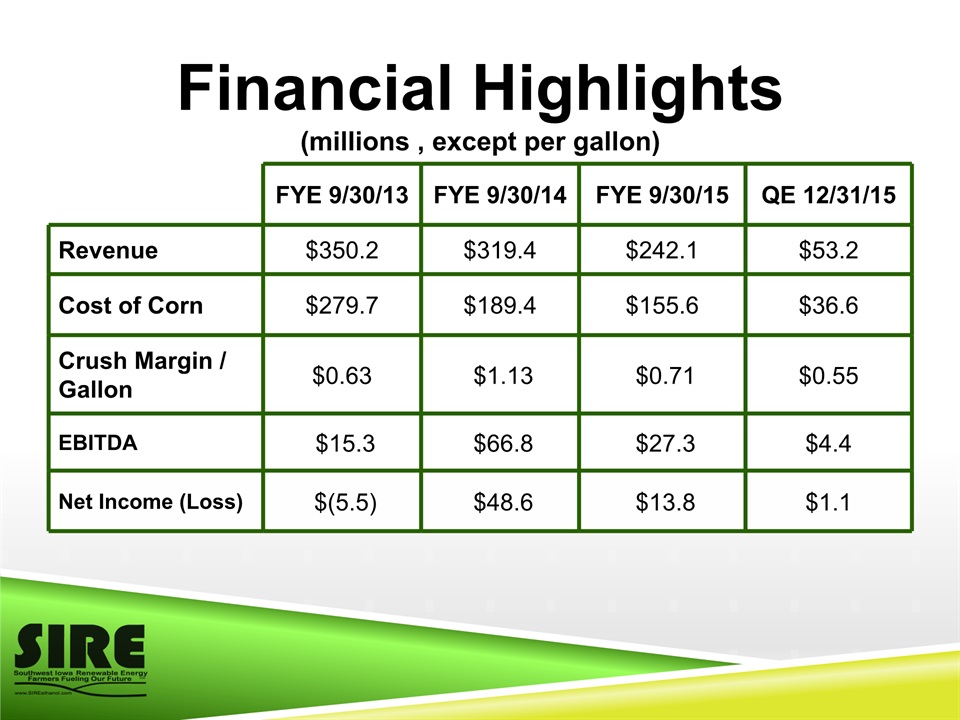
Financial Highlights(millions , except per gallon) FYE 9/30/13 FYE 9/30/14 FYE 9/30/15 QE 12/31/15 Revenue $350.2 $319.4 $242.1 $53.2 Cost of Corn $279.7 $189.4 $155.6 $36.6 Crush Margin / Gallon $0.63 $1.13 $0.71 $0.55 EBITDA $15.3 $66.8 $27.3 $4.4 Net Income (Loss) $(5.5) $48.6 $13.8 $1.1
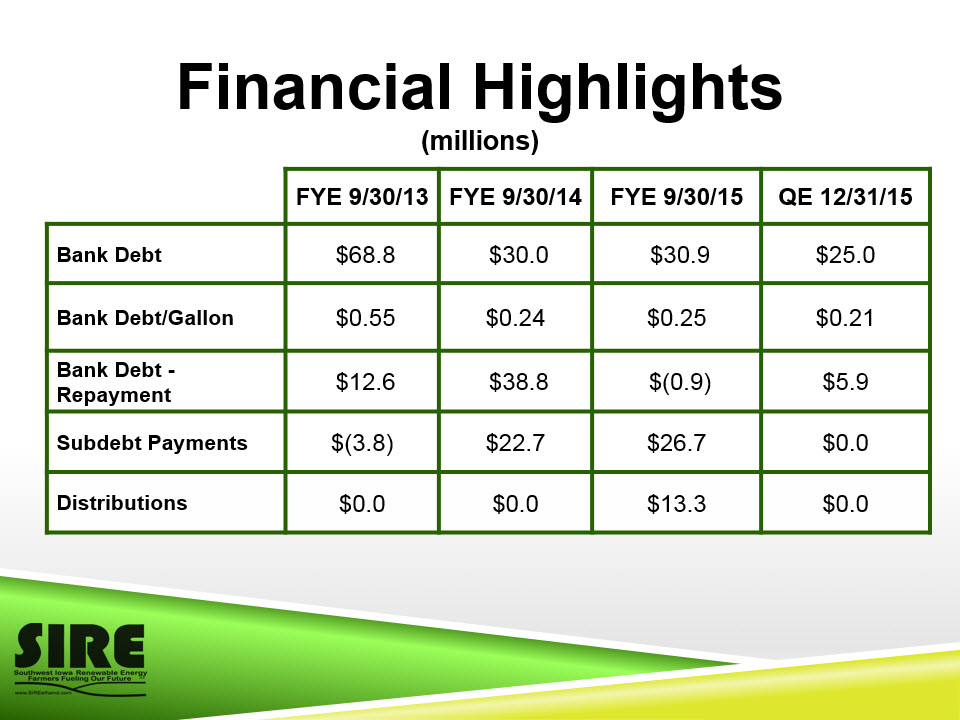
Financial Highlights(millions)) FYE 9/30/13 FYE 9/30/14 FYE 9/30/15 QE 12/31/15 Bank Debt $68.8 $30.0 $30.9 $25.0 Bank Debt/Gallon $0.55 $0.24 $0.25 $0.21 Bank Debt - Repayment $12.6 $38.8 $(0.9) $5.9 Subdebt Payments $(3.8) $22.7 $26.7 $0.0 Distributions $0.0 $0.0 $13.3 $0.0

Quarterly Crush MarginIn Millions $ 6/30/14 9/30/14 12/31/14 3/31/15 6/30/15 9/30/15 12/31/15

LiquidityIn Millions $ 9/30/11 9/30/12 9/30/13 9/30/14 9/30/15 12/31/15
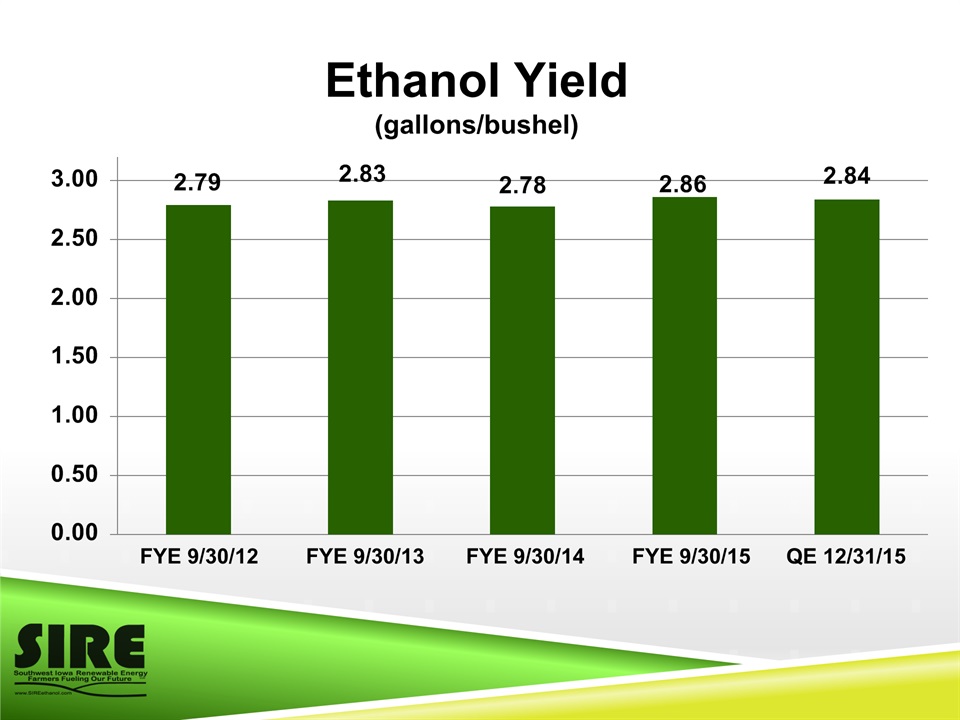
Ethanol Yield (gallons/bushel) FYE 9/30/12 FYE 9/30/13 FYE 9/30/14 FYE 9/30/15 QE 12/31/15
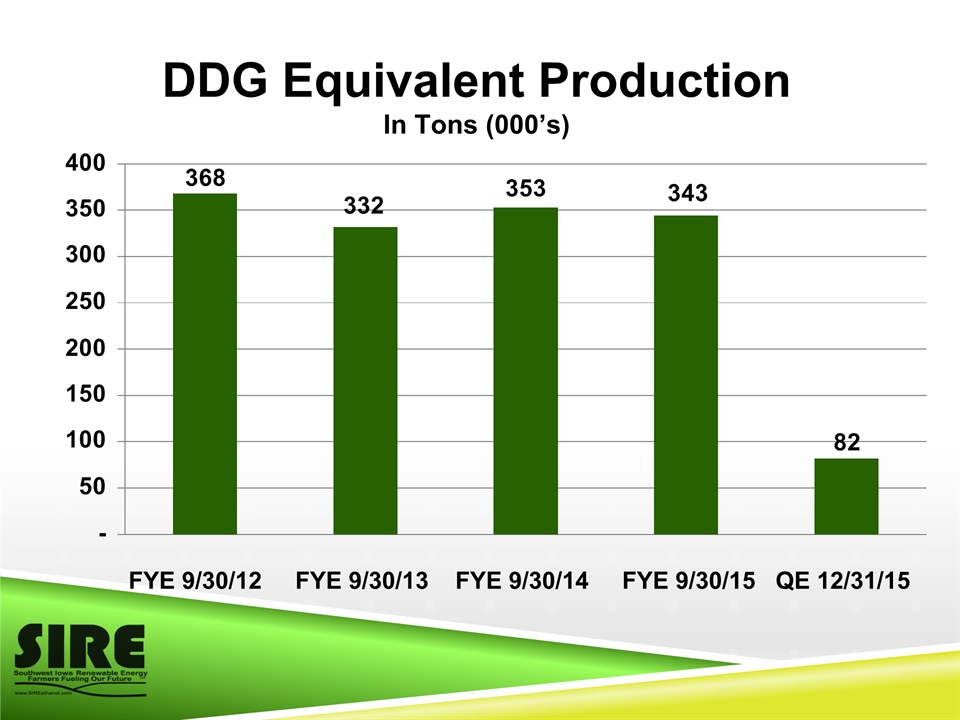
DDG Equivalent ProductionIn Tons (000’s) FYE 9/30/12 FYE 9/30/13 FYE 9/30/14 FYE 9/30/15 QE 12/31/15
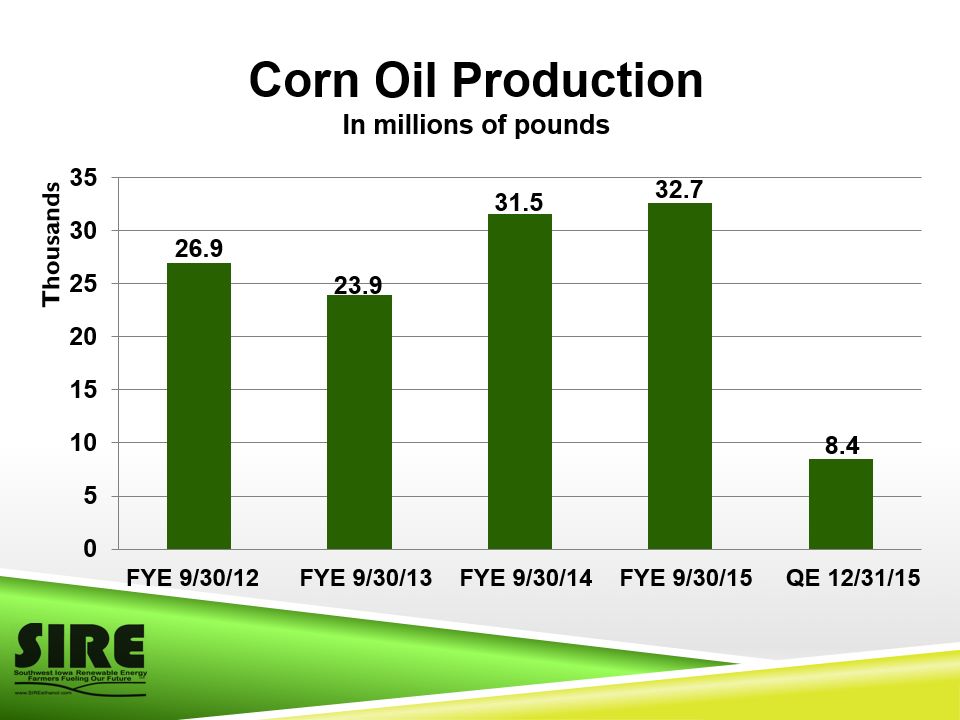
Corn Oil ProductionIn millions of pounds FYE 9/30/12 FYE 9/30/13 FYE 9/30/14 FYE 9/30/15 QE 12/31/15

Southwest Iowa Renewable Energy The SIRE Merchandising Team Powered by Bunge Kristan Barta, Commercial Manager Dustin Ploeger, Senior Merchandiser
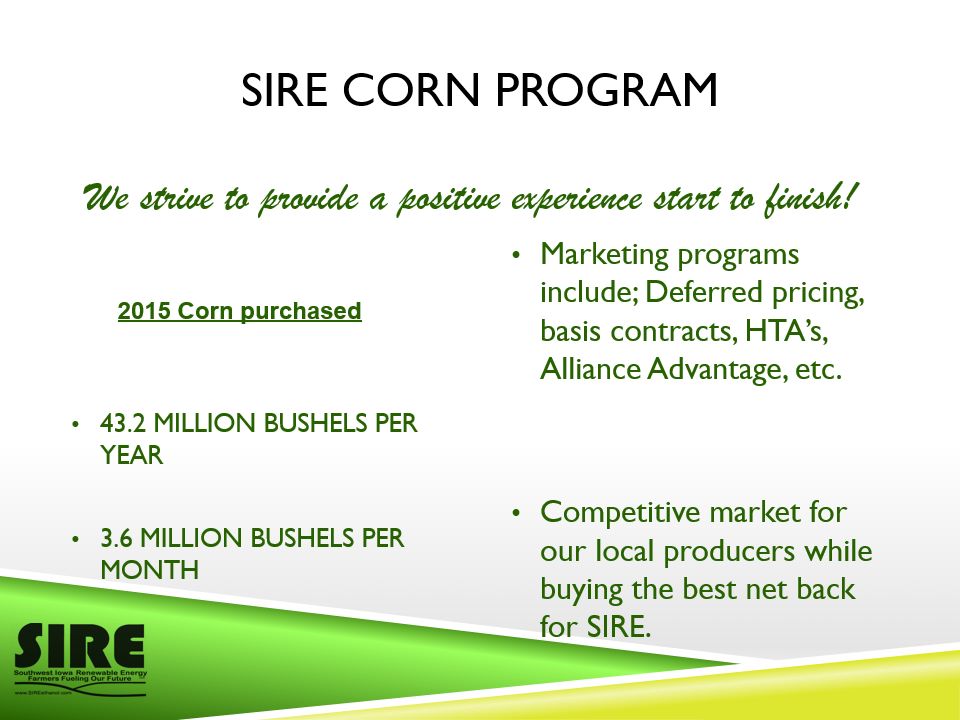
SIRE CORN PROGRAM 43.2 MILLION BUSHELS PER YEAR3.6 MILLION BUSHELS PER MONTH Marketing programs include; Deferred pricing, basis contracts, HTA’s, Alliance Advantage, etc. Competitive market for our local producers while buying the best net back for SIRE. 2015 Corn purchased We strive to provide a positive experience start to finish!
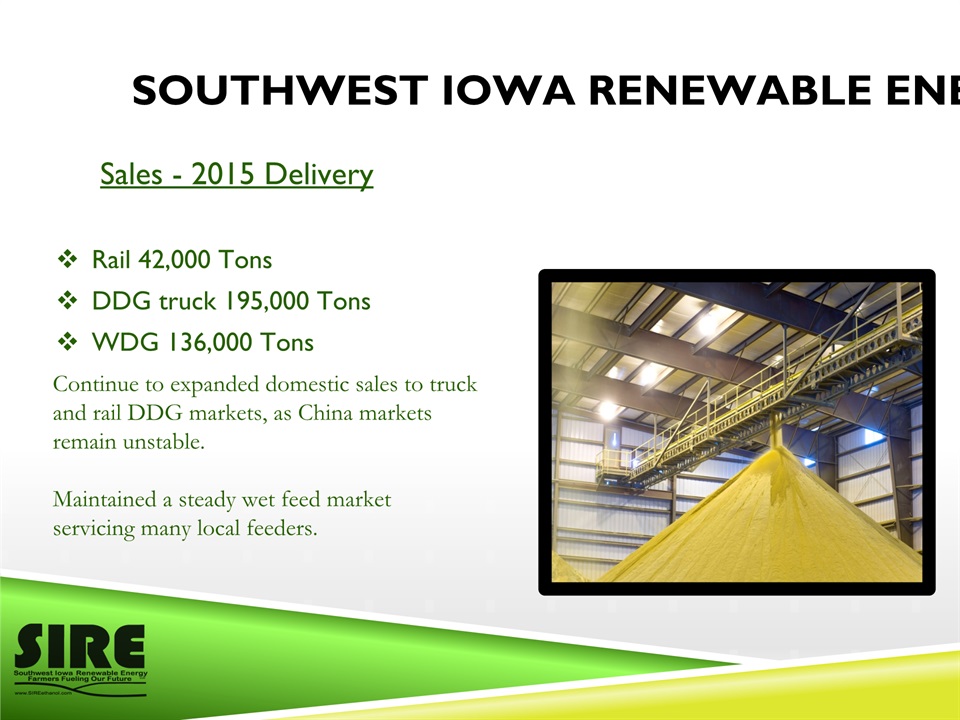
Sales - 2015 Delivery Rail 42,000 Tons DDG truck 195,000 Tons WDG 136,000 Tons Southwest Iowa Renewable Energy Continue to expanded domestic sales to truck and rail DDG markets, as China markets remain unstable. Maintained a steady wet feed market servicing many local feeders.