Attached files
| file | filename |
|---|---|
| 8-K - 8-K WEB Q42015 EARNINGS RELEASE - WEB.COM GROUP, INC. | webq4earningsrelease8-k20.htm |
| EX-99.1 - EXHIBIT 99.1 EARNINGS RELEASE Q4 2015 - WEB.COM GROUP, INC. | ex991earningsreleaseq42015.htm |
| EX-99.3 - EXHIBIT 99.3 YODLE ACQUISITION - WEB.COM GROUP, INC. | ex993webyodlepressrelease.htm |

1 Welcome to Web.com’s Quarterly Earnings Call Please note there are two options for listening to this call: (1) To listen via your computer and view the slides, you can use the default Flash or Windows Media Audio player. (2) To listen via telephone and view synchronized slides, click on the gear icon at the bottom of the screen and select “Live Phone” to view the slides only and then call into the teleconference at 877-407-0789.

4Q 2015 Financial Results & Yodle Acquisition Announcement February 11, 2016
3 Forward-Looking Statements This presentation includes certain "forward-looking statements" including, without limitation, statements regarding the size of the market opportunity for Web.com’s products to small businesses, and whether such products can generate improved revenue growth and profitability for Web.com, statements regarding the expected benefits to be obtained from the acquisition of Yodle, and statements regarding whether Web.com’s products are a unique value proposition, that are subject to risks, uncertainties and other factors that could cause actual results or outcomes to differ materially from those contemplated by the forward-looking statements. These forward-looking statements include, but are not limited to, plans, objectives, expectations and intentions and other statements contained in this presentation that are not historical facts. These statements are sometimes identified by words such as “believe,” “opportunities,” or words of similar meaning. As a result of the ultimate outcome of such risks and uncertainties, Web.com's actual results could differ materially from those anticipated in these forward-looking statements. These statements are based on Web.com's current beliefs or expectations, and there are a number of important factors that could cause the actual results or outcomes to differ materially from those indicated by these forward-looking statements, including, without limitation: the risk that Web.com’s expectations as to demand for its products may not be accurate; consumers may not perceive the value of Web.com’s products to be the same as Web.com does; the acquisition of Yodle is subject to closing conditions which, if not met, may cause the acquisition not to close; Web.com may not realize the benefits it expects from the acquisition of Yodle; and other risks that may impact Web.com's business. Other risk factors are set forth in Web.com’s press releases on February 11, 2016, and under the caption, "Risk Factors," in Web.com's Annual Report on Form 10-K for the year ended December 31, 2014, and Form 10-Q for the quarter ended September 30, 2015, as filed with the Securities and Exchange Commission, which are available on a website maintained by the Securities and Exchange Commission at www.sec.gov. Web.com expressly disclaims any obligation or undertaking to release publicly any updates or revisions to any forward-looking statements contained herein as a result of new information, future events or otherwise. Non-GAAP Measures Some of the measures in this presentation, including adjusted EBITDA, are non-GAAP financial measures within the meaning of the SEC Regulation G. Web.com believes presenting non-GAAP financial measures is useful to investors, because they describe the operating performance of the company, in ways that management views, or uses to assess, the performance of the company. Company management uses these non-GAAP measures as important indicators of the company's past performance and in planning and forecasting performance in future periods. The non-GAAP financial information Web.com presents may not be comparable to similarly-titled financial measures used by other companies, and investors should not consider non-GAAP financial measures in isolation from, or in substitution for, financial information presented in compliance with GAAP. You are encouraged to review the reconciliation of non-GAAP financial measures to GAAP financial measures included in this presentation and in Web.com’s press releases on February 11, 2016, and filings it makes with the Securities and Exchange Commission, which are available at www.sec.gov as well as in this presentation.

4 Agenda ● Corporate Overview – 4Q 2015 Highlights – Full Year 2015 Highlights ● Yodle Acquisition ● Financial Review – 4Q 2015 Financial Performance – 1Q & Full-Year 2016 Financial Guidance ● Q&A David Brown CEO & Chairman Kevin Carney CFO
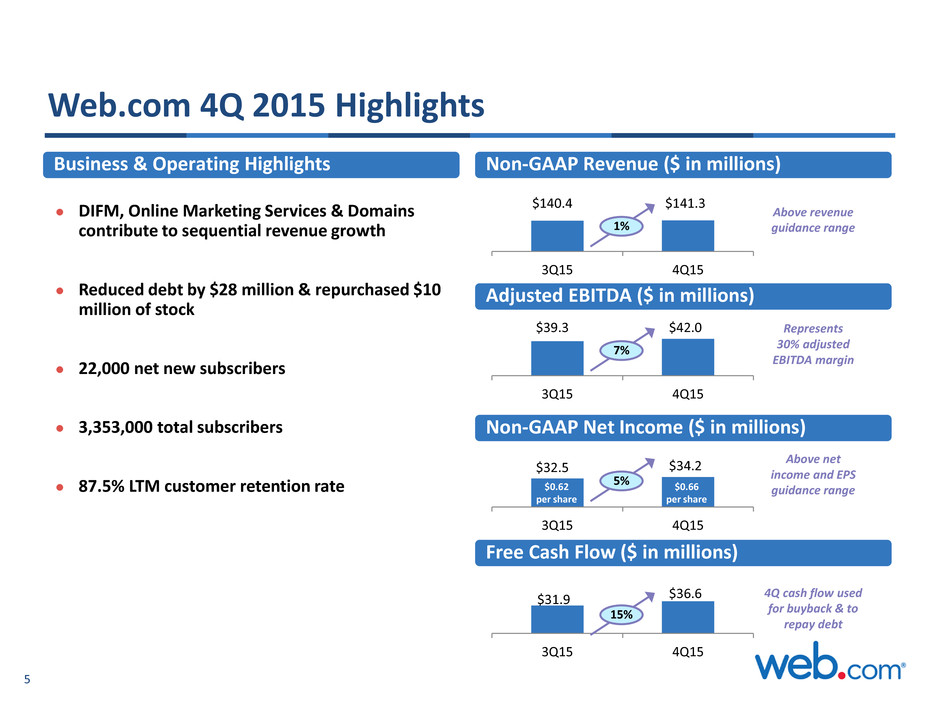
5 ● DIFM, Online Marketing Services & Domains contribute to sequential revenue growth ● Reduced debt by $28 million & repurchased $10 million of stock ● 22,000 net new subscribers ● 3,353,000 total subscribers ● 87.5% LTM customer retention rate $140.4 $141.3 3Q15 4Q15 1% Above revenue guidance range $39.3 $42.0 3Q15 4Q15 7% Represents 30% adjusted EBITDA margin $32.5 $34.2 3Q15 4Q15 5% Above net income and EPS guidance range $31.9 $36.6 3Q15 4Q15 15% 4Q cash flow used for buyback & to repay debt $0.62 per share $0.66 per share Web.com 4Q 2015 Highlights Business & Operating Highlights Non-GAAP Revenue ($ in millions) Adjusted EBITDA ($ in millions) Non-GAAP Net Income ($ in millions) Free Cash Flow ($ in millions)
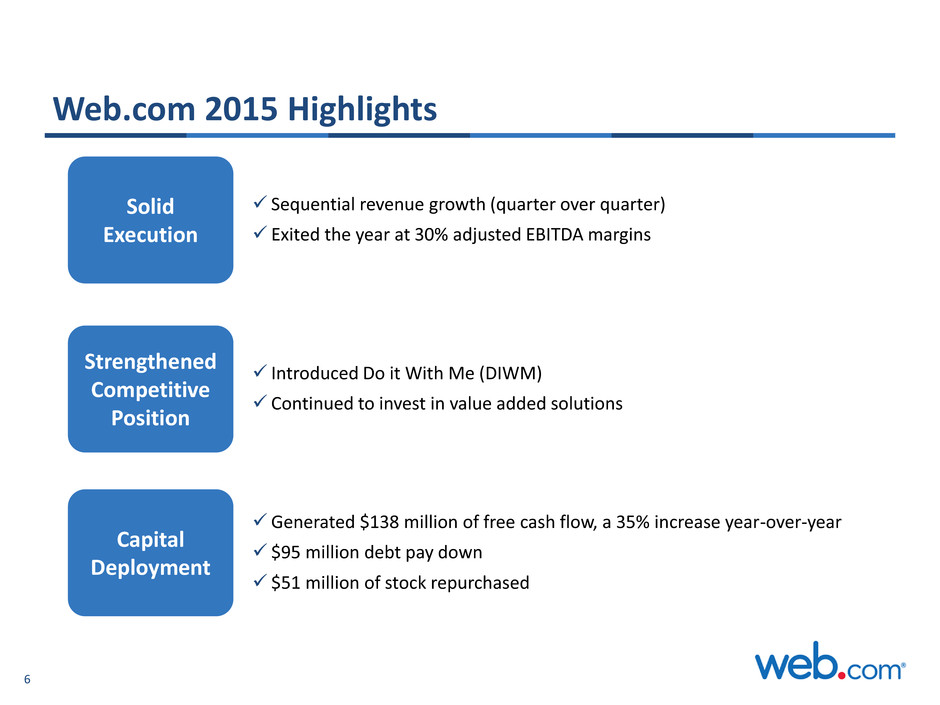
6 Web.com 2015 Highlights Sequential revenue growth (quarter over quarter) Exited the year at 30% adjusted EBITDA margins Solid Execution Introduced Do it With Me (DIWM) Continued to invest in value added solutions Strengthened Competitive Position Generated $138 million of free cash flow, a 35% increase year-over-year $95 million debt pay down $51 million of stock repurchased Capital Deployment

7 Acquisition of Yodle Strong Strategic Fit Strengthens Web.com’s leadership and competitive position in value-added digital marketing solutions for small businesses Increases Growth Accelerates top line growth and addresses high growth markets Adds Scale Increases operational and financial scale with value-added digital marketing solutions representing 50% of pro-forma revenue mix Significant Synergies Significant cost synergies, NOL’s and cross/up-sell opportunities Accretive in 1st year Expect to be accretive to non-GAAP EPS within the first year of closing

8 Yodle Overview 1 Unaudited 2 FY 2015 Cloud Based Local Marketing Solutions Founded in 2005 Headquartered in New York City ~1,400 employees Overview ~58,000 subscribers ~ $300 monthly ARPU Local: ~ 700 person inside sales team Key Operational Metrics $208 million in 2015 revenue 73% gross margins2 Key Financial Metrics1 Marketing Optimization Office Automation Franchise Management Automation Advertising Automation Scheduling Invoices Payments Email Marketing Reputation Management SEO Pay per Click advertising Optimized sponsored ad campaign Online management dashboard Actionable Business Intelligence Brand Management

9 Web.com + Yodle Focused on Large, High Growth Markets $ billions Note: Figures represent U.S. market ¹ Odin (2015 SMB Cloud Insights) ² eMarketer (March 24, 2015). SMB’s are a subset of digital ad spending $6.3 2015 $12.0 2015-2018 CAGR Digital Ad Spending2 12% SMB Business Apps1 24% SMB Web Presence1 6% 2018 Growth Scale Synergy / Accretion Strategic Fit 1

10 Yodle is Aligned with Web.com’s Strategic Positioning Presence Engagement Value Added Solutions Interaction Value Added Solutions • Domain • Hosting •Website • Local listings • Social • SEO • Local Search / Digital Ad Spending • eCommerce • Customer reviews • Coupons and offers • Lead nurturing • Geo targeting • Time and event triggers • Appointment reminders • Contacts management • Email marketing • Business apps A R P U Customer Size and Sophistication Broad suite of solutions targeted for small businesses Growth Scale Synergy / Accretion Strategic Fit 2

11 Yodle Accelerates Web.com’s Expansion into Key Value Added Digital Marketing Solutions Franchise / Multi-location Vertical Market Focus Office Automation Applications Team and go-to market strategy in place to further scale Accelerates vertically- focused product and distribution strategy Increases operational embeddedness and customer retention • Purpose built franchise marketing automation solution • 20+ sales professionals • 200 relationships / ~9,000 locations • Deep specialized expertise and content in specific verticals – Dental – Chiropractors – Auto • Robust solution for appointment and scheduling management • Solution suite allows online/field payment collection Growth Scale Synergy / Accretion Strategic Fit 2

12 Accelerates Web.com’s Goal to be a Leading Provider of Value-Added Solutions to SMBs Web.com Revenue Mix (non-GAAP) $119 $136 $167 $172 ~ $226 $3,600 + Competitors Annual ARPU1 Domains, DIY, Hosting Value Added Solutions 31% Value Added Solutions 50% Value Added Solutions 100% Source: Company filings, management estimates 1 GDDY Q315 reported, WIX Q3 15 reported annualized, WEB Q4 15 reported annualized, EIGI Q3 15 reported annualized; WEB + Yodle FY pro-forma; Yodle Q4 15 annualized Growth Scale Synergy / Accretion Strategic Fit 3
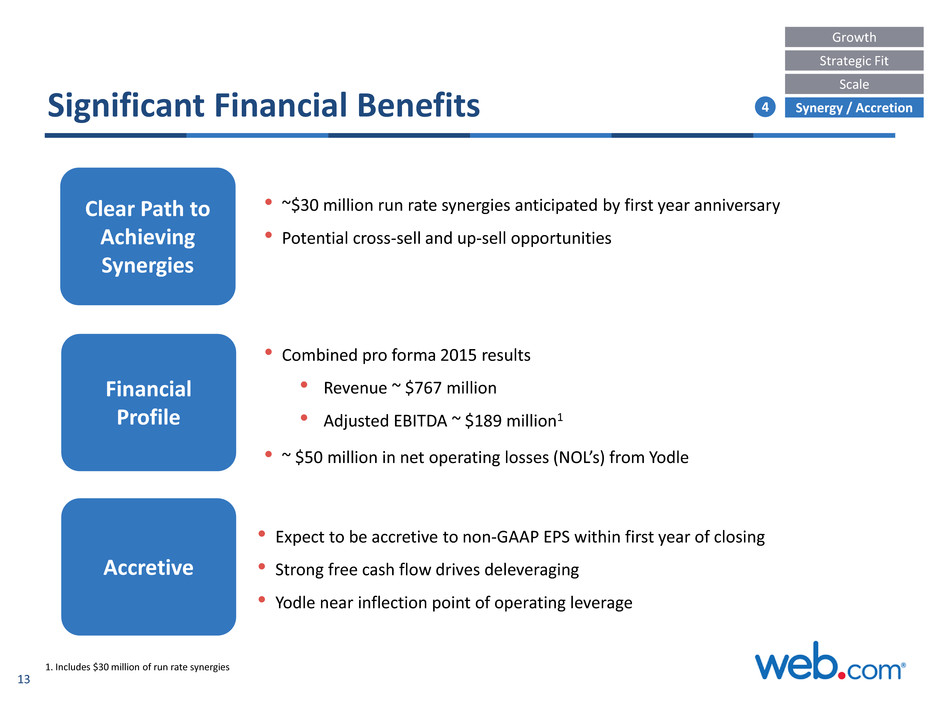
13 Significant Financial Benefits • ~$30 million run rate synergies anticipated by first year anniversary • Potential cross-sell and up-sell opportunities Clear Path to Achieving Synergies • Expect to be accretive to non-GAAP EPS within first year of closing • Strong free cash flow drives deleveraging • Yodle near inflection point of operating leverage Accretive Financial Profile • Combined pro forma 2015 results • Revenue ~ $767 million • Adjusted EBITDA ~ $189 million1 Growth Scale Synergy / Accretion Strategic Fit 4 • ~ $50 million in net operating losses (NOL’s) from Yodle 1. Includes $30 million of run rate synergies

14 Web.com’s Proven M&A Competency Initial Public Offering (2005) Renovation Experts (2006) SubmitAWebsite (2007) LogoYes / DesignLogic (2008) Solid Cactus (2009) Web.com (2007) 1shopping.com (2006) SnapNames (2014) Scoot (2014) (2010) (2011) (2016) Successfully integrated products, technology, and sales organization from multiple businesses Proven ability to cross-sell and up-sell to increase ARPU Significant synergy realization

15 Transaction Overview • Acquire 100% outstanding shares of Yodle in all cash transaction1 ‒ $300 million cash paid at close ‒ $20 million cash paid on first anniversary of close date ‒ $22 million cash paid on second anniversary of close date Consideration Financing • Approved by Web.com and Yodle Boards • Will require certain regulatory approvals • Closing expected by the end of the first quarter of 2016, subject to customary closing conditions Closing • Bank debt financing fully committed at attractive pricing (L + 300 with step downs) ‒ ~ $100 million draw from $150 million Amended Revolving Credit Facility (nearly $50 million of unused capacity post-close) ‒ $200 million from New Senior Secured Term Loan A • Extending credit facility maturity to 5 years • 4.0x PF leverage2 1. Final purchase price is subject to customary working capital adjustments 2. Includes $30 million of run rate synergies

16 Pro Forma Capital Structure – Low Cost, Committed Bank Financing 1 Based on $30 million of estimated run-rate synergies 2Numbers may not foot due to rounding Pro Forma Capital Structure ($ 000’s) Pro Forma Debt / 2015 Adjusted EBITDA ($ 000’s) Stand Alone As of 12/31/2015 Pro Forma Adjustments Pro Forma As of 12/31/2015 Interest Rate Term Loan A $193 $200 $393 L + 300 with step downs upon deleveraging Revolving Credit Facility $5 $100 $105 L + 300 with step downs upon deleveraging Secured Debt $198 $300 $498 Senior Convertible Notes $259 – $259 1% Fixed Total Gross Debt $456 $300 $756 Cash ($19) – ($19) Net Debt $438 $300 $738 ($ 000’s) Stand Alone As of 12/31/2015 Pro Forma As of 12/31/2015 100% Synergies1 Adjusted EBITDA $156 $189 Secured Debt / Adj EBITDA 1.3x 2.6x Unsecured Debt / Adj EBITDA 1.7x 1.4x Total Gross Debt / Adj EBITDA 2.9x 4.0x

17 Pro Forma 2015 Customers Employees Monthly ARPU Non-GAAP Revenue Non-GAAP Gross Margin Adjusted EBITDA Adjusted EBITDA margin ~3.4mm ~2,200 ~$14 $559mm 67% $156mm 28% 58,000+ ~1,400 $300+ $208mm 73% $3mm 2% ~3.4mm ~3,600 ~$19 $767mm 69% $159mm 21% = Adjusted EBITDA w/ synergies1 Adjusted EBITDA w/ synergies margin1 $156mm 28% $33mm1 16%1 $189mm1 25%1 1 Assumes estimated run-rate synergies of ~ $30 million FY 2015

18 Web.com Non-GAAP Results ($ in millions except per share data) Q4 15 Q3 15 Q4 14 Non-GAAP Revenue $141.3 $140.4 $140.4 Net subscriber growth (000's) 22 15 21 Subscribers (000's) 3,353 3,331 3,276 ARPU $13.92 $13.90 $14.07 Non-GAAP gross profit $95.7 $94.6 $92.4 Non-GAAP gross margin 68% 67% 66% Non-GAAP operating income $36.9 $35.3 $33.4 Non-GAAP operating margin 26% 25% 24% Non-GAAP net income $34.2 $32.5 $30.3 Non-GAAP EPS (diluted) $0.66 $0.62 $0.57 Adjusted EBITDA $42.0 $39.3 $37.2 Adjusted EBITDA margin 30% 28% 27%

19 Web.com 4Q and Full Year 2015 GAAP Results ($ in millions except per share data) Q4 15 2015 Revenue $138.3 $543.5 Gross Profit $92.1 $355.0 Income From Operations $18.9 $61.7 Net Income $77.0 $90.0 Diluted Net Income Per Share $1.48 $1.72

20 Web.com Cash Flow Generation Cash from Operations ($mm) $36.4 $40.2 4Q14 4Q15 +10% Free Cash Flow ($mm) $34.0 $36.6 4Q14 4Q15 +8% Note: Free cash flow is calculated as operating cash flow less capital expenditures.

21 Web.com Summary Balance Sheet 12/31/14 3/31/15 6/30/15 9/30/15 12/31/15 Cash $22.5 $16.7 $15.9 $18.4 $18.7 Accounts Receivable, net $16.9 $17.2 $14.3 $13.2 $12.9 Deferred Expenses $113.7 $118.0 $112.7 $110.9 $109.5 Debt (current & long-term) Term Loan $198.7 $197.5 $196.2 $195.0 $192.5 Revolver $94.0 $77.7 $49.0 $30.2 $5.0 Convertible Debt $258.8 $258.8 $258.8 $258.8 $258.8 Total Debt (Gross) $551.5 $534.0 $504.0 $484.0 $456.3 Less: Debt Discount (OID) ($45.0) ($41.5) ($38.7) ($35.9) ($33.7) Total Debt (Net) $506.5 $492.5 $465.3 $448.1 $422.6 Deferred Revenue $402.7 $413.4 $414.5 $411.9 $410.6 Stockholders’ Equity $174.1 $164.7 $163.2 $165.2 $238.2 ($mm)
22 Appendix

23 Reconciliation of GAAP to Non-GAAP Results (in thousands, unaudited) Reconciliation of GAAP revenue to non-GAAP revenue Three months ended December 31, Three months ended September 30, Twelve months ended December 31, 2015 2014 2015 2014 2015 2014 GAAP revenue $ 138,320 $ 134,511 $ 136,821 $ 137,407 $ 543,461 $ 543,937 Fair value adjustment to deferred revenue 3,017 5,855 3,547 6,425 15,909 26,163 Non-GAAP revenue $ 141,337 $ 140,366 $ 140,368 $ 143,832 $ 559,370 $ 570,100

24 Reconciliation of GAAP to Non-GAAP Results (in thousands, unaudited) Reconciliation of GAAP net income (loss) to non-GAAP net income Three months ended December 31, Three months ended September 30, Twelve months ended December 31, 2015 2014 2015 2014 2015 2014 GAAP net income (loss) $ 76,977 $ (8,734) $ 6,094 $ (3,419) $ 89,961 $ (12,458) Amortization of intangibles 9,817 11,563 9,827 16,653 39,283 60,719 Asset impairment - 2,040 - - - 2,040 Stock based compensation 4,813 5,040 5,067 5,085 20,064 19,567 Income tax (benefit) expense (62,697) 11,885 5,673 4,250 (48,260) 21,544 Restructuring expense 224 166 - - 559 166 Corporate development 2 - - 459 599 499 Amortization of debt discounts and fees 2,900 2,746 2,872 2,678 11,392 10,932 Cash income tax expense (1,000) (499) (725) (345) (2,512) (1,243) Fair value adjustment to deferred revenue 3,017 5,855 3,547 6,425 15,909 26,163 Fair value adjustment to deferred expense 128 215 147 242 633 1,027 Loss on debt extinguishment - - - 1,838 - 1,838 Non-GAAP net income $ 34,181 $ 30,277 $ 32,502 $ 33,866 $ 127,628 $ 130,794
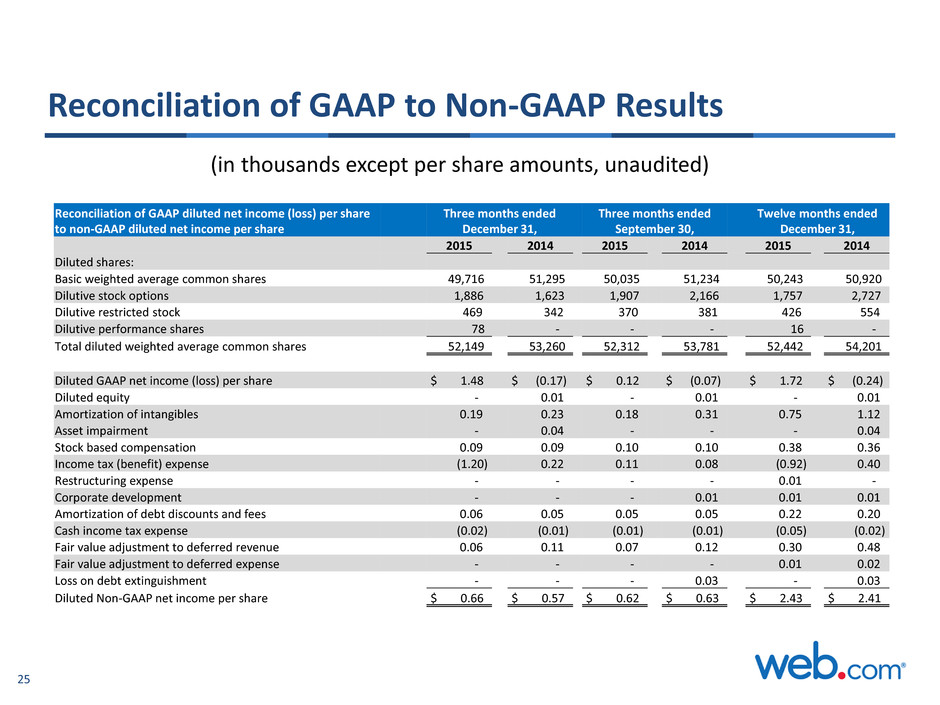
25 Reconciliation of GAAP to Non-GAAP Results (in thousands except per share amounts, unaudited) Reconciliation of GAAP diluted net income (loss) per share to non-GAAP diluted net income per share Three months ended December 31, Three months ended September 30, Twelve months ended December 31, 2015 2014 2015 2014 2015 2014 Diluted shares: Basic weighted average common shares 49,716 51,295 50,035 51,234 50,243 50,920 Dilutive stock options 1,886 1,623 1,907 2,166 1,757 2,727 Dilutive restricted stock 469 342 370 381 426 554 Dilutive performance shares 78 - - - 16 - Total diluted weighted average common shares 52,149 53,260 52,312 53,781 52,442 54,201 Diluted GAAP net income (loss) per share $ 1.48 $ (0.17) $ 0.12 $ (0.07) $ 1.72 $ (0.24) Diluted equity - 0.01 - 0.01 - 0.01 Amortization of intangibles 0.19 0.23 0.18 0.31 0.75 1.12 Asset impairment - 0.04 - - - 0.04 Stock based compensation 0.09 0.09 0.10 0.10 0.38 0.36 Income tax (benefit) expense (1.20) 0.22 0.11 0.08 (0.92) 0.40 Restructuring expense - - - - 0.01 - Corporate development - - - 0.01 0.01 0.01 Amortization of debt discounts and fees 0.06 0.05 0.05 0.05 0.22 0.20 Cash income tax expense (0.02) (0.01) (0.01) (0.01) (0.05) (0.02) Fair value adjustment to deferred revenue 0.06 0.11 0.07 0.12 0.30 0.48 Fair value adjustment to deferred expense - - - - 0.01 0.02 Loss on debt extinguishment - - - 0.03 - 0.03 Diluted Non-GAAP net income per share $ 0.66 $ 0.57 $ 0.62 $ 0.63 $ 2.43 $ 2.41
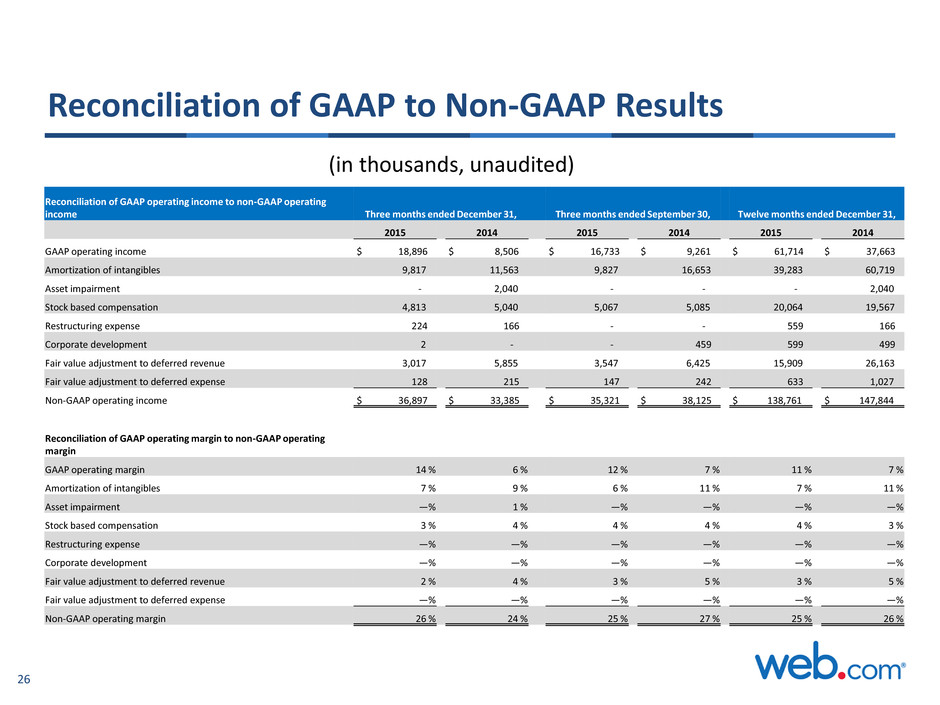
26 Reconciliation of GAAP to Non-GAAP Results (in thousands, unaudited) Reconciliation of GAAP operating income to non-GAAP operating income Three months ended December 31, Three months ended September 30, Twelve months ended December 31, 2015 2014 2015 2014 2015 2014 GAAP operating income $ 18,896 $ 8,506 $ 16,733 $ 9,261 $ 61,714 $ 37,663 Amortization of intangibles 9,817 11,563 9,827 16,653 39,283 60,719 Asset impairment - 2,040 - - - 2,040 Stock based compensation 4,813 5,040 5,067 5,085 20,064 19,567 Restructuring expense 224 166 - - 559 166 Corporate development 2 - - 459 599 499 Fair value adjustment to deferred revenue 3,017 5,855 3,547 6,425 15,909 26,163 Fair value adjustment to deferred expense 128 215 147 242 633 1,027 Non-GAAP operating income $ 36,897 $ 33,385 $ 35,321 $ 38,125 $ 138,761 $ 147,844 Reconciliation of GAAP operating margin to non-GAAP operating margin GAAP operating margin 14 % 6 % 12 % 7 % 11 % 7 % Amortization of intangibles 7 % 9 % 6 % 11 % 7 % 11 % Asset impairment —% 1 % —% —% —% —% Stock based compensation 3 % 4 % 4 % 4 % 4 % 3 % Restructuring expense —% —% —% —% —% —% Corporate development —% —% —% —% —% —% Fair value adjustment to deferred revenue 2 % 4 % 3 % 5 % 3 % 5 % Fair value adjustment to deferred expense —% —% —% —% —% —% Non-GAAP operating margin 26 % 24 % 25 % 27 % 25 % 26 %

27 Reconciliation of GAAP to Non-GAAP Results (in thousands, unaudited) Reconciliation of GAAP gross profit to non-GAAP gross profit Three months ended December 31, Three months ended September 30, Twelve months ended December 31, 2015 2014 2015 2014 2015 2014 Gross Profit $ 92,089 $ 85,844 $ 90,411 $ 89,482 $ 355,016 $ 352,159 Fair value adjustment to deferred revenue 3,017 5,855 3,547 6,425 15,909 26,163 Fair value adjustment to deferred cost 128 215 147 242 633 1,027 Stock based compensation 446 500 467 523 1,933 2,045 Non-GAAP gross profit $ 95,680 $ 92,414 $ 94,572 $ 96,672 $ 373,491 $ 381,394 Non-GAAP gross margin 68% 66% 67% 67% 67% 67% Reconciliation of net cash provided by operating activities to free cash flow Three months ended December 31, Three months ended September 30 Twelve months ended December 31, 2015 2014 2015 2014 2015 2014 Net cash provided by operating activities $ 40,161 $ 36,352 $ 35,159 $ 25,107 $ 152,731 $ 117,206 Capital expenditures (3,590) (2,382) (3,246) (4,557) (14,747) (15,166) Free cash flow $ 36,571 $ 33,970 $ 31,913 $ 20,550 $ 137,984 $ 102,040

28 Reconciliation of GAAP to Non-GAAP Results (in thousands, unaudited) Reconciliation of GAAP operating income to adjusted EBITDA Three months ended December 31, Three months ended September 30, Twelve months ended December 31, 2015 2014 2015 2014 2015 2014 GAAP operating income $ 18,896 $ 8,506 $ 16,733 $ 9,261 $ 61,714 $ 37,663 Depreciation and amortization 14,906 15,398 13,846 20,349 56,345 74,779 Asset impairment - 2,040 - - - 2,040 Stock based compensation 4,813 5,040 5,067 5,085 20,064 19,567 Restructuring expense 224 166 - - 559 166 Corporate development 2 - - 459 599 499 Fair value adjustment to deferred revenue 3,017 5,855 3,547 6,425 15,909 26,163 Fair value adjustment to deferred expense 128 215 147 242 633 1,027 Adjusted EBITDA $ 41,986 $ 37,220 $ 39,340 $ 41,821 $ 155,823 $ 161,904 Reconciliation of GAAP operating margin to adjusted EBITDA margin GAAP operating margin 14% 6% 12% 7% 11% 7% Depreciation and amortization 11% 12% 9% 14% 10% 13% Loss on sale of assets 0% 0% 0% 0% 0% 0% Asset impairment 0% 1% 0% 0% 0% 0% Stock based compensation 3% 4% 4% 4% 4% 3% Restructuring expense 0% 0% 0% 0% 0% 0% Corporate development 0% 0% 0% 0% 0% 0% Fair value adjustment to deferred revenue 2% 4% 3% 4% 3% 5% Fair value adjustment to deferred expense 0% 0% 0% 0% 0% 0% Adjusted EBITDA margin 30% 27% 28% 29% 28% 28%

29 Reconciliation of GAAP to Non-GAAP Results (unaudited) Pro-Forma Pro-Forma Pro-Forma Combined Yodle ($ 000's) Web Yodle Combined Synergies w/Synergies Yodle Synergies w/Synergies Non-GAAP reconciliations 2015 2015 2015 2015 2015 2015 2015 2015 GAAP Revenue $543,461 $207,851 $751,312 $0 $751,312 $207,851 $0 $207,851 Fair value adjustment to deferred revenue 15,909 - 15,909 - 15,909 - - - Non-GAAP Revenue $559,370 $207,851 $767,221 $0 $767,221 $207,851 $0 $207,851 GAAP Operating Income $61,714 ($13,051) $48,663 $0 $48,663 ($13,051) $0 ($13,051) Depreciation & Amortization 56,345 7,497 63,842 - 63,842 7,497 - 7,497 Stock based compensation 20,064 4,284 24,348 - 24,348 4,284 - 4,284 Restructuring charges 559 31 590 - 590 31 - 31 Corporate development 599 - 599 - 599 - - - Deferred initial public offering costs - 4,594 4,594 - 4,594 4,594 - 4,594 Fair value adjustment to deferred revenue 15,909 - 15,909 - 15,909 - - - Fair value adjustment to deferred expense 633 - 633 - 633 - - - Synergies - - - 30,000 30,000 - 30,000 30,000 Adjusted EBITDA $155,823 $3,355 $159,178 $30,000 $189,178 $3,355 $30,000 $33,355 GAAP Operating Margin 11% -6% 6% 6% -6% -6% Depreciation & Amortization 10% 4% 8% 8% 4% 4% Stock based compensation 4% 2% 3% 3% 2% 2% Restructuring charges 0% 0% 0% 0% 0% 0% Corporate development 0% 0% 0% 0% 0% 0% Deferred initial public offering costs 0% 2% 1% 1% 2% 2% Fair value adjustment to deferred revenue 3% 0% 2% 2% 0% 0% Fair value adjustment to deferred expense 0% 0% 0% 0% 0% 0% Synergies 0% 0% 0% 4% 0% 14% Adjusted EBITDA margin 28% 2% 21% 25% 2% 16% GAAP gross profit $355,016 $152,249 $507,265 $507,265 Fair value adjustment to deferred revenue 15,909 - 15,909 15,909 Fair value adjustment to deferred expense 633 - 633 633 Stock based compensation 1,933 37 1,970 1,970 Non GAAP gross profit $373,491 $152,286 $525,777 $525,777 Non GAAP gross profit margin 67% 73% 69% 69%
