Attached files
| file | filename |
|---|---|
| 8-K - 8-K - SFX Entertainment, INC | a16-4162_18k.htm |
Exhibit 99.1
Part A

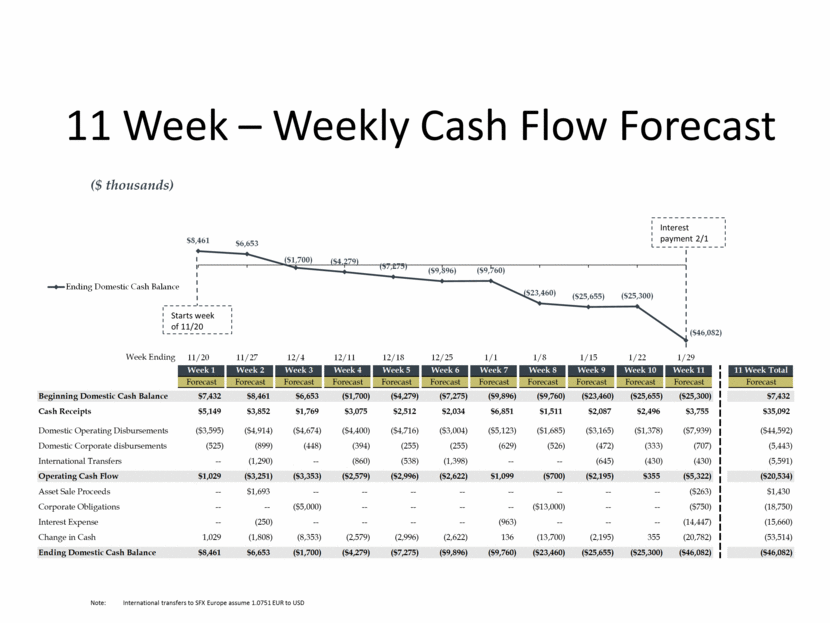
11 Week – Weekly Cash Flow Forecast ($ thousands) Note: International transfers to SFX Europe assume 1.0751 EUR to USD Starts week of 11/20 Interest payment 2/1 Week Ending Week 1 Week 2 Week 3 Week 4 Week 5 Week 6 Week 7 Week 8 Week 9 Week 10 Week 11 11 Week Total Forecast Forecast Forecast Forecast Forecast Forecast Forecast Forecast Forecast Forecast Forecast Forecast Beginning Domestic Cash Balance $7,432 $8,461 $6,653 ($1,700) ($4,279) ($7,275) ($9,896) ($9,760) ($23,460) ($25,655) ($25,300) $7,432 Cash Receipts $5,149 $3,852 $1,769 $3,075 $2,512 $2,034 $6,851 $1,511 $2,087 $2,496 $3,755 $35,092 Domestic Operating Disbursements ($3,595) ($4,914) ($4,674) ($4,400) ($4,716) ($3,004) ($5,123) ($1,685) ($3,165) ($1,378) ($7,939) ($44,592) Domestic Corporate disbursements (525) (899) (448) (394) (255) (255) (629) (526) (472) (333) (707) (5,443) International Transfers -- (1,290) -- (860) (538) (1,398) -- -- (645) (430) (430) (5,591) Operating Cash Flow $1,029 ($3,251) ($3,353) ($2,579) ($2,996) ($2,622) $1,099 ($700) ($2,195) $355 ($5,322) ($20,534) Asset Sale Proceeds -- $1,693 -- -- -- -- -- -- -- -- ($263) $1,430 Corporate Obligations -- -- ($5,000) -- -- -- -- ($13,000) -- -- ($750) (18,750) Interest Expense -- (250) -- -- -- -- (963) -- -- -- (14,447) (15,660) Change in Cash 1,029 (1,808) (8,353) (2,579) (2,996) (2,622) 136 (13,700) (2,195) 355 (20,782) (53,514) Ending Domestic Cash Balance $8,461 $6,653 ($1,700) ($4,279) ($7,275) ($9,896) ($9,760) ($23,460) ($25,655) ($25,300) ($46,082) ($46,082) $8,461 $6,653 ($1,700) ($4,279) ($7,275) ($9,896) ($9,760) ($23,460) ($25,655) ($25,300) ($46,082) 11/20 11/27 12/4 12/11 12/18 12/25 1/1 1/8 1/15 1/22 1/29 Ending Domestic Cash Balance

Part B

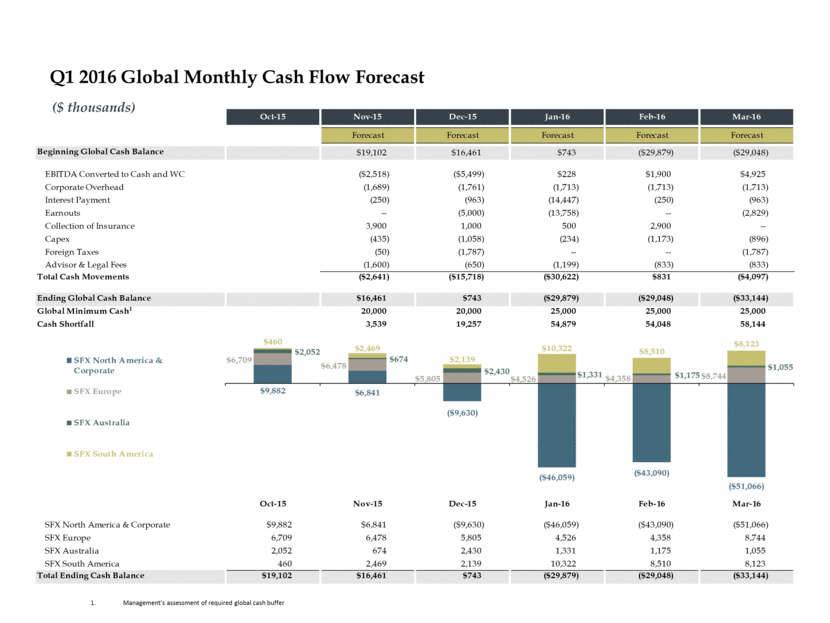
Q1 2016 Global Monthly Cash Flow Forecast ($ thousands) Management’s assessment of required global cash buffer Oct-15 Nov-15 Dec-15 Jan-16 Feb-16 Mar-16 Forecast Forecast Forecast Forecast Forecast Beginning Global Cash Balance $19,102 $16,461 $743 ($29,879) ($29,048) EBITDA Converted to Cash and WC ($2,518) ($5,499) $228 $1,900 $4,925 Corporate Overhead (1,689) (1,761) (1,713) (1,713) (1,713) Interest Payment (250) (963) (14,447) (250) (963) Earnouts -- (5,000) (13,758) -- (2,829) Collection of Insurance 3,900 1,000 500 2,900 -- Capex (435) (1,058) (234) (1,173) (896) Foreign Taxes (50) (1,787) -- -- (1,787) Advisor & Legal Fees (1,600) (650) (1,199) (833) (833) Total Cash Movements ($2,641) ($15,718) ($30,622) $831 ($4,097) Ending Global Cash Balance $16,461 $743 ($29,879) ($29,048) ($33,144) Global Minimum Cash 1 20,000 20,000 25,000 25,000 25,000 Cash Shortfall 3,539 19,257 54,879 54,048 58,144 SFX North America & Corporate $9,882 $6,841 ($9,630) ($46,059) ($43,090) ($51,066) SFX Europe 6,709 6,478 5,805 4,526 4,358 8,744 SFX Australia 2,052 674 2,430 1,331 1,175 1,055 SFX South America 460 2,469 2,139 10,322 8,510 8,123 Total Ending Cash Balance $19,102 $16,461 $743 ($29,879) ($29,048) ($33,144) $9,882 $6,841 ($9,630) ($46,059) ($43,090) ($51,066) $6,709 $6,478 $5,805 $4,526 $4,358 $8,744 $2,052 $674 $2,430 $1,331 $1,175 $1,055 $460 $2,469 $2,139 $10,322 $8,510 $8,123 Oct-15 Nov-15 Dec-15 Jan-16 Feb-16 Mar-16 SFX North America & Corporate SFX Europe SFX Australia SFX South America

Part C

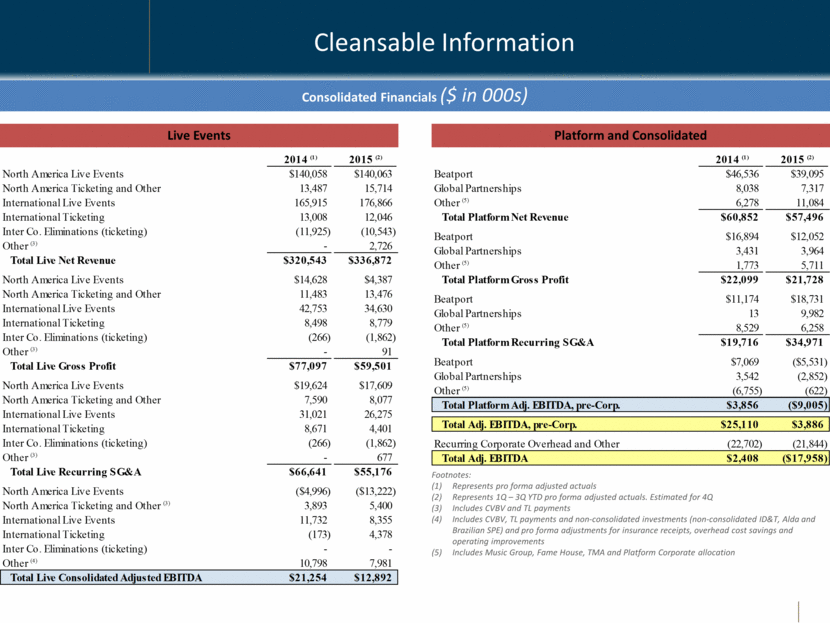
Platform and Consolidated Cleansable Information Consolidated Financials ($ in 000s) Live Events Footnotes: Represents pro forma adjusted actuals Represents 1Q – 3Q YTD pro forma adjusted actuals. Estimated for 4Q Includes CVBV and TL payments Includes CVBV, TL payments and non-consolidated investments (non-consolidated ID&T, Alda and Brazilian SPE) and pro forma adjustments for insurance receipts, overhead cost savings and operating improvements Includes Music Group, Fame House, TMA and Platform Corporate allocation 2014 (1) 2015 (2) North America Live Events $140,058 $140,063 North America Ticketing and Other 13,487 15,714 International Live Events 165,915 176,866 International Ticketing 13,008 12,046 Inter Co. Eliminations (ticketing) (11,925) (10,543) Other (3) - 2,726 Total Live Net Revenue $320,543 $336,872 North America Live Events $14,628 $4,387 North America Ticketing and Other 11,483 13,476 International Live Events 42,753 34,630 International Ticketing 8,498 8,779 Inter Co. Eliminations (ticketing) (266) (1,862) Other (3) - 91 Total Live Gross Profit $77,097 $59,501 North America Live Events $19,624 $17,609 North America Ticketing and Other 7,590 8,077 International Live Events 31,021 26,275 International Ticketing 8,671 4,401 Inter Co. Eliminations (ticketing) (266) (1,862) Other (3) - 677 Total Live Recurring SG&A $66,641 $55,176 North America Live Events ($4,996) ($13,222) North America Ticketing and Other (3) 3,893 5,400 International Live Events 11,732 8,355 International Ticketing (173) 4,378 Inter Co. Eliminations (ticketing) - - Other (4) 10,798 7,981 Total Live Consolidated Adjusted EBITDA $21,254 $12,892 2014 (1) 2015 (2) Beatport $46,536 $39,095 Global Partnerships 8,038 7,317 Other (5) 6,278 11,084 Total Platform Net Revenue $60,852 $57,496 Beatport $16,894 $12,052 Global Partnerships 3,431 3,964 Other (5) 1,773 5,711 Total Platform Gross Profit $22,099 $21,728 Beatport $11,174 $18,731 Global Partnerships 13 9,982 Other (5) 8,529 6,258 Total Platform Recurring SG&A $19,716 $34,971 Beatport $7,069 ($5,531) Global Partnerships 3,542 (2,852) Other (5) (6,755) (622) Total Platform Adj. EBITDA, pre-Corp. $3,856 ($9,005) Total Adj. EBITDA, pre-Corp. $25,110 $3,886 Recurring Corporate Overhead and Other (22,702) (21,844) Total Adj. EBITDA $2,408 ($17,958)

