Attached files
| file | filename |
|---|---|
| 8-K - FORM 8-K - Premier, Inc. | d130560d8k.htm |
| EX-99.1 - EX-99.1 - Premier, Inc. | d130560dex991.htm |
| EX-99.2 - EX-99.2 - Premier, Inc. | d130560dex992.htm |
February 8, 2016 Second-Quarter Fiscal 2016 Financial Results and Update Exhibit 99.3
Forward-looking statements—Certain statements included in this presentation, including, but not limited to, those related to our financial and business outlook, strategy and growth drivers, member retention and renewal rates and revenue visibility, cross and upsell opportunities, acquisition activities and pipeline, revenue available under contract, and 2016 financial guidance and related assumptions, are “forward-looking statements” within the meaning of the federal securities laws. Forward-looking statements may involve known and unknown risks, uncertainties and other factors that may cause the actual results of Premier to be materially different from historical results or from any future results or projections expressed or implied by such forward-looking statements. Accordingly, readers should not place undue reliance on any forward looking statements. Readers are urged to consider statements in the conditional or future tenses or that include terms such as “believes,” “belief,” “expects,” “estimates,” “intends,” “anticipates” or “plans” to be uncertain and forward-looking. Forward-looking statements may include comments as to Premier’s beliefs and expectations as to future events and trends affecting its business and are necessarily subject to uncertainties, many of which are outside Premier’s control. You should carefully read Premier’s current and future filings with the SEC for more information on potential risks and other factors that could affect Premier’s financial results. Forward-looking statements speak only as of the date they are made. Premier undertakes no obligation to publicly update or revise any forward-looking statements. Non-GAAP financial measures—This presentation includes certain “non-GAAP financial measures” as defined in Regulation G under the Securities Exchange Act of 1934. Schedules are attached that reconcile the non-GAAP financial measures included in this presentation to the most directly comparable financial measures calculated and presented in accordance with Generally Accepted Accounting Principles in the United States. You should carefully read Premier’s current and future filings with the SEC for further explanation and disclosure regarding our use of non-GAAP financial measures and such filings should be read in conjunction with this presentation. Forward-looking statements and Non-GAAP financial measures
Susan DeVore, President & CEO Overview and Business Update
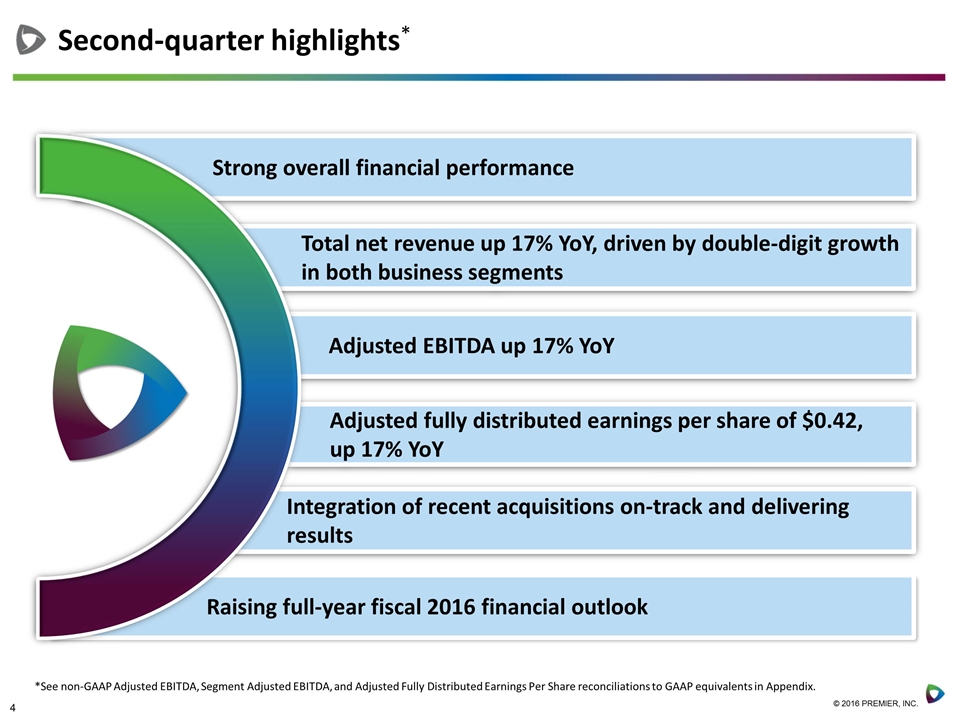
Second-quarter highlights* Total net revenue up 17% YoY, driven by double-digit growth in both business segments Adjusted fully distributed earnings per share of $0.42, up 17% YoY Adjusted EBITDA up 17% YoY Integration of recent acquisitions on-track and delivering results Raising full-year fiscal 2016 financial outlook Strong overall financial performance *See non-GAAP Adjusted EBITDA, Segment Adjusted EBITDA, and Adjusted Fully Distributed Earnings Per Share reconciliations to GAAP equivalents in Appendix.
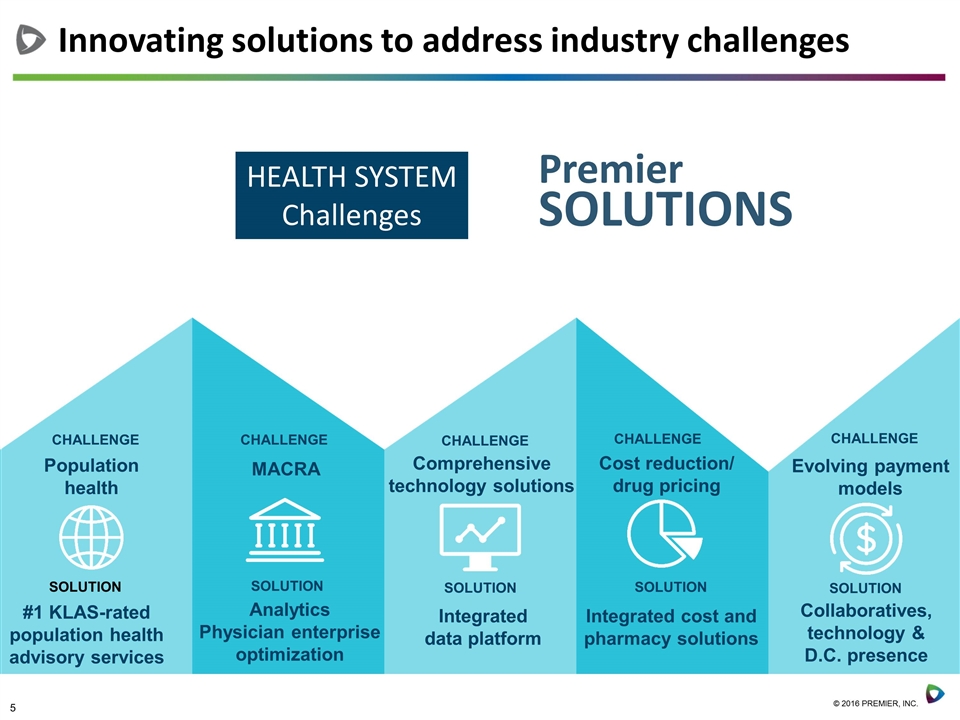
Innovating solutions to address industry challenges Premier SOLUTIONS Population health HEALTH SYSTEM Challenges #1 KLAS-rated population health advisory services CHALLENGE Analytics Physician enterprise optimization Comprehensive technology solutions Integrated data platform Integrated cost and pharmacy solutions Evolving payment models Collaboratives, technology & D.C. presence SOLUTION CHALLENGE CHALLENGE CHALLENGE CHALLENGE MACRA SOLUTION SOLUTION SOLUTION Cost reduction/ drug pricing SOLUTION
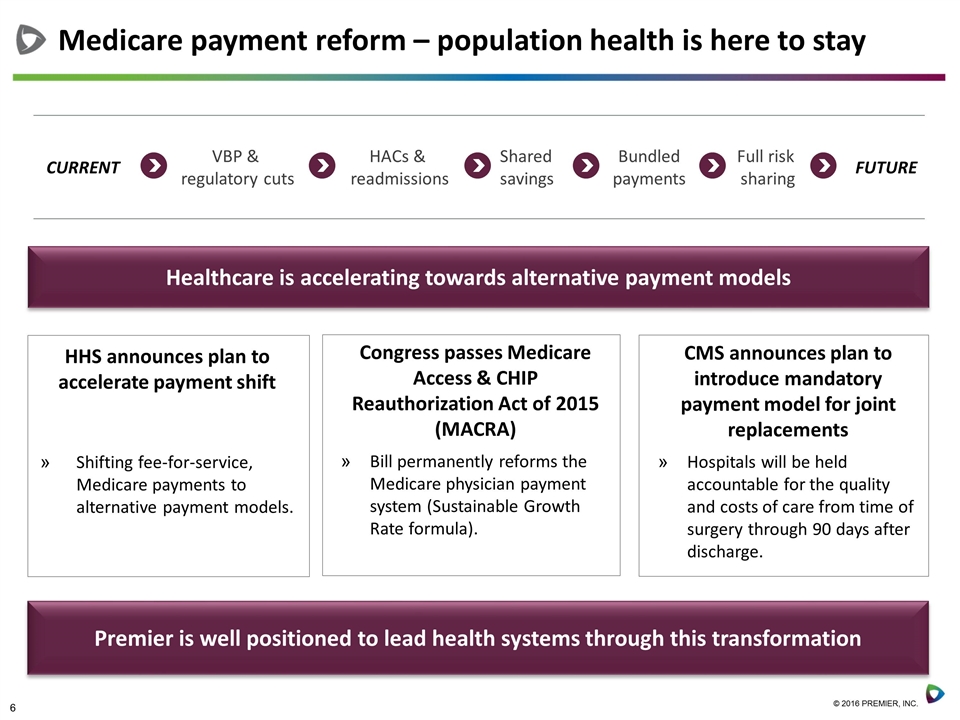
Healthcare is accelerating towards alternative payment models CURRENT VBP & regulatory cuts HACs & readmissions Shared savings Bundled payments Full risk sharing FUTURE HHS announces plan to accelerate payment shift Shifting fee-for-service, Medicare payments to alternative payment models. Congress passes Medicare Access & CHIP Reauthorization Act of 2015 (MACRA) Bill permanently reforms the Medicare physician payment system (Sustainable Growth Rate formula). Medicare payment reform – population health is here to stay Premier is well positioned to lead health systems through this transformation CMS announces plan to introduce mandatory payment model for joint replacements Hospitals will be held accountable for the quality and costs of care from time of surgery through 90 days after discharge.
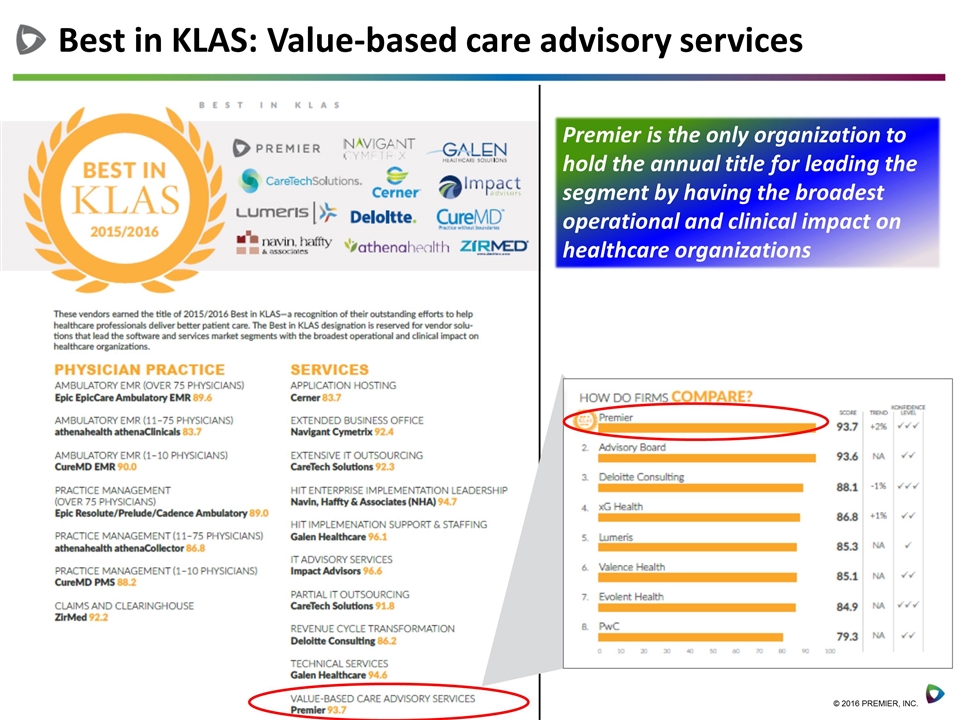
Best in KLAS: Value-based care advisory services Premier is the only organization to hold the annual title for leading the segment by having the broadest operational and clinical impact on healthcare organizations
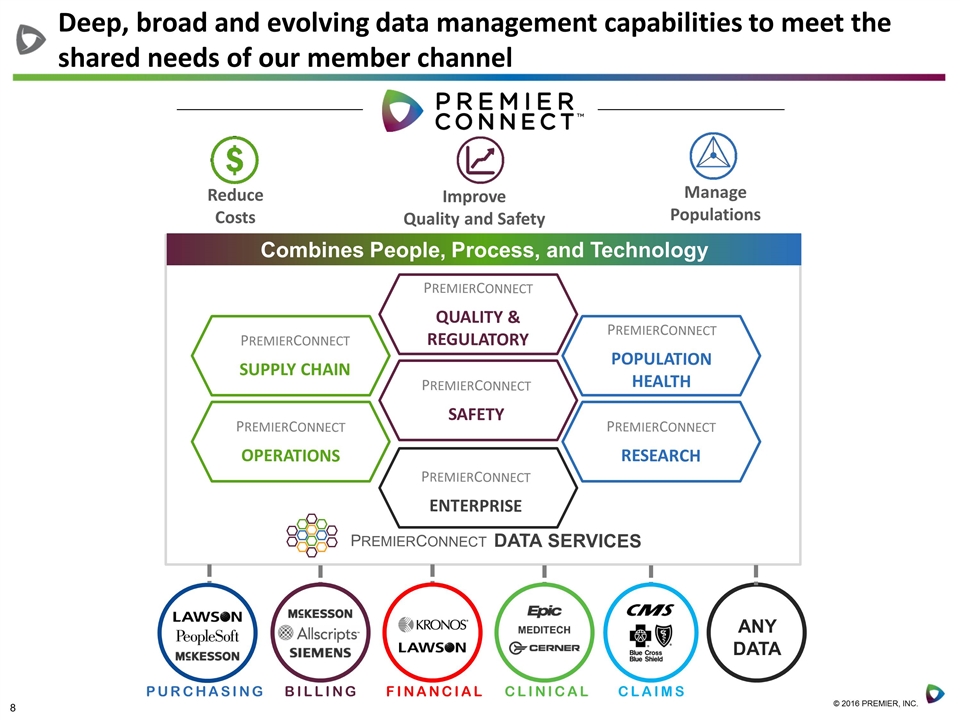
Deep, broad and evolving data management capabilities to meet the shared needs of our member channel PREMIERCONNECT QUALITY & REGULATORY PREMIERCONNECT OPERATIONS PREMIERCONNECT SAFETY PREMIERCONNECT POPULATION HEALTH PREMIERCONNECT RESEARCH PREMIERCONNECT DATA SERVICES Manage Populations Improve Quality and Safety Reduce Costs PREMIERCONNECT SUPPLY CHAIN PREMIERCONNECT ENTERPRISE BILLING PURCHASING CLAIMS CLINICAL FINANCIAL ANY DATA Combines People, Process, and Technology
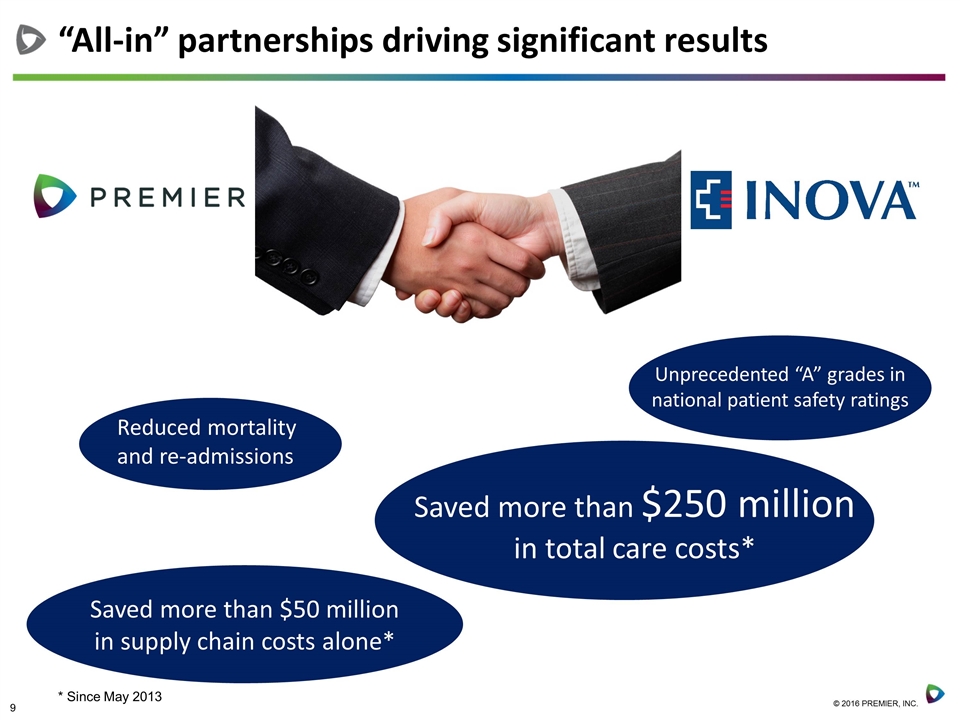
“All-in” partnerships driving significant results Reduced mortality and re-admissions Unprecedented “A” grades in national patient safety ratings Saved more than $250 million in total care costs* Saved more than $50 million in supply chain costs alone* * Since May 2013
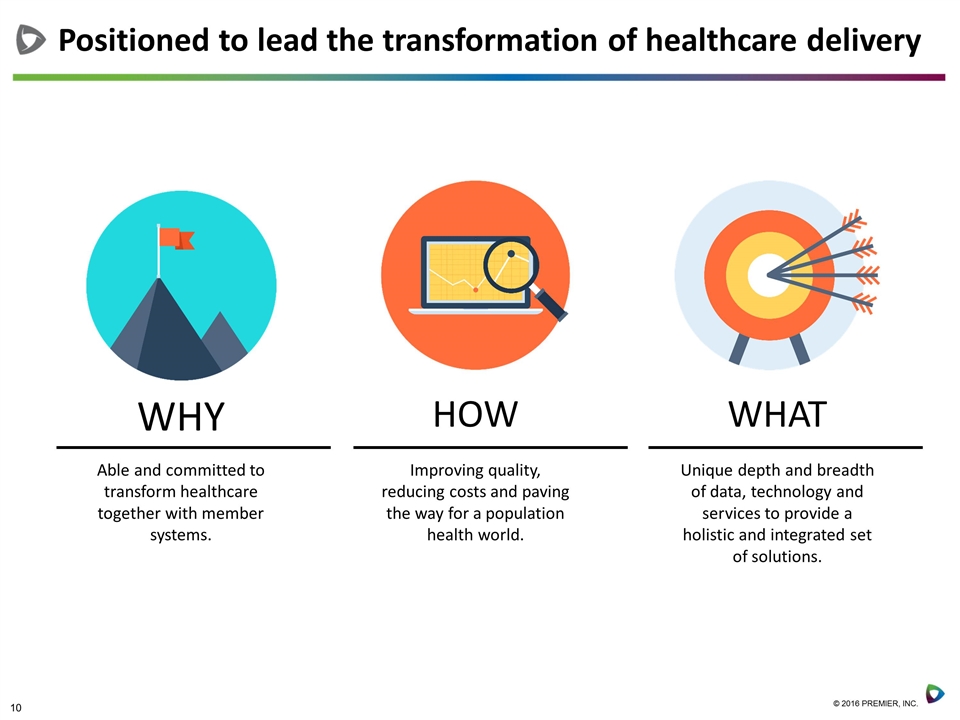
Positioned to lead the transformation of healthcare delivery WHY HOW WHAT Able and committed to transform healthcare together with member systems. Improving quality, reducing costs and paving the way for a population health world. Unique depth and breadth of data, technology and services to provide a holistic and integrated set of solutions.
Michael Alkire, Chief Operating Officer Operations Update

What drives success? Why do they choose to work with Premier? What problems can we solve? What do our members need? The strength of our relationships provide a roadmap for future success
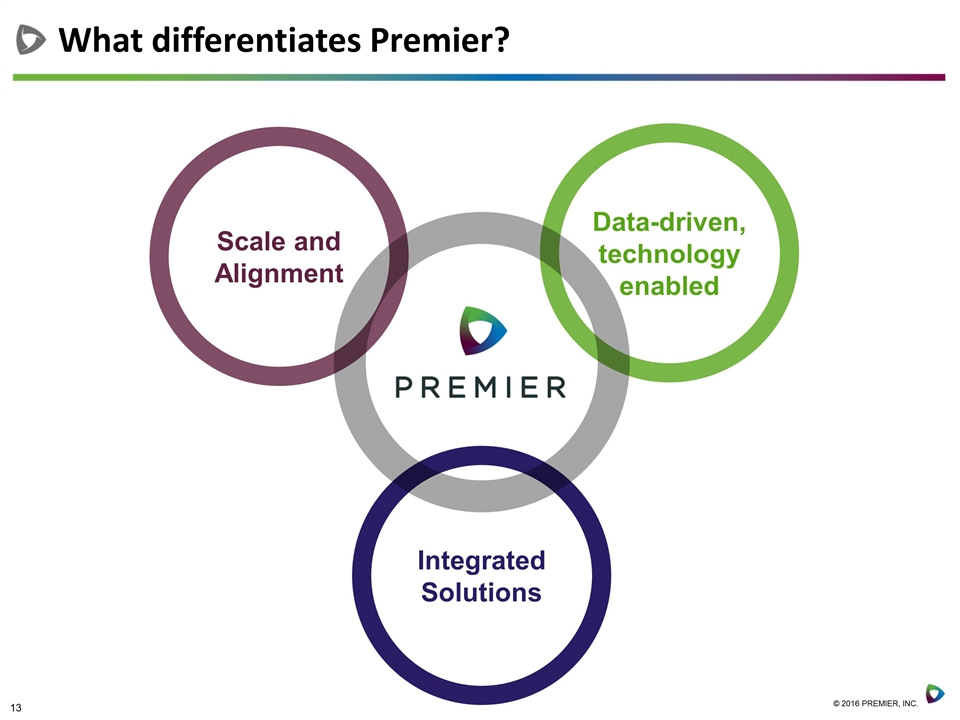
What differentiates Premier? Scale and Alignment Integrated Solutions Data-driven, technology enabled
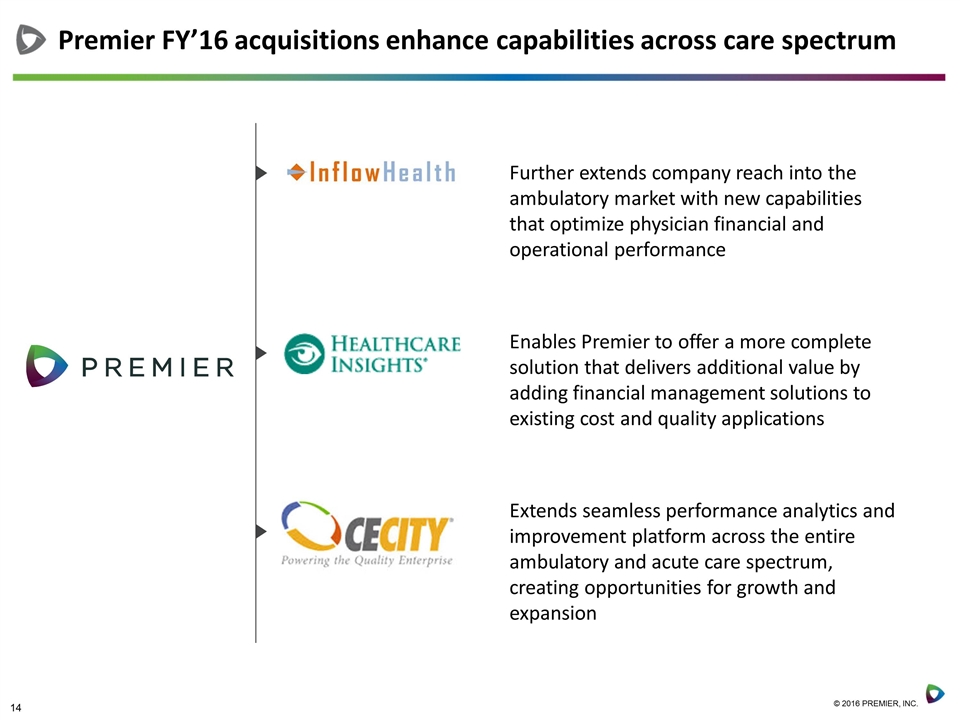
Premier FY’16 acquisitions enhance capabilities across care spectrum Further extends company reach into the ambulatory market with new capabilities that optimize physician financial and operational performance Enables Premier to offer a more complete solution that delivers additional value by adding financial management solutions to existing cost and quality applications Extends seamless performance analytics and improvement platform across the entire ambulatory and acute care spectrum, creating opportunities for growth and expansion
New and expanding opportunities with CECity Saved more than $0 million in supply chain costs alone Physician performance management and value-based payment reporting Channel partnerships with EHR companies Research opportunities with Big Pharma – Genentech, Merck, Pfizer Government contracts – Million Hearts® Initiative
HealthPartners and MercyRockford Health System become Premier’s newest members for Supply Chain Services and PremierConnect technology analytics 17 new PremierConnect Supply Chain (PCSC) members Integrated pharmacy membership increases to 39 health systems Other notable FY’16 second-quarter achievements
Craig McKasson, Chief Financial Officer Financial Review
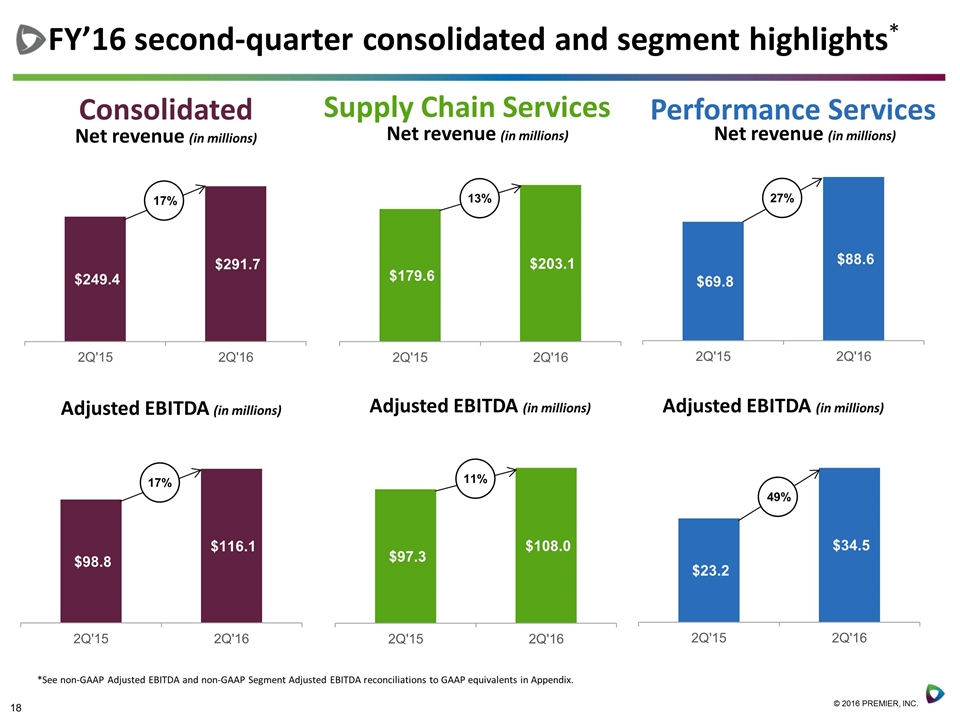
FY’16 second-quarter consolidated and segment highlights* Consolidated Net revenue (in millions) Supply Chain Services Net revenue (in millions) Performance Services Net revenue (in millions) Adjusted EBITDA (in millions) Adjusted EBITDA (in millions) Adjusted EBITDA (in millions) *See non-GAAP Adjusted EBITDA and non-GAAP Segment Adjusted EBITDA reconciliations to GAAP equivalents in Appendix. 17% 17% 13% 11% 27% 49%
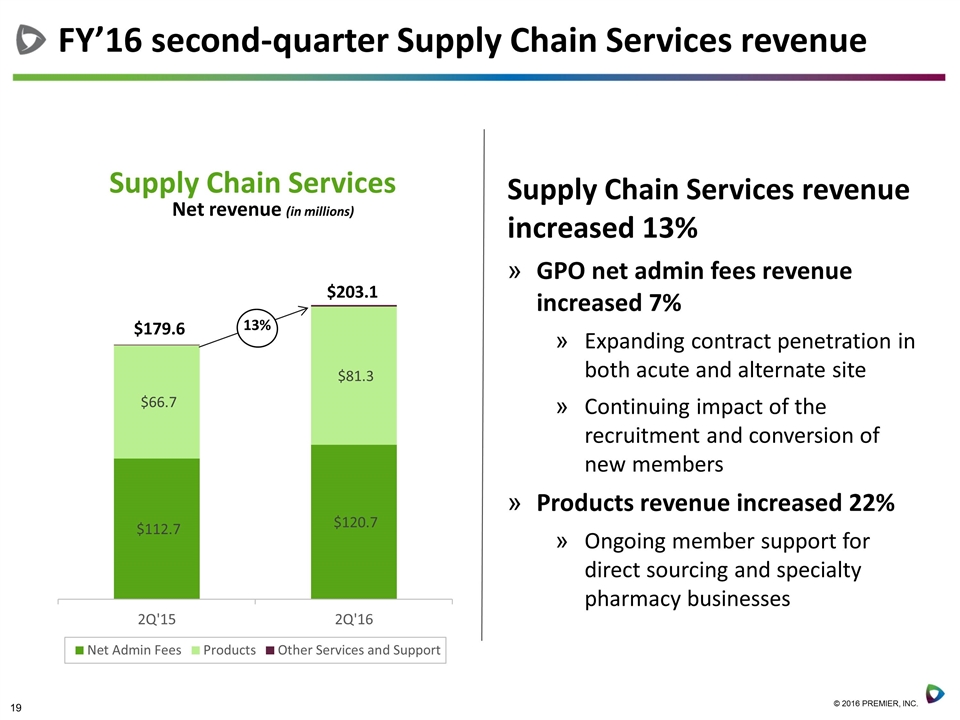
FY’16 second-quarter Supply Chain Services revenue Supply Chain Services revenue increased 13% GPO net admin fees revenue increased 7% Expanding contract penetration in both acute and alternate site Continuing impact of the recruitment and conversion of new members Products revenue increased 22% Ongoing member support for direct sourcing and specialty pharmacy businesses Supply Chain Services Net revenue (in millions) 13% $179.6 $203.1
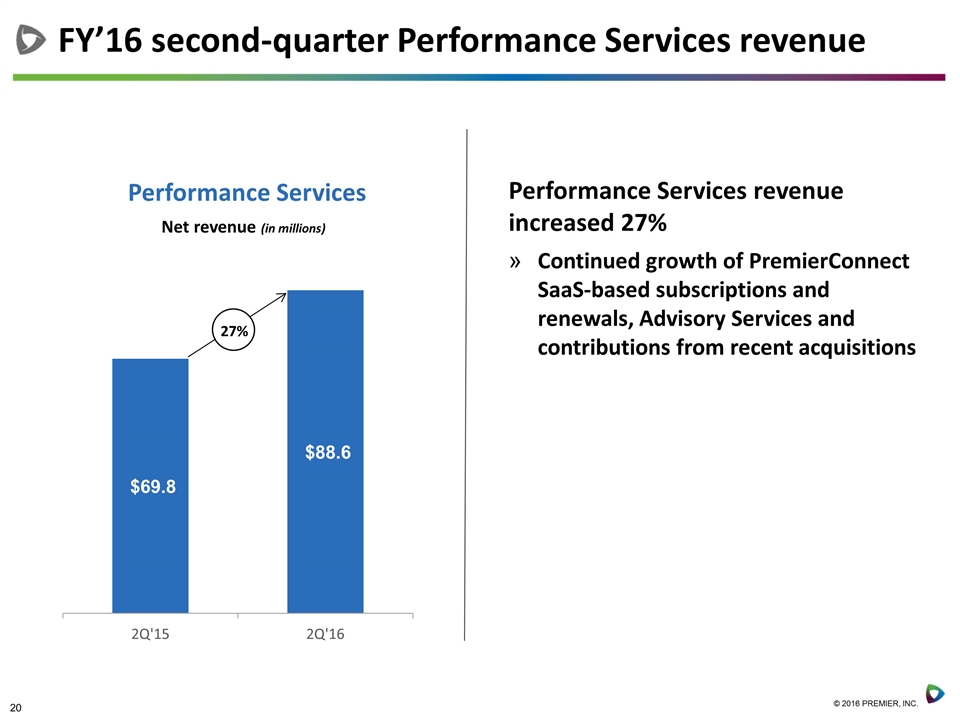
FY’16 second-quarter Performance Services revenue Performance Services revenue increased 27% Continued growth of PremierConnect SaaS-based subscriptions and renewals, Advisory Services and contributions from recent acquisitions Performance Services Net revenue (in millions) 27%
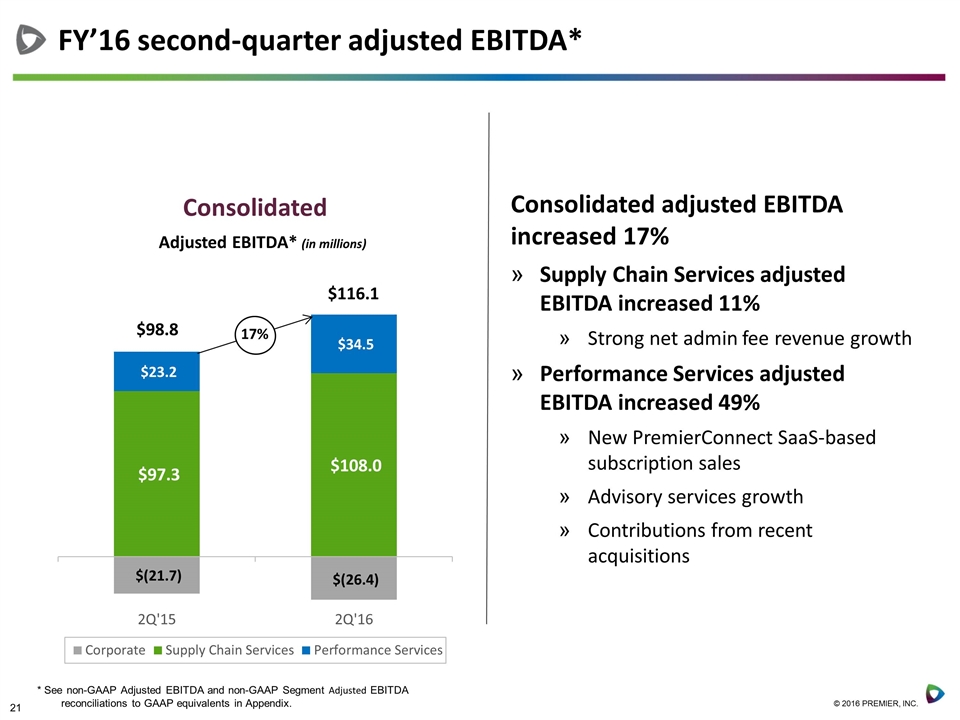
FY’16 second-quarter adjusted EBITDA* Consolidated adjusted EBITDA increased 17% Supply Chain Services adjusted EBITDA increased 11% Strong net admin fee revenue growth Performance Services adjusted EBITDA increased 49% New PremierConnect SaaS-based subscription sales Advisory services growth Contributions from recent acquisitions Consolidated Adjusted EBITDA* (in millions) 17% $98.8 $116.1 * See non-GAAP Adjusted EBITDA and non-GAAP Segment Adjusted EBITDA reconciliations to GAAP equivalents in Appendix.
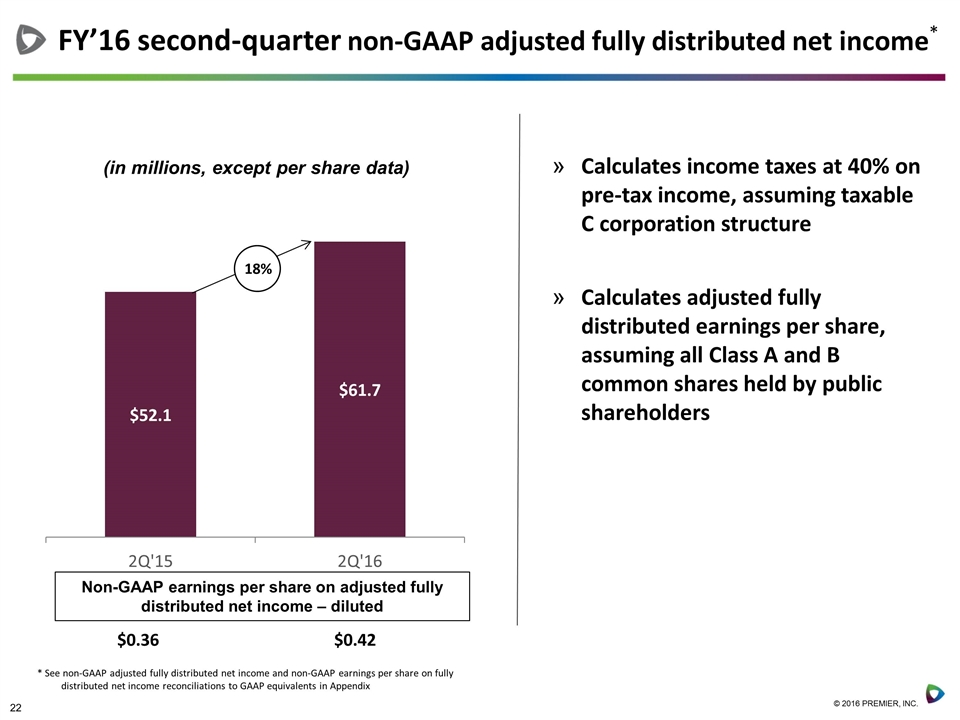
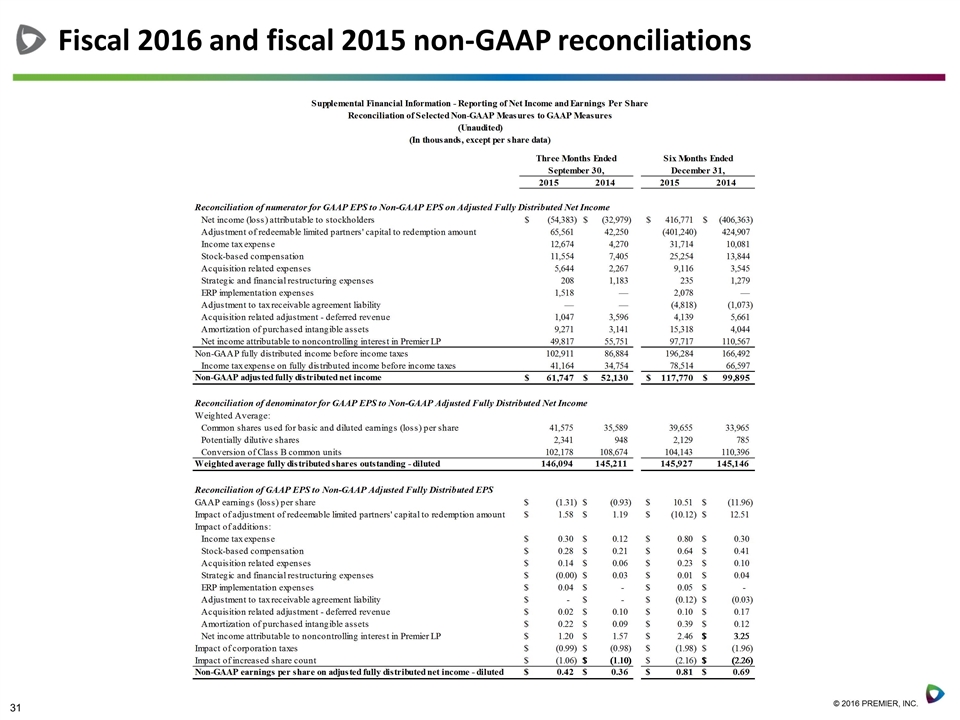
FY’16 second-quarter non-GAAP adjusted fully distributed net income* 18% $0.36 $0.42 Non-GAAP earnings per share on adjusted fully distributed net income – diluted * See non-GAAP adjusted fully distributed net income and non-GAAP earnings per share on fully distributed net income reconciliations to GAAP equivalents in Appendix Calculates income taxes at 40% on pre-tax income, assuming taxable C corporation structure Calculates adjusted fully distributed earnings per share, assuming all Class A and B common shares held by public shareholders
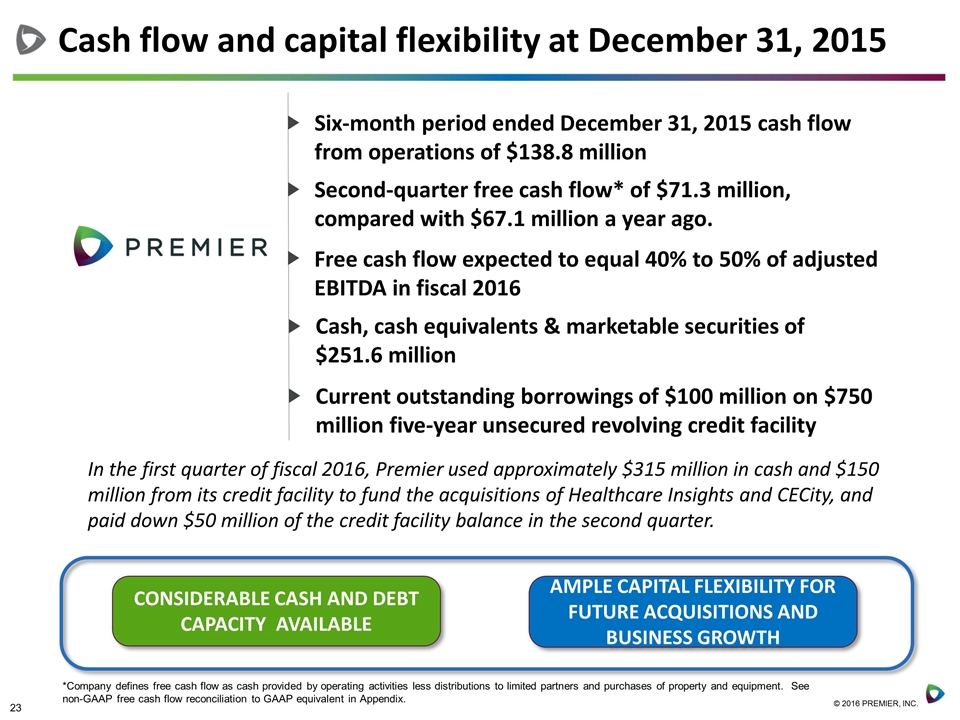
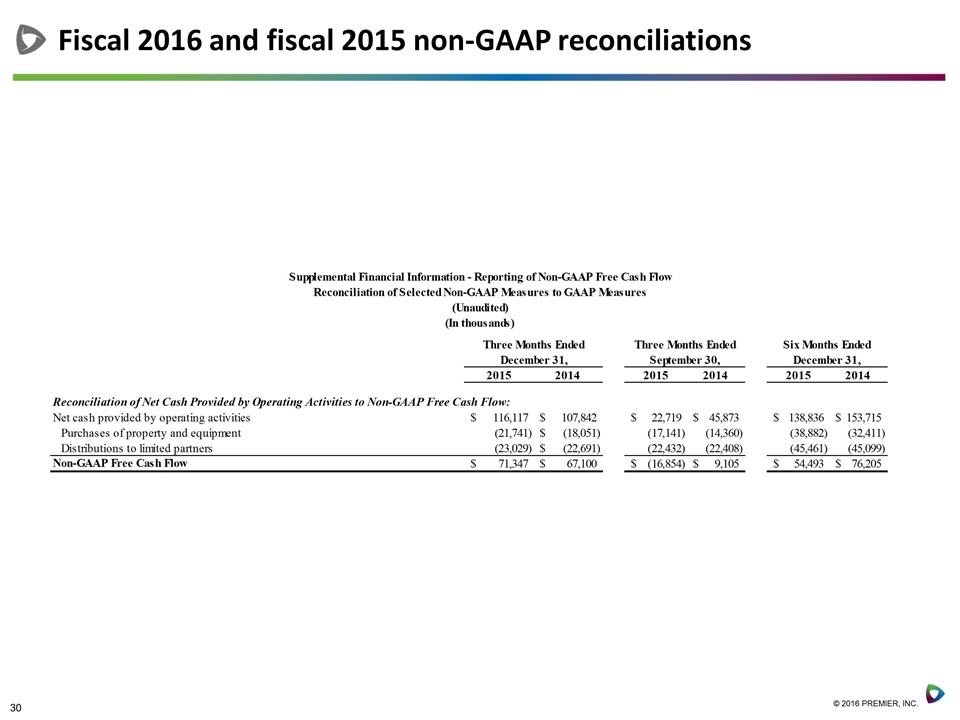
Cash flow and capital flexibility at December 31, 2015 CONSIDERABLE CASH AND DEBT CAPACITY AVAILABLE AMPLE CAPITAL FLEXIBILITY FOR FUTURE ACQUISITIONS AND BUSINESS GROWTH Second-quarter free cash flow* of $71.3 million, compared with $67.1 million a year ago. Cash, cash equivalents & marketable securities of $251.6 million Current outstanding borrowings of $100 million on $750 million five-year unsecured revolving credit facility In the first quarter of fiscal 2016, Premier used approximately $315 million in cash and $150 million from its credit facility to fund the acquisitions of Healthcare Insights and CECity, and paid down $50 million of the credit facility balance in the second quarter. Free cash flow expected to equal 40% to 50% of adjusted EBITDA in fiscal 2016 *Company defines free cash flow as cash provided by operating activities less distributions to limited partners and purchases of property and equipment. See non-GAAP free cash flow reconciliation to GAAP equivalent in Appendix. Six-month period ended December 31, 2015 cash flow from operations of $138.8 million
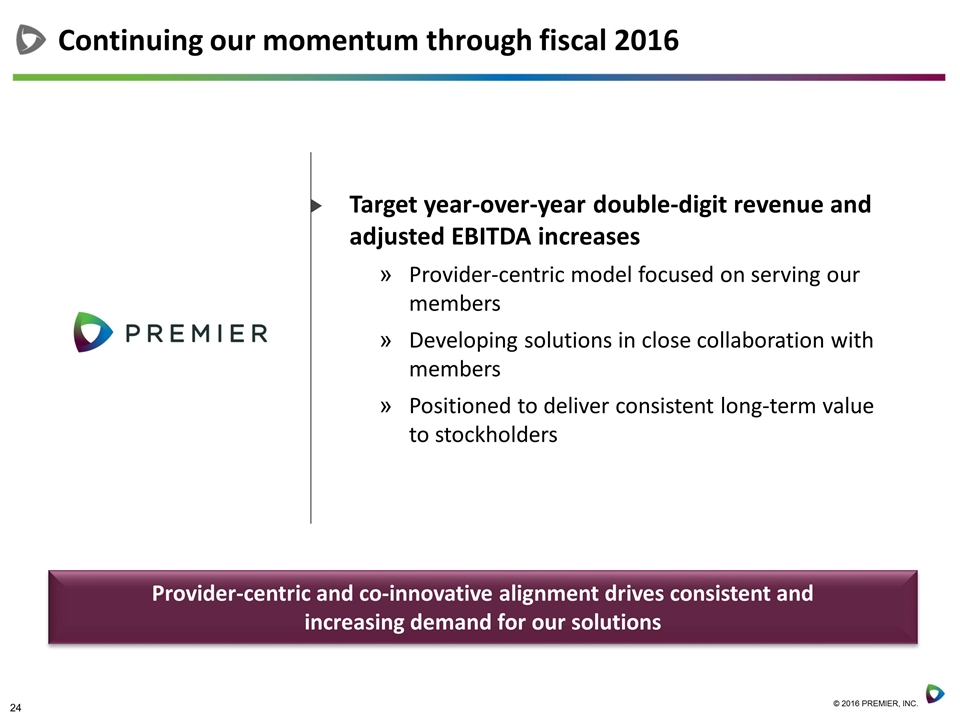
Continuing our momentum through fiscal 2016 Target year-over-year double-digit revenue and adjusted EBITDA increases Provider-centric model focused on serving our members Developing solutions in close collaboration with members Positioned to deliver consistent long-term value to stockholders Provider-centric and co-innovative alignment drives consistent and increasing demand for our solutions
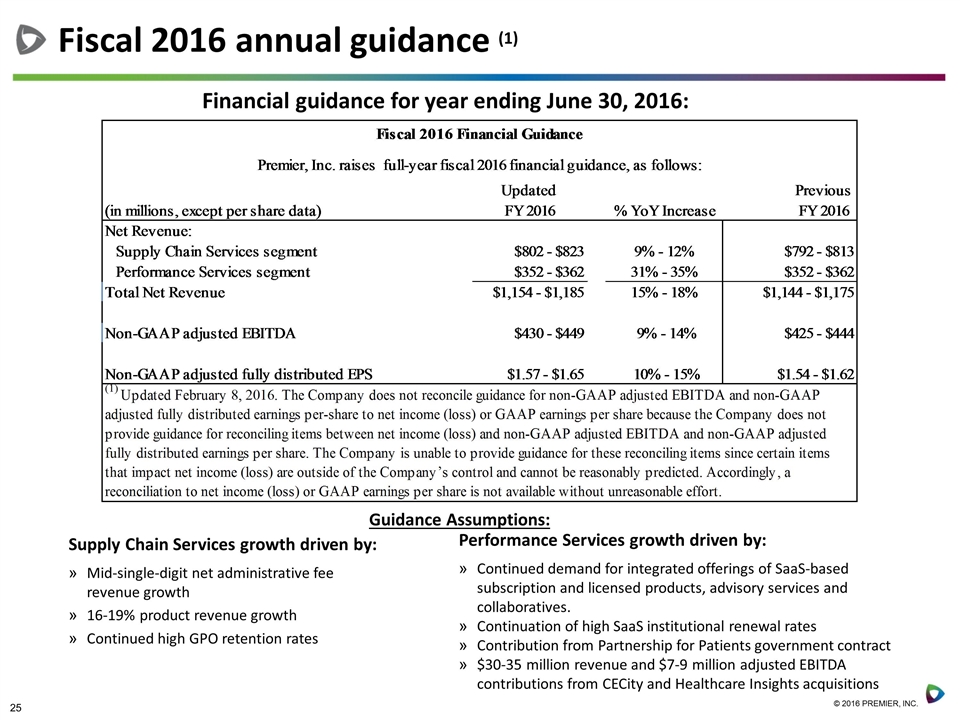
Fiscal 2016 annual guidance (1) Financial guidance for year ending June 30, 2016: Supply Chain Services growth driven by: Mid-single-digit net administrative fee revenue growth 16-19% product revenue growth Continued high GPO retention rates Guidance Assumptions: Performance Services growth driven by: Continued demand for integrated offerings of SaaS-based subscription and licensed products, advisory services and collaboratives. Continuation of high SaaS institutional renewal rates Contribution from Partnership for Patients government contract $30-35 million revenue and $7-9 million adjusted EBITDA contributions from CECity and Healthcare Insights acquisitions
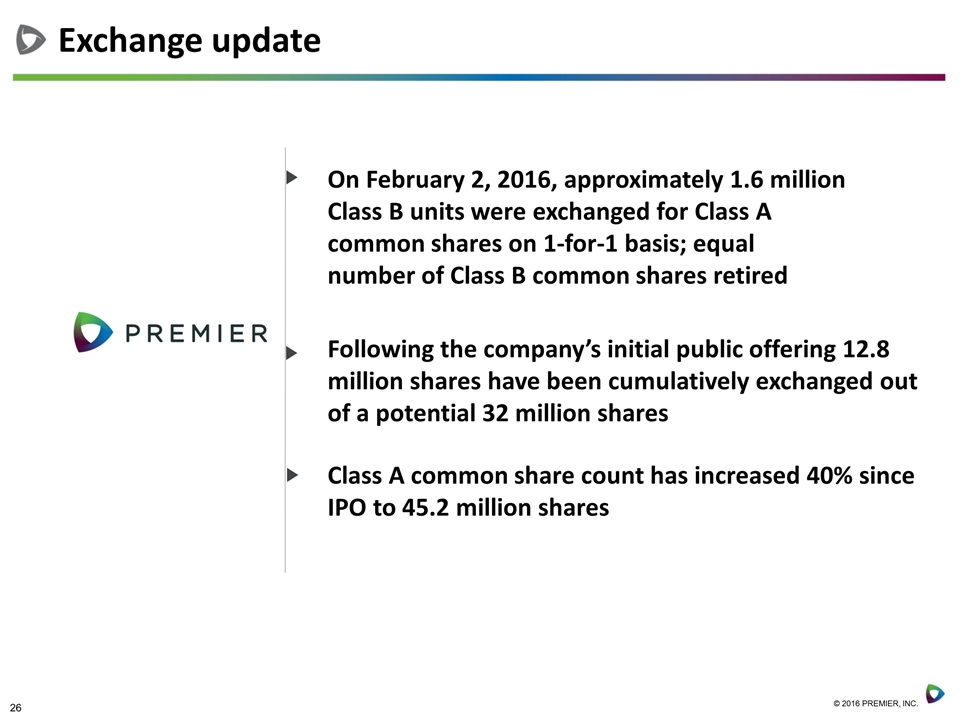
Exchange update On February 2, 2016, approximately 1.6 million Class B units were exchanged for Class A common shares on 1-for-1 basis; equal number of Class B common shares retired Following the company’s initial public offering 12.8 million shares have been cumulatively exchanged out of a potential 32 million shares Class A common share count has increased 40% since IPO to 45.2 million shares
Questions
Appendix
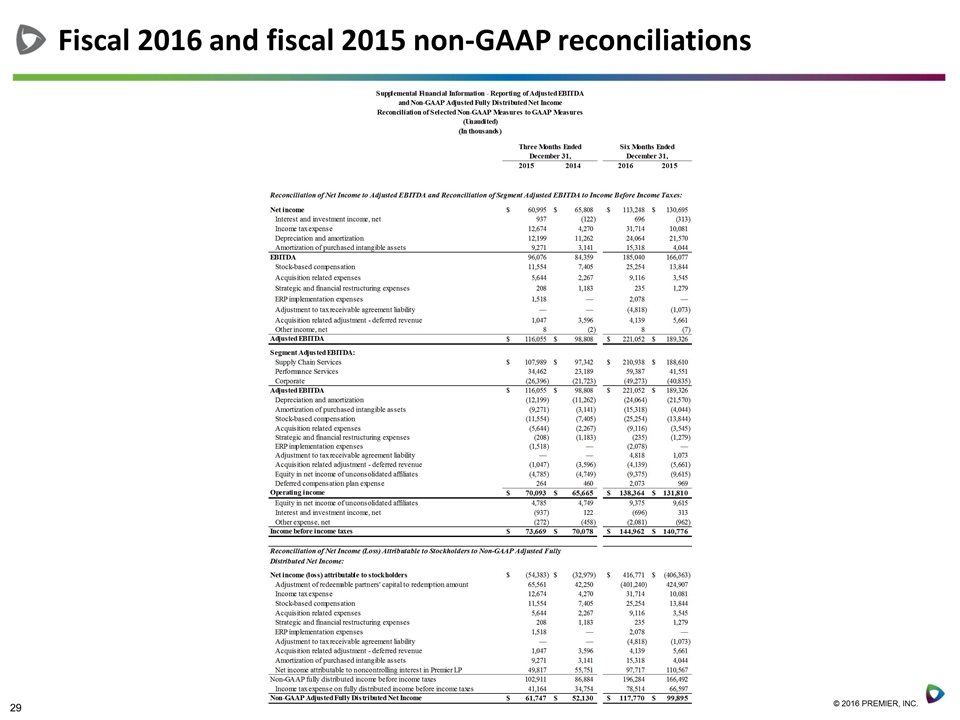
Fiscal 2016 and fiscal 2015 non-GAAP reconciliations
Fiscal 2016 and fiscal 2015 non-GAAP reconciliations
Fiscal 2016 and fiscal 2015 non-GAAP reconciliations
