Attached files
| file | filename |
|---|---|
| 8-K - 8-K - NAVIGATORS GROUP INC | navg-8k_20160210.htm |
Exhibit 99.1
 The Navigators Group, Inc.
CORPORATE NEWS
Navigators Reports Fourth Quarter and Full Year Earnings
Stamford, CT – February 10, 2016 -- The Navigators Group, Inc. (NASDAQ:NAVG) reported net income of $17.7 million, or $1.19 per diluted share, for the three months ended December 31, 2015 compared to $19.3 million, or $1.31 per diluted share, for the comparable period in 2014. Operating earnings were $16.4 million, or $1.10 per diluted share, for the three months ended December 31, 2015 compared to $18.4 million, or $1.25 per diluted share, for the comparable period in 2014.
For the twelve months ended December 31, 2015, the Company reported net income of $81.1 million, or $5.47 per diluted share compared to $95.3 million, or $6.51 per diluted share, for the comparable period in 2014. 2014 results included a one-time foreign exchange gain of $10.0 million ($6.6 million after-tax) due to a change in the functional currency of our Lloyd’s Syndicate, which was equally offset by a reversal within the Accumulated Other Comprehensive Income component of stockholders’ equity. Excluding this gain, the twelve months ended December 31, 2014 net income per diluted share would have been $6.06. Operating earnings were $77.1 million, or $5.20 per diluted share, for the twelve months ended December 31, 2015 compared to $80.5 million, or $5.49 per diluted share, for the comparable period in 2014. The one-time foreign exchange gain discussed above had no impact on operating earnings.
Gross written premiums and net written premiums for the three months ended December 31, 2015 were $323.5 million and $244.7 million, respectively, a decrease of 2.9% and an increase of 7.3% from the comparable period in 2014.
Gross written premiums and net written premiums for the twelve months ended December 31, 2015 were $1.454 billion and $1.044 billion, respectively, an increase of 1.5% and 4.4% from the comparable period in 2014.
The combined ratio for the three and twelve months ended December 31, 2015 was 97.2% and 94.1%, respectively, compared to 93.8% and 92.6% for the comparable periods in 2014.
Stan Galanski, President and Chief Executive Officer commented, “We are pleased to report profitable underwriting results across all three of our reporting segments for 2015. Net income was $81 million, representing our third best year ever, and book value per share increased to $75.96. Market conditions were challenging, particularly in economically-sensitive products like Offshore Energy and Marine Liability, for which gross written premium decreased during the fourth quarter and year. Our U.S. P&C operating segment continued to perform well and we remain encouraged by the momentum of our newer initiatives, including our property insurance and reinsurance product lines.”
400 Atlantic Street Stamford, CT 06901
TEL (203) 905-6090 FAX (203) 658-1821
News Release
February 10, 2016
Page 2
Stockholders’ equity was $1.096 billion, or $75.96 per share, as of December 31, 2015 compared to $1.027 billion, or $71.93 per share, as of December 31, 2014.
Net investment income for the three and twelve months ended December 31, 2015 was $18.5 million and $68.7 million, respectively, an increase of 15.1% and 7.1% from the comparable periods in 2014. The annualized pre-tax investment yield, excluding net realized gains and losses and other-than-temporary impairment losses recognized in earnings, was 2.5% and 2.4% for the three and twelve months ended December 31, 2015, compared to 2.3% for both the comparable periods in 2014.
The Company’s investment portfolio mainly consists of fixed income securities with an average quality rating of “AA-/Aa3” as defined by Standard & Poor’s and Moody’s, respectively, and an average effective duration of 3.8 years as of December 31, 2015. As of December 31, 2015, net unrealized gains within our investment portfolio were $37.3 million, a decrease of $34.1 million compared to December 31, 2014.
There were $2.1 million of net realized losses recognized in earnings for the three months ended December 31, 2015, compared to $0.8 million of net realized gains for the same period in 2014. For the twelve months ended December 31, 2015, there were $6.7 million of net realized gains, compared to $12.8 million of net realized gains for the same period in 2014.
Other income (loss) for the three months ended December 31, 2015 was $4.1 million of income, compared to $0.6 million of income for the same period in 2014. For the twelve months ended December 31, 2015, Other income (loss) was a $0.5 million loss compared to $10.7 million of income for the same period in the prior year, largely impacted by a one-time foreign exchange gain in the first quarter of 2014. Other income (loss) primarily consists of realized and unrealized foreign exchange gains and losses.
The Company will hold a conference call on Thursday, February 11, 2016 starting at 8:30 a.m. (EST) to discuss the 2015 fourth quarter results. The call will be available via live webcast on Navigators’ website (www.navg.com).
To participate by telephone, the domestic dial-in number is (800) 850-2903 and the international dial-in is (224) 357-2399. Participants may connect to the webcast at:
http://edge.media-server.com/m/p/i53d9p2k
Net operating earnings, or net income excluding after-tax net realized gains (losses), after-tax net other-than-temporary impairment losses recognized in earnings, and after-tax foreign exchange gains and losses resulting from foreign currency transactions (transactions denominated in a currency other than the entity’s functional currency) and translation adjustments (translation of foreign currency denominated assets and liabilities into the entity’s functional currency), is a non-GAAP financial measure that is a common performance measurement for insurance companies. We believe this presentation enhances the understanding of our results of operations by highlighting the underlying profitability of our insurance business.
The Navigators Group, Inc. is an international specialty insurance holding company with insurance company operations, underwriting management companies and operations at Lloyd's. Navigators has offices in the United States, the United Kingdom and Continental Europe, as well as representative offices in China and Brazil.
News Release
February 10, 2016
Page 3
This press release may contain “forward-looking statements” as defined in the Private Securities Litigation Reform Act of 1995. Whenever used in this release, the words “estimate,” “expect,” “believe” or similar expressions are intended to identify such forward-looking statements. Forward-looking statements are derived from information that we currently have and assumptions that we make. We cannot assure that results that we anticipate will be achieved, since results may differ materially because of known and unknown risks and uncertainties that we face. Please refer to Navigators’ most recent reports on Forms 10-K and 10-Q and its other filings with the Securities and Exchange Commission for a description of Navigators’ business and the important factors that may affect that business. Navigators’ undertakes no obligation to publicly update or revise any forward-looking statement.
|
Contact: |
Ciro M. DeFalco |
|
|
Senior Vice President and Chief Financial Officer |
|
|
(203) 905-6343 |
|
|
cdefalco@navg.com |
|
|
www.navg.com |
News Release
February 10, 2016
Page 4
THE NAVIGATORS GROUP, INC AND SUBSIDIARIES
FINANCIAL HIGHLIGHTS
($ in thousands, except share and per share data)
(unaudited)

News Release
February 10, 2016
Page 5

THE NAVIGATORS GROUP, INC. AND SUBSIDIARIES
News Release
February 10, 2016
Page 6
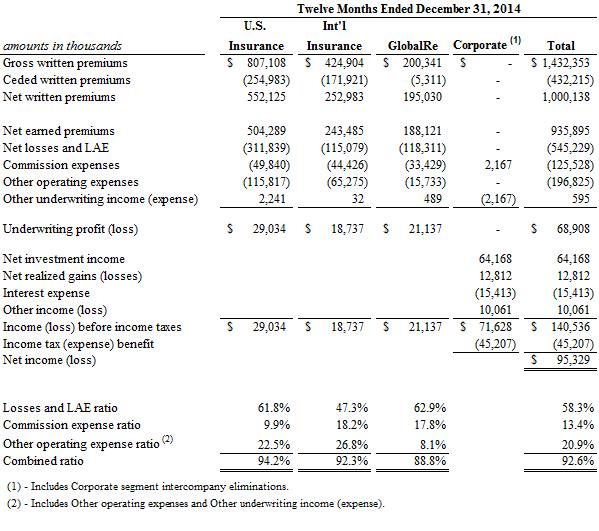
Segment Information

News Release
February 10, 2016
Page 7
THE NAVIGATORS GROUP, INC. AND SUBSIDIARIES
Segment Information

News Release
February 10, 2016
Page 8
THE NAVIGATORS GROUP, INC. AND SUBSIDIARIES
Segment Information

News Release
February 10, 2016
Page 9
THE NAVIGATORS GROUP, INC. AND SUBSIDIARIES
Segment Information
News Release
February 10, 2016
Page 10
THE NAVIGATORS GROUP, INC. AND SUBSIDIARIES
Reportable Segment Results

News Release
February 10, 2016
Page 11
THE NAVIGATORS GROUP, INC. AND SUBSIDIARIES
Reportable Segment Results

News Release
February 10, 2016
Page 12

News Release
February 10, 2016
Page 13

News Release
February 10, 2016
Page 14

News Release
February 10, 2016
Page 15
THE NAVIGATORS GROUP, INC. AND SUBSIDIARIES
Investment Data
As of December 31, 2015, the average quality of the investment portfolio as rated by S&P and Moody’s was AA-/Aa3 with an average duration of 3.8 years. The Company does not own any collateralized debt obligations (CDO’s) or asset backed commercial paper.
The following table sets forth our investments as of December 31, 2015:
