Attached files
| file | filename |
|---|---|
| 8-K - 8-K - Tesla, Inc. | d124215d8k.htm |
Exhibit 99.1

|
Tesla Fourth Quarter & Full Year 2015 Update
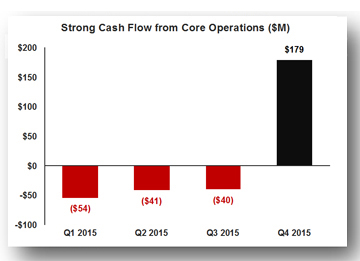
• $179 million positive core operational cash flow in Q4 2015 • Model S deliveries increased 76% year on year in Q4 2015 • Reaffirming plan for about 60-80% new vehicle sales growth in 2016 • Model S gross margin tracking toward 30% by Q4 2016 • Beginning in March, expecting net cash flow positive for remainder of 2016 with ABL • Planning for full year 2016 non-GAAP profitability, GAAP profit in Q4 2016 • Model 3 unveiling is March 31st and on schedule for production & deliveries in late 2017 |
February 10, 2016
Dear Customers and Fellow Shareholders:
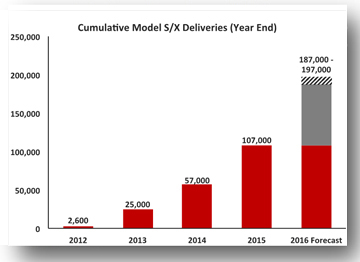
| In 2015, we significantly expanded Tesla’s product breadth and operational scale. We introduced new variants of Model S, launched Model X, introduced our groundbreaking Autopilot functionality on both vehicles, and started our complementary energy storage business. To accommodate growing demand for these products, we added production capacity at five locations and expanded our network of stores, service centers and Superchargers globally. Our customers are now driving over 107,000 Tesla vehicles in 42 countries, and have traveled nearly 2 billion miles. Tesla Autopilot is learning at the rate of over a million real-world miles per day. |
| In Q4 alone, we generated $179 million of positive cash flow from our core operations defined as cash flow consumed in operations of $30 million plus cash of $209 million received from vehicle sales to our leasing partners. Growing worldwide demand for Tesla vehicles, supported by record production, allowed us to achieve this result as we increased deliveries by more than 50% from just the prior quarter. |
| |
|
For 2016, we are planning for even faster delivery growth than last year. We plan to be net cash flow positive and achieve non-GAAP profitability for the year, even after investing about $1.5 billion to add more production capacity, start cell production at the Gigafactory, and establish additional customer support infrastructure. Moderate GAAP profitability is expected in the fourth quarter. These investments will help prepare the way for Model 3, which is on schedule to be unveiled on March 31st and to start production and deliveries in late 2017. |
Vehicle Demand Growth & Increasing Production Capability
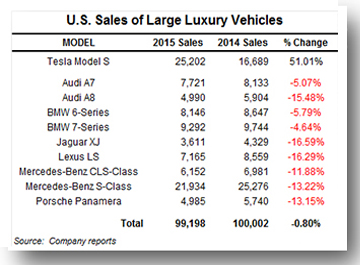
| In Q4, we increased global deliveries over 76% year on year as Model S market share gains continued in every geographic region. In the U.S., just over three years after entering the market, Model S took share from all incumbent manufacturers to become the number one selling comparably priced four-door sedan. In fact, Model S was the only vehicle in its class with growing sales last year. Even on our competitors’ home turf and in countries without government incentives to purchase electric vehicles, Model S is winning. For example, in Switzerland, Model S outsold the |
|
Mercedes Benz S-Class, the BMW 7-Series, the Porsche Panamera and the Audi A-8 combined for the full year, and also outsold the Mercedes Benz E-Class. In Germany in Q4, Model S outsold the Porsche Panamera. Finally, across all of Europe last year Model S outsold the Audi A8 and A7 combined and the BMW 7-Series and 6-Series combined. | |
|
New Model S orders grew over 35% year on year in Q4, with growth in all regions. Even with this growth, we believe that we remain substantially underpenetrated in all of our markets because of our limited retail presence. Additionally, we continue to see no perceptible impact to our order growth from the change in the price of gasoline as our order rates have continued to increase even as the price of gasoline has fallen. In fact, our customers tell us they value a Tesla vehicle more for its superior performance, technology, safety, |
| lower environmental impact and style than for its ability to save money on fuel. We are also seeing this with the strong demand for pre-owned Tesla vehicles, which are trading at prices higher than our expected residual values. This residual performance is enabling our financing partners to reduce both lease and monthly loan payments. |
| Model X reservations grew over 75% as compared to the prior year despite extremely limited initial exposure for this vehicle. Last week, we kicked off our Model X test drive tour for our reservation holders. We are making more Model X vehicles available at our stores for viewing and test drives in the weeks to come. |
| During Q4, we reduced Model S production costs, started volume Model X production and still produced a record 14,037 new Tesla vehicles. In January 2016, we limited Model X production for a period of time to maintain our quality production standards. We are already seeing improvement from these efforts and we are now significantly increasing our Model X production throughout the balance of the quarter. We anticipate approaching a Model X production rate of 1,000 vehicles a week in Q2. |
| Reflecting our philosophy of continuous improvement, we have not relaxed our pursuit of making the world’s most reliable cars. The cost of first year repair claims on cars produced in 2015 was at about half the level of cars produced in 2014, and about one quarter the level of cars produced in 2012. |
Autopilot with Summon – Another Tesla First
|
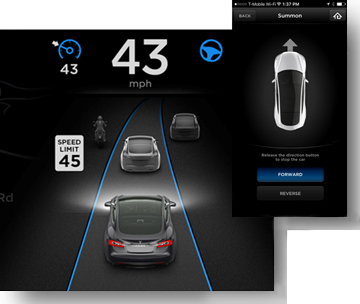
Autopilot Instrument Cluster Display & Smartphone App With Summon |
We launched Autopilot in Q4 and, to the delight of our customers, continually enhanced it with several over-the-air software updates. Customers and media greeted our rollout enthusiastically, with a torrent of online videos and industry acclaim. MotorTrend called Autopilot “otherworldly,” Road & Track remarked that the system was “almost entirely unflappable,” and TechCrunch called the ride a “mind-blowing experience.” | |
|
Consistent with our philosophy of continually improving our vehicles, we recently rolled out expanded Autopilot functionality and also new features like perpendicular self-parking and our new Summon capability. With Summon, Model S and Model X can be parked or unparked even with the driver outside the vehicle, and can even open and close preprogrammed garage doors as needed. Summon is an important step on our way to autonomous driving and showcases our leadership in this area. We are now acknowledged as having the most advanced active safety and near-autonomous driving capabilities of any production car in the world. No surprise that Consumer Reports magazine recently named both the base and the P85D versions of Model S to its list of top ten cars for 2015. In fact, it appears that naming two variants of the same vehicle to this list is another Model S industry first! |
Tesla Energy Debuts on a Global Stage
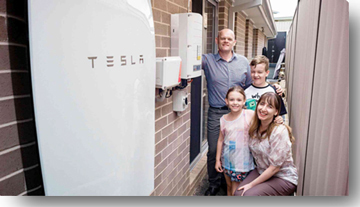
| Global excitement in Tesla Energy products remains very strong. To accommodate this demand, we transitioned production to the Gigafactory in Q4. While this transition did take slightly longer than we had expected, both Powerwall and Powerpack production is now operating smoothly and expanding at the Gigafactory. The first Powerwalls built at the Gigafactory are now installed in the US, Australia and Germany. In our first main markets, Australia and Germany, we have seen Tesla Energy inbound sales leads quickly exceeding vehicle sales leads, more than doubling our total potential Tesla customer inquiries. We are excited about the potential growth in vehicle sales this new energy customer base could also represent.
Even during this initial product launch, Tesla Energy achieved positive gross margin for the quarter. We are on track for a steady increase in gross margins throughout the year as volumes ramp up and costs reduce, allowing a positive cash contribution to Tesla overall even with rapid growth. |
Powerwall Customers in Australia |
| Q4 & Full Year Results | ||
| Total Q4 non-GAAP revenue was $1.75 billion for the quarter, up 59% from a year ago, while GAAP revenue was $1.21 billion. For full year 2015, our revenue totaled $5.29 billion on a non-GAAP basis, up 47% from 2014, and $4.05 billion on a GAAP basis. Total Q4 gross margin was 20.0% on a non-GAAP basis and 18.0% on a GAAP basis. | ||
| Automotive revenue in Q4 was $1.65 billion on a non-GAAP basis, and comprised GAAP Automotive revenue of $1.12 billion plus a net increase of $533 million related to cars with a resale value guarantee or collateralized borrowing and subject to lease accounting. We delivered 17,478 vehicles in Q4, including 206 Model X vehicles. Tesla directly leased 881 cars to customers in Q4, about the same percentage as last quarter and worth $85 million of aggregate transaction value. As expected, Model S average transaction price declined by about 2% due to vehicle and option mix. Price increases outside the U.S. offset the impact of unfavorable movements in foreign currencies during the quarter. | ||
| Q4 Automotive gross margin, excluding $8 million of ZEV credit revenue, was 20.9% on a non-GAAP basis and 19.2% on a GAAP basis. These margin measures were burdened by $67 million non-GAAP ($51 million GAAP) of unfavorable labor and overhead allocations associated with lower than planned Model X production volume, and non-recurring asset impairment charges for obsolete painting equipment and Model S components as we transitioned to improved production processes and designs. Excluding these items, Q4 Automotive gross margin was 25.0% on a non-GAAP basis and 23.7% on a GAAP basis. This represented sequential improvement, despite a decline in average transaction price in Q4. | ||
| Q4 Services and other revenue was $97 million, up 47% from a year ago. Higher used Tesla vehicle sales, as well as growing service and Tesla Energy revenue offset a decline in powertrain sales, compared to Q4 last year.
Q4 GAAP operating expenses were $479 million and included $50 million of non-cash stock based compensation. Our non-GAAP operating expenses in Q4 were higher than expected at $429 million, up 18% from Q3.
Our Q4 non-GAAP net loss was $114 million, or $0.87 per share, and our Q4 GAAP net loss was $320 million or a loss of $2.44 per share, both based on 131 million basic shares. For full year 2015, our net loss was $2.30 per share on a non-GAAP basis and a loss of $6.93 per share on a GAAP basis, both based on 128 million basic shares. |
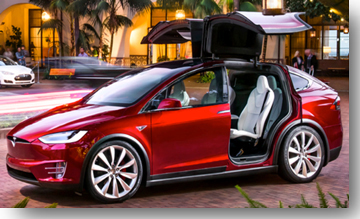
Tesla Model X – Falcon Wings Deployed | |
| Our Q4 earnings per share figures both include a $17 million loss, or $0.13 per basic share, related mostly to unrealized losses from foreign currency revaluation. | ||
| Cash and cash equivalents were $1.2 billion at the end of the quarter. Capital expenditures during the quarter were $411 million, and $1.6 billion for the full year. Capital expenditures were primarily for the capacity expansion and tooling associated with Model X, construction of the Gigafactory, and expansion of service centers, retail locations and the Supercharger network. | ||
| Our GAAP cash outflow from operations during the quarter was $30 million. Operationally, this cash flow is offset by $209 million of cash from vehicle sales to our leasing partners but classified in the financing section of our statement of cash flows. Adjusting for the classification of these cash flows, our core operations generated $179 million of positive cash flow in Q4, and $44 million for the full year. | ||
| We plan to use our leasing partners as the primary funding source for our indirect leasing activities during 2016. We also expect to draw on our asset-based line to support leases funded directly by Tesla and the expected growth in our finished goods inventory. During Q4, we used our asset-based financing line to pay off a more expensive third party warehouse loan facility, resulting in drawings on the asset-based line of $135 million at the end of the quarter. To support these activities, we recently expanded our asset-based line to $1 billion. | ||
| Q1 and Full Year 2016 Outlook | ||
| We expect to generate positive net cash flow and achieve non-GAAP profitability for the full-year 2016. Thus our cash balance at the end of 2016 should increase from the year end 2015 level. We plan to fund about $1.5 billion in capital expenditures without accessing any outside capital other than our existing sources that support our leasing and finished goods inventory. We plan to invest in equipment to support cell production at the Gigafactory, begin installation of Model 3 vehicle production machinery, open about 80 retail locations and service centers, and energize about 300 new Supercharger locations. | ||
|
To achieve these goals we plan to deliver 80,000 to 90,000 new Model S and Model X vehicles in 2016, representing accelerating growth over 2015 at the midpoint of the range. We expect our average vehicle transaction price to increase slightly during 2016, as Model X grows to become a larger share of our deliveries throughout the year. In Q1, we plan to grow deliveries 60% year on year to approximately 16,000 vehicles, and we plan to directly lease about the same percentage of cars as we did in Q4.
Throughout the rest of 2016, Automotive gross margin should continue to increase, helped by cost reductions for Model S and improving margin on Model X as our manufacturing efficiency improves for that vehicle. By year-end, Model S gross margin should begin to approach 30% and Model X gross margin should be about 25%, with continued improvement for Model X in 2017. | |
| Q1 operating expenses should increase just slightly from Q4 as we sharpen our focus on expense management. Then as development work continues on Model 3 and as we expand to support growth, operating expenses should increase throughout 2016, so that for the full year total operating expenses should increase by about 20%. | ||
| Achieving these results in 2016 should leave us well positioned for 2017, when we plan to launch Model 3 and take another significant step towards our mission of accelerating the world’s transition to sustainable transportation. | ||

|

| |
| Elon Musk, Chairman & CEO | Jason Wheeler, Chief Financial Officer | |
Webcast Information
Tesla will provide a live webcast of its fourth quarter and full year 2015 financial results conference call beginning at 2:30 p.m. PT on February 10, 2016, at ir.teslamotors.com. This webcast will also be available for replay for approximately one year thereafter.
Non-GAAP Financial Information
Consolidated financial information has been presented in accordance with GAAP as well as on a non-GAAP basis. On a non-GAAP basis, financial measures exclude non-cash items such as stock-based compensation, the change in fair value related to Tesla’s warrant liability, non-cash interest expense related to Tesla’s convertible senior notes as well as one-time expenses associated with the early repayment of the Department of Energy Loan. Non-GAAP financial measures also exclude the impact of lease accounting on related revenues and cost of revenues associated with Model S deliveries with the resale value guarantee and similar buy-back terms, as this perspective is useful in understanding the underlying cash flow activity and timing of vehicle deliveries. Management believes that it is useful to supplement its GAAP financial statements with this non-GAAP information because management uses such information internally for its operating, budgeting and financial planning purposes. These non-GAAP financial measures also facilitate management’s internal comparisons to Tesla’s historical performance as well as comparisons to the operating results of other companies. Non-GAAP information is not prepared under a comprehensive set of accounting rules and therefore, should only be read in conjunction with financial information reported under U.S. GAAP when understanding Tesla’s operating performance. A reconciliation between GAAP and non-GAAP financial information is provided below.
Forward-Looking Statements
Certain statements in this shareholder letter, including statements in the “Q1 and Full Year 2016 Outlook” section; statements relating to the progress Tesla is making with respect to product development, statements regarding growth in the number of Tesla store, service center, Supercharger locations; statements relating to the production and delivery timing of future products such as Model 3; statements relating to future financing needs and sources; growth in demand and orders for Tesla products and the catalysts for that growth; the ability to achieve product demand, volume, production, delivery, revenue, cash flow, leasing, gross margin, spending, capital expenditure and profitability targets; productivity improvements and capacity expansion plans; and Tesla Gigafactory timing, plans and output expectations, including those related to cell and other production, are “forward-looking statements” that are subject to risks and uncertainties. These forward-looking statements are based on management’s current expectations, and as a result of certain risks and uncertainties, actual results may differ materially from those projected. The following important factors, without limitation, could cause actual results to differ materially from those in the forward-looking statements: the risk of delays in the manufacture, production and delivery of Model S and Model X vehicles and Tesla Energy products, and production and delivery of Model 3 vehicles; the ability to design and achieve market acceptance of Model S and its variants, as well as new vehicle models, specifically Model X and Model 3; the ability of suppliers to meet quality and part delivery expectations at increasing volumes; adverse foreign exchange movements; any failures by Tesla products to perform as expected or if product recalls occur; Tesla’s ability to continue to reduce or control manufacturing and other costs; consumers’ willingness to adopt electric vehicles; competition in the automotive market generally and the alternative fuel vehicle market in particular; Tesla’s ability to establish, maintain and strengthen the Tesla brand; Tesla’s ability to manage future growth effectively as we rapidly grow, especially internationally; the unavailability, reduction or elimination of government and economic incentives for electric vehicles; Tesla’s ability to establish, maintain and strengthen its relationships with strategic partners such as Panasonic; potential difficulties in finalizing, performing and realizing potential benefits under definitive agreements for the Tesla Gigafactory site, obtaining permits and incentives, negotiating terms with technology, materials and other partners for Gigafactory, and maintaining Gigafactory implementation schedules, output and costs estimates; and Tesla’s ability to execute on its retail strategy and for new store, service center and Tesla Supercharger openings. More information on potential factors that could affect our financial results is included from time to time in our Securities and Exchange Commission filings and reports, including the risks identified under the section captioned “Risk Factors” in our quarterly report on Form 10-Q filed with the SEC on November 5, 2015. Tesla disclaims any obligation to update information contained in these forward-looking statements whether as a result of new information, future events, or otherwise.
| Investor Relations Contact: | Press Contact: | |||
| Jeff Evanson | Khobi Brooklyn | |||
| Investor Relations – Tesla | Communications – Tesla | |||
| ir@teslamotors.com | press@teslamotors.com |
Tesla Motors, Inc.
Condensed Consolidated Statements of Operations
(Unaudited)
(In thousands, except per share data)
| Three Months Ended | Year Ended | |||||||||||||||||||
| Dec 31, 2015 |
Sep 30, 2015 |
Dec 31, 2014 |
Dec 31, 2015 |
Dec 31, 2014 |
||||||||||||||||
| Revenues |
||||||||||||||||||||
| Automotive (1A) |
$ | 1,117,007 | $ | 852,555 | $ | 890,396 | $ | 3,740,972 | $ | 3,007,012 | ||||||||||
| Services and other |
97,372 | 84,234 | 66,265 | 305,052 | 191,344 | |||||||||||||||
|
|
|
|
|
|
|
|
|
|
|
|||||||||||
| Total revenues |
1,214,379 | 936,789 | 956,661 | 4,046,024 | 3,198,356 | |||||||||||||||
|
|
|
|
|
|
|
|
|
|
|
|||||||||||
| Cost of revenues |
||||||||||||||||||||
| Automotive (1B) |
896,441 | 628,729 | 636,698 | 2,823,301 | 2,145,749 | |||||||||||||||
| Services and other |
99,374 | 76,564 | 58,266 | 299,220 | 170,936 | |||||||||||||||
|
|
|
|
|
|
|
|
|
|
|
|||||||||||
| Total cost of revenues (2) |
995,815 | 705,293 | 694,964 | 3,122,521 | 2,316,685 | |||||||||||||||
|
|
|
|
|
|
|
|
|
|
|
|||||||||||
| Gross profit |
218,564 | 231,496 | 261,697 | 923,503 | 881,671 | |||||||||||||||
| Operating expenses |
||||||||||||||||||||
| Research and development (2) |
190,243 | 178,791 | 139,565 | 717,900 | 464,700 | |||||||||||||||
| Selling, general and administrative (2) |
288,654 | 236,367 | 196,970 | 922,232 | 603,660 | |||||||||||||||
|
|
|
|
|
|
|
|
|
|
|
|||||||||||
| Total operating expenses |
478,897 | 415,158 | 336,535 | 1,640,132 | 1,068,360 | |||||||||||||||
|
|
|
|
|
|
|
|
|
|
|
|||||||||||
| Loss from operations |
(260,333 | ) | (183,662 | ) | (74,838 | ) | (716,629 | ) | (186,689 | ) | ||||||||||
| Interest income |
750 | 327 | 219 | 1,508 | 1,126 | |||||||||||||||
| Interest expense |
(38,617 | ) | (29,308 | ) | (28,703 | ) | (118,851 | ) | (100,886 | ) | ||||||||||
| Other income (expense), net |
(17,149 | ) | (15,431 | ) | (588 | ) | (41,652 | ) | 1,813 | |||||||||||
|
|
|
|
|
|
|
|
|
|
|
|||||||||||
| Loss before income taxes |
(315,349 | ) | (228,074 | ) | (103,910 | ) | (875,624 | ) | (284,636 | ) | ||||||||||
| Provision for income taxes |
5,048 | 1,784 | 3,719 | 13,039 | 9,404 | |||||||||||||||
|
|
|
|
|
|
|
|
|
|
|
|||||||||||
| Net loss |
$ | (320,397 | ) | $ | (229,858 | ) | $ | (107,629 | ) | $ | 888,663 | $ | (294,040 | ) | ||||||
|
|
|
|
|
|
|
|
|
|
|
|||||||||||
| Net loss per common share, basic and diluted |
$ | (2.44 | ) | $ | (1.78 | ) | $ | (0.86 | ) | $ | (6.93 | ) | $ | (2.36 | ) | |||||
|
|
|
|
|
|
|
|
|
|
|
|||||||||||
| Shares used in per share calculation, basic and diluted |
131,100 | 129,006 | 125,497 | 128,202 | 124,573 | |||||||||||||||
|
|
|
|
|
|
|
|
|
|
|
|||||||||||
Notes:
| (1) | Due to the application of lease accounting for Model S vehicles with the resale value guarantee or similar buy-back terms, the following is supplemental information for the periods presented: |
| (A) Net increase in deferred revenue and other long-term liabilities as a result of lease accounting and therefore not recognized in automotive sales |
$ | 532,646 | $ | 307,048 | $ | 138,973 | $ | 1,245,517 | $ | 400,185 | ||||||||||
|
|
|
|
|
|
|
|
|
|
|
|||||||||||
| (B) Net increase in operating lease vehicles as a result of lease accounting and therefore not recognized in automotive cost of sales |
$ | 401,385 | $ | 221,268 | $ | 110,234 | $ | 910,719 | $ | 312,710 | ||||||||||
|
|
|
|
|
|
|
|
|
|
|
The table above excludes assumed net warranty and stock based compensation amounts included in non-GAAP cost of sales.
| (2) | Includes stock-based compensation expense of the following for the periods presented: |
| Cost of revenues |
$ | 5,995 | $ | 3,828 | $ | 5,053 | $ | 19,244 | $ | 17,454 | ||||||||||
| Research and development |
25,452 | 24,153 | 17,595 | 89,309 | 62,601 | |||||||||||||||
| Selling, general and administrative |
24,158 | 28,052 | 21,869 | 89,446 | 76,441 | |||||||||||||||
|
|
|
|
|
|
|
|
|
|
|
|||||||||||
| Total stock-based compensation expense |
$ | 55,605 | $ | 56,033 | $ | 44,517 | $ | 197,999 | $ | 156,496 | ||||||||||
|
|
|
|
|
|
|
|
|
|
|
|||||||||||
Classification of Revenues and Costs of Revenues
Our income statement reflects the classifications of revenues and costs of revenues to segregate our new vehicle business from our other business activities. “Automotive” revenue and related costs now reflect activities related to the sale or lease of new vehicles including regulatory credits, data connectivity, Autopilot functionality and Supercharging. “Services and other” revenues and related costs include activities such as powertrain sales, service revenue, Tesla Energy and pre-owned Tesla vehicle sales.
Tesla Motors, Inc.
Condensed Consolidated Balance Sheets
(Unaudited)
(In thousands)
| Dec 31, | Dec 31, | |||||||
| 2015 | 2014 | |||||||
| Assets |
||||||||
| Cash and cash equivalents |
$ | 1,196,908 | $ | 1,905,713 | ||||
| Restricted cash and marketable securities - current |
22,628 | 17,947 | ||||||
| Accounts receivable |
168,965 | 226,604 | ||||||
| Inventory |
1,277,838 | 953,675 | ||||||
| Prepaid expenses and other current assets |
125,229 | 94,718 | ||||||
| Operating lease vehicles, net (1) |
1,791,403 | 766,744 | ||||||
| Property and equipment, net |
3,403,334 | 1,829,267 | ||||||
| Restricted cash - noncurrent |
31,522 | 11,374 | ||||||
| Other assets |
74,633 | 43,209 | ||||||
|
|
|
|
|
|||||
| Total assets |
$ | 8,092,460 | $ | 5,849,251 | ||||
|
|
|
|
|
|||||
| Liabilities and Stockholders’ Equity |
||||||||
| Accounts payable and accrued liabilities |
$ | 1,338,945 | $ | 1,046,830 | ||||
| Deferred revenue (2) |
1,006,896 | 483,922 | ||||||
| Customer deposits |
283,370 | 257,587 | ||||||
| Capital lease obligations |
32,671 | 21,799 | ||||||
| Long-term debt |
2,640,869 | 2,408,084 | ||||||
| Other long-term liabilities (3) |
1,658,720 | 661,123 | ||||||
|
|
|
|
|
|||||
| Total liabilities |
6,961,471 | 4,879,345 | ||||||
| Mezzanine equity (4) |
42,045 | 58,196 | ||||||
| Stockholders’ equity |
1,088,944 | 911,710 | ||||||
|
|
|
|
|
|||||
| Total liabilities and stockholders’ equity |
$ | 8,092,460 | $ | 5,849,251 | ||||
|
|
|
|
|
|||||
Notes:
| (1) | Includes the following increase in operating lease vehicles related to deliveries and subject to lease accounting, net of depreciation recognized in automotive cost of sales, for the following periods: |
| Resale value guarantee program (and other vehicles with similar buy-back terms) |
||||||||
| Beginning balance |
$ | 689,689 | $ | 376,979 | ||||
| First quarter |
103,022 | 69,743 | ||||||
| Second quarter |
170,025 | 68,752 | ||||||
| Third quarter |
215,337 | 63,981 | ||||||
| Fourth quarter |
378,455 | 110,234 | ||||||
|
|
|
|
|
|||||
| Ending balance |
$ | 1,556,528 | $ | 689,689 | ||||
|
|
|
|
|
|||||
| Model S leasing program |
||||||||
| Beginning balance |
$ | 81,636 | $ | — | ||||
| First quarter |
35,687 | — | ||||||
| Second quarter |
39,587 | 11,214 | ||||||
| Third quarter |
25,162 | 23,824 | ||||||
| Fourth quarter |
52,547 | 46,598 | ||||||
|
|
|
|
|
|||||
| Ending balance |
$ | 234,619 | $ | 81,636 | ||||
|
|
|
|
|
|||||
| (2) | Includes the following increase in deferred revenue related to deliveries with the resale value guarantee and similar programs and subject to lease accounting, net of revenue amortized to automotive sales, for the following periods: |
| Beginning balance |
$ | 376,471 | $ | 227,868 | ||||
| First quarter |
45,334 | 38,188 | ||||||
| Second quarter |
60,767 | 33,586 | ||||||
| Third quarter |
67,522 | 27,993 | ||||||
| Fourth quarter |
129,037 | 48,836 | ||||||
|
|
|
|
|
|||||
| Ending balance |
$ | 679,131 | $ | 376,471 | ||||
|
|
|
|
|
|||||
| (3) Includes the following increase in other liabilities related to deliveries with the resale value guarantee and similar programs and subject to lease accounting for the following periods: |
||||||||
| Beginning balance |
$ | 487,879 | $ | 236,298 | ||||
| First quarter |
118,341 | 54,318 | ||||||
| Second quarter |
186,957 | 54,575 | ||||||
| Third quarter |
245,133 | 52,551 | ||||||
| Fourth quarter |
392,263 | 90,137 | ||||||
|
|
|
|
|
|||||
| Ending balance |
$ | 1,430,573 | $ | 487,879 | ||||
|
|
|
|
|
|||||
| (4) | Our common stock price exceeded the conversion threshold price of our convertible senior notes due 2018 (2018 Notes) issued in May 2013; therefore, the 2018 Notes are convertible at the holder’s option during the first quarter of 2015. As such, the carrying value of the 2018 Notes was classified as a current liability as of December 31, 2015 and the difference between the principal amount and the carrying value of the 2018 Notes was reflected as convertible debt in mezzanine equity on our condensed consolidated balance sheet as of December 31, 2015. |
Tesla Motors, Inc.
Supplemental Consolidated Financial Information
(Unaudited)
(In thousands)
| Three Months Ended | Year Ended | |||||||||||||||||||
| Dec 31, 2015 |
Sep 30, 2015 |
Dec 31, 2014 |
Dec 31, 2015 |
Dec 31, 2014 |
||||||||||||||||
| Selected Cash Flow Information |
||||||||||||||||||||
| Cash flows provided by (used in) operating activities (1) |
$ | (29,849 | ) | $ | (203,340 | ) | $ | (86,402 | ) | $ | (524,499 | ) | $ | (57,337 | ) | |||||
| Cash flows used in investing activities |
(414,280 | ) | (404,090 | ) | (372,231 | ) | (1,673,551 | ) | (990,444 | ) | ||||||||||
| Cash flows provided by financing activities |
225,038 | 893,978 | 11,325 | 1,523,523 | 2,143,130 | |||||||||||||||
| Other Selected Financial Information |
||||||||||||||||||||
| Cash flows provided by (used in) operating activities (1) |
$ | (29,849 | ) | $ | (203,340 | ) | $ | (86,402 | ) | $ | (524,499 | ) | $ | (57,337 | ) | |||||
| Change in collateralized lease borrowing |
$ | 208,793 | $ | 163,416 | $ | 3,271 | $ | 568,745 | $ | 3,271 | ||||||||||
|
|
|
|
|
|
|
|
|
|
|
|||||||||||
| Cash flow from core operations |
$ | 178,944 | $ | (39,924 | ) | $ | (83,131 | ) | $ | 44,246 | $ | (54,066 | ) | |||||||
|
|
|
|
|
|
|
|
|
|
|
|||||||||||
| Capital expenditures |
(411,222 | ) | (392,403 | ) | (368,661 | ) | (1,634,850 | ) | (969,885 | ) | ||||||||||
| Depreciation and amortization |
$ | 143,723 | $ | 110,366 | $ | 67,976 | $ | 422,590 | $ | 231,931 | ||||||||||
| Dec 31, 2015 |
Sep 30, 2015 |
Dec 31, 2014 |
||||||||||
| Cash and Investments |
||||||||||||
| Cash and cash equivalents |
$ | 1,196,908 | $ | 1,426,036 | $ | 1,905,713 | ||||||
| Restricted cash and marketable securities - current |
22,628 | 25,223 | 17,947 | |||||||||
| Restricted cash - noncurrent |
31,522 | 26,355 | 11,374 | |||||||||
| (1) | During the three months ended June 30, 2014, we began separately presenting the effect of exchange rate changes on our cash and cash equivalents in our condensed consolidated statement of cash flows due to our growing operations in foreign currency environments. Prior period amounts have been reclassified to conform to the current period presentation. |
Supplemental Model S Leasing Program Information
(in thousands, except for vehicle deliveries)
| Three Months Ended | Twelve Months Ended | |||||||||||||||||||
| Dec 31, 2015 |
Sep 30, 2015 |
Dec 31, 2014 |
Dec 31, 2015 |
Dec 31, 2014 |
||||||||||||||||
| Vehicles delivered |
881 | 495 | 647 | 2,598 | 1,152 | |||||||||||||||
| Average per unit price of vehicles delivered |
$ | 97 | $ | 91 | $ | 101 | $ | 99 | $ | 101 | ||||||||||
|
|
|
|
|
|
|
|
|
|
|
|||||||||||
| Aggregate value of vehicles delivered (1) |
$ | 85,328 | $ | 44,804 | $ | 65,246 | $ | 256,619 | $ | 115,782 | ||||||||||
|
|
|
|
|
|
|
|
|
|
|
|||||||||||
| Leasing revenue recognized |
$ | 13,704 | $ | 11,514 | $ | 2,993 | $ | 40,915 | $ | 4,280 | ||||||||||
| (1) | Aggregate value is the product of multiplying vehicles delivered by the average per unit price of vehicles delivered |
Non-GAAP Financial Information
This letter includes non-GAAP financial information because we plan and manage our business using such information. Our non-GAAP measures align the recognition of revenues and costs related to a vehicle sale with the time when the customer take delivery of the car and cash is received or owed to us. This contrasts with the approach of other automotive manufacturers who under GAAP accounting recognize revenue when the vehicle is sold into dealership inventory rather than to end customers, even though in the case of a captive finance lease they may not collect cash for several years on a consolidated basis.
Our non-GAAP revenue and gross profit is determined by adding back the deferred revenue and related costs for cars sold with resale value guarantee and where we have collected, or will collect from a bank intermediary in a matter of days, the purchase price of the car in cash. For cars leased directly by Tesla, we recognize lease revenue and related costs over the lease term and the same way for both GAAP and non-GAAP purposes. Our non-GAAP expense and per share information also exclude non-cash interest expense and stock-based compensation.
Tesla Motors, Inc.
Reconciliation of GAAP to Non-GAAP Financial Information
(Unaudited)
(In thousands, except per share data)
| Three Months Ended | Year Ended | |||||||||||||||||||
| Dec 31, 2015 |
Sep 30, 2015 |
Dec 31, 2014 |
Dec 31, 2015 |
Dec 31, 2014 |
||||||||||||||||
| Net loss (GAAP) |
$ | (320,397 | ) | $ | (229,858 | ) | $ | (107,629 | ) | $ | (888,663 | ) | $ | (294,040 | ) | |||||
| Stock-based compensation expense |
55,605 | 56,033 | 44,517 | 197,999 | 156,496 | |||||||||||||||
| Non-cash interest expense related to convertible notes and other borrowing |
26,716 | 21,850 | 20,826 | 86,247 | 75,019 | |||||||||||||||
|
|
|
|
|
|
|
|
|
|
|
|||||||||||
| Net income (loss) (Non-GAAP) including lease accounting |
(238,076 | ) | (151,975 | ) | (42,286 | ) | (604,417 | ) | (62,525 | ) | ||||||||||
|
|
|
|
|
|
|
|
|
|
|
|||||||||||
| Model S gross profit deferred due to lease accounting (1)(2) |
124,190 | 77,022 | 26,072 | 309,515 | 82,626 | |||||||||||||||
|
|
|
|
|
|
|
|
|
|
|
|||||||||||
| Net income (loss) (Non-GAAP) |
$ | (113,886 | ) | $ | (74,953 | ) | $ | (16,214 | ) | $ | (294,902 | ) | $ | 20,101 | ||||||
|
|
|
|
|
|
|
|
|
|
|
|||||||||||
| Net loss per share, basic (GAAP) |
$ | (2.44 | ) | $ | (1.78 | ) | $ | (0.86 | ) | $ | (6.93 | ) | $ | (2.36 | ) | |||||
| Stock-based compensation expense |
0.42 | 0.43 | 0.35 | 1.54 | 1.26 | |||||||||||||||
| Non-cash interest expense related to convertible notes and other borrowing |
0.20 | 0.17 | 0.17 | 0.67 | 0.60 | |||||||||||||||
| Model S gross profit deferred due to lease accounting (1)(2) |
0.95 | 0.60 | 0.21 | 2.41 | 0.66 | |||||||||||||||
|
|
|
|
|
|
|
|
|
|
|
|||||||||||
| Net income (loss) per share, basic (Non-GAAP) |
$ | (0.87 | ) | $ | (0.58 | ) | $ | (0.13 | ) | $ | (2.30 | ) | $ | 0.16 | ||||||
|
|
|
|
|
|
|
|
|
|
|
|||||||||||
| Shares used in per share calculation, basic (GAAP and Non-GAAP) |
131,100 | 129,006 | 125,497 | 128,202 | 124,573 | |||||||||||||||
|
|
|
|
|
|
|
|
|
|
|
|||||||||||
| Net loss per share, diluted (GAAP) |
$ | (2.44 | ) | $ | (1.78 | ) | $ | (0.86 | ) | $ | (6.93 | ) | $ | (2.07 | ) | |||||
| Stock-based compensation expense |
0.42 | 0.43 | 0.35 | 1.54 | 1.10 | |||||||||||||||
| Non-cash interest expense related to convertible notes and other borrowing |
0.20 | 0.17 | 0.17 | 0.68 | 0.53 | |||||||||||||||
|
|
|
|
|
|
|
|
|
|
|
|||||||||||
| Net income (loss) (Non-GAAP) including lease accounting |
(1.82 | ) | (1.18 | ) | (0.34 | ) | (4.71 | ) | (0.44 | ) | ||||||||||
|
|
|
|
|
|
|
|
|
|
|
|||||||||||
| Model S gross profit deferred due to lease accounting (1)(2) |
0.95 | 0.60 | 0.21 | 2.41 | 0.58 | |||||||||||||||
|
|
|
|
|
|
|
|
|
|
|
|||||||||||
| Net income (loss) per share, diluted (Non-GAAP) |
$ | (0.87 | ) | $ | (0.58 | ) | $ | (0.13 | ) | $ | (2.30 | ) | $ | 0.14 | ||||||
|
|
|
|
|
|
|
|
|
|
|
|||||||||||
| Shares used in per share calculation, diluted (Non-GAAP) |
131,100 | 129,006 | 125,497 | 128,202 | 142,221 | |||||||||||||||
|
|
|
|
|
|
|
|
|
|
|
|||||||||||
| (1) | Includes deliveries of Model S with the resale value guarantee or similar buy-back terms and not deliveries under the Model S leasing program. |
| (2) | Under GAAP, warranty costs are expensed as incurred for Model S vehicle deliveries with the resale value guarantee or similar buy-back terms and subject to lease accounting. For Non-GAAP purposes, an estimated incremental warranty reserve of $14.9 million, $12.7 million and $5.5 million is included for the three months ended December 31, 2015 , September 30, 2015, and December 31, 2014, respectively. For the year ended December 31, 2015 and 2014, an estimated incremental warranty reserve of $44.6 million and $14.6 million is included, respectively. Additionally, stock-based compensation of $4.3 million, $2.4 million and $1.0 million is excluded for non-GAAP purposes for the three months ended December 31, 2015, September 30, 2015, and December 31, 2014, respectively. For the year ended December 31, 2015 and 2014, stock-based compensation of $10.6 million and $3.4 million is excluded, respectively. |
Tesla Motors, Inc.
Reconciliation of GAAP to Non-GAAP Financial Information
(Unaudited)
(In thousands, except per share data)
| Three Months Ended | Year Ended | |||||||||||||||||||
| Dec 31, 2015 |
Sep 30, 2015 |
Dec 31, 2014 |
Dec 31, 2015 |
Dec 31, 2014 |
||||||||||||||||
| Revenues (GAAP) |
$ | 1,214,378 | $ | 936,789 | $ | 956,661 | $ | 4,046,025 | $ | 3,198,356 | ||||||||||
| Model S revenue deferred due to lease accounting (1) |
532,646 | 307,048 | 138,973 | 1,245,517 | 400,185 | |||||||||||||||
|
|
|
|
|
|
|
|
|
|
|
|||||||||||
| Revenues (Non-GAAP) |
$ | 1,747,024 | $ | 1,243,837 | $ | 1,095,634 | $ | 5,291,542 | $ | 3,598,541 | ||||||||||
|
|
|
|
|
|
|
|
|
|
|
|||||||||||
| Gross profit (GAAP) |
$ | 218,563 | $ | 231,496 | $ | 261,697 | $ | 923,502 | $ | 881,671 | ||||||||||
| Model S gross profit deferred due to lease accounting (1)(2) |
124,190 | 77,022 | 26,072 | 309,515 | 82,626 | |||||||||||||||
| Stock-based compensation expense |
5,995 | 3,828 | 5,053 | 19,244 | 17,455 | |||||||||||||||
|
|
|
|
|
|
|
|
|
|
|
|||||||||||
| Gross profit (Non-GAAP) |
$ | 348,748 | $ | 312,346 | $ | 292,822 | $ | 1,252,261 | $ | 981,752 | ||||||||||
|
|
|
|
|
|
|
|
|
|
|
|||||||||||
| Research and development expenses (GAAP) |
$ | 190,243 | $ | 178,791 | $ | 139,565 | $ | 717,900 | $ | 464,700 | ||||||||||
| Stock-based compensation expense |
(25,452 | ) | (24,153 | ) | (17,595 | ) | (89,309 | ) | (62,601 | ) | ||||||||||
|
|
|
|
|
|
|
|
|
|
|
|||||||||||
| Research and development expenses (Non-GAAP) |
$ | 164,791 | $ | 154,638 | $ | 121,970 | $ | 628,591 | $ | 402,099 | ||||||||||
|
|
|
|
|
|
|
|
|
|
|
|||||||||||
| Selling, general and administrative expenses (GAAP) |
$ | 288,654 | $ | 236,367 | $ | 196,970 | $ | 922,232 | $ | 603,660 | ||||||||||
| Stock-based compensation expense |
(24,158 | ) | (28,052 | ) | (21,869 | ) | (89,446 | ) | (76,441 | ) | ||||||||||
|
|
|
|
|
|
|
|
|
|
|
|||||||||||
| Selling, general and administrative expenses (Non-GAAP) |
$ | 264,496 | $ | 208,315 | $ | 175,101 | $ | 832,786 | $ | 527,219 | ||||||||||
|
|
|
|
|
|
|
|
|
|
|
|||||||||||
| (1) | Includes deliveries of Model S with the resale value guarantee or similar buy-back terms and not deliveries under the Model S leasing program. |
| (2) | Under GAAP, warranty costs are expensed as incurred for Model S vehicle deliveries with the resale value guarantee or similar buy-back terms and subject to lease accounting. For Non-GAAP purposes, an estimated incremental warranty reserve of $14.9 million, $12.7 million and $5.5 million is included for the three months ended December 31, 2015 , September 30, 2015, and December 31, 2014, respectively. For the year ended December 31, 2015 and 2014, an estimated incremental warranty reserve of $44.6 million and $14.6 million is included, respectively. Additionally, stock-based compensation of $4.3 million, $2.4 million and $1.0 million is excluded for non-GAAP purposes for the three months ended December 31, 2015, September 30, 2015, and December 31, 2014, respectively. For the year ended December 31, 2015 and 2014, stock-based compensation of $10.6 million and $3.4 million is excluded, respectively. |