Attached files
| file | filename |
|---|---|
| 8-K - 8-K - RADIANT LOGISTICS, INC | rlgt-8k_20160210.htm |
(NYSE-MKT: RLGT) BB&T 31st Annual Transportation Services Conference February 2016
Forward-Looking Statements This presentation and discussion includes forward-looking statements within the meaning of Section 21E of the Securities Exchange Act of 1934, as amended, and Section 27A of the Securities Act of 1933, as amended, and such statements are subject to the safe harbor created by those sections and the Private Securities Litigation Reform Act of 1995, as amended. All statements, other than statements of historical fact, including without limitation statements regarding the financial position, strategic plan and other plans, projections, future industry characteristics, growth expectations, future ability to identify, consummate, and integrate acquisitions, and objectives for our future operations, are forward-looking statements. Such statements may be identified by their use of terms or phrases such as “may,” “could,” “expects,” “estimates,” “projects,” “believes,” “anticipates,” “plans,” “intends,” and similar terms and phrases. Forward-looking statements are based upon the current beliefs and expectations of our management and are inherently subject to risks and uncertainties, some of which cannot be predicted or quantified, which could cause future events and actual results to differ materially from those set forth in, contemplated by, or underlying the forward-looking statements. Although we believe that such forward-looking statements are based on reasonable assumptions, we give no assurance that our expectations will in fact occur. For examples of risks, uncertainties, and events that may cause our actual results to differ materially from the expectations we describe in our forward-looking statements, see “Risk Factors” in the prospectus to which this offering relates and the documents incorporated by reference therein. Existing and prospective investors are cautioned not to place undue reliance on forward-looking statements, which speak only as of the date hereof. We undertake no obligation to publicly update or revise any forward-looking statements after the date they are made, whether as a result of new information, future events or otherwise, except for the extent required by applicable securities laws. Non-GAAP Financial Data This presentation includes the use of EBITDA, adjusted EBITDA, adjusted net income, and adjusted net income per share, which are financial measures that are not in accordance with generally accepted accounting principles (“GAAP”). Each such measure is a supplemental non-GAAP financial measure that is used by management and external users of our financial statements, such as industry analysts, investors and lenders. While management believes such measures are useful for investors, they should not be used as a replacement for financial measures that are in accordance with GAAP. We define EBITDA to exclude the effects of preferred stock dividends, interest and taxes, and excludes the “non-cash” effects of depreciation and amortization on long-term assets. Companies have some discretion as to which elements of depreciation and amortization are excluded in the EBITDA calculation. We exclude all depreciation charges related to furniture and equipment, all amortization charges, including amortization of leasehold improvements and other intangible assets. We define adjusted EBITDA to exclude changes in contingent consideration, expenses specifically attributable to acquisitions, severance and lease termination costs, F/X gains and losses, extraordinary items, share-based compensation expense, non-recurring litigation expenses, and other non-cash charges. For adjusted net income and adjusted net income per share, management uses a 36% tax rate for calculating the provision for income taxes before preferred dividend requirement to normalize the Company's tax rate to that of its competitors and to compare the Company's reporting periods with difference effective tax rates. In addition, in arriving at adjusted net income, the Company adjusts for significant items that are not part of regular operating activities. These adjustments include acquisition costs, transition, severance and lease termination costs, non-recurring litigation expenses as well as depreciation and amortization and certain other non-cash charges. Our presentation of EBITDA, adjusted EBITDA, adjusted net income, and adjusted net income per share should not be construed as an inference that our results will be unaffected by unusual or non-recurring items. Our computations of EBITDA, adjusted EBITDA, adjusted net income, and adjusted net income per share may not be comparable to other similarly titled measures of other companies. Disclaimer
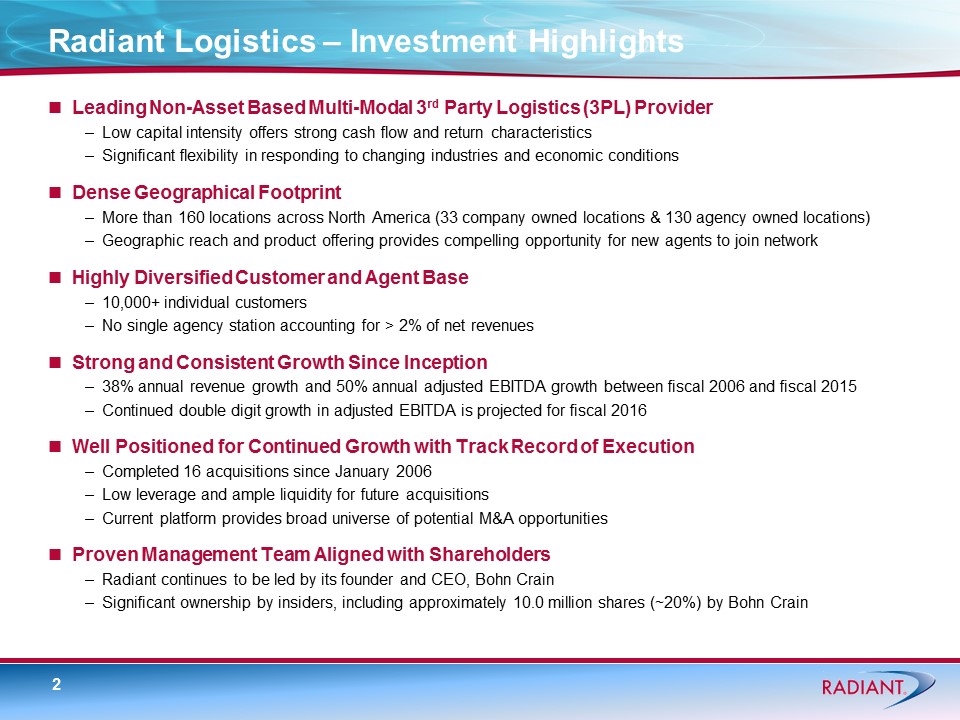
Radiant Logistics – Investment Highlights Leading Non-Asset Based Multi-Modal 3rd Party Logistics (3PL) Provider Low capital intensity offers strong cash flow and return characteristics Significant flexibility in responding to changing industries and economic conditions Dense Geographical Footprint More than 160 locations across North America (33 company owned locations & 130 agency owned locations) Geographic reach and product offering provides compelling opportunity for new agents to join network Highly Diversified Customer and Agent Base 10,000+ individual customers No single agency station accounting for > 2% of net revenues Strong and Consistent Growth Since Inception 38% annual revenue growth and 50% annual adjusted EBITDA growth between fiscal 2006 and fiscal 2015 Continued double digit growth in adjusted EBITDA is projected for fiscal 2016 Well Positioned for Continued Growth with Track Record of Execution Completed 16 acquisitions since January 2006 Low leverage and ample liquidity for future acquisitions Current platform provides broad universe of potential M&A opportunities Proven Management Team Aligned with Shareholders Radiant continues to be led by its founder and CEO, Bohn Crain Significant ownership by insiders, including approximately 10.0 million shares (~20%) by Bohn Crain
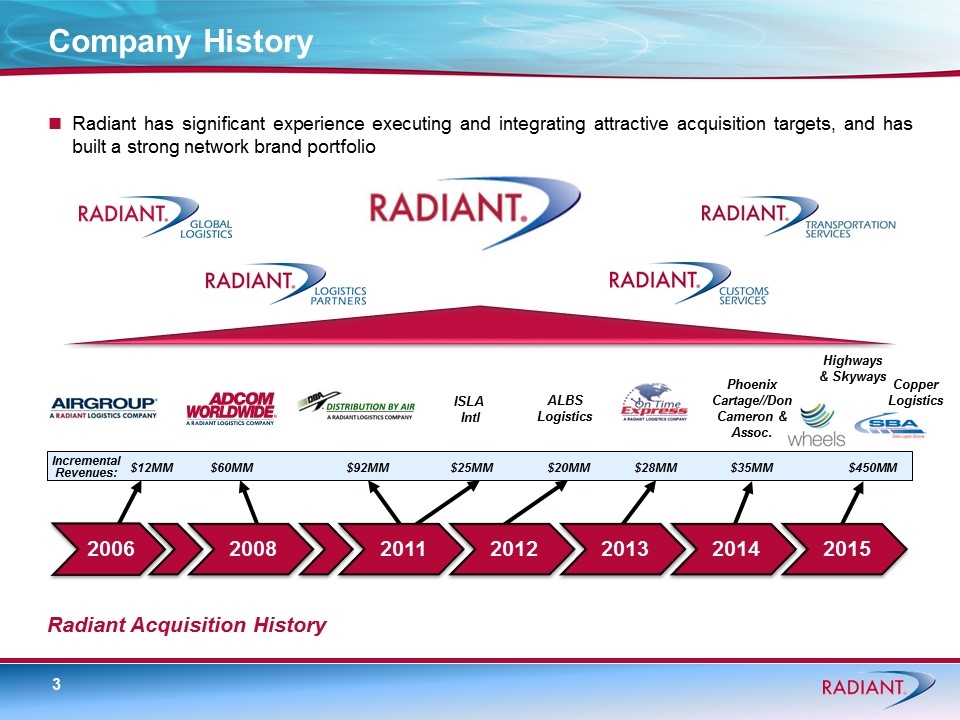
Company History Radiant has significant experience executing and integrating attractive acquisition targets, and has built a strong network brand portfolio Radiant Acquisition History ALBS Logistics $12MM $60MM $92MM $25MM $20MM $28MM Incremental Revenues: ISLA Intl Phoenix Cartage//Don Cameron & Assoc. $35MM $450MM Highways & Skyways Copper Logistics 2006 2008 2011 2012 2013 2014 2015
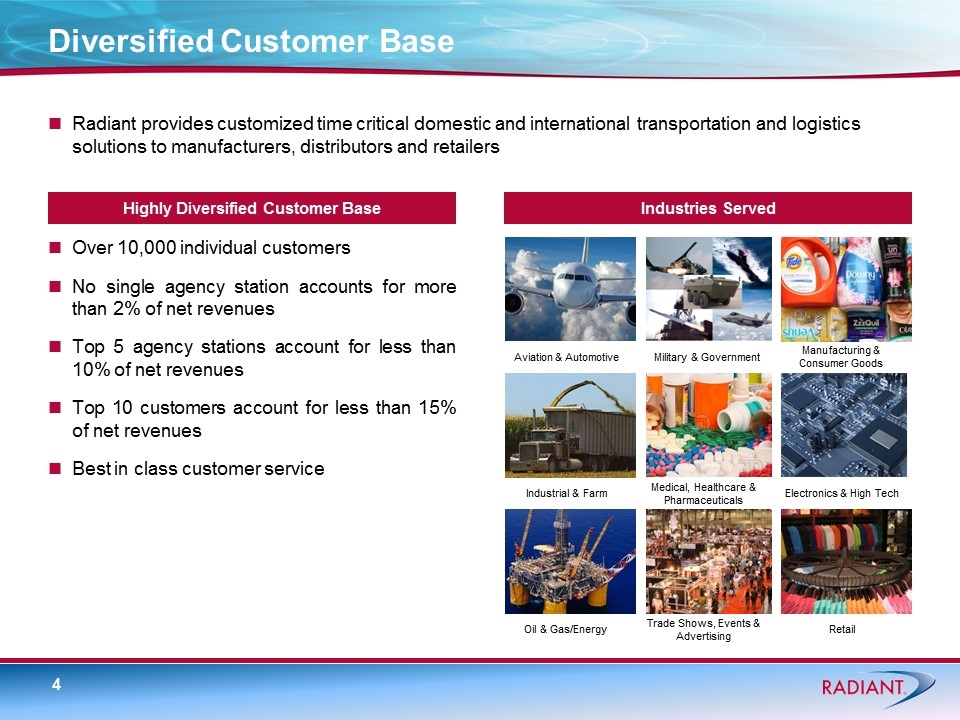
Diversified Customer Base Over 10,000 individual customers No single agency station accounts for more than 2% of net revenues Top 5 agency stations account for less than 10% of net revenues Top 10 customers account for less than 15% of net revenues Best in class customer service Aviation & Automotive Military & Government Manufacturing & Consumer Goods Industrial & Farm Medical, Healthcare & Pharmaceuticals Electronics & High Tech Oil & Gas/Energy Trade Shows, Events & Advertising Retail Industries Served Highly Diversified Customer Base Radiant provides customized time critical domestic and international transportation and logistics solutions to manufacturers, distributors and retailers
Structural changes within the freight forwarding community, resulting from industry deregulation in the 1970s and the natural “graying” of industry pioneers, provide an opportunity to support the logistics entrepreneur in transition Uniquely positioned to bring value to the logistics entrepreneur Leveraging our status as a public company to provide network participants with a framework to share in the value that they help create Solid platform in terms of network, people, process and technology to “scale” the business Ideal long term partner in terms of succession planning and liquidity Systematically, we plan to convert key agent-based offices to company-owned offices and strategically acquire and integrate other additional non-asset based operations Radiant has identified and is in varying stages of due diligence with a number of potential acquisitions Strategic Direction – The “Gray Tail”
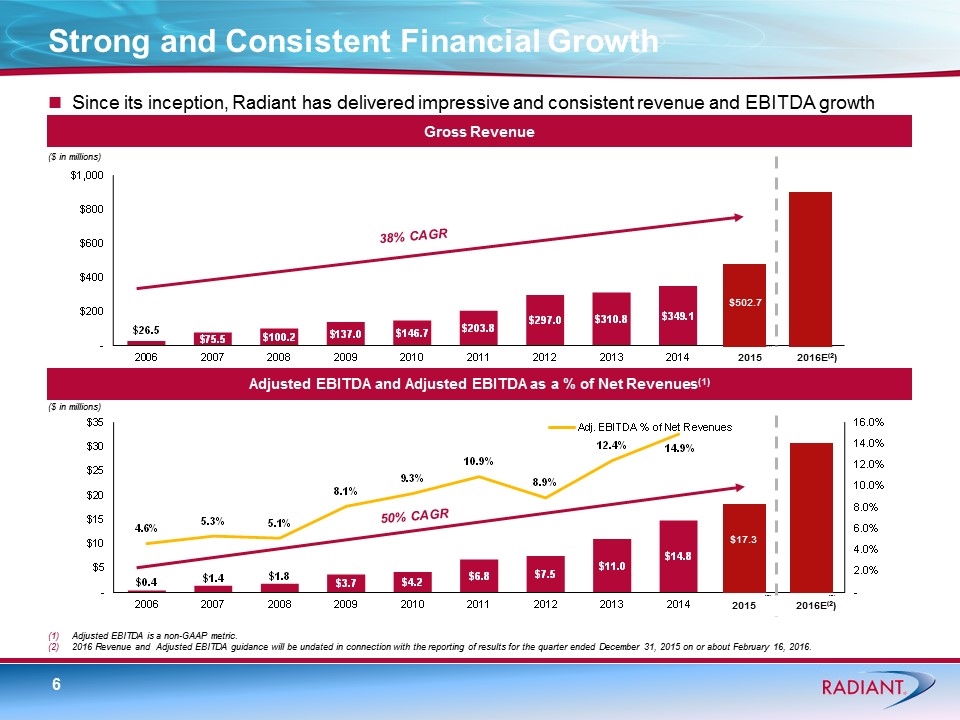
Strong and Consistent Financial Growth Since its inception, Radiant has delivered impressive and consistent revenue and EBITDA growth Gross Revenue Adjusted EBITDA and Adjusted EBITDA as a % of Net Revenues(1) 38% CAGR Adjusted EBITDA is a non-GAAP metric. 2016 Revenue and Adjusted EBITDA guidance will be undated in connection with the reporting of results for the quarter ended December 31, 2015 on or about February 16, 2016. ($ in millions) ($ in millions) $26.1 (2) (3) (2) (3) 50% CAGR $440.0 $360.0 $125.0 $19.0 $10.0 $3.0 $17.3 $502.7 2015 2016E(2) 2015 2016E(2)
Strong Track Record of Profitable Organic Growth Double digit organic revenue growth since 1988 (18% with acquisitions; 14% organic) Broad Intermodal and Truck Brokerage Capabilities in the U.S. and Canada Non-asset based business model with a leading position in Canada and a significant footprint in the U.S. Strong Partner Relationships & Commitment to Quality Qualified partner network of over 6,000 carriers Diversified Customer Base & Excellent Retention Large multi-national and mid-market accounts diversified across multiple industries with no customer representing more than 10% of total sales Well-positioned to be the pre-eminent consolidator in Canada Wheels: Expanding Geographic Reach and Product Offering On April 2, 2015, Radiant closed the acquisition of Wheels, one of the largest non-asset based third party logistics providers based in Canada Transaction value of approximately CAD $95 million(1) Wheels, founded in 1988, provides a variety of services throughout the United States and Canada Intermodal Truck brokerage Third party logistics solutions Warehouse and distribution service offerings Strong focus on support of U.S. shippers looking to access the Canadian markets Approximately half of Wheels revenue is generated in Canada and half in the United States Investment Highlights Implied Wheels enterprise value based on the 6.9M RLGT shares valued at $4.25 per share.
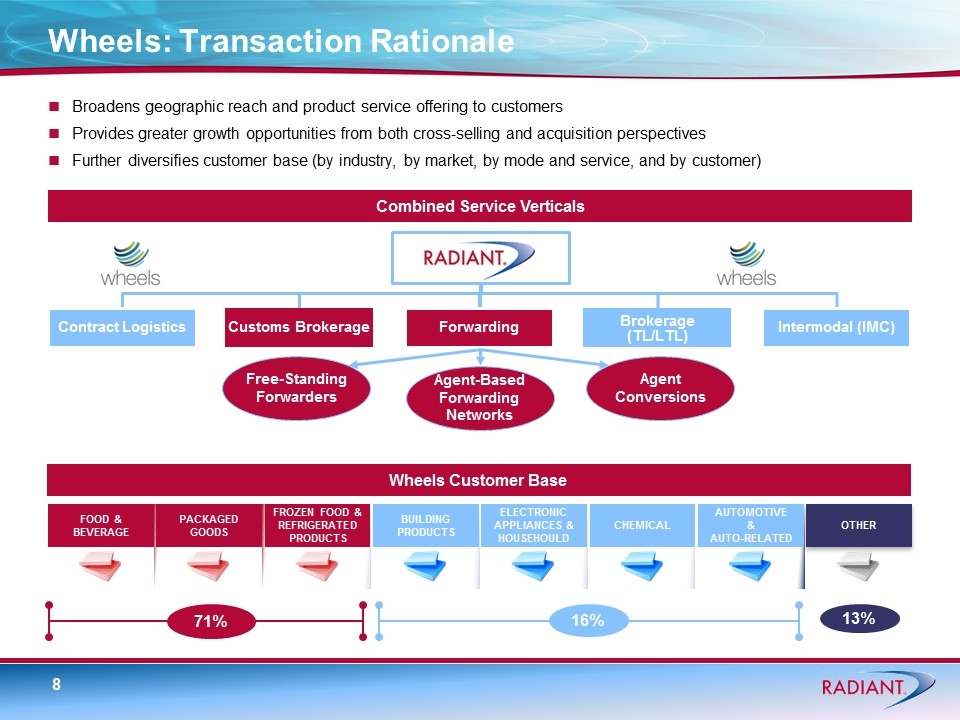
Wheels: Transaction Rationale Combined Service Verticals Broadens geographic reach and product service offering to customers Provides greater growth opportunities from both cross-selling and acquisition perspectives Further diversifies customer base (by industry, by market, by mode and service, and by customer) Free-Standing Forwarders Agent-Based Forwarding Networks Agent Conversions 71% 16% 13% FOOD & BEVERAGE PACKAGED GOODS BUILDING PRODUCTS ELECTRONIC APPLIANCES & HOUSEHOULD CHEMICAL OTHER FROZEN FOOD & REFRIGERATED PRODUCTS AUTOMOTIVE & AUTO-RELATED Wheels Customer Base Contract Logistics Customs Brokerage Forwarding Brokerage (TL/LTL) Intermodal (IMC)
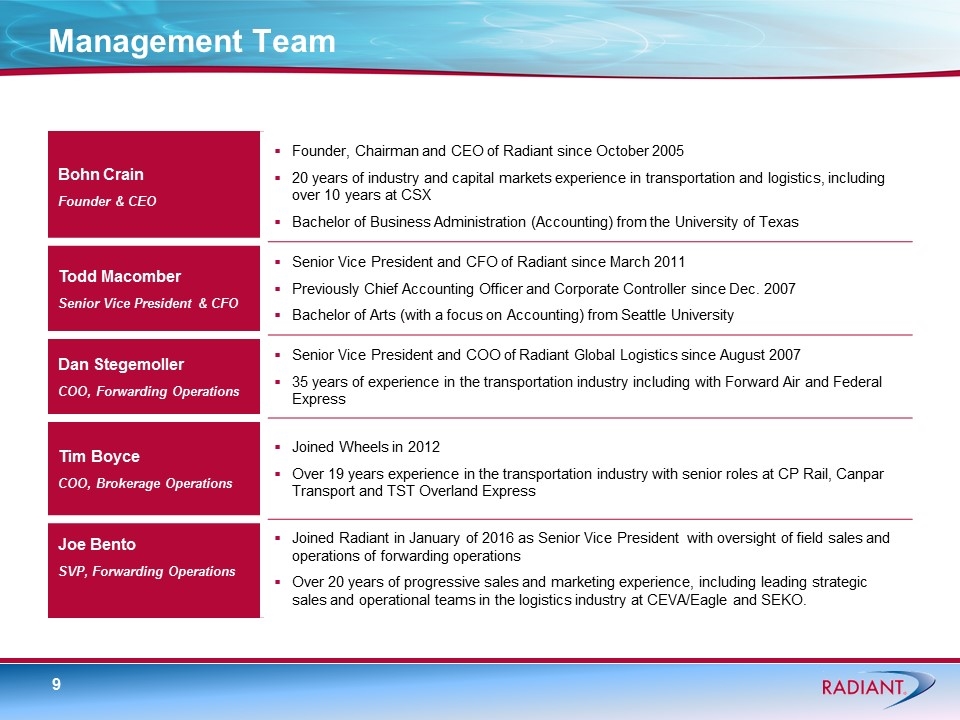
Management Team Bohn Crain Founder & CEO Founder, Chairman and CEO of Radiant since October 2005 20 years of industry and capital markets experience in transportation and logistics, including over 10 years at CSX Bachelor of Business Administration (Accounting) from the University of Texas Todd Macomber Senior Vice President & CFO Senior Vice President and CFO of Radiant since March 2011 Previously Chief Accounting Officer and Corporate Controller since Dec. 2007 Bachelor of Arts (with a focus on Accounting) from Seattle University Dan Stegemoller COO, Forwarding Operations Senior Vice President and COO of Radiant Global Logistics since August 2007 35 years of experience in the transportation industry including with Forward Air and Federal Express Tim Boyce COO, Brokerage Operations Joined Wheels in 2012 Over 19 years experience in the transportation industry with senior roles at CP Rail, Canpar Transport and TST Overland Express Joe Bento SVP, Forwarding Operations Joined Radiant in January of 2016 as Senior Vice President with oversight of field sales and operations of forwarding operations Over 20 years of progressive sales and marketing experience, including leading strategic sales and operational teams in the logistics industry at CEVA/Eagle and SEKO.
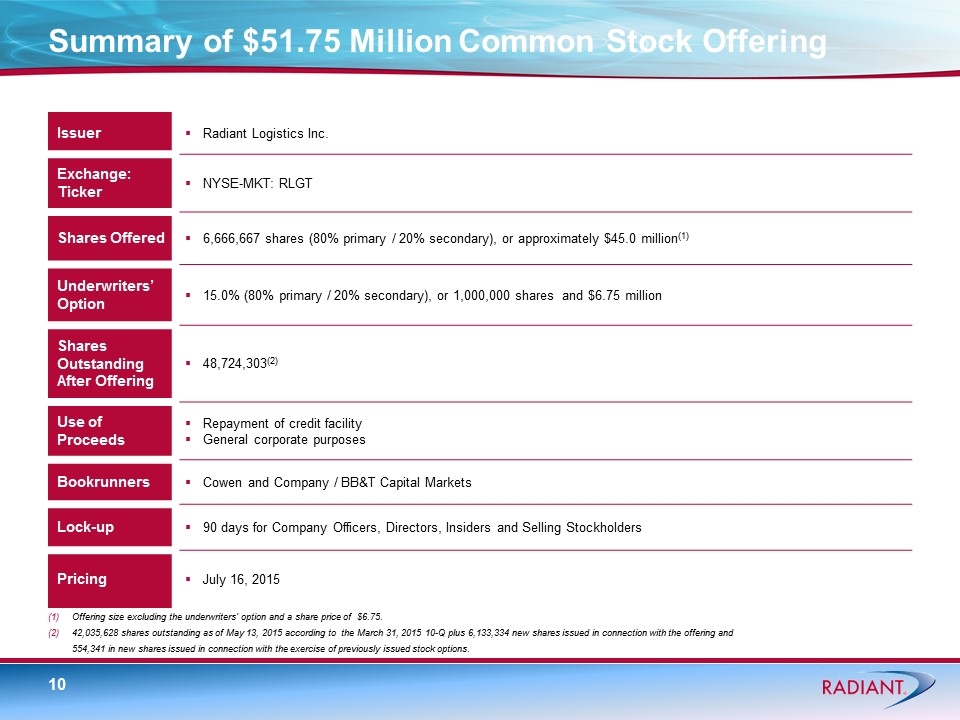
Summary of $51.75 Million Common Stock Offering Issuer Radiant Logistics Inc. Exchange: Ticker NYSE-MKT: RLGT Shares Offered 6,666,667 shares (80% primary / 20% secondary), or approximately $45.0 million(1) Underwriters’ Option 15.0% (80% primary / 20% secondary), or 1,000,000 shares and $6.75 million Shares Outstanding After Offering 48,724,303(2) Use of Proceeds Repayment of credit facility General corporate purposes Bookrunners Cowen and Company / BB&T Capital Markets Lock-up 90 days for Company Officers, Directors, Insiders and Selling Stockholders Pricing July 16, 2015 Offering size excluding the underwriters’ option and a share price of $6.75. 42,035,628 shares outstanding as of May 13, 2015 according to the March 31, 2015 10-Q plus 6,133,334 new shares issued in connection with the offering and 554,341 in new shares issued in connection with the exercise of previously issued stock options.
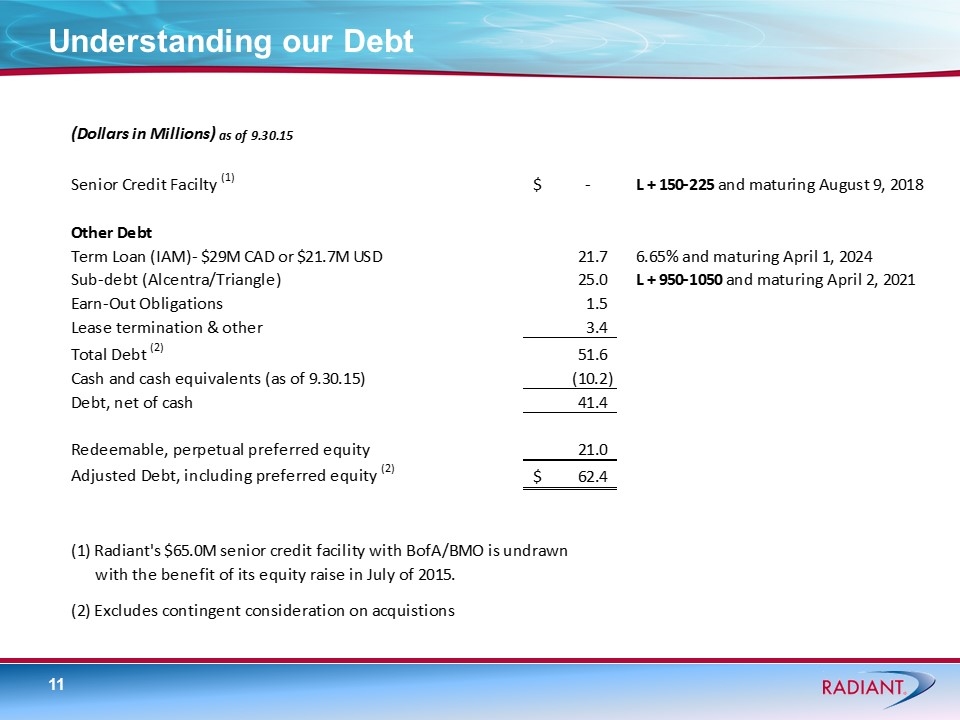
Understanding our Debt
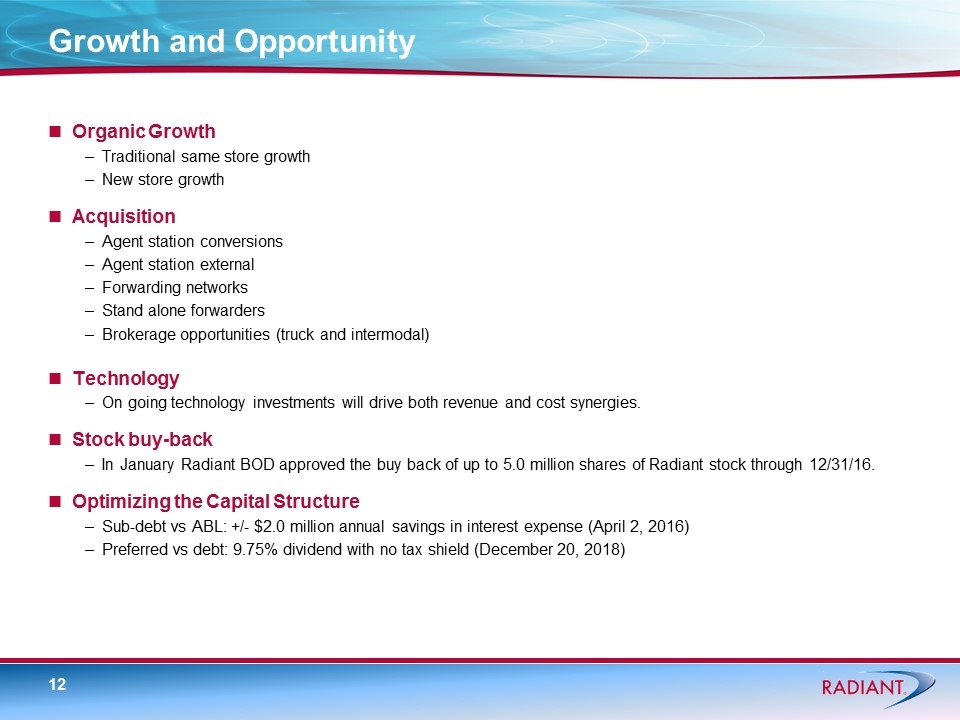
Growth and Opportunity Organic Growth Traditional same store growth New store growth Acquisition Agent station conversions Agent station external Forwarding networks Stand alone forwarders Brokerage opportunities (truck and intermodal) Technology On going technology investments will drive both revenue and cost synergies. Stock buy-back In January Radiant BOD approved the buy back of up to 5.0 million shares of Radiant stock through 12/31/16. Optimizing the Capital Structure Sub-debt vs ABL: +/- $2.0 million annual savings in interest expense (April 2, 2016) Preferred vs debt: 9.75% dividend with no tax shield (December 20, 2018)
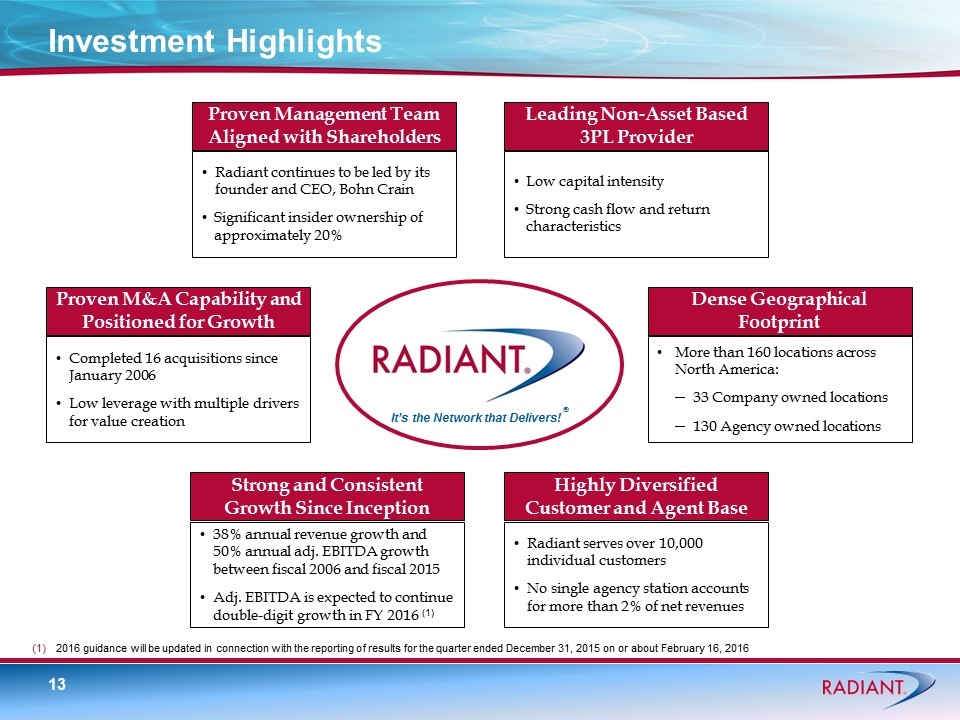
More than 160 locations across North America: 33 Company owned locations 130 Agency owned locations Dense Geographical Footprint Radiant serves over 10,000 individual customers No single agency station accounts for more than 2% of net revenues Highly Diversified Customer and Agent Base Radiant continues to be led by its founder and CEO, Bohn Crain Significant insider ownership of approximately 20% Proven Management Team Aligned with Shareholders 38% annual revenue growth and 50% annual adj. EBITDA growth between fiscal 2006 and fiscal 2015 Adj. EBITDA is expected to continue double-digit growth in FY 2016 (1) Strong and Consistent Growth Since Inception Completed 16 acquisitions since January 2006 Low leverage with multiple drivers for value creation Proven M&A Capability and Positioned for Growth Low capital intensity Strong cash flow and return characteristics Leading Non-Asset Based 3PL Provider Investment Highlights 2016 guidance will be updated in connection with the reporting of results for the quarter ended December 31, 2015 on or about February 16, 2016 It’s the Network that Delivers! ®
THANK YOU It’s the Network that Delivers!®
