Attached files
| file | filename |
|---|---|
| 8-K - FORM 8-K - BENCHMARK ELECTRONICS INC | form8-k.htm |
| EX-99.1 - EXHIBIT 99.1 - BENCHMARK ELECTRONICS INC | ex99-1.htm |
Exhibit 99.2
design develop deliver advanced technology Q4 - 2015 and Full Year 2015 Earnings Presentation February 9, 2016

design develop deliver advanced technology 1 Forward - Looking Statements This document contains forward - looking statements within the scope of the Securities Act of 1933 and the Securities Exchange Act of 1934. The words “expect,” “estimate,” “anticipate,” “predict” and similar expressions, and the negatives thereof, often identify forward - looking statements, which are not limited to historical facts. Our forward - looking statements include, among other things: guidance for the first quarter of 2016 relating to sales; statements , express or implied, concerning future operating results or margins, the ability to generate sales, income or cash flow; and Benchmark’s business and growth strategies and expected growth and performance. Although Benchmark believes these statements are based upon reasonable assumptions, they involve risks and uncertainties relating to our operations, markets and business environment generally. If one or more of these risks or uncertainties materializes, or underlying assumptions prove incorrect, actual outcomes may vary materially from those indicated. All forward - looking statements included in this document are based upon information available to Benchmark as of the date of this document, and the Company assumes no obligation to update them. Readers are advised to consult further disclosures on related subjects, particularly in Item 1A, “Risk Factors” of the Company’s annual report on Form 10 - K for the year ended December 31, 2014, in its other filings with the Securities and Exchange Commission and in its press releases. Non - GAAP Financial Information This document includes certain financial measures, such as operating margin, that exclude certain items and therefore are not in accordance with generally accepted accounting principles (“GAAP”). A detailed reconciliation between GAAP results and results excluding special items (“non - GAAP”) is included in the Appendix of this document.

design develop deliver advanced technology 2 President and CEO Update
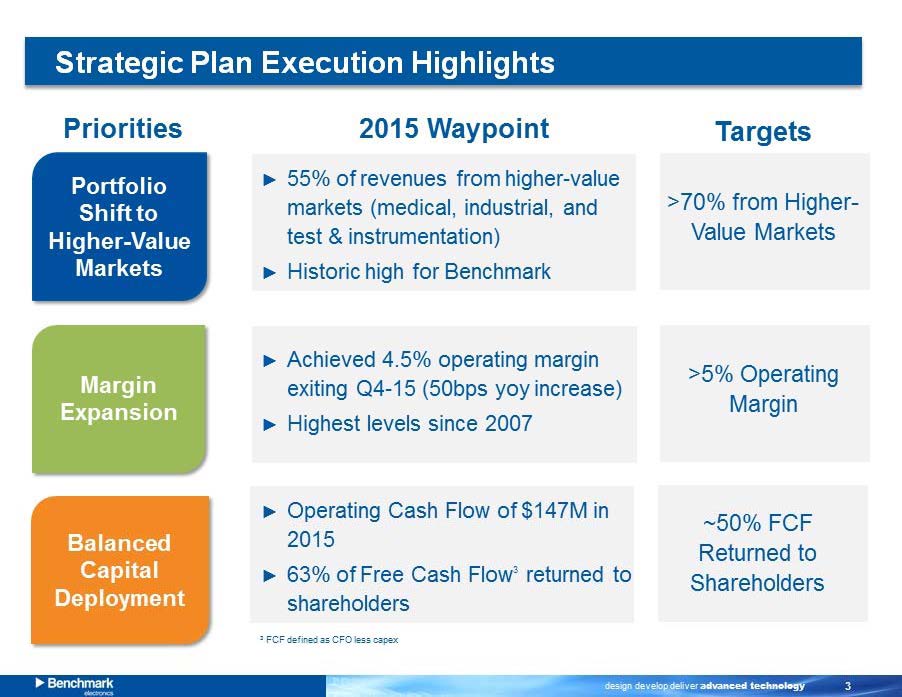
design develop deliver advanced technology 3 Strategic Plan Execution Highlights Priorities ► 55% of revenues from higher - value markets (medical, industrial, and test & instrumentation) ► Historic high for Benchmark 2015 Waypoint Targets Portfolio Shift to Higher - Value Markets Margin Expansion Balanced Capital Deployment >70% from Higher - Value Markets ► Achieved 4.5% operating margin exiting Q4 - 15 (50bps yoy increase) ► Highest levels since 2007 >5% Operating Margin ► Operating Cash Flow of $147M in 2015 ► 63% of Free Cash Flow returned to shareholders ~50% F CF Returned to Shareholders 3 3 FCF defined as CFO less capex
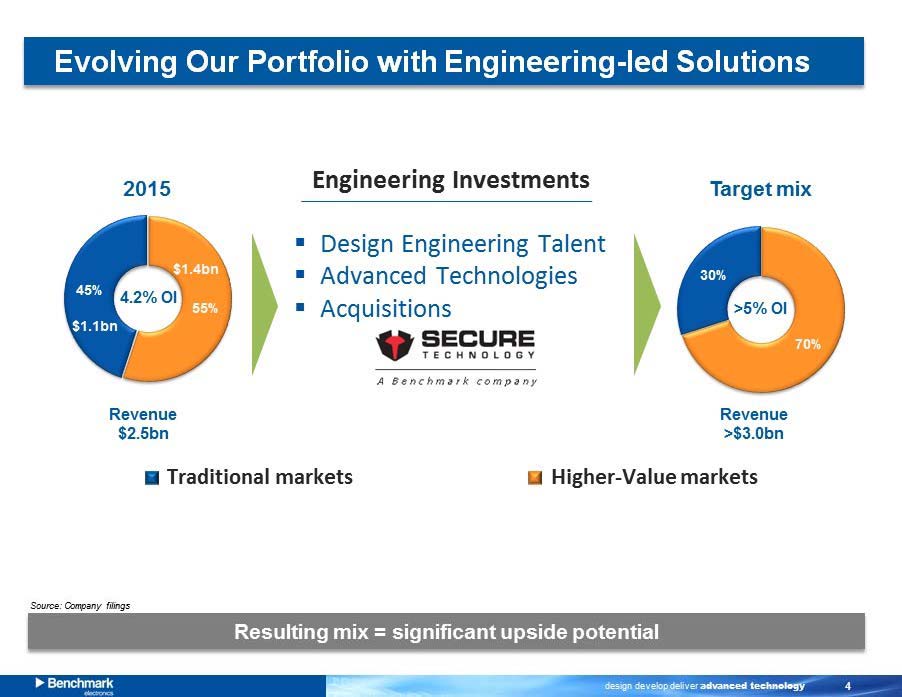
design develop deliver advanced technology 4 Evolving Our Portfolio with Engineering - led Solutions 2015 Target mix 55% 45% 70% 30% $1.2bn $1.4bn $1.1bn $1.4bn Revenue $ 2.5bn Resulting mix = significant upside potential Source: Company filings Revenue >$3.0bn Traditional markets Higher - Value markets 4.2% OI >5% OI ▪ Design Engineering Talent ▪ Advanced Technologies ▪ Acquisitions Engineering Investments
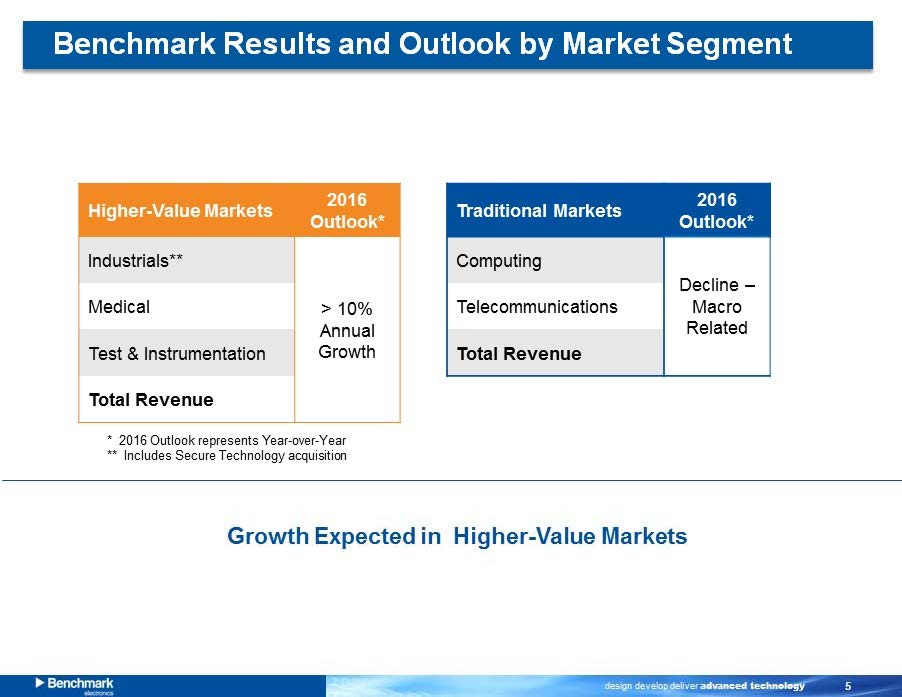
design develop deliver advanced technology 5 Higher - Value Markets 2016 Outlook* Industrials** > 10% Annual Growth Medical Test & Instrumentation Total Revenue Traditional Markets 2016 Outlook* Computing Decline – Macro Related Telecommunication s Total Revenue Benchmark Results and Outlook by Market Segment Growth Expected in Higher - Value Markets * 2016 Outlook represents Year - over - Year ** Includes Secure Technology acquisition
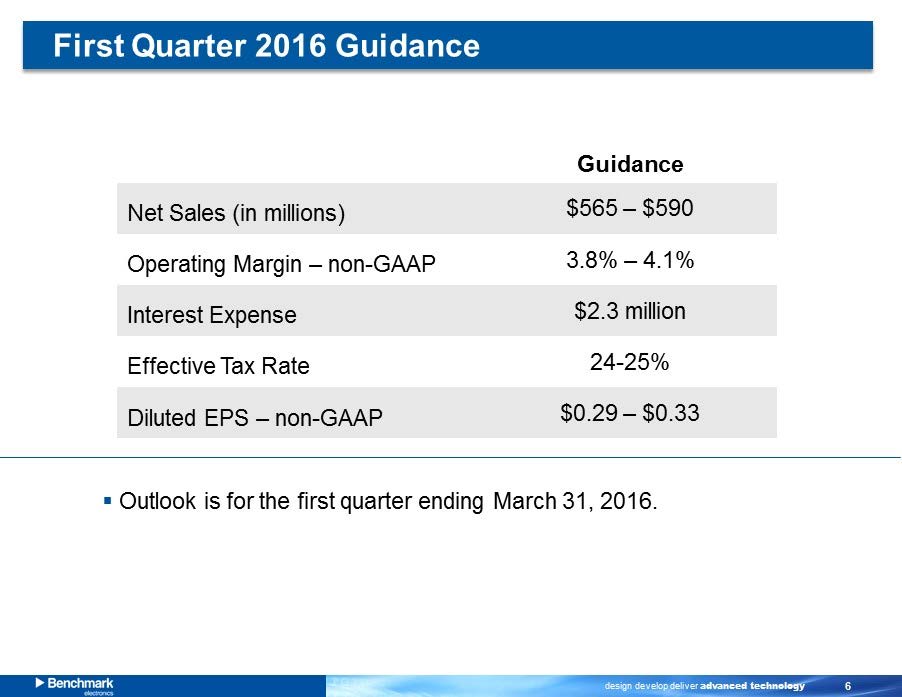
design develop deliver advanced technology 6 Guidance Net Sales (in millions) $565 – $590 Operating Margin – non - GAAP 3.8% – 4.1% Interest Expense $2.3 million Effective Tax Rate 24 - 25% Diluted EPS – non - GAAP $0.29 – $0.33 ▪ Outlook is for the first quarter ending March 31, 2016. First Quarter 2016 Guidance
design develop deliver advanced technology 7 Q4 and 2015 Financial Highlights
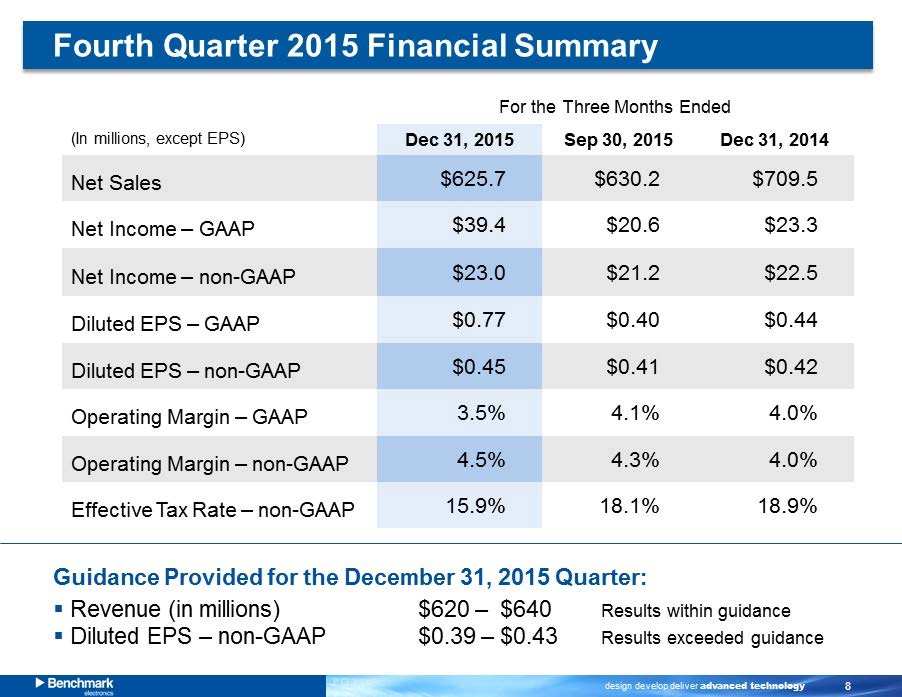
design develop deliver advanced technology 8 (In millions, except EPS) Dec 31 , 2015 Sep 30, 2015 Dec 31 , 2014 Net Sales $625.7 $630.2 $709.5 Net Income – GAAP $39.4 $20.6 $23.3 Net Income – non - GAAP $23.0 $21.2 $22.5 Diluted EPS – GAAP $0.77 $0.40 $0.44 Diluted EPS – non - GAAP $0.45 $0.41 $0.42 Operating Margin – GAAP 3.5% 4.1% 4.0% Operating Margin – non - GAAP 4.5% 4.3% 4.0% Effective Tax Rate – non - GAAP 15.9% 18.1% 18.9% For the Three Months Ended Guidance Provided for the December 31, 2015 Quarter: ▪ Revenue (in millions) $620 – $640 Results within guidance ▪ Diluted EPS – non - GAAP $0.39 – $0.43 Results exceeded g uidance Fourth Quarter 2015 Financial Summary
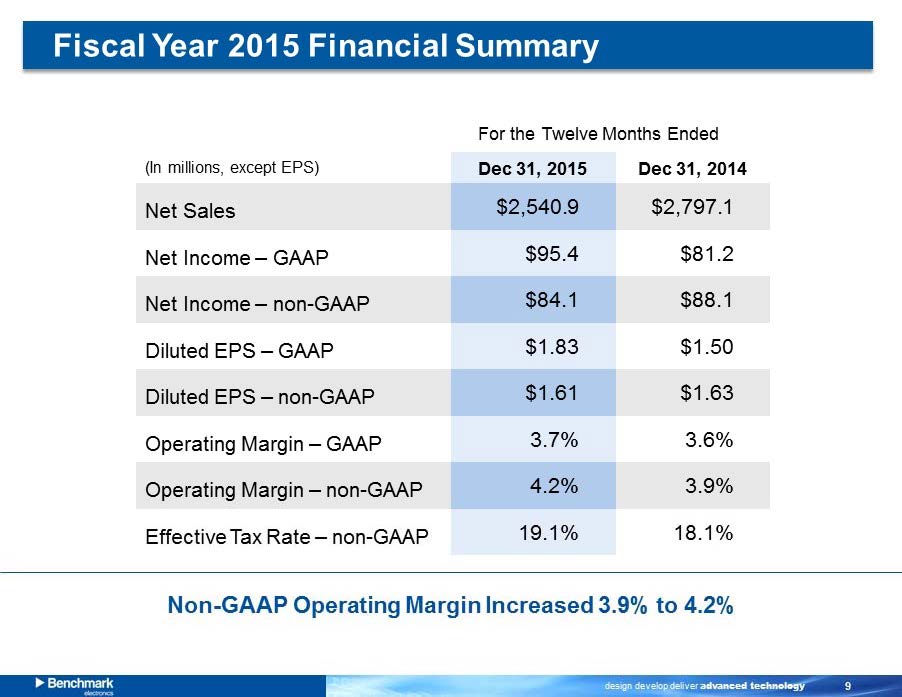
design develop deliver advanced technology 9 (In millions, except EPS) Dec 31 , 2015 Dec 31 , 2014 Net Sales $2,540.9 $2,797.1 Net Income – GAAP $95.4 $81.2 Net Income – non - GAAP $84.1 $88.1 Diluted EPS – GAAP $1.83 $1.50 Diluted EPS – non - GAAP $1.61 $1.63 Operating Margin – GAAP 3.7% 3.6% Operating Margin – non - GAAP 4.2% 3.9% Effective Tax Rate – non - GAAP 19.1% 18.1% For the Twelve Months Ended Fiscal Year 2015 Financial Summary Non - GAAP Operating Margin Increased 3.9% to 4.2%
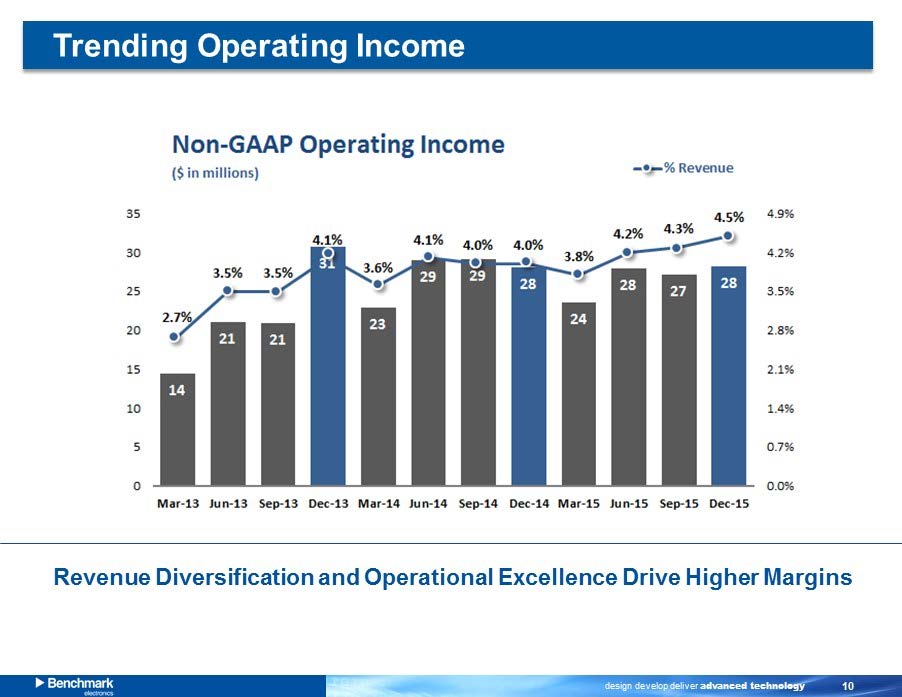
design develop deliver advanced technology 10 Trending Operating Income Revenue Diversification and Operational E xcellence D rive H igher M argins
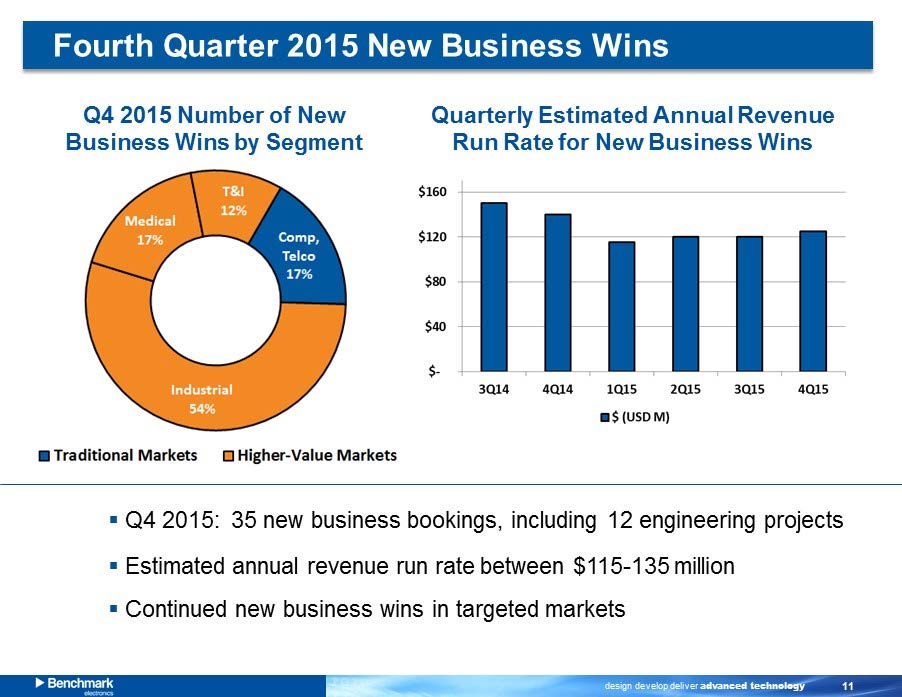
design develop deliver advanced technology 11 Q4 2015 Number of New Business Wins by Segment ▪ Q4 2015: 35 new business bookings, including 12 engineering projects ▪ Estimated annual revenue run rate between $115 - 135 million ▪ Continued new business wins in targeted markets Quarterly Estimated Annual Revenue Run Rate for New Business Wins Fourth Quarter 2015 New Business Wins
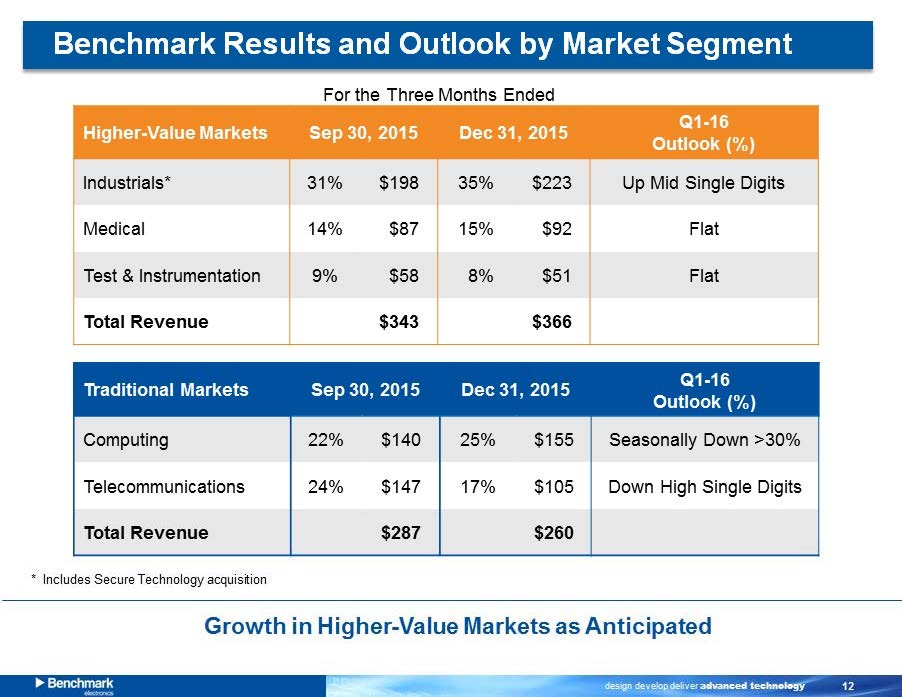
design develop deliver advanced technology 12 Higher - Value Markets Sep 30 , 2015 Dec 31 , 2015 Q1 - 16 Outlook (%) Industrials* 31% $198 35% $223 Up Mid Single Digits Medical 14% $87 15% $92 Flat Test & Instrumentation 9% $58 8% $51 Flat Total Revenue $343 $366 Traditional Markets Sep 30 , 2015 Dec 31 , 2015 Q1 - 16 Outlook (%) Computing 22% $140 25% $155 Seasonally Down >30% Telecommunication s 24% $147 17% $105 Down High Single Digits Total Revenue $287 $260 Benchmark Results and Outlook by Market Segment For the Three Months Ended Growth in Higher - Value Markets as Anticipated * Includes Secure Technology acquisition

design develop deliver advanced technology 13 Balance Sheet and Cash Flows (In millions) ) Dec 31 , 2015 Sep 30, 2015 Dec 31, 2014 Cash $466.0* $462.1 $427.4 Debt $235.2 $9.0 $9.5 Cash Flows from Operating Activities $28.1 $77.6 $22.1 Capital Expenditures $5.2 $7.9 $8.8 Depreciation & Amortization $13.2 $12.0 $12.5 Accounts Receivable $479.1 $467.2 $520.4 Days Sales Outstanding 69 67 66 Inventory $412.0 $421.5 $401.3 Inventory Turns 5.6x 5.5x 6.5x Total Cost of Shares Repurchased $16.0 $17.8 $18.8 * Includes $42 million of cash available in the U.S. Financial Statement Highlights
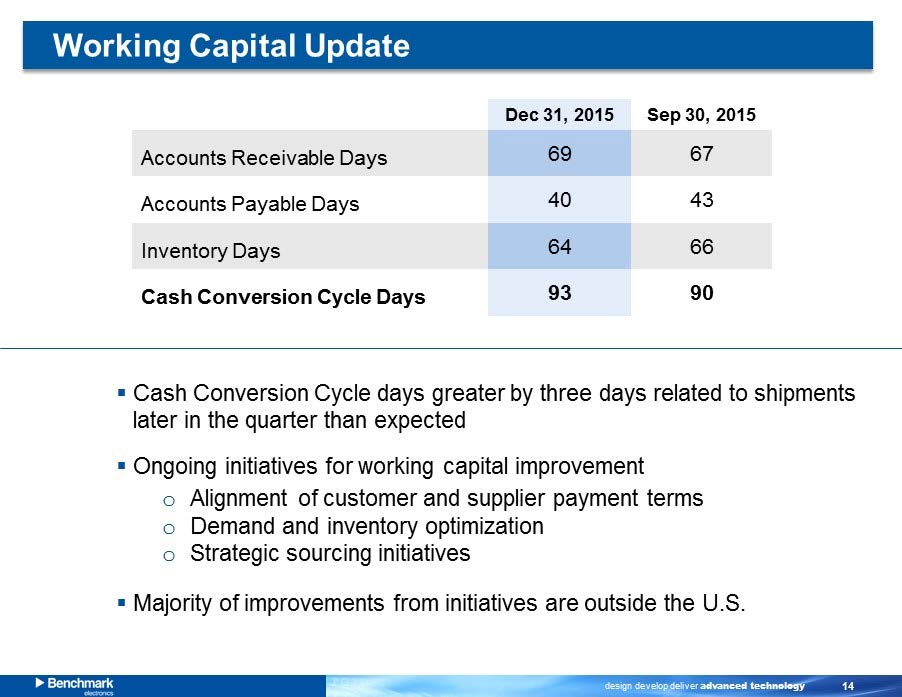
design develop deliver advanced technology 14 Dec 31 , 2015 Sep 30 , 2015 Accounts Receivable Days 69 67 Accounts Payable Days 40 43 Inventory Days 64 66 Cash Conversion Cycle Days 93 90 ▪ Cash Conversion Cycle days greater by three days related to shipments later in the quarter than expected ▪ Ongoing initiatives for working capital improvement o Alignment of customer and supplier payment terms o Demand and inventory optimization o Strategic sourcing initiatives ▪ Majority of improvements from initiatives are outside the U.S. Working Capital Update
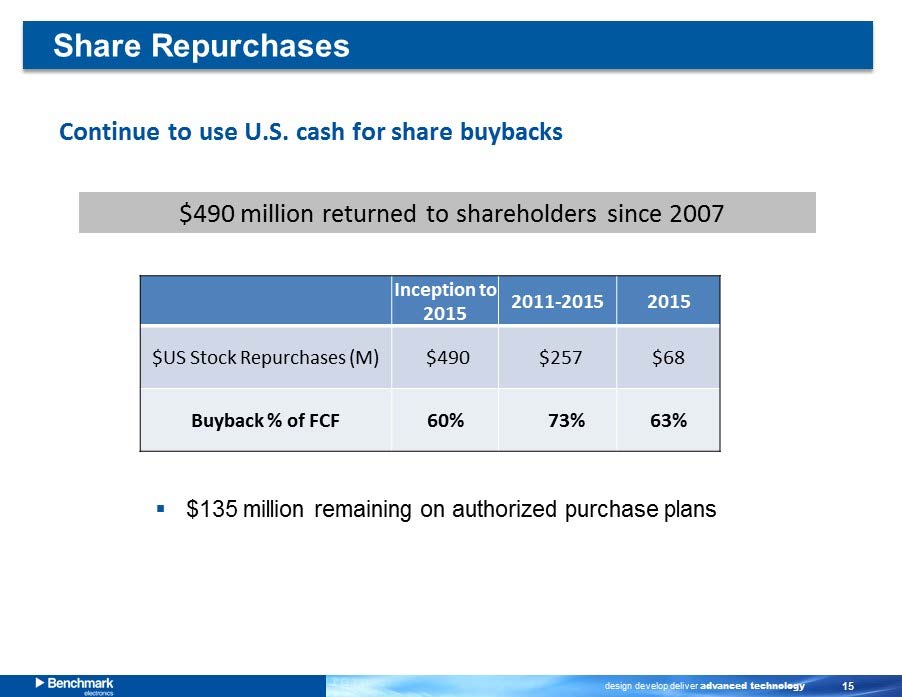
design develop deliver advanced technology 15 Share Repurchases Continue to use U.S. cash for share buybacks $490 million returned to shareholders since 2007 ▪ $135 m illion remaining on authorized purchase plans Inception to 2015 2011 - 2015 2015 $US Stock Repurchases (M ) $490 $257 $68 Buyback % of FCF 60% 73% 63%

design develop deliver advanced technology 16 Appendix
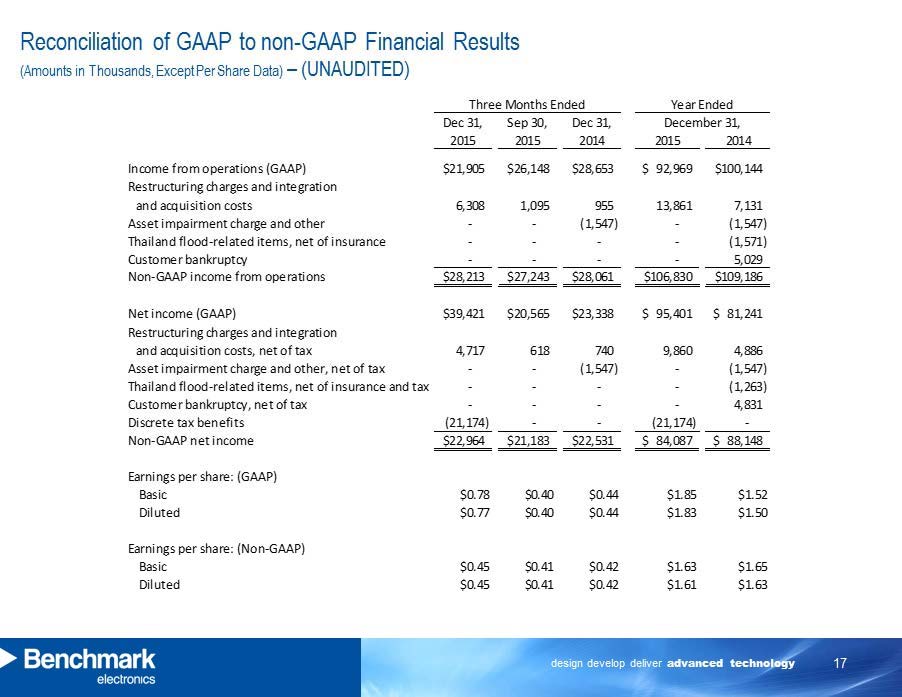
design develop deliver advanced technology 17 Reconciliation of GAAP to non - GAAP Financial Results (Amounts in Thousands, Except Per Share Data) – (UNAUDITED) Dec 31, Sep 30, Dec 31, 2015 2015 2014 2015 2014 21,905$ 26,148$ 28,653$ 92,969$ 100,144$ 6,308 1,095 955 13,861 7,131 - - (1,547) - (1,547) - - - - (1,571) - - - - 5,029 28,213$ 27,243$ 28,061$ 106,830$ 109,186$ 39,421$ 20,565$ 23,338$ 95,401$ 81,241$ 4,717 618 740 9,860 4,886 - - (1,547) - (1,547) - - - - (1,263) - - - - 4,831 (21,174) - - (21,174) - 22,964$ 21,183$ 22,531$ 84,087$ 88,148$ Basic $0.78 $0.40 $0.44 $1.85 $1.52 Diluted $0.77 $0.40 $0.44 $1.83 $1.50 Basic $0.45 $0.41 $0.42 $1.63 $1.65 Diluted $0.45 $0.41 $0.42 $1.61 $1.63 Earnings per share: (GAAP) Earnings per share: (Non-GAAP) Asset impairment charge and other, net of tax Restructuring charges and integration Discrete tax benefits Customer bankruptcy, net of tax and acquisition costs, net of tax Thailand flood-related items, net of insurance and tax Non-GAAP net income Income from operations (GAAP) Net income (GAAP) Year EndedThree Months Ended December 31, Customer bankruptcy Asset impairment charge and other Restructuring charges and integration and acquisition costs Thailand flood-related items, net of insurance Non-GAAP income from operations