Attached files
| file | filename |
|---|---|
| 8-K - FORM 8-K - Apollo Commercial Real Estate Finance, Inc. | d138041d8k.htm |
| EX-99.1 - EX-99.1 - Apollo Commercial Real Estate Finance, Inc. | d138041dex991.htm |
| Exhibit 99.2
|

Supplemental Financial Information Package – Q4 2015
February 10, 2016
Information is as of December 31, 2015, except as otherwise noted.
It should not be assumed that investments made in the future will be profitable or will equal the performance of investments in this document.
|
|
Forward Looking Statements and Other Disclosures
This presentation may contain forward-looking statements that are within the meaning of Section 27A of the Securities Act of 1933, as amended, and Section 21E of the Securities Exchange Act of 1934, as amended, and such statements are intended to be covered by the safe harbor provided by the same. Forward-looking statements are subject to substantial risks and uncertainties, many of which are difficult to predict and are generally beyond management’s control. These forward-looking statements may include information about possible or assumed future results of Apollo Commercial Real Estate Finance, Inc.’s (“ARI” or the “Company”) business, financial condition, liquidity, results of operations, plans and objectives. When used in this presentation, the words “believe,” “expect,” “anticipate,” “estimate,” “plan,” “continue,” “intend,” “should,” “may” or similar expressions, are intended to identify forward-looking statements. Statements regarding the following subjects, among others, may be forward-looking: ARI’s business and investment strategy; ARI’s operating results; ARI’s ability to obtain and maintain financing arrangements; the return on equity, the yield on investments and risks associated with investing in real estate assets; and changes in business conditions and the general economy.
The forward-looking statements are based on management’s beliefs, assumptions and expectations of future performance, taking into account all information currently available to ARI. Forward-looking statements are not predictions of future events. These beliefs, assumptions and expectations can change as a result of many possible events or factors, not all of which are known to ARI. Some of these factors are described under “Risk Factors,” and “Management’s Discussion and Analysis of Financial Condition and Results of Operations” included in ARI’s Annual Report on Form 10-K for the fiscal year ended December 31, 2014 and other periodic reports filed with the Securities and Exchange Commission (“SEC”), which are accessible on the SEC’s website at www.sec.gov. If a change occurs, ARI’s business, financial condition, liquidity and results of operations may vary materially from those expressed in ARI’s forward-looking statements. Any forward-looking statement speaks only as of the date on which it is made. New risks and uncertainties arise over time, and it is not possible for management to predict those events or how they may affect ARI. Except as required by law, ARI is not obligated to, and does not intend to, update or revise any forward-looking statements, whether as a result of new information, future events or otherwise.
This presentation contains information regarding ARI’s financial results that is calculated and presented on the basis of methodologies other than in accordance with accounting principles generally accepted in the United States (“GAAP”), including Operating Earnings and Operating Earnings per share. Please refer to slide 3 for a definition of “Operating Earnings” and the reconciliation of “Operating Earnings” to the applicable GAAP financial measure set forth on slide 18.
This presentation may contain statistics and other data that in some cases has been obtained from or compiled from information made available by third-party service providers. ARI makes no representation or warranty, expressed or implied, with respect to the accuracy, reasonableness or completeness of such information.
Past performance is not indicative nor a guarantee of future returns.
Index performance and yield data are shown for illustrative purposes only and have limitations when used for comparison or for other purposes due to, among other matters, volatility, credit or other factors (such as number and types of securities). Indices are unmanaged, do not charge any fees or expenses, assume reinvestment of income and do not employ special investment techniques such as leveraging or short selling. No such index is indicative of the future results of any investment by
ARI.
1
|
|
ARI Q4 2015 Earnings Call
February 10, 2016
Stuart Rothstein
Chief Executive Officer and President
Scott Weiner
Chief Investment Officer of the Manager
Megan Gaul
Chief Financial Officer, Treasurer and Secretary
Hilary Ginsberg
Investor Relations Manager
2
|
|
Financial Summary
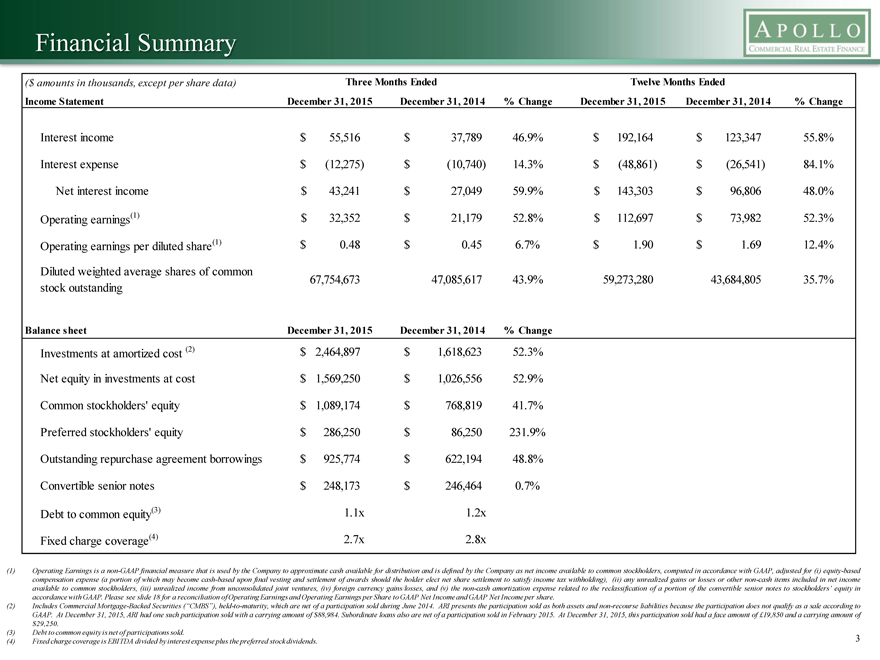
($ amounts in thousands, except per share data) Three Months Ended Twelve Months Ended
Income Statement December 31, 2015 December 31, 2014 % Change December 31, 2015 December 31, 2014 % Change
Interest income $55,516 $37,789 46.9% $192,164 $ 123,347 55.8% Interest expense $ (12,275) $(10,740) 14.3% $ (48,861) $(26,541) 84.1% Net interest income $ 43,241 $27,049 59.9% $143,303 $96,806 48.0%
Operating earnings(1) $ 32,352 $21,179 52.8% $112,697 $73,982 52.3% Operating earnings per diluted share(1) $0.48 $ 0.45 6.7% $1.90 $ 1.69 12.4% Diluted weighted average shares of common 67,754,673 47,085,617 43.9% 59,273,280 43,684,805 35.7% stock outstanding
Balance sheet December 31, 2015 December 31, 2014 % Change
Investments at amortized cost (2) $ 2,464,897 $1,618,623 52.3% Net equity in investments at cost $ 1,569,250 $1,026,556 52.9%
Common stockholders’ equity $ 1,089,174 $ 768,819 41.7% Preferred stockholders’ equity $286,250 $86,250 231.9% Outstanding repurchase agreement borrowings $925,774 $ 622,194 48.8% Convertible senior notes $248,173 $ 246,464 0.7%
Debt to common equity(3) 1.1x 1.2x Fixed charge coverage(4) 2.7x 2.8x
(1) Operating Earnings is a non-GAAP financial measure that is used by the Company to approximate cash available for distribution and is defined by the Company as net income available to common stockholders, computed in accordance with GAAP, adjusted for (i) equity-based compensation expense (a portion of which may become cash-based upon final vesting and settlement of awards should the holder elect net share settlement to satisfy income tax withholding), (ii) any unrealized gains or losses or other non-cash items included in net income available to common stockholders, (iii) unrealized income from unconsolidated joint ventures, (iv) foreign currency gains/losses, and (v) the non-cash amortization expense related to the reclassification of a portion of the convertible senior notes to stockholders’ equity in accordance with GAAP. Please see slide 18 for a reconciliation of Operating Earnings and Operating Earnings per Share to GAAP Net Income and GAAP Net Income per share.
(2) Includes Commercial Mortgage-Backed Securities (“CMBS”), held-to-maturity, which are net of a participation sold during June 2014. ARI presents the participation sold as both assets and non-recourse liabilities because the participation does not qualify as a sale according to GAAP. At December 31, 2015, ARI had one such participation sold with a carrying amount of $88,984. Subordinate loans also are net of a participation sold in February 2015. At December 31, 2015, this participation sold had a face amount of £19,850 and a carrying amount of $29,250.
(3) Debt to common equity is net of participations sold.
(4) Fixed charge coverage is EBITDA divided by interest expense plus the preferred stock dividends. 3
|
|
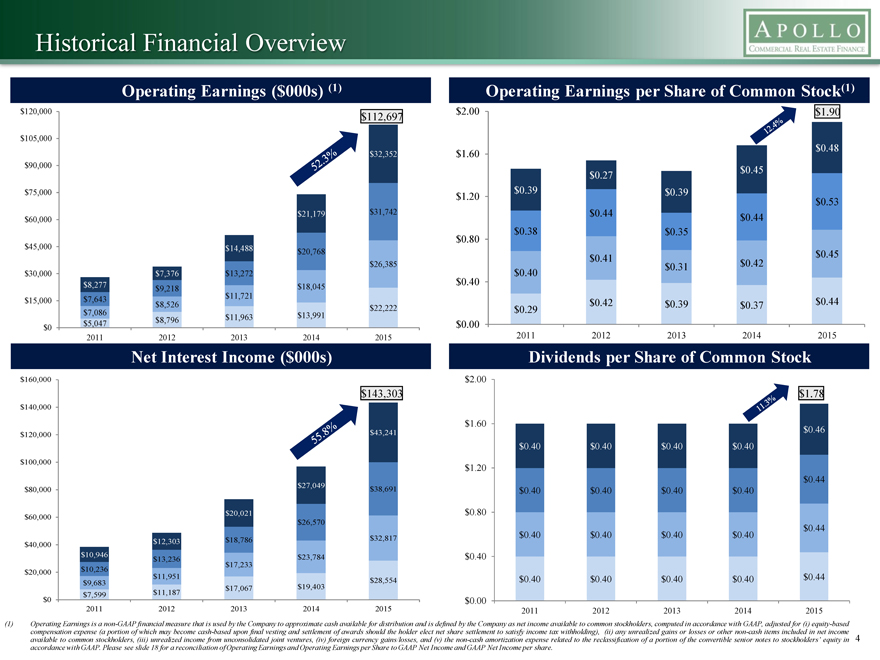
Historical Financial Overview
Operating Earnings ($000s) (1) Operating Earnings per Share of Common Stock(1)
$120,000 $2.00 $1.90
$112,697
$105,000 $0.48 $32,352 $1.60 $90,000 $0.45 $0.27 $75,000 $0.39 $0.39 $1.20 $0.53
$21,179 $31,742 $0.44 $60,000 $0.44 $0.38 $0.35 $45,000 $0.80 $14,488 $20,768 $0.41 $0.42 $0.45 $26,385 $0.40 $0.31 $30,000 $7,376 $13,272 $0.40 $8,277 $9,218 $18,045 $7,643 $11,721 $15,000 $0.42 $0.44 $8,526 $22,222 $0.39 $0.37 $7,086 $0.29 $11,963 $13,991 $0 $5,047 $8,796 $0.00 2011 2012 2013 2014 2015 2011 2012 2013 2014 2015
Net Interest Income ($000s) Dividends per Share of Common Stock
$160,000 $2.00
$143,303 $1.78
$140,000
$1.60 $43,241 $0.46 $120,000 $0.40 $0.40 $0.40 $0.40 $100,000 $1.20 $0.44 $27,049 $80,000 $38,691 $0.40 $0.40 $0.40 $0.40
$20,021 $0.80 $60,000 $26,570 $0.44 $32,817 $0.40 $0.40 $0.40 $0.40 $12,303 $18,786 $40,000 $10,946 $23,784 $0.40 $13,236 $17,233 $20,000 $10,236 $11,951 $0.44 $28,554 $0.40 $0.40 $0.40 $0.40 $9,683 $17,067 $19,403 $7,599 $11,187 $0 $0.00
2011 2012 2013 2014 2015 2011 2012 2013 2014 2015
(1) Operating Earnings is a non-GAAP financial measure that is used by the Company to approximate cash available for distribution and is defined by the Company as net income available to common stockholders, computed in accordance with GAAP, adjusted for (i) equity-based compensation expense (a portion of which may become cash-based upon final vesting and settlement of awards should the holder elect net share settlement to satisfy income tax withholding), (ii) any unrealized gains or losses or other non-cash items included in net income available to common stockholders, (iii) unrealized income from unconsolidated joint ventures, (iv) foreign currency gains/losses, and (v) the non-cash amortization expense related to the reclassification of a portion of the convertible senior notes to stockholders’ equity in 4 accordance with GAAP. Please see slide 18 for a reconciliation of Operating Earnings and Operating Earnings per Share to GAAP Net Income and GAAP Net Income per share.
|
|
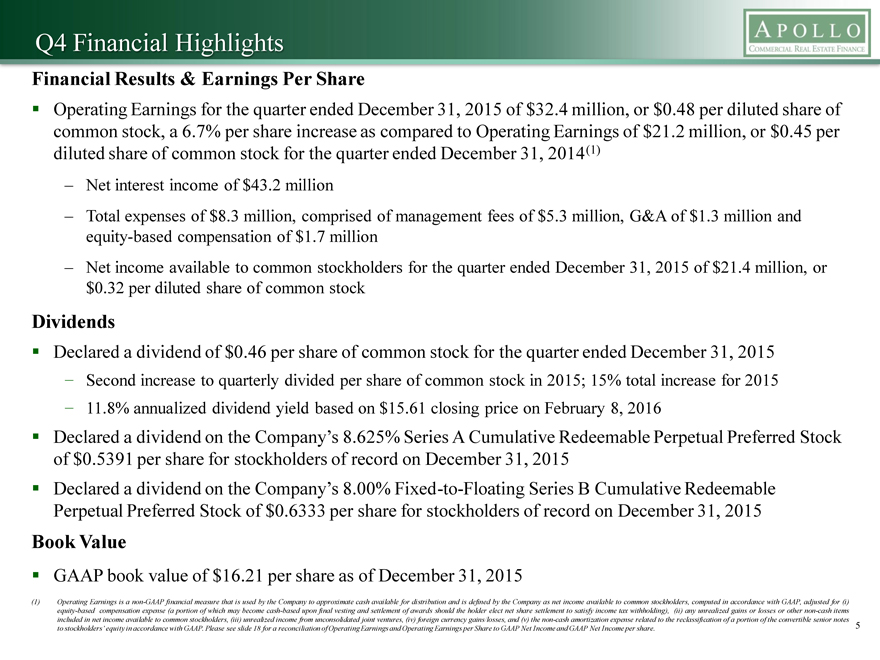
Q4 Financial Highlights
Financial Results & Earnings Per Share
Operating Earnings for the quarter ended December 31, 2015 of $32.4 million, or $0.48 per diluted share of common stock, a 6.7% per share increase as compared to Operating Earnings of $21.2 million, or $0.45 per diluted share of common stock for the quarter ended December 31, 2014(1)
– Net interest income of $43.2 million
– Total expenses of $8.3 million, comprised of management fees of $5.3 million, G&A of $1.3 million and equity-based compensation of $1.7 million
– Net income available to common stockholders for the quarter ended December 31, 2015 of $21.4 million, or $0.32 per diluted share of common stock
Dividends
Declared a dividend of $0.46 per share of common stock for the quarter ended December 31, 2015
- Second increase to quarterly divided per share of common stock in 2015; 15% total increase for 2015
- 11.8% annualized dividend yield based on $15.61 closing price on February 8, 2016
Declared a dividend on the Company’s 8.625% Series A Cumulative Redeemable Perpetual Preferred Stock of $0.5391 per share for stockholders of record on December 31, 2015
Declared a dividend on the Company’s 8.00% Fixed-to-Floating Series B Cumulative Redeemable Perpetual Preferred Stock of $0.6333 per share for stockholders of record on December 31, 2015
Book Value
GAAP book value of $16.21 per share as of December 31, 2015
(1) Operating Earnings is a non-GAAP financial measure that is used by the Company to approximate cash available for distribution and is defined by the Company as net income available to common stockholders, computed in accordance with GAAP, adjusted for (i) equity-based compensation expense (a portion of which may become cash-based upon final vesting and settlement of awards should the holder elect net share settlement to satisfy income tax withholding), (ii) any unrealized gains or losses or other non-cash items included in net income available to common stockholders, (iii) unrealized income from unconsolidated joint ventures, (iv) foreign currency gains/losses, and (v) the non-cash amortization expense related to the reclassification of a portion of the convertible senior notes to stockholders’ equity in accordance with GAAP. Please see slide 18 for a reconciliation of Operating Earnings and Operating Earnings per Share to GAAP Net Income and GAAP Net Income per share. 5
|
|
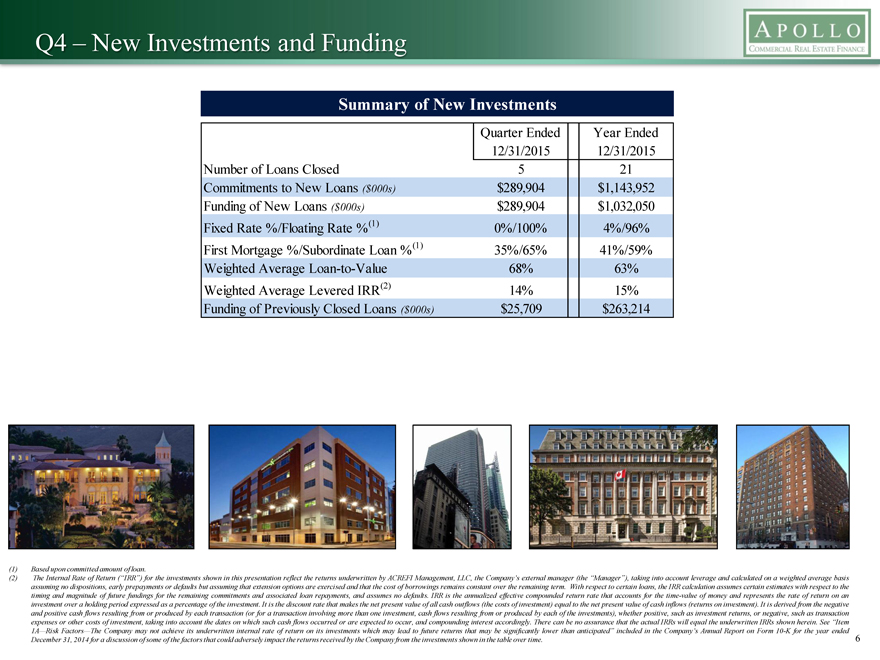
Q4 – New Investments and Funding
Summary of New Investments
Quarter Ended Year Ended 12/31/2015 12/31/2015 Number of Loans Closed 5 21 Commitments to New Loans ($000s) $289,904 $1,143,952 Funding of New Loans ($000s) $289,904 $1,032,050 Fixed Rate %/Floating Rate %(1) 0%/100% 4%/96% First Mortgage %/Subordinate Loan %(1) 35%/65% 41%/59% Weighted Average Loan-to-Value 68% 63% Weighted Average Levered IRR(2) 14% 15% Funding of Previously Closed Loans ($000s) $25,709 $263,214
[Graphic Appears Here]
(1) Based upon committed amount of loan.
(2) The Internal Rate of Return (“IRR”) for the investments shown in this presentation reflect the returns underwritten by ACREFI Management, LLC, the Company’s external manager (the “Manager”), taking into account leverage and calculated on a weighted average basis assuming no dispositions, early prepayments or defaults but assuming that extension options are exercised and that the cost of borrowings remains constant over the remaining term. With respect to certain loans, the IRR calculation assumes certain estimates with respect to the timing and magnitude of future fundings for the remaining commitments and associated loan repayments, and assumes no defaults. IRR is the annualized effective compounded return rate that accounts for the time-value of money and represents the rate of return on an investment over a holding period expressed as a percentage of the investment. It is the discount rate that makes the net present value of all cash outflows (the costs of investment) equal to the net present value of cash inflows (returns on investment). It is derived from the negative and positive cash flows resulting from or produced by each transaction (or for a transaction involving more than one investment, cash flows resulting from or produced by each of the investments), whether positive, such as investment returns, or negative, such as transaction expenses or other costs of investment, taking into account the dates on which such cash flows occurred or are expected to occur, and compounding interest accordingly. There can be no assurance that the actual IRRs will equal the underwritten IRRs shown herein. See “Item
1A—Risk Factors—The Company may not achieve its underwritten internal rate of return on its investments which may lead to future returns that may be significantly lower than anticipated” included in the Company’s Annual Report on Form 10-K for the year ended
December 31, 2014 for a discussion of some of the factors that could adversely impact the returns received by the Company from the investments shown in the table over time.
6
|
|
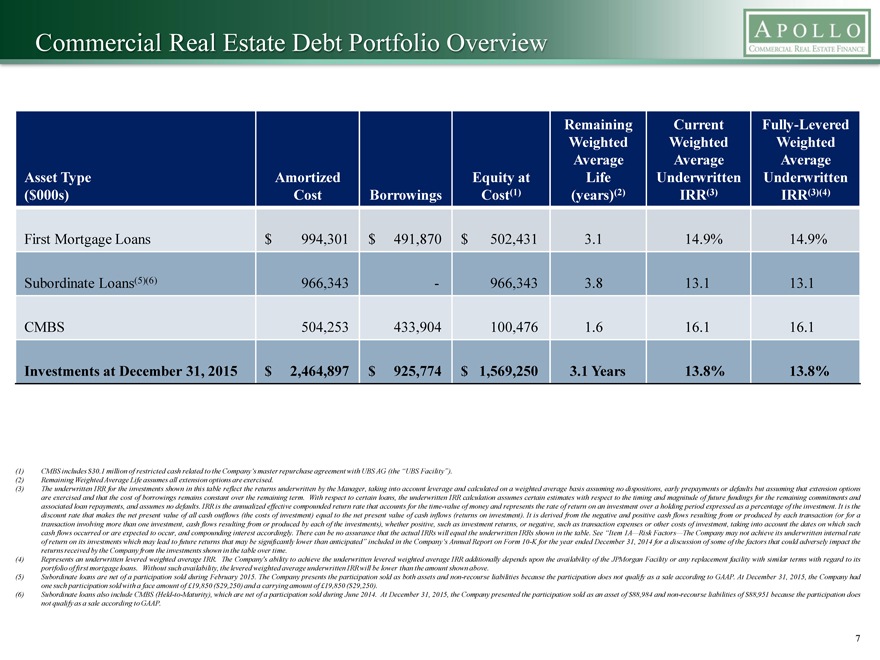
Commercial Real Estate Debt Portfolio Overview
Remaining Current Fully-Levered Weighted Weighted Weighted Average Average Average
Asset Type Amortized Equity at Life Underwritten Underwritten
($000s) Cost Borrowings Cost(1) (years)(2) IRR(3) IRR(3)(4)
First Mortgage Loans $ 994,301 $ 491,870 $ 502,431 3.1 14.9% 14.9%
Subordinate Loans(5)(6) 966,343—966,343 3.8 13.1 13.1
CMBS 504,253 433,904 100,476 1.6 16.1 16.1
Investments at December 31, 2015 $ 2,464,897 $ 925,774 $ 1,569,250 3.1 Years 13.8% 13.8%
(1) CMBS includes $30.1 million of restricted cash related to the Company’s master repurchase agreement with UBS AG (the “UBS Facility”). (2) Remaining Weighted Average Life assumes all extension options are exercised.
(3) The underwritten IRR for the investments shown in this table reflect the returns underwritten by the Manager, taking into account leverage and calculated on a weighted average basis assuming no dispositions, early prepayments or defaults but assuming that extension options are exercised and that the cost of borrowings remains constant over the remaining term. With respect to certain loans, the underwritten IRR calculation assumes certain estimates with respect to the timing and magnitude of future fundings for the remaining commitments and associated loan repayments, and assumes no defaults. IRR is the annualized effective compounded return rate that accounts for the time-value of money and represents the rate of return on an investment over a holding period expressed as a percentage of the investment. It is the discount rate that makes the net present value of all cash outflows (the costs of investment) equal to the net present value of cash inflows (returns on investment). It is derived from the negative and positive cash flows resulting from or produced by each transaction (or for a transaction involving more than one investment, cash flows resulting from or produced by each of the investments), whether positive, such as investment returns, or negative, such as transaction expenses or other costs of investment, taking into account the dates on which such cash flows occurred or are expected to occur, and compounding interest accordingly. There can be no assurance that the actual IRRs will equal the underwritten IRRs shown in the table. See “Item 1A—Risk Factors—The Company may not achieve its underwritten internal rate of return on its investments which may lead to future returns that may be significantly lower than anticipated” included in the Company’s Annual Report on Form 10-K for the year ended December 31, 2014 for a discussion of some of the factors that could adversely impact the returns received by the Company from the investments shown in the table over time.
(4) Represents an underwritten levered weighted average IRR. The Company’s ability to achieve the underwritten levered weighted average IRR additionally depends upon the availability of the JPMorgan Facility or any replacement facility with similar terms with regard to its portfolio of first mortgage loans.Without such availability, the levered weighted average underwritten IRR will be lower than the amount shown above.
(5) Subordinate loans are net of a participation sold during February 2015. The Company presents the participation sold as both assets and non-recourse liabilities because the participation does not qualify as a sale according to GAAP. At December 31, 2015, the Company had one such participation sold with a face amount of £19,850 ($29,250) and a carrying amount of £19,850 ($29,250).
(6) Subordinate loans also include CMBS (Held-to-Maturity), which are net of a participation sold during June 2014. At December 31, 2015, the Company presented the participation sold as an asset of $88,984 and non-recourse liabilities of $88,951 because the participation does not qualify as a sale according to GAAP.
7
|
|
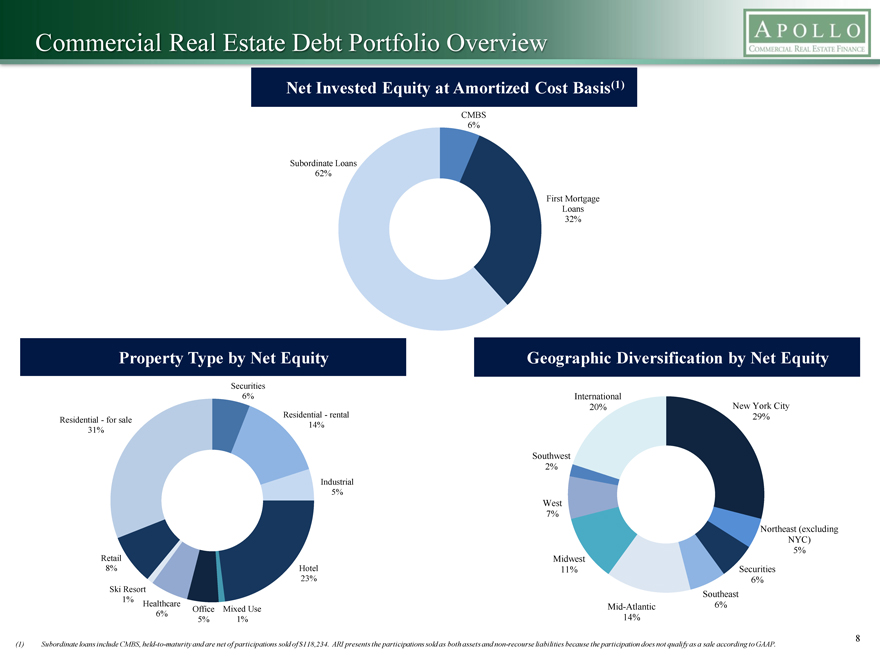
Commercial Real Estate Debt Portfolio Overview
Net Invested Equity at Amortized Cost Basis(1)
CMBS
6%
Subordinate Loans
62%
First Mortgage
Loans
32%
Property Type by Net Equity
Geographic Diversification by Net Equity
Securities
6%
International
20%
New York City
Residential—for sale
Residential—rental
29%
31%
14%
Southwest
2%
Industrial
5%
West
7%
Northeast (excluding
NYC)
5%
Retail
Midwest
8%
Hotel
11%
Securities
23%
6%
Ski Resort
Southeast
1%
Healthcare Office Mixed Use
Mid-Atlantic
6%
6%
5%
1%
14%
8
(1)
Subordinate loans include CMBS, held-to-maturity and are net of participations sold of $118,234. ARI presents the participations sold as both assets and non-recourse liabilities because the participation does not qualify as a sale according to GAAP.
|
|
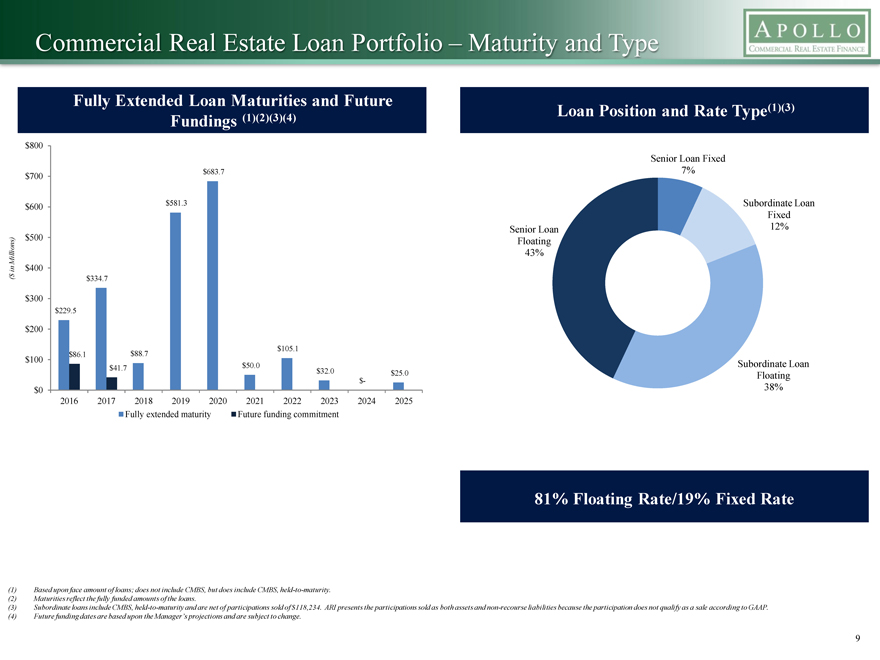
Commercial Real Estate Loan Portfolio – Maturity and Type
Fully Extended Loan Maturities and Future
(1)(2)(3)(4) Loan Position and Rate Type(1)(3) Fundings
$800
Senior Loan Fixed $683.7 7% $700
$600 $581.3 Subordinate Loan Fixed Senior Loan 12%
Millions) $500 Floating
43% in $400
($ $334.7
$300 $229.5
$200
$105.1 $86.1 $88.7 $100 Subordinate Loan $41.7 $50.0 $32.0 $25.0 Floating $-
$0 38%
2016 2017 2018 2019 2020 2021 2022 2023 2024 2025 Fully extended maturity Future funding commitment
81% Floating Rate/19% Fixed Rate
(1) Based upon face amount of loans; does not include CMBS, but does include CMBS, held-to-maturity. (2) Maturities reflect the fully funded amounts of the loans.
(3) Subordinate loans include CMBS, held-to-maturity and are net of participations sold of $118,234. ARI presents the participations sold as both assets and non-recourse liabilities because the participation does not qualify as a sale according to GAAP. (4) Future funding dates are based upon the Manager’s projections and are subject to change.
9
|
|
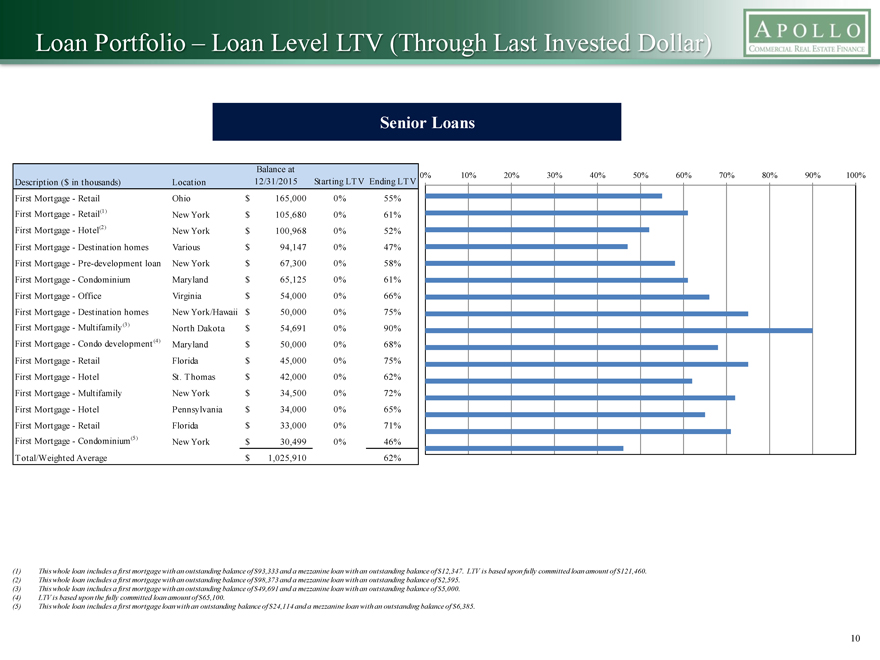
Loan Portfolio – Loan Level LTV (Through Last Invested Dollar)
Senior Loans
Balance at
0% 10% 20% 30% 40% 50% 60% 70% 80% 90% 100%
Description ($ in thousands) Location 12/31/2015 Starting LTV Ending LTV First Mortgage—Retail Ohio $165,000 0% 55% First Mortgage—Retail(1) New York $105,680 0% 61% First Mortgage—Hotel(2) New York $100,968 0% 52% First Mortgage—Destination homes Various $94,147 0% 47% First Mortgage—Pre-development loan New York $67,300 0% 58% First Mortgage—Condominium Maryland $65,125 0% 61% First Mortgage—Office Virginia $54,000 0% 66% First Mortgage—Destination homes New York/Hawaii $50,000 0% 75% First Mortgage—Multifamily(3) North Dakota $54,691 0% 90% First Mortgage—Condo development (4) Maryland $50,000 0% 68% First Mortgage—Retail Florida $45,000 0% 75% First Mortgage—Hotel St. Thomas $42,000 0% 62% First Mortgage—Multifamily New York $34,500 0% 72% First Mortgage—Hotel Pennsylvania $34,000 0% 65% First Mortgage—Retail Florida $33,000 0% 71% First Mortgage—Condominium(5) New York $30,499 0% 46% Total/Weighted Average $1,025,910 62%
(1) This whole loan includes a first mortgage with an outstanding balance of $93,333 and a mezzanine loan with an outstanding balance of $12,347. LTV is based upon fully committed loan amount of $121,460. (2) This whole loan includes a first mortgage with an outstanding balance of $98,373 and a mezzanine loan with an outstanding balance of $2,595.
(3) This whole loan includes a first mortgage with an outstanding balance of $49,691 and a mezzanine loan with an outstanding balance of $5,000. (4) LTV is based upon the fully committed loan amount of $65,100.
(5) This whole loan includes a first mortgage loan with an outstanding balance of $24,114 and a mezzanine loan with an outstanding balance of $6,385.
10
|
|
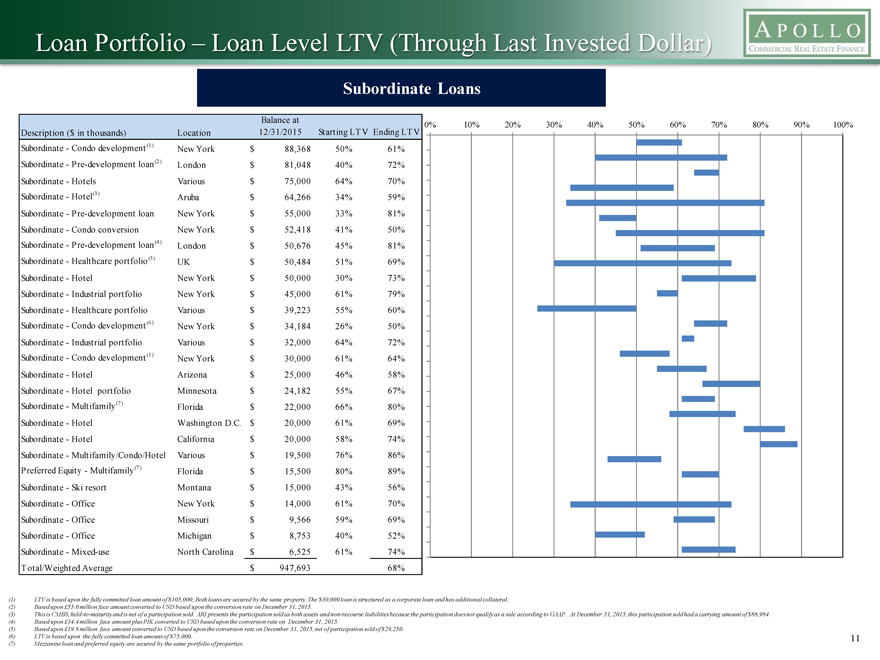
Loan Portfolio – Loan Level LTV (Through Last Invested Dollar)
Subordinate Loans
Balance at
12/31/2015 Starting LTV Ending LTV 0% 10% 20% 30% 40% 50% 60% 70% 80% 90% 100%
Description ($ in thousands) Location
Subordinate—Condo development (1) New York $88,368 50% 61% Subordinate—Pre-development loan(2) London $81,048 40% 72% Subordinate—Hotels Various $75,000 64% 70% Subordinate—Hotel(3) Aruba $64,266 34% 59% Subordinate—Pre-development loan New York $55,000 33% 81% Subordinate—Condo conversion New York $52,418 41% 50% Subordinate—Pre-development loan(4) London $50,676 45% 81% Subordinate—Healthcare portfolio(5) UK $50,484 51% 69% Subordinate—Hotel New York $50,000 30% 73% Subordinate—Industrial portfolio New York $45,000 61% 79% Subordinate—Healthcare portfolio Various $39,223 55% 60% Subordinate—Condo development (6) New York $34,184 26% 50% Subordinate—Industrial portfolio Various $32,000 64% 72% Subordinate—Condo development (1) New York $30,000 61% 64% Subordinate—Hotel Arizona $25,000 46% 58% Subordinate—Hotel portfolio Minnesota $24,182 55% 67% Subordinate—Multifamily(7) Florida $22,000 66% 80% Subordinate—Hotel Washington D.C. $20,000 61% 69% Subordinate—Hotel California $20,000 58% 74% Subordinate—Multifamily/Condo/Hotel Various $19,500 76% 86% Preferred Equity—Multifamily(7) Florida $15,500 80% 89% Subordinate—Ski resort Montana $15,000 43% 56% Subordinate—Office New York $14,000 61% 70% Subordinate—Office Missouri $9,566 59% 69% Subordinate—Office Michigan $8,753 40% 52% Subordinate—Mixed-use North Carolina $6,525 61% 74% Total/Weighted Average $947,693 68%
(1) LTV is based upon the fully committed loan amount of $105,000; Both loans are secured by the same property. The $30,000 loan is structured as a corporate loan and has additional collateral. (2) Based upon £55.0 million face amount converted to USD based upon the conversion rate on December 31, 2015.
(3) This is CMBS, held-to-maturity and is net of a participation sold. ARI presents the participation sold as both assets and non-recourse liabilities because the participation does not qualify as a sale according to GAAP. At December 31, 2015, this participation sold had a carrying amount of $88,984.
(4) Based upon £34.4 million face amount plus PIK converted to USD based upon the conversion rate on December 31, 2015.
(5) Based upon £19.8 million face amount converted to USD based upon the conversion rate on December 31, 2015, net of participation sold of $29,250.
(6) LTV is based upon the fully committed loan amount of $75,000. 11 (7) Mezzanine loan and preferred equity are secured by the same portfolio of properties.
|
|
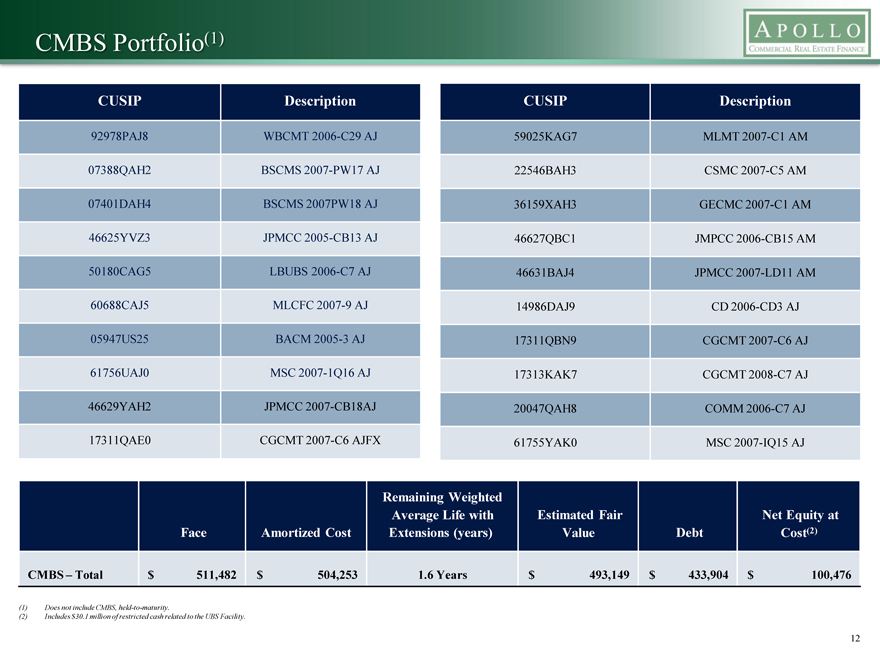
CMBS Portfolio(1)
CUSIP Description CUSIP Description
92978PAJ8 WBCMT 2006-C29 AJ 59025KAG7 MLMT 2007-C1 AM 07388QAH2 BSCMS 2007-PW17 AJ 22546BAH3 CSMC 2007-C5 AM 07401DAH4 BSCMS 2007PW18 AJ 36159XAH3 GECMC 2007-C1 AM
46625YVZ3 JPMCC 2005-CB13 AJ 46627QBC1 JMPCC 2006-CB15 AM 50180CAG5 LBUBS 2006-C7 AJ 46631BAJ4 JPMCC 2007-LD11 AM 60688CAJ5 MLCFC 2007-9 AJ 14986DAJ9 CD 2006-CD3 AJ 05947US25 BACM 2005-3 AJ 17311QBN9 CGCMT 2007-C6 AJ 61756UAJ0 MSC 2007-1Q16 AJ 17313KAK7 CGCMT 2008-C7 AJ 46629YAH2 JPMCC 2007-CB18AJ 20047QAH8 COMM 2006-C7 AJ 17311QAE0 CGCMT 2007-C6 AJFX 61755YAK0 MSC 2007-IQ15 AJ
Remaining Weighted
Average Life with Estimated Fair Net Equity at Face Amortized Cost Extensions (years) Value Debt Cost(2)
CMBS – Total $ 511,482 $ 504,253 1.6 Years $ 493,149 $ 433,904 $ 100,476
(1) Does not include CMBS, held-to-maturity.
(2) Includes $30.1 million of restricted cash related to the UBS Facility.
12
|
|
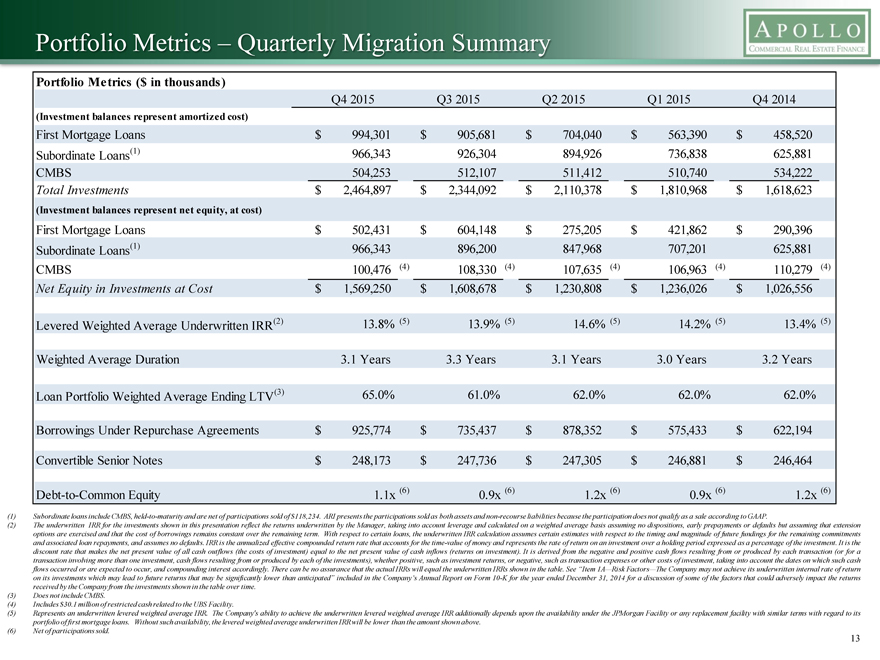
Portfolio Metrics – Quarterly Migration Summary
Portfolio Metrics ($ in thousands)
Q4 2015 Q3 2015 Q2 2015 Q1 2015 Q4 2014
(Investment balances represent amortized cost)
First Mortgage Loans $ 994,301 $ 905,681 $ 704,040 $ 563,390 $ 458,520 Subordinate Loans(1) 966,343 926,304 894,926 736,838 625,881 CMBS 504,253 512,107 511,412 510,740 534,222 Total Investments $2,464,897 $2,344,092 $2,110,378 $1,810,968 $1,618,623
(Investment balances represent net equity, at cost)
First Mortgage Loans $ 502,431 $ 604,148 $ 275,205 $ 421,862 $ 290,396 Subordinate Loans(1) 966,343 896,200 847,968 707,201 625,881 CMBS 100,476 (4) 108,330 (4) 107,635 (4) 106,963 (4) 110,279 (4) Net Equity in Investments at Cost $1,569,250 $1,608,678 $1,230,808 $1,236,026 $1,026,556
Levered Weighted Average Underwritten IRR(2) 13.8% (5) 13.9% (5) 14.6% (5) 14.2% (5) 13.4% (5)
Weighted Average Duration 3.1 Years 3.3 Years 3.1 Years 3.0 Years 3.2 Years
Loan Portfolio Weighted Average Ending LTV(3) 65.0% 61.0% 62.0% 62.0% 62.0% Borrowings Under Repurchase Agreements $ 925,774 $ 735,437 $ 878,352 $ 575,433 $ 622,194 Convertible Senior Notes $ 248,173 $ 247,736 $ 247,305 $ 246,881 $ 246,464 Debt-to-Common Equity 1.1x (6) 0.9x (6) 1.2x (6) 0.9x (6) 1.2x (6)
(1) Subordinate loans include CMBS, held-to-maturity and are net of participations sold of $118,234. ARI presents the participations sold as both assets and non-recourse liabilities because the participation does not qualify as a sale according to GAAP.
(2) The underwritten IRR for the investments shown in this presentation reflect the returns underwritten by the Manager, taking into account leverage and calculated on a weighted average basis assuming no dispositions, early prepayments or defaults but assuming that extension options are exercised and that the cost of borrowings remains constant over the remaining term. With respect to certain loans, the underwritten IRR calculation assumes certain estimates with respect to the timing and magnitude of future fundings for the remaining commitments and associated loan repayments, and assumes no defaults. IRR is the annualized effective compounded return rate that accounts for the time-value of money and represents the rate of return on an investment over a holding period expressed as a percentage of the investment. It is the discount rate that makes the net present value of all cash outflows (the costs of investment) equal to the net present value of cash inflows (returns on investment). It is derived from the negative and positive cash flows resulting from or produced by each transaction (or for a transaction involving more than one investment, cash flows resulting from or produced by each of the investments), whether positive, such as investment returns, or negative, such as transaction expenses or other costs of investment, taking into account the dates on which such cash flows occurred or are expected to occur, and compounding interest accordingly. There can be no assurance that the actual IRRs will equal the underwritten IRRs shown in the table. See “Item 1A—Risk Factors—The Company may not achieve its underwritten internal rate of return on its investments which may lead to future returns that may be significantly lower than anticipated” included in the Company’s Annual Report on Form 10-K for the year ended December 31, 2014 for a discussion of some of the factors that could adversely impact the returns received by the Company from the investments shown in the table over time.
(3) Does not include CMBS.
(4) Includes $30.1 million of restricted cash related to the UBS Facility.
(5) Represents an underwritten levered weighted average IRR. The Company’s ability to achieve the underwritten levered weighted average IRR additionally depends upon the availability under the JPMorgan Facility or any replacement facility with similar terms with regard to its portfolio of first mortgage loans.Without such availability, the levered weighted average underwritten IRR will be lower than the amount shown above.
(6) Net of participations sold. 13
|
|
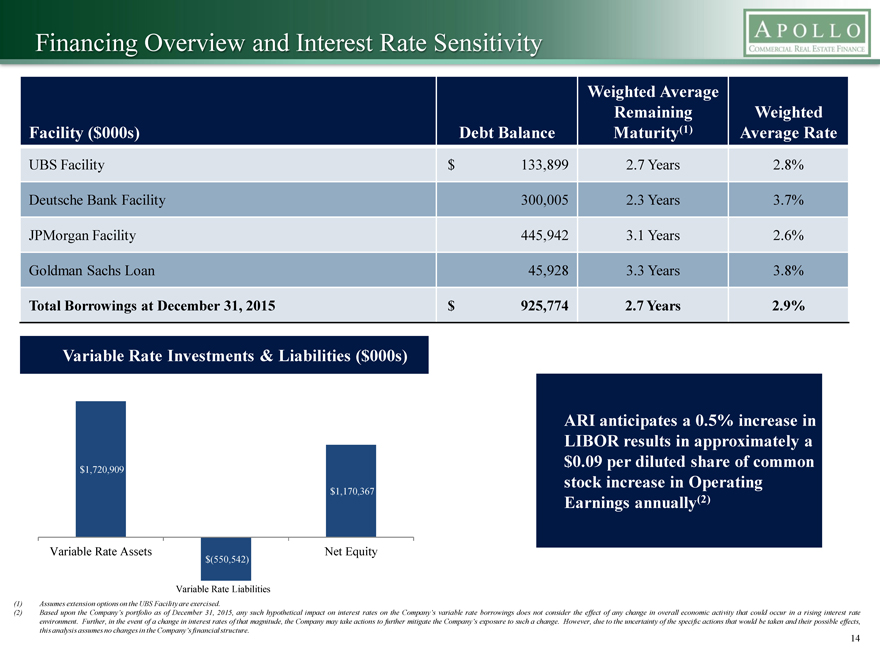
Financing Overview and Interest Rate Sensitivity
Weighted Average
Remaining Weighted Facility ($000s) Debt Balance Maturity(1) Average Rate
UBS Facility $ 133,899 2.7 Years 2.8%
Deutsche Bank Facility 300,005 2.3 Years 3.7% JPMorgan Facility 445,942 3.1 Years 2.6% Goldman Sachs Loan 45,928 3.3 Years 3.8%
Total Borrowings at December 31, 2015 $ 925,774 2.7 Years 2.9%
Variable Rate Investments & Liabilities ($000s)
ARI anticipates a 0.5% increase in LIBOR results in approximately a $0.09 per diluted share of common $1,720,909 stock increase in Operating
$1,170,367
Earnings annually(2)
Variable Rate Assets Net Equity $(550,542)
Variable Rate Liabilities
(1) Assumes extension options on the UBS Facility are exercised.
(2) Based upon the Company’s portfolio as of December 31, 2015, any such hypothetical impact on interest rates on the Company’s variable rate borrowings does not consider the effect of any change in overall economic activity that could occur in a rising interest rate environment. Further, in the event of a change in interest rates of that magnitude, the Company may take actions to further mitigate the Company’s exposure to such a change. However, due to the uncertainty of the specific actions that would be taken and their possible effects, this analysis assumes no changes in the Company’s financial structure.
14
|
|
Financials
15
|
|
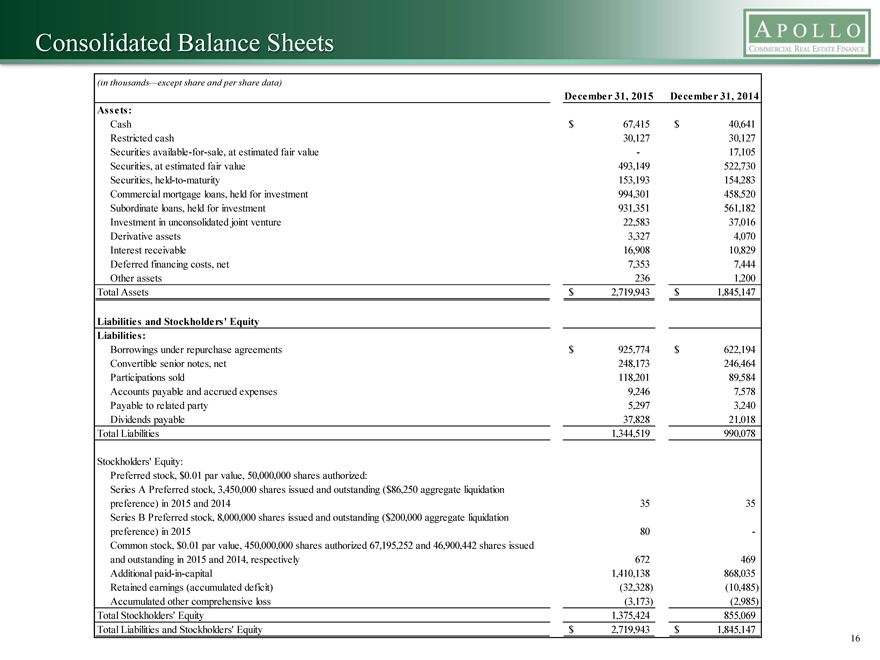
Consolidated Balance Sheets
(in thousands—except share and per share data)
December 31, 2015 December 31, 2014 Assets:
Cash $67,415 $40,641 Restricted cash 30,127 30,127 Securities available-for-sale, at estimated fair value—17,105 Securities, at estimated fair value 493,149 522,730 Securities, held-to-maturity 153,193 154,283 Commercial mortgage loans, held for investment 994,301 458,520 Subordinate loans, held for investment 931,351 561,182 Investment in unconsolidated joint venture 22,583 37,016 Derivative assets 3,327 4,070 Interest receivable 16,908 10,829 Deferred financing costs, net 7,353 7,444 Other assets 236 1,200 Total Assets $2,719,943 $1,845,147
Liabilities and Stockholders’ Equity Liabilities:
Borrowings under repurchase agreements $ 925,774 $ 622,194 Convertible senior notes, net 248,173 246,464 Participations sold 118,201 89,584 Accounts payable and accrued expenses 9,246 7,578 Payable to related party 5,297 3,240 Dividends payable 37,828 21,018 Total Liabilities 1,344,519 990,078
Stockholders’ Equity:
Preferred stock, $0.01 par value, 50,000,000 shares authorized:
Series A Preferred stock, 3,450,000 shares issued and outstanding ($86,250 aggregate liquidation preference) in 2015 and 2014 35 35 Series B Preferred stock, 8,000,000 shares issued and outstanding ($200,000 aggregate liquidation preference) in 2015 80 -Common stock, $0.01 par value, 450,000,000 shares authorized 67,195,252 and 46,900,442 shares issued and outstanding in 2015 and 2014, respectively 672 469 Additional paid-in-capital 1,410,138 868,035 Retained earnings (accumulated deficit) (32,328) (10,485) Accumulated other comprehensive loss (3,173) (2,985) Total Stockholders’ Equity 1,375,424 855,069 Total Liabilities and Stockholders’ Equity $2,719,943 $1,845,147
16
|
|
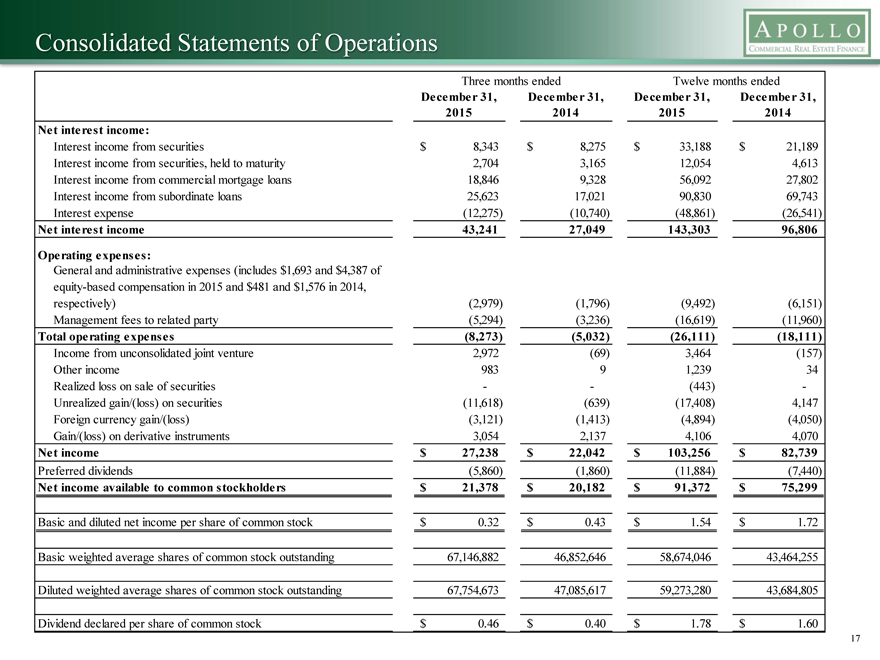
Consolidated Statements of Operations
Three months ended Twelve months ended
December 31, December 31, December 31, December 31, 2015 2014 2015 2014 Net interest income:
Interest income from securities $8,343 $8,275 $ 33,188 $21,189 Interest income from securities, held to maturity 2,704 3,165 12,054 4,613 Interest income from commercial mortgage loans 18,846 9,328 56,092 27,802 Interest income from subordinate loans 25,623 17,021 90,830 69,743 Interest expense (12,275) (10,740) (48,861) (26,541)
Net interest income 43,241 27,049 143,303 96,806
Operating expenses:
General and administrative expenses (includes $1,693 and $4,387 of equity-based compensation in 2015 and $481 and $1,576 in 2014, respectively) (2,979) (1,796) (9,492) (6,151) Management fees to related party (5,294) (3,236) (16,619) (11,960)
Total operating expenses (8,273) (5,032) (26,111) (18,111)
Income from unconsolidated joint venture 2,972 (69) 3,464 (157) Other income 983 9 1,239 34 Realized loss on sale of securities — (443) -Unrealized gain/(loss) on securities (11,618) (639) (17,408) 4,147 Foreign currency gain/(loss) (3,121) (1,413) (4,894) (4,050) Gain/(loss) on derivative instruments 3,054 2,137 4,106 4,070
Net income $27,238 $22,042 $103,256 $82,739
Preferred dividends (5,860) (1,860) (11,884) (7,440)
Net income available to common stockholders $21,378 $20,182 $91,372 $75,299
Basic and diluted net income per share of common stock $0.32 $0.43 $1.54 $1.72 Basic weighted average shares of common stock outstanding 67,146,882 46,852,646 58,674,046 43,464,255 Diluted weighted average shares of common stock outstanding 67,754,673 47,085,617 59,273,280 43,684,805 Dividend declared per share of common stock $0.46 $0.40 $1.78 $1.60
17
|
|
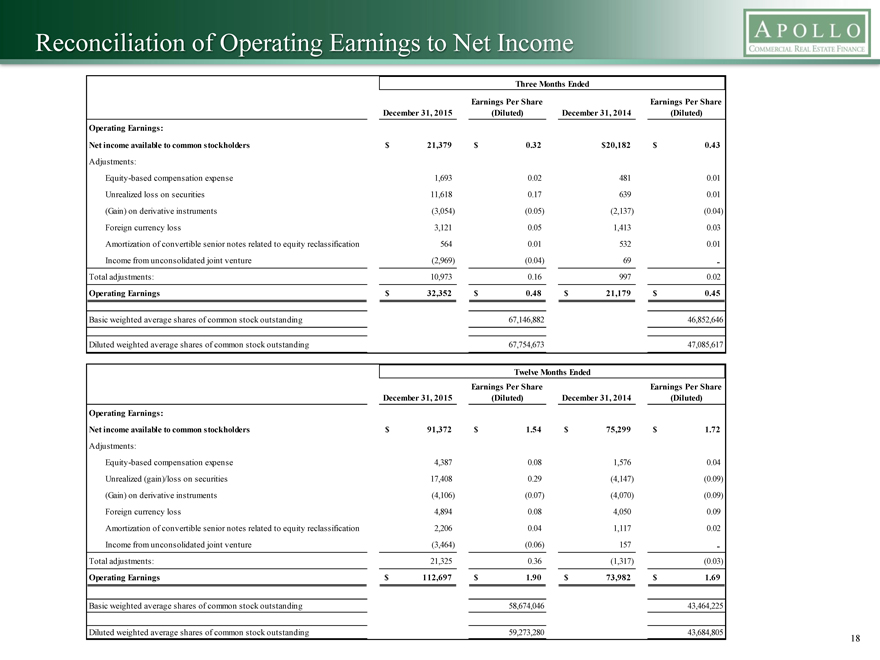
Reconciliation of Operating Earnings to Net Income
Three Months Ended
Earnings Per Share Earnings Per Share December 31, 2015 (Diluted) December 31, 2014 (Diluted) Operating Earnings:
Net income available to common stockholders $ 21,379 $ 0.32 $20,182 $ 0.43
Adjustments:
Equity-based compensation expense 1,693 0.02 481 0.01 Unrealized loss on securities 11,618 0.17 639 0.01 (Gain) on derivative instruments (3,054) (0.05) (2,137) (0.04) Foreign currency loss 3,121 0.05 1,413 0.03 Amortization of convertible senior notes related to equity reclassification 564 0.01 532 0.01
Income from unconsolidated joint venture (2,969) (0.04) 69 -Total adjustments: 10,973 0.16 997 0.02
Operating Earnings $ 32,352 $ 0.48 $ 21,179 $ 0.45
Basic weighted average shares of common stock outstanding 67,146,882 46,852,646
Diluted weighted average shares of common stock outstanding 67,754,673 47,085,617
Twelve Months Ended
Earnings Per Share Earnings Per Share December 31, 2015 (Diluted) December 31, 2014 (Diluted) Operating Earnings:
Net income available to common stockholders $ 91,372 $ 1.54 $ 75,299 $ 1.72
Adjustments:
Equity-based compensation expense 4,387 0.08 1,576 0.04 Unrealized (gain)/loss on securities 17,408 0.29 (4,147) (0.09) (Gain) on derivative instruments (4,106) (0.07) (4,070) (0.09) Foreign currency loss 4,894 0.08 4,050 0.09 Amortization of convertible senior notes related to equity reclassification 2,206 0.04 1,117 0.02
Income from unconsolidated joint venture (3,464) (0.06) 157 -Total adjustments: 21,325 0.36 (1,317) (0.03)
Operating Earnings $ 112,697 $ 1.90 $ 73,982 $ 1.69
Basic weighted average shares of common stock outstanding 58,674,046 43,464,225
Diluted weighted average shares of common stock outstanding 59,273,280 43,684,805
18
|
|
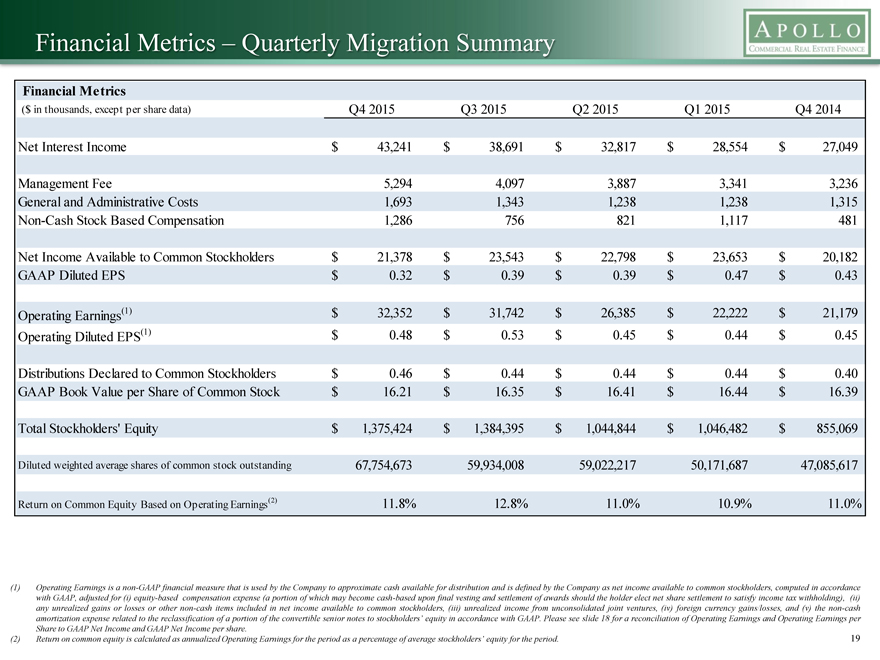
Financial Metrics – Quarterly Migration Summary
Financial Metrics
($ in thousands, except per share data) Q4 2015 Q3 2015 Q2 2015 Q1 2015 Q4 2014
Net Interest Income $43,241 $38,691 $32,817 $28,554 $27,049
Management Fee 5,294 4,097 3,887 3,341 3,236 General and Administrative Costs 1,693 1,343 1,238 1,238 1,315 Non-Cash Stock Based Compensation 1,286 756 821 1,117 481
Net Income Available to Common Stockholders $21,378 $23,543 $22,798 $23,653 $20,182 GAAP Diluted EPS $ 0.32 $ 0.39 $ 0.39 $ 0.47 $0.43
Operating Earnings(1) $32,352 $31,742 $26,385 $22,222 $21,179 Operating Diluted EPS(1) $ 0.48 $ 0.53 $ 0.45 $ 0.44 $0.45
Distributions Declared to Common Stockholders $ 0.46 $ 0.44 $ 0.44 $ 0.44 $0.40 GAAP Book Value per Share of Common Stock $16.21 $16.35 $16.41 $16.44 $16.39
Total Stockholders’ Equity $1,375,424 $1,384,395 $1,044,844 $1,046,482 $855,069
Diluted weighted average shares of common stock outstanding 67,754,673 59,934,008 59,022,217 50,171,687 47,085,617
Return on Common Equity Based on Operating Earnings(2) 11.8% 12.8% 11.0% 10.9% 11.0%
(1) Operating Earnings is a non-GAAP financial measure that is used by the Company to approximate cash available for distribution and is defined by the Company as net income available to common stockholders, computed in accordance with GAAP, adjusted for (i) equity-based compensation expense (a portion of which may become cash-based upon final vesting and settlement of awards should the holder elect net share settlement to satisfy income tax withholding), (ii) any unrealized gains or losses or other non-cash items included in net income available to common stockholders, (iii) unrealized income from unconsolidated joint ventures, (iv) foreign currency gains/losses, and (v) the non-cash amortization expense related to the reclassification of a portion of the convertible senior notes to stockholders’ equity in accordance with GAAP. Please see slide 18 for a reconciliation of Operating Earnings and Operating Earnings per Share to GAAP Net Income and GAAP Net Income per share.
(2) Return on common equity is calculated as annualized Operating Earnings for the period as a percentage of average stockholders’ equity for the period.
19