Attached files
| file | filename |
|---|---|
| 8-K - FORM 8-K - US BANCORP \DE\ | d127680d8k.htm |
 Credit
Suisse 2016 Financial Services Forum
February 9, 2016 Kathy Rogers Vice Chairman and Chief Financial Officer P.W. (Bill) Parker Vice Chairman, Chief Risk Officer Exhibit 99.1 |
 2 | U.S. BANCORP Forward-looking Statements and Additional Information The following information appears in accordance with the Private Securities Litigation Reform Act of 1995:
This presentation contains forward-looking statements about U.S. Bancorp.
Statements that are not historical or current facts, including statements
about beliefs and expectations, are forward-looking statements and are based on the information available to, and assumptions and estimates made by, management as of the date made. These forward-looking statements cover, among other things, anticipated future
revenue and expenses and the future plans and prospects of U.S.
Bancorp. Forward-looking statements involve inherent risks and uncertainties, and important factors could cause actual results to differ materially from those anticipated. A reversal or slowing of the current economic
recovery or another severe contraction could adversely affect U.S.
Bancorp’s revenues and the values of its assets and liabilities. Global financial markets could experience a recurrence of significant turbulence, which could reduce the availability of funding to certain financial institutions and
lead to a tightening of credit, a reduction of business activity, and
increased market volatility. Stress in the commercial real estate markets, as well as a downturn in the residential real estate markets, could cause credit losses and deterioration in asset values. In addition, U.S.
Bancorp’s business and financial performance is likely to be
negatively impacted by recently enacted and future legislation and regulation. U.S. Bancorp’s results could also be adversely affected by deterioration in general business and economic conditions; changes in interest rates; deterioration in the
credit quality of its loan portfolios or in the value of the collateral
securing those loans; deterioration in the value of securities held in its investment securities portfolio; legal and regulatory developments; litigation; increased competition from both banks and non-banks; changes in customer
behavior and preferences; breaches in data security; effects of mergers
and acquisitions and related integration; effects of critical accounting
policies and judgments; and management’s ability to effectively manage credit
risk, market risk, operational risk, compliance risk, strategic risk,
interest rate risk, liquidity risk and reputational risk. For discussion of these and other risks that may cause actual results to differ from expectations, refer to U.S. Bancorp’s Annual Report
on Form 10-K for the year
ended December 31, 2014, on file with the Securities and Exchange Commission, including the sections entitled “Risk Factors” and “Corporate Risk Profile” contained in Exhibit 13, and all subsequent filings with the Securities and Exchange
Commission under Sections 13(a), 13(c), 14 or 15(d) of the Securities
Exchange Act of 1934. Forward-looking statements speak only as of the date they are made, and U.S. Bancorp undertakes no obligation to update them in light of new information or future events.
This presentation includes non-GAAP financial measures to describe U.S.
Bancorp’s performance. The calculations of these measures are
provided within or in the appendix of the presentation. These disclosures should
not be viewed as a substitute for operating results determined in
accordance with GAAP, nor are they necessarily comparable to non-GAAP performance
measures that may be presented by other companies. |
 3 | U.S. BANCORP Agenda Company Overview Value Creation Credit Update Interest Rates 1Q16 Update |
 4 | U.S. BANCORP U.S. Bancorp 4Q15 Dimensions Market value as of 2/5/16 NYSE Traded USB Founded 1863 Market Value $70B Branches 3,133 ATMs 4,936 Customers 18.5M Assets $422B Deposits $300B Loans $261B |
 5 | U.S. BANCORP Industry Position Source: company reports, SNL and FactSet Assets and deposits as of 12/31/15, market value as of 2/5/16 Assets Market Value Deposits U.S. U.S. U.S. Rank Company $ Billions Rank Company $ Billions Rank Company $ Billions 1 J.P. Morgan 2,352 1 J.P. Morgan 1,280 1 Wells Fargo 244 2 Bank of America 2,144 2 Wells Fargo 1,223 2 J.P. Morgan 213 3 Wells Fargo 1,788 3 Bank of America 1,197 3 Bank of America 134 4 Citigroup 1,731 4 Citigroup 908 4 Citigroup 118 5 U.S. Bancorp 422 5 U.S. Bancorp 300 5 U.S. Bancorp 70 6 PNC 358 6 PNC 249 6 PNC 42 7 BB&T 210 7 SunTrust 150 7 BB&T 25 8 SunTrust 191 8 BB&T 149 8 SunTrust 17 9 Fifth Third 141 9 Fifth Third 103 9 Fifth Third 12 10 Regions 126 10 Regions 98 10 Regions 10 |
 6 | U.S. BANCORP Agenda Company Overview Value Creation Credit Update Interest Rates 1Q16 Update |
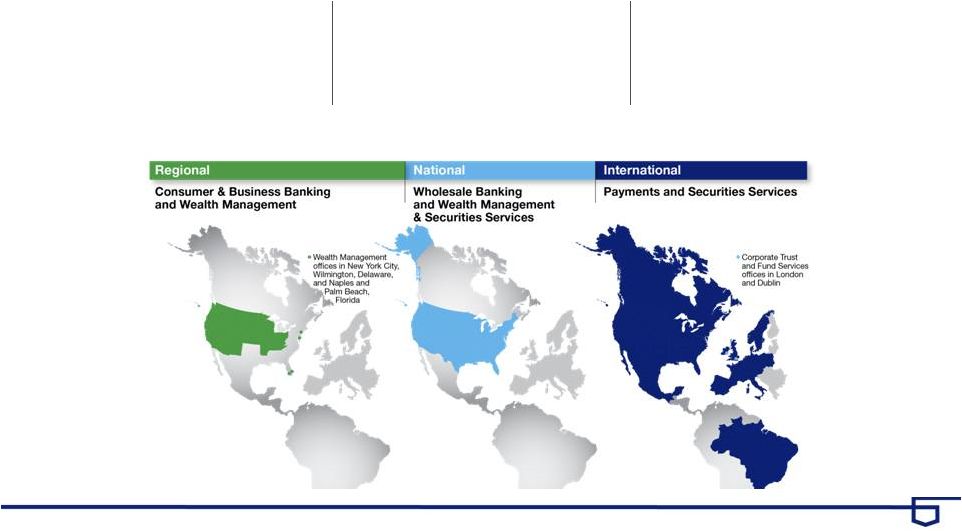
 7 | U.S. BANCORP Revenue Diversification Revenue Mix By Business Line Consumer and Small Business Banking 41% Payment Services 31% Wealth Mgmt and Securities Services 11% Wholesale Banking and Commercial Real Estate 17% Fee Income / Total Revenue 46% 45% 45% 45% 35% 40% 45% 50% 55% 2012 2013 2014 2015 FY2015 taxable-equivalent basis Business line revenue percentages exclude Treasury and Corporate Support (see slide 21)
Revenue Advantages High return/capital efficient businesses: Corporate Trust Merchant Services Fund Services Treasury Management Consistent, predictable businesses |
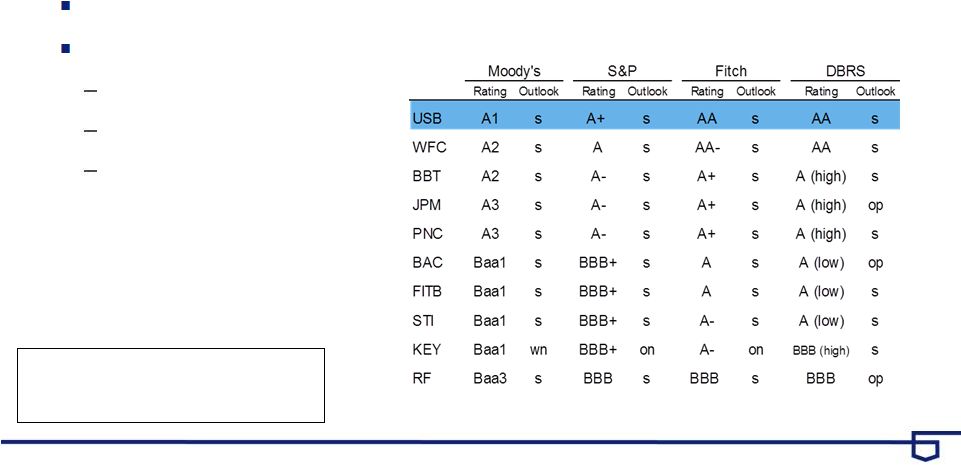 8 | U.S. BANCORP Best in Class Debt Rating Debt ratings: holding company as of 2/5/16 USB is highest rated peer bank across all rating agencies Funding advantage Competitive advantages Pricing Flight-to-quality Sales Force Confidence op=outlook positive on=outlook negative s=outlook stable wn=watch negative wp=watch positive |
 | Source: SNL; Peer banks: BAC, BBT, FITB, JPM, KEY, PNC, RF, STI and WFC Revenue contribution percentages exclude Treasury and Corporate Support (see slide 21)
Achieving Growth 9 U.S. BANCORP 24% 18% 24% 15% 10% 9% 34% 17% 27% 13% 2% 7% 22% 54% 24% 28% 60% 12% 19% 9% 28% 44% 17% 11% 31% 41% Total Revenue 2010 Revenue $18.1 billion 2015 Revenue $20.3 billion 2010 Avg Deposits $185 billion 2015 Avg Deposits $287 Billion Average Deposits 2010 Avg Loans $193 billion 2015 Avg Loans $250 billion Average Loans Payment Services Consumer and Small Business Banking Wealth Management and Securities Services Wholesale Banking and Commercial Real Estate Noninterest Bearing Checking and Savings Time Commercial Commercial Real Estate Res Mtg and Home Equity Credit Card Other Retail Covered Peer Median +15% USB +30% USB +55% Peer Median +24% Peer Median -5% USB +12% |
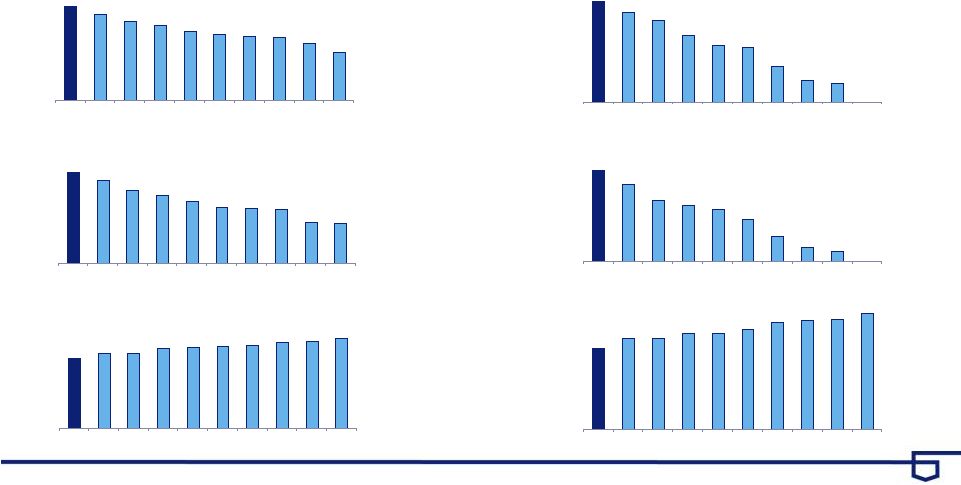 10 | U.S. BANCORP Performance vs. Peers Return on Average Assets Return on Average Common Equity Efficiency Ratio Since 1Q08 2015 Source: SNL and company reports; Peer banks: BAC, BBT, FITB, JPM, KEY, PNC, RF, STI and WFC
Efficiency ratio computed as noninterest expense divided by the sum of net interest
income on a taxable-equivalent basis and noninterest income excluding
net securities gains (losses) 1.44%
1.32% 1.22% 1.16% 1.06% 1.02% 0.99% 0.97% 0.87% 0.74% USB Peer 1 Peer 2 Peer 3 Peer 4 Peer 5 Peer 6 Peer 7 Peer 8 Peer 9 14.0% 12.7% 11.3% 10.4% 9.5% 8.6% 8.5% 8.3% 6.3% 6.2% USB Peer 1 Peer 2 Peer 3 Peer 4 Peer 5 Peer 6 Peer 7 Peer 8 Peer 9 53.8% 57.7% 57.7% 61.5% 62.5% 63.3% 64.2% 66.5% 66.7% 69.5% USB Peer 1 Peer 2 Peer 3 Peer 4 Peer 5 Peer 6 Peer 7 Peer 8 Peer 9 14.2% 12.0% 9.6% 8.9% 8.2% 6.6% 4.0% 2.2% 1.7% USB Peer 1 Peer 2 Peer 3 Peer 4 Peer 5 Peer 6 Peer 7 Peer 8 Peer 9 51.4% 57.6% 58.0% 61.0% 61.1% 63.7% 68.1% 69.3% 69.7% 73.7% USB Peer 1 Peer 2 Peer 3 Peer 4 Peer 5 Peer 6 Peer 7 Peer 8 Peer 9 1.41% 1.24% 1.13% 0.92% 0.79% 0.75% 0.50% 0.30% 0.26% USB Peer 1 Peer 2 Peer 3 Peer 4 Peer 5 Peer 6 Peer 7 Peer 8 Peer 9 |
 11 | U.S. BANCORP Efficiency Single processing platforms Full consolidation of acquisitions Operating scale in all significant businesses Business line monthly review process Prudent expense management Source: SNL and company reports; Peer banks: BAC, BBT, FITB, JPM, KEY, PNC, RF, STI and WFC
Efficiency ratio computed as noninterest expense divided by the sum of net interest
income on a taxable-equivalent basis and noninterest income excluding
net securities gains (losses) 2015 Efficiency Ratio
Sources of Competitive Advantage 53.8% 57.7% 57.7% 61.5% 62.5% 63.3% 64.2% 66.5% 66.7% 69.5% USB Peer 1 Peer 2 Peer 3 Peer 4 Peer 5 Peer 6 Peer 7 Peer 8 Peer 9 |
 12 | U.S. BANCORP Capital Management Earnings Distribution Target Annual dividend increased from $0.98 to $1.02 per share in 2Q15, a 4.1% increase Five-quarter authorization to repurchase up to $3.0 billion of outstanding stock effective April 1, 2015 CET1* at 9.1% in 4Q15, above target of 8.0% Capital Actions Payout Ratio 72% 71% 72% 62% * Common equity tier 1 capital to risk-weighted assets estimated for the Basel III fully implemented standardized approach
Reinvest and Acquisitions Dividends Share Repurchases 20 - 40% 30 - 40% 30 - 40% 35% 42% 41% 40% 2012 2013 2014 2015 Dividends Share Repurchases 27% 29% 31% 32% |
 13 | U.S. BANCORP Agenda Company Overview Value Creation Credit Update Interest Rates 1Q16 Update |
 Credit
Quality $ in millions
Net Charge-offs Net Charge-offs (Left Scale) NCOs to Avg Loans (Right Scale) Nonperforming Assets Nonperforming Assets (Left Scale) NPAs to Loans plus ORE (Right Scale) $308 $279 $296 $292 $305 0.50% 0.46% 0.48% 0.46% 0.47% 0.00% 0.75% 1.50% 2.25% 3.00% 0 130 260 390 4Q14 1Q15 2Q15 3Q15 4Q15 520 $1,808 $1,696 $1,577 $1,567 $1,523 0.73% 0.69% 0.63% 0.61% 0.58% 0.00% 0.75% 1.50% 2.25% 3.00% 0 700 1,400 2,100 4Q14 1Q15 2Q15 3Q15 4Q15 2,800 14 | U.S. BANCORP |
 15 | U.S. BANCORP Credit Update - Energy Overview Wholesale energy loans of $3.2 billion; 1.2% of total loans Most directly impacted are the exploration and production loans which make up about half of the total energy portfolio • Largely secured by borrowing bases • Monitored and adjusted relative to market conditions Reserve for energy loans is 5.4% of total energy loans • Reserve levels assume oil prices stay at depressed levels for the near future Loans outstanding in energy-related markets represent 1.8% of total loans Principally commercial real estate loans to long-standing, well-financed
relationships No evidence that job losses in energy-related markets are adversely impacting
our consumer portfolio
Loans and reserve for loan losses measured at 12/31/15
Energy-related markets: Houston-Baytown-Sugar Land TX, Midland/Odessa
TX, New Orleans-Metairie-Kenner LA, Oklahoma City OK, Tulsa OK,
Greeley CO, Denver CO, Baton Rouge LA, Bakersfield CA
|
 16 | U.S. BANCORP Agenda Company Overview Value Creation Credit Update Interest Rates 1Q16 Update |
 17 | U.S. BANCORP Asset Sensitive Balance Sheet Tailwinds: ~50% of earning assets are rate sensitive of which the majority re-price in first 90 days Deposit growth remains strong Limited deposit re-pricing Headwinds: Lower long-term rates • Negative impact on new consumer loan rates • Lower reinvestment rate on securities 1Q16 Impact: Net Interest Margin - relatively stable Sensitivity of Net Interest Income Post Rate Hike 1.30% 1.38% 1.66% 1.71% 1.72% 1.75% 1.68% 2.19% 2.37% 2.39% 0.00% 1.00% 2.00% 3.00% 4.00% 3Q14 4Q14 1Q15 2Q15 3Q15 Up 50 bps Immediate Up 200 bps Gradual |
 18 | U.S. BANCORP Agenda Company Overview Value Creation Credit Update Interest Rates 1Q16 Update |
 19 | U.S. BANCORP 1Q16 Linked Quarter Update |
 20 | U.S. BANCORP Appendix |
 21 | U.S. BANCORP Non-GAAP Financial Measures Line of Business Financial Performance Taxable-equivalent basis $ in millions Revenue Line of Business Financial Performance 2015x Wholesale Banking and Commercial Real Estate 2,924 $ Consumer and Small Business Banking 7,114 Wealth Management and Securities Services 1,852 Payment Services 5,301 Treasury and Corporate Support 3,115 Consolidated Company 20,306 Less Treasury and Corporate Support 3,115 Consolidated Company excluding Treasury and Corporate Support 17,191 $ Percent of Total Wholesale Banking and Commercial Real Estate 15% Consumer and Small Business Banking 35% Wealth Management and Securities Services 9% Payment Services 26% Treasury and Corporate Support 15% Total 100% Percent of Total excluding Treasury and Corporate Support Wholesale Banking and Commercial Real Estate 17% Consumer and Small Business Banking 41% Wealth Management and Securities Services 11% Payment Services 31% Total 100% |
 Credit
Suisse 2016 Financial Services Forum |