Attached files
| file | filename |
|---|---|
| 8-K - 8-K - MEDICAL PROPERTIES TRUST INC | d124447d8k.htm |
| EX-99.1 - EX-99.1 - MEDICAL PROPERTIES TRUST INC | d124447dex991.htm |
Exhibit 99.2

Exhibit 99.2
FOURTH QUARTER 2015
Supplemental Information
MEDICALPROPERTIESTRUST.COM
TABLE OF CONTENTS
COMPANY OVERVIEW
Company Information 3
FINANCIAL INFORMATION
Reconciliation of Net Income to Funds from Operations 5 Debt Summary 6 Debt Maturity Schedule 7
PORTFOLIO INFORMATION
Lease Maturity and Mortage Loan Schedule 8 Investments
and Revenue by Asset Type, Operator, State and Country 9 EBITDAR to Rent Coverage 12 Acquisitions and Summary of Development Projects 13
FINANCIAL STATEMENTS
Consolidated Statements of Income 14 Consolidated Balance Sheets 15 Detail of Other Assets 16
FORWARD-LOOKING STATEMENT Forward-looking statements involve known and unknown risks, uncertainties and other factors that may cause the actual results of the Company or future
events to differ materially from those expressed in or underlying such forward-looking statements, including without limitation: the satisfaction of all conditions to, and the timely closing (if at all) of the Median sale-leaseback transactions; the
Company financing of the transactions described herein; the capacity of Median and the Company’s other tenants to meet the terms of their agreements; Normalized FFO per share; expected payout ratio, the amount of acquisitions of healthcare real
estate, if any; capital markets conditions, the repayment of debt arrangements; statements concerning the additional income to the Company as a result of ownership interests in certain hospital operations and the timing of such income; the payment
of future dividends, if any; completion of additional debt arrangement, and additional investments; national and international economic, business, real estate and other market conditions; the competitive environment in which the Company operates;
the execution of the Company’s business plan; financing risks; the Company’s ability to maintain its status as a REIT for federal income tax purposes; acquisition and development risks; potential environmental and other liabilities; and
other factors affecting the real estate industry generally or healthcare real estate in particular. For further discussion of the factors that could affect outcomes, please refer to the “Risk factors” section of the Company’s Annual
Report on Form 10-K for the year ended December 31, 2014, and as updated by the Company’s subsequently filed Quarterly Reports on Form 10-Q and other SEC filings. Except as otherwise required by the federal securities laws, the Company
undertakes no obligation to update the information in this report.
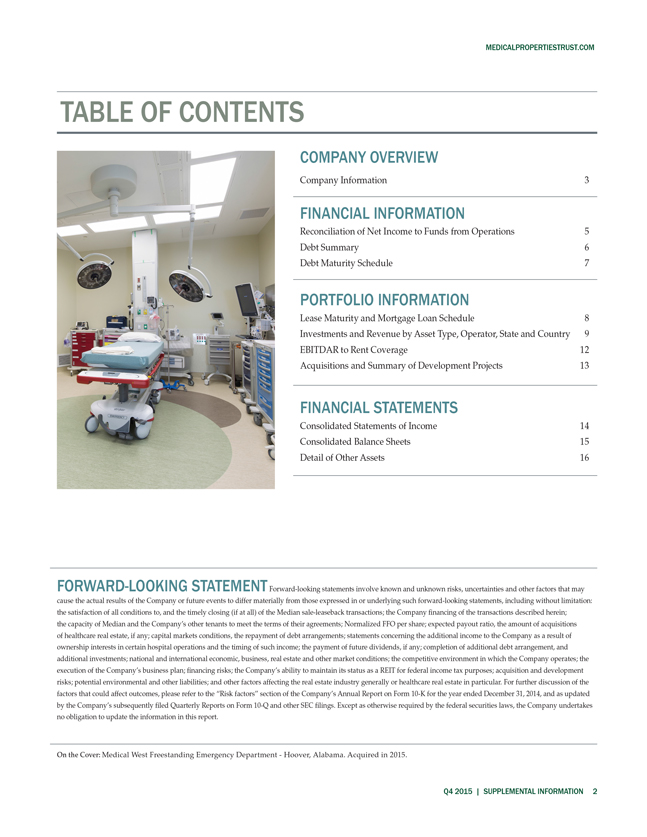
On the Cover: Medical west freestanding Emergency Department-Hoover, Albama. Acquired in 2015.
Q4 2015 | SUPPLEMENTAL INFORMATION 2
MEDICALPROPERTIESTRUST.COM COMPANY OVERVIEW Medical Properties Trust, Inc. is a Birmingham, Alabama based self-advised real estate investment trust formed to capitalize on the changing trends in healthcare delivery by acquiring and developing net-leased healthcare facilities. MPT’s financing model allows hospitals and other healthcare facilities to unlock the value of their underlying real estate in order to fund facility improvements, technology upgrades, staff additions and new construction. Facilities include acute care hospitals, inpatient rehabilitation hospitals, long-term acute care hospitals, and other medical and surgical facilities. OFFICERS Edward K. Aldag, Jr. Chairman, President and Chief Executive Officer R. Steven Hamner Executive Vice President and Chief Financial Officer Emmett E. McLean Executive Vice President, Chief Operating Officer, Treasurer and Secretary Frank R. Williams, Jr. Senior Vice President, Senior Managing Director - Acquisitions BOARD OF DIRECTORS Edward K. Aldag, Jr. G. Steven Dawson R. Steven Hamner Robert. E. Holmes, Ph.D. Sherry A. Kellett William G. McKenzie L. Glenn Orr, Jr. D. Paul Sparks, Jr. CORPORATE HEADQUARTERS Medical Properties Trust, Inc. 1000 Urban Center Drive, Suite 501 Birmingham, AL 35242 (205) 969-3755 (205) 969-3756 (fax) www.medicalpropertiestrust.com Q4 2015 | SUPPLEMENTAL INFORMATION 3
MEDICALPROPERTIESTRUST.COM
COMPANY OVERVIEW (continued)
INVESTOR RELATIONS
Tim Berryman | Director - Investor Relations
(205) 397-8589
tberryman@medicalpropertiestrust.com
CAPITAL MARKETS
Charles Lambert |
Managing Director - Capital Markets
(205) 397-8897 clambert@medicalpropertiestrust.com
TRANSFER AGENT
American Stock Transfer and Trust Company
6201 15th Avenue Brooklyn, NY 11219
STOCK EXCHANGE LISTING AND TRADING SYMBOL
New York Stock Exchange (NYSE): MPW
SENIOR UNSECURED DEBT RATINGS
Moody’s – Ba1
Standard & Poor’s – BBB-
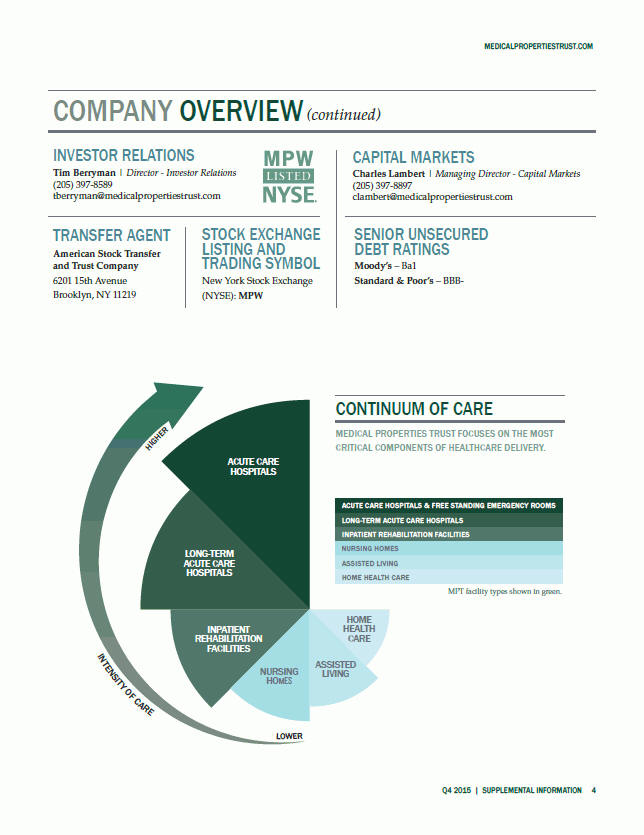
CONTINUUM OF CARE
MEDICAL PROPERTIES TRUST FOCUSES ON THE MOST CRITICAL COMPONENTS OF
HEALTHCARE DELIVERY.
ACUTE CARE HOSPITALS & FREE STANDING EMERGENCY ROOMS LONG-TERM ACUTE CARE HOSPITALS
INPATIENT REHABILITATION FACILITIES NURSING HOMES
ASSISTED LIVING HOME HEALTH CARE
MPT facility types shown in green.
HIGHER
INTENSITY OF CARE
LOWER
ACUTE CARE HOSPITALS
LONG-TERM ACUTE CARE HOSPITALS
INPATIENT REHABILITATION FACILITIES
NURSING HOMES
HEALTH HOME CARE
ASSISTED LIVING
Q4 2015 | SUPPLEMENTAL INFORMATION 4
MEDICALPROPERTIESTRUST.COM
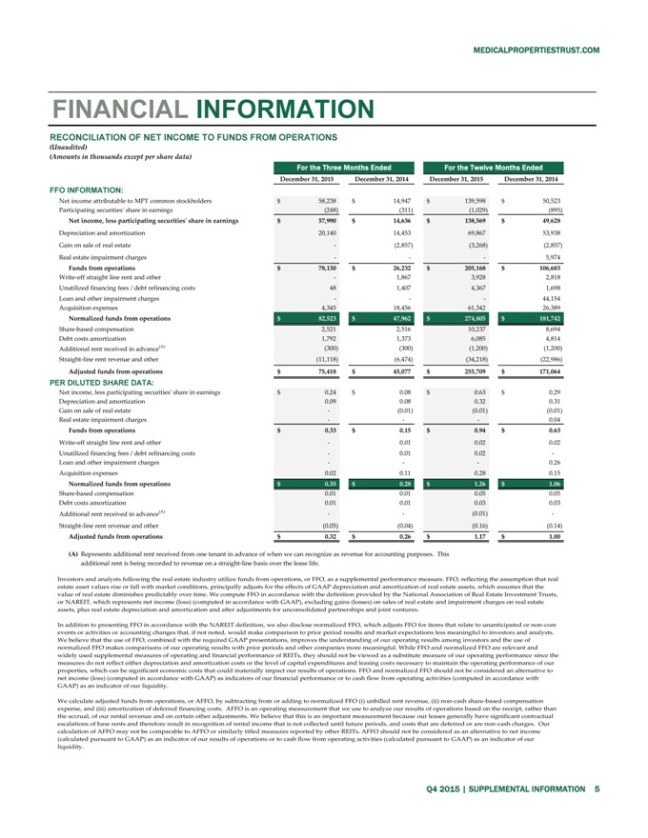
FINANCIAL INFORMATION
RECONCILIATION OF NET INCOME TO FUNDS FROM OPERATIONS
(Unaudited)
(Amounts in thousands except per share data)
For the Three Months Ended For the Twelve Months Ended
December 31,
2015 December 31, 2014 December 31, 2015 December 31, 2014
FFO INFORMATION:
Net income attributable to MPT common stockholders $ 58,238 $ 14,947 $ 139,598 $ 50,523
Participating securities’ share in earnings (248) (311) (1,029) (895)
Net income, less participating securities’ share in earnings $ 57,990 $ 14,636 $ 138,569 $ 49,628
Depreciation and amortization 20,140 14,453 69,867 53,938
Gain on sale of real estate —
(2,857) (3,268) (2,857)
Real estate impairment charges — — — 5,974
Funds from operations $ 78,130 $ 26,232 $ 205,168 $ 106,683
Write-off straight line rent and
other — 1,867 3,928 2,818
Unutilized financing fees / debt refinancing costs 48 1,407 4,367 1,698
Loan and other impairment charges — — — 44,154
Acquisition expenses 4,345
18,456 61,342 26,389
Normalized funds from operations $ 82,523 $ 47,962 $ 274,805 $ 181,742
Share-based compensation 2,521 2,516 10,237 8,694
Debt costs amortization 1,792 1,373 6,085
4,814
Additional rent received in advance(A) (300) (300) (1,200) (1,200)
Straight-line rent revenue and other (11,118) (6,474) (34,218) (22,986)
Adjusted funds from operations $ 75,418 $ 45,077 $ 255,709 $ 171,064
PER
DILUTED SHARE DATA:
Net income, less participating securities’ share in earnings $ 0.24 $ 0.08 $ 0.63 $ 0.29
Depreciation and amortization 0.09 0.08 0.32 0.31
Gain on sale of real estate — (0.01)
(0.01) (0.01)
Real estate impairment charges — — — 0.04
Funds
from operations $ 0.33 $ 0.15 $ 0.94 $ 0.63
Write-off straight line rent and other — 0.01 0.02 0.02
Unutilized financing fees / debt refinancing costs — 0.01 0.02 -
Loan and other
impairment charges — — — 0.26
Acquisition expenses 0.02 0.11 0.28 0.15
Normalized funds from operations $ 0.35 $ 0.28 $ 1.26 $ 1.06
Share-based compensation 0.01
0.01 0.05 0.05
Debt costs amortization 0.01 0.01 0.03 0.03
Additional rent
received in advance(A) — — (0.01) -
Straight-line rent revenue and other (0.05) (0.04) (0.16) (0.14)
Adjusted funds from operations $ 0.32 $ 0.26 $ 1.17 $ 1.00
Represents additional rent received
from one tenant in advance of when we can recognize as revenue for accounting purposes. This additional rent is being recorded to revenue on a straight-line basis over the lease life.
Investors and analysts following the real estate industry utilize funds from operations, or FFO, as a supplemental performance measure. FFO, reflecting the assumption that real
estate asset values rise or fall with market conditions, principally adjusts for the effects of GAAP depreciation and amortization of real estate assets, which assumes that the value of real estate diminishes predictably over time. We compute FFO in
accordance with the definition provided by the National Association of Real Estate Investment Trusts, or NAREIT, which represents net income (loss) (computed in accordance with GAAP), excluding gains (losses) on sales of real estate and impairment
charges on real estate assets, plus real estate depreciation and amortization and after adjustments for unconsolidated partnerships and joint ventures.
In addition
to presenting FFO in accordance with the NAREIT definition, we also disclose normalized FFO, which adjusts FFO for items that relate to unanticipated or non-core events or activities or accounting changes that, if not noted, would make comparison to
prior period results and market expectations less meaningful to investors and analysts. We believe that the use of FFO, combined with the required GAAP presentations, improves the understanding of our operating results among investors and the use of
normalized FFO makes comparisons of our operating results with prior periods and other companies more meaningful. While FFO and normalized FFO are relevant and widely used supplemental measures of operating and financial performance of REITs, they
should not be viewed as a substitute measure of our operating performance since the measures do not reflect either depreciation and amortization costs or the level of capital expenditures and leasing costs necessary to maintain the operating
performance of our properties, which can be significant economic costs that could materially impact our results of operations. FFO and normalized FFO should not be considered an alternative to net income (loss) (computed in accordance with GAAP) as
indicators of our financial performance or to cash flow from operating activities (computed in accordance with GAAP) as an indicator of our liquidity.
We calculate
adjusted funds from operations, or AFFO, by subtracting from or adding to normalized FFO (i) unbilled rent revenue, (ii) non-cash share-based compensation expense, and (iii) amortization of deferred financing costs. AFFO is an
operating measurement that we use to analyze our results of operations based on the receipt, rather than the accrual, of our rental revenue and on certain other adjustments. We believe that this is an important measurement because our leases
generally have significant contractual escalations of base rents and therefore result in recognition of rental income that is not collected until future periods, and costs that are deferred or are non-cash charges. Our calculation of AFFO may not be
comparable to AFFO or similarly titled measures reported by other REITs. AFFO should not be considered as an alternative to net income (calculated pursuant to GAAP) as an indicator of our results of operations or to cash flow from operating
activities (calculated pursuant to GAAP) as an indicator of our
liquidity.
Q4
2015 | SUPPLEMENTAL INFORMATION 5
MEDICALPROPERTIESTRUST.COM
FINANCIAL INFORMATION
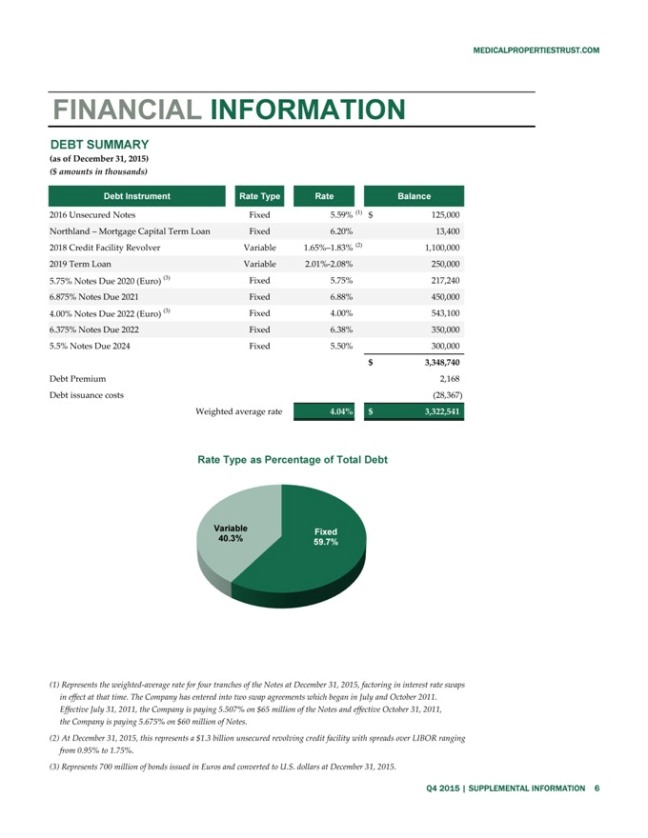
DEBT SUMMARY
(as of December 31, 2015)
($ amounts in thousands)
Debt Instrument Rate Type Rate Balance
2016 Unsecured Notes Fixed 5.59% (1) $ 125,000
Northland – Mortgage Capital Term Loan Fixed 6.20% 13,400
2018 Credit
Facility Revolver Variable 1.65%–1.83% (2) 1,100,000
2019 Term Loan Variable 2.01%-2.08% 250,000
5.75% Notes Due 2020 (Euro) (3) Fixed 5.75% 217,240
6.875% Notes Due 2021 Fixed 6.88%
450,000
4.00% Notes Due 2022 (Euro) (3) Fixed 4.00% 543,100
6.375% Notes
Due 2022 Fixed 6.38% 350,000
5.5% Notes Due 2024 Fixed 5.50% 300,000
$
3,348,740
Debt Premium 2,168
Debt issuance costs (28,367)
Weighted average rate 4.04% $ 3,322,541
Rate Type as Percentage of Total Debt
Variable Fixed
40.3% 59.7%
Represents the weighted-average rate for four tranches of the Notes at December 31, 2015, factoring in interest rate swaps in effect at that time. The Company has entered into
two swap agreements which began in July and October 2011.
Effective July 31, 2011, the Company is paying 5.507% on $65 million of the Notes and effective
October 31, 2011, the Company is paying 5.675% on $60 million of Notes.
At December 31, 2015, this represents a $1.3 billion unsecured revolving credit
facility with spreads over LIBOR ranging from 0.95% to 1.75%.
Represents 700 million of bonds issued in Euros and converted to U.S. dollars at
December 31, 2015.
Q4 2015 | SUPPLEMENTAL INFORMATION 6
MEDICALPROPERTIESTRUST.COM
FINANCIAL INFORMATION
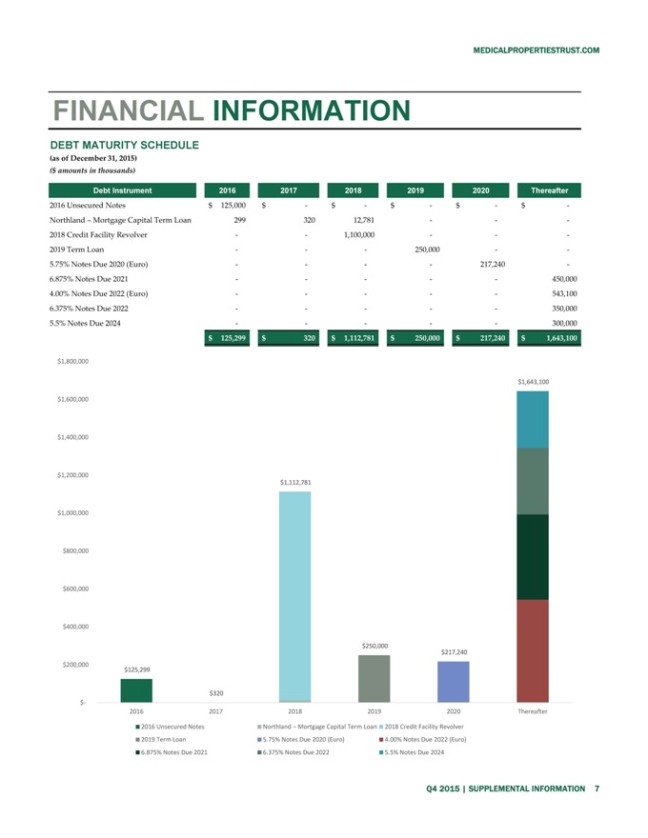
DEBT MATURITY SCHEDULE
(as of December 31, 2015)
($ amounts in thousands)
Debt Instrument 2016 2017 2018 2019 2020 Thereafter
2016 Unsecured Notes $ 125,000 $ — $
— $ — $ — $ -
Northland – Mortgage Capital Term Loan 299 320 12,781 — — -
2018 Credit Facility Revolver — — 1,100,000 — — -
2019 Term Loan —
— — 250,000 — -
5.75% Notes Due 2020 (Euro) — — — — 217,240 -
6.875% Notes Due 2021 — — — — — 450,000
4.00% Notes Due 2022 (Euro)
— — — — — 543,100
6.375% Notes Due 2022 — — — — — 350,000
5.5% Notes Due 2024 — — — — — 300,000
$ 125,299 $ 320 $ 1,112,781 $
250,000 $ 217,240 $ 1,643,100
$1,800,000
$1,643,100
$1,600,000
$1,400,000
$1,200,000
$1,112,781
$1,000,000
$800,000
$600,000
$400,000
$250,000
$217,240
$200,000
$125,299
$320
$-
2016 2017 2018 2019 2020 Thereafter
2016 Unsecured Notes Northland –
Mortgage Capital Term Loan 2018 Credit Facility Revolver
2019 Term Loan 5.75% Notes Due 2020 (Euro) 4.00% Notes Due 2022 (Euro)
6.875% Notes Due 2021 6.375% Notes Due 2022 5.5% Notes Due 2024
Q4 2015 | SUPPLEMENTAL
INFORMATION 7
MEDICALPROPERTIESTRUST.COM
PORTFOLIO INFORMATION
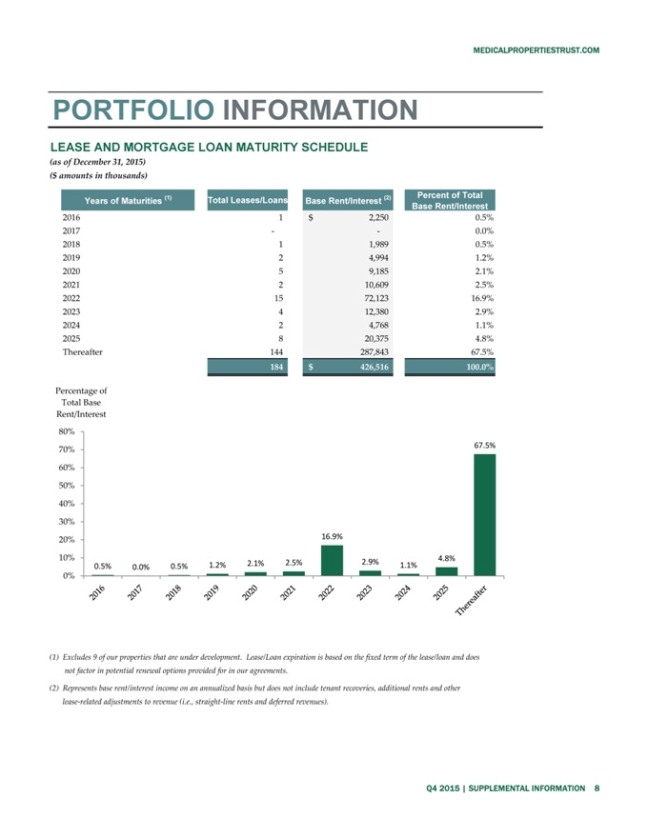
LEASE AND MORTGAGE LOAN MATURITY SCHEDULE
(as of December 31, 2015)
($ amounts in thousands)
(1) Percent of Total
Years of Maturities Total Leases/Loans Base Rent/Interest (2) Base
Rent/Interest
2016 1 $ 2,250 0.5%
2017 — — 0.0%
2018 1 1,989 0.5%
2019 2 4,994 1.2%
2020 5 9,185 2.1%
2021 2 10,609 2.5%
2022 15 72,123 16.9%
2023 4 12,380 2.9%
2024 2 4,768 1.1%
2025 8 20,375 4.8%
Thereafter 144 287,843 67.5%
184 ## $ 426,516 100.0%
Percentage of
Total Base
Rent/Interest
80%
70% 67.5%
60%
50%
40%
30%
20% 16.9%
10% 4.8%
0.5% 0.0% 0.5% 1.2% 2.1% 2.5% 2.9% 1.1%
0%
(1) Excludes 9 of our properties that are under development. Lease/Loan expiration is based
on the fixed term of the lease/loan and does
not factor in potential renewal options provided for in our agreements.
(2) Represents base rent/interest income on an annualized basis but does not include tenant recoveries, additional rents and other
lease-related adjustments to revenue (i.e., straight-line rents and deferred revenues).
Q4
2015 | SUPPLEMENTAL INFORMATION 8
MEDICALPROPERTIESTRUST.COM
PORTFOLIO INFORMATION
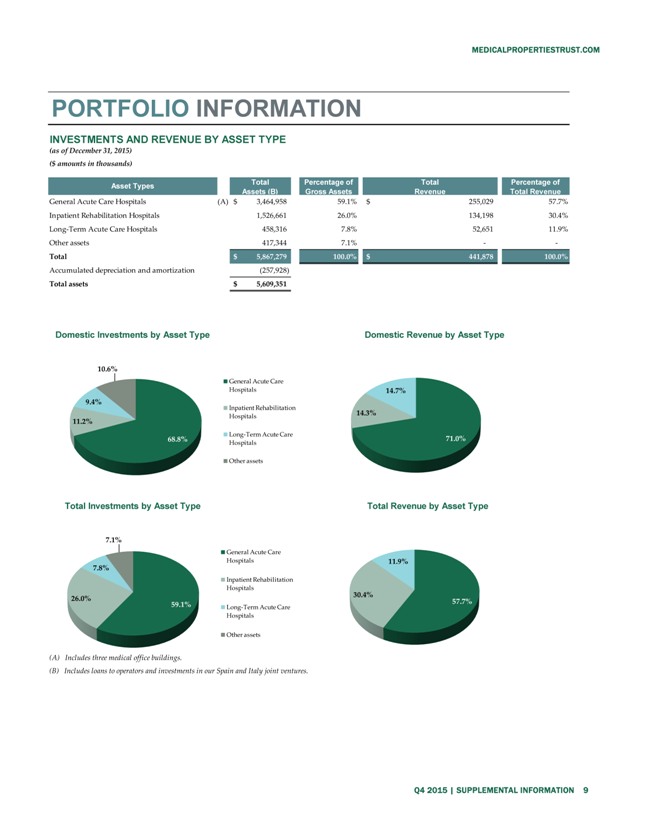
INVESTMENTS AND REVENUE BY ASSET TYPE
(as of December 31, 2015)
($ amounts in thousands)
Asset Types Total Percentage of Total Percentage of
Assets (B) Gross Assets Revenue Total
Revenue
General Acute Care Hospitals (A) $ 3,464,958 59.1% $ 255,029 57.7%
Inpatient Rehabilitation Hospitals 1,526,661 26.0% 134,198 30.4%
Long-Term
Acute Care Hospitals 458,316 7.8% 52,651 11.9%
Other assets 417,344 7.1% — -
Total $ 5,867,279 100.0% $ 441,878 100.0%
Accumulated depreciation and amortization
(257,928)
Total assets $ 5,609,351
Domestic Investments by Asset Type Domestic
Revenue by Asset Type
0.0%
10.6%
General Acute Care
Hospitals 14.7%
9.4%
Inpatient Rehabilitation
Hospitals 14.3%
11.2%
Long-Term Acute Care
68.8% 71.0%
Hospitals
Other assets
Total Investments by Asset Type Total Revenue by Asset Type
0.0%
7.1%
General Acute Care
Hospitals 11.9%
7.8%
Inpatient Rehabilitation
Hospitals
30.4%
26.0% 57.7%
59.1% Long-Term Acute Care
Hospitals
Other assets
(A) Inlcudes three medical office buildings
(B) Includes loans to operators and investments in our Spain and Italy joint ventures.
Q4 2015
| SUPPLEMENTAL INFORMATION 9
MEDICALPROPERTIESTRUST.COM
PORTFOLIO INFORMATION
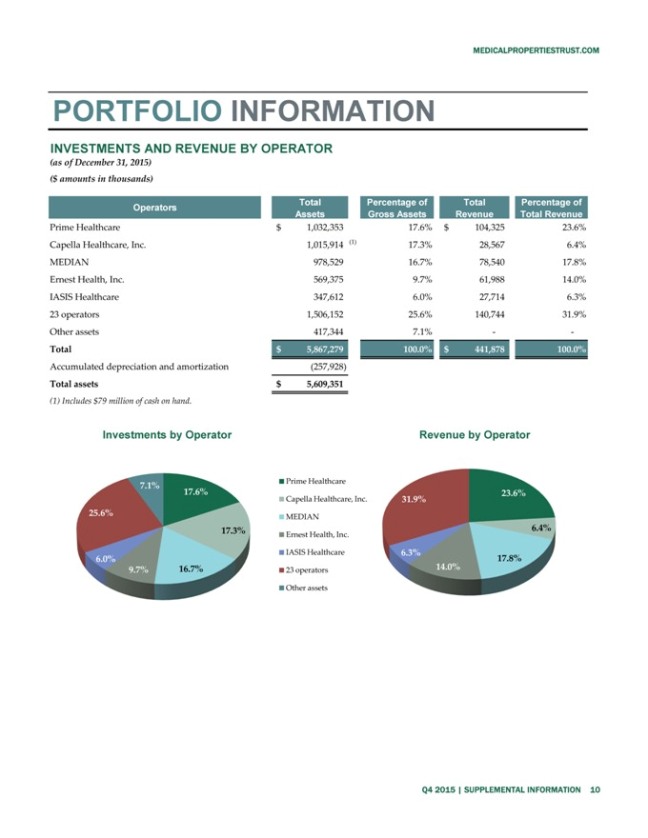
INVESTMENTS AND REVENUE BY OPERATOR
(as of December 31, 2015)
($ amounts in thousands)
Operators Total Percentage of Total Percentage of
Assets Gross Assets Revenue Total Revenue
Prime Healthcare $ 1,032,353 17.6% $ 104,325 23.6%
Capella Healthcare, Inc.
1,015,914 (1) 17.3% 28,567 6.4%
MEDIAN 978,529 16.7% 78,540 17.8%
Ernest
Health, Inc. 569,375 9.7% 61,988 14.0%
IASIS Healthcare 347,612 6.0% 27,714 6.3%
23 operators 1,506,152 25.6% 140,744 31.9%
Other assets 417,344 7.1% — -
Total $ 5,867,279 100.0% $ 441,878 100.0%
Accumulated depreciation and amortization
(257,928)
Total assets $ 5,609,351
(1) Includes $79 million of cash on hand.
Investments by Operator Revenue by Operator
Prime Healthcare
7.1%
17.6% 23.6%
Capella Healthcare, Inc. 31.9%
25.6%
MEDIAN
17.3% 6.4%
Ernest Health, Inc.
6.0% IASIS Healthcare 6.3% 17.8%
9.7% 16.7% 23 operators 14.0%
Other assets
Q4 2015 | SUPPLEMENTAL INFORMATION 10
MEDICALPROPERTIESTRUST.COM
PORTFOLIO INFORMATION
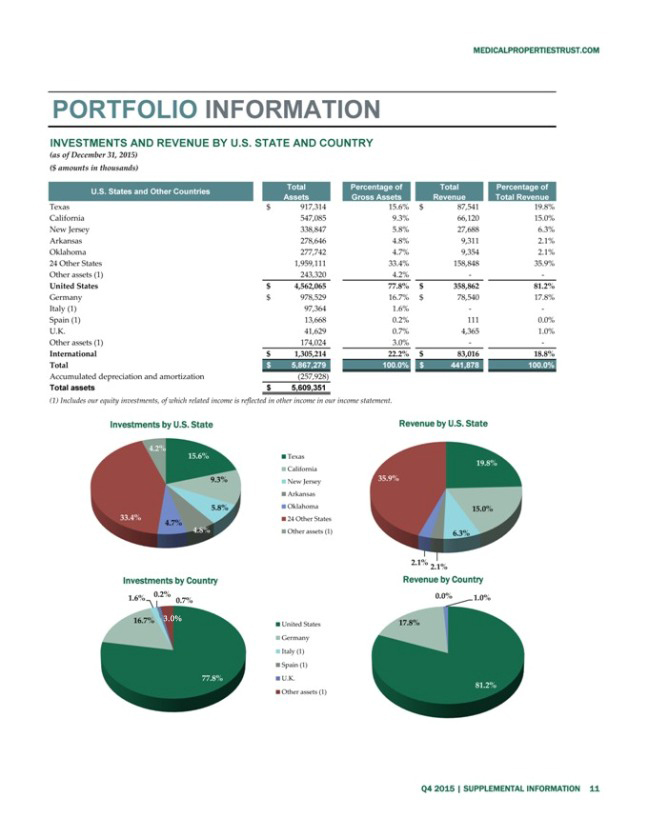
INVESTMENTS AND REVENUE BY U.S. STATE AND COUNTRY
(as of December 31, 2015)
($ amounts in thousands)
U.S. States and Other Countries Total Percentage of Total Percentage of
Assets Gross Assets
Revenue Total Revenue
Texas $ 917,314 15.6% $ 87,541 19.8%
California 547,085
9.3% 66,120 15.0%
New Jersey 338,847 5.8% 27,688 6.3%
Arkansas 278,646 4.8%
9,311 2.1%
Oklahoma 277,742 4.7% 9,354 2.1%
24 Other States 1,959,111 33.4%
158,848 35.9%
Other assets (1) 243,320 4.2% — -
United States $
4,562,065 77.8% $ 358,862 81.2%
Germany $ 978,529 16.7% $ 78,540 17.8%
Italy
(1) 97,364 1.6% — -
Spain (1) 13,668 0.2% 111 0.0%
U.K. 41,629
0.7% 4,365 1.0%
Other assets (1) 174,024 3.0% — -
International $
1,305,214 22.2% $ 83,016 18.8%
Total $ 5,867,279 100.0% $ 441,878 100.0%
Accumulated depreciation and amortization (257,928)
Total assets $ 5,609,351
(1) Includes our equity investments, of which related income is reflected in other income in our income statement.
Investments by U.S. State Revenue by U.S. State
4.2%
15.6% Texas
19.8%
California
9.3% 35.9%
New Jersey
Arkansas
5.8% Oklahoma 15.0%
33.4% 24 Other States
4.7%
4.8% Other assets (1)
6.3%
2.1%
2.1%
Investments by Country Revenue by Country
0.2% 0.0%
1.6% 0.7% 1.0%
3.0%
16.7% 17.8%
United States
Germany
Italy (1)
Spain (1)
77.8% U.K.
81.2%
Other assets (1)
Q4 2015 | SUPPLEMENTAL INFORMATION 11
0 1 2 3 4 5 6 YOY Same
0x 0x 0x 0x 0x 0x 0x and
4.5x Store
4.5x Sequential
4.5x EBITDAR
4.5x Quarter (1)
1.8x Rent PORTFOLIO
1.9x Comparisons
1.9x by Coverage
1.9x
2.4x Property
2.9x Type
2.8x
2.9x
3.7x INFORMATION
3.7x
3.7x
3.7x
MEDICALPROPERTIESTRUST
.
COM
General Acute Care Long-Term Acute Care Inpatient Rehabilitation Total Portfolio
Hospitals Hospitals Facilities
Q3 2014 (YoY) Q3 2015 (YoY) Q2 2015 (QoQ) Q3 2015 (QoQ)
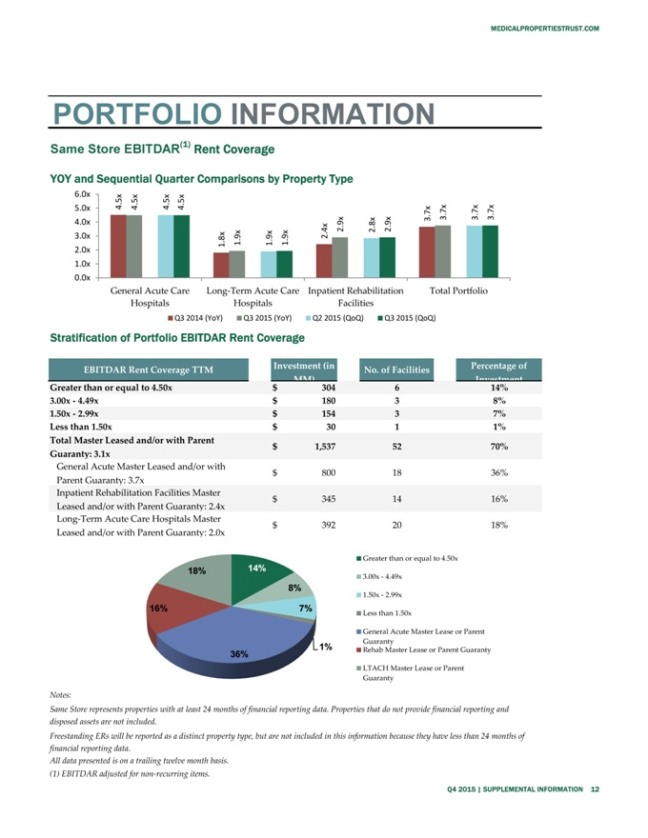
Stratification of Portfolio EBITDAR Rent Coverage
Investment (in Percentage
of
EBITDAR Rent Coverage TTM No. of Facilities
MM) Investment
Greater than or equal to 4.50x $ 304 6 14%
3.00x—4.49x $ 180 3 8%
1.50x—2.99x $ 154 3 7%
Less than 1.50x $ 30 1 1%
Total Master Leased and/or with Parent
$ 1,537 52 70%
Guaranty: 3.1x
General Acute Master Leased and/or with
$ 800 18 36%
Parent Guaranty: 3.7x
Inpatient Rehabilitation Facilities Master
$ 345 14 16%
Leased and/or with Parent Guaranty: 2.4x
Long-Term Acute Care Hospitals Master
$ 392 20 18%
Leased and/or with Parent Guaranty: 2.0x
Greater than or equal to 4.50x
18% 14%
3.00x—4.49x
8%
1.50x—2.99x
16% 7%
Less than 1.50x
General Acute Master Lease or Parent
Guaranty
1% Rehab Master Lease or Parent Guaranty
36%
LTACH Master Lease or Parent
Guaranty
Notes:
Same Store represents properties with at least 24 months of financial reporting data. Properties that do not provide financial reporting and disposed assets are not included.
Freestanding ERs will be reported as a distinct property type, but are not included in this information because they have less than 24 months of financial
reporting data.
All data presented is on a trailing twelve month basis. (1) EBITDAR adjusted for non-recurring items.
Q4 2015 | SUPPLEMENTAL INFORMATION 12
MEDICALPROPERTIESTRUST.COM
PORTFOLIO INFORMATION
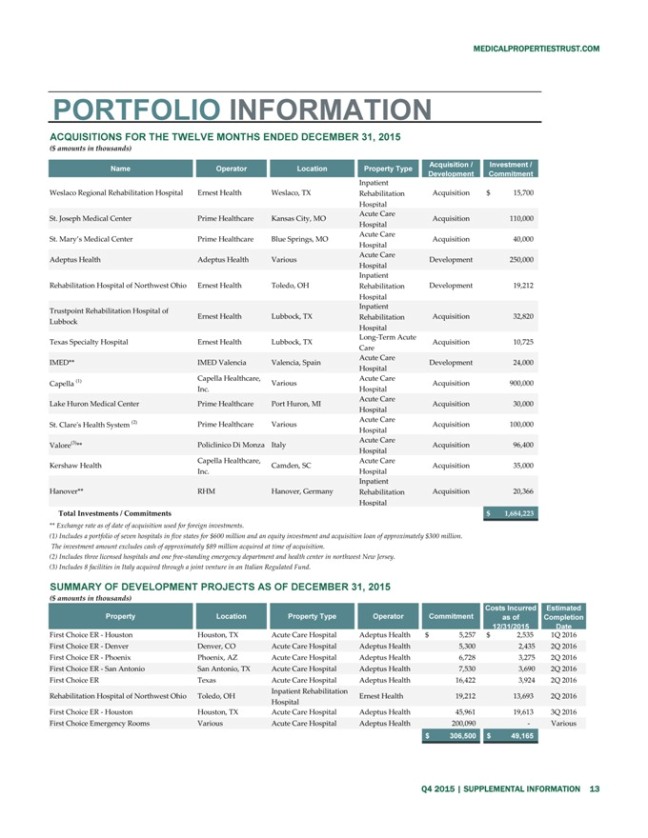
ACQUISITIONS FOR THE TWELVE MONTHS ENDED DECEMBER 31, 2015
($ amounts in thousands)
Name Operator Location Property Type Acquisition / Investment /
Development Commitment
Inpatient
Weslaco Regional Rehabilitation Hospital Ernest Health Weslaco, TX Rehabilitation Acquisition $ 15,700
Hospital
Acute Care
St. Joseph Medical Center Prime Healthcare Kansas City, MO Acquisition 110,000
Hospital
Acute Care
St. Mary’s Medical Center Prime Healthcare Blue Springs, MO
Acquisition 40,000
Hospital
Acute Care
Adeptus Health Adeptus Health Various Development 250,000
Hospital
Inpatient
Rehabilitation Hospital of Northwest Ohio Ernest Health Toledo, OH Rehabilitation
Development 19,212
Hospital
Inpatient
Trustpoint Rehabilitation Hospital of
Ernest Health Lubbock, TX Rehabilitation Acquisition
32,820
Lubbock
Hospital
Long-Term Acute
Texas Specialty Hospital Ernest Health Lubbock, TX Acquisition 10,725
Care
Acute Care
IMED** IMED Valencia Valencia, Spain Development 24,000
Hospital
(1) Capella Healthcare, Acute Care
Capella Various Acquisition 900,000
Inc. Hospital
Acute Care
Lake Huron Medical Center Prime Healthcare Port Huron, MI Acquisition 30,000
Hospital
(2) Acute Care
St. Clare’s Health System Prime Healthcare Various
Acquisition 100,000
Hospital
(3) Acute Care
Valore ** Policlinico Di Monza Italy Acquisition 96,400
Hospital
Capella Healthcare, Acute Care
Kershaw Health Camden, SC Acquisition 35,000
Inc. Hospital
Inpatient
Hanover** RHM Hanover, Germany Rehabilitation Acquisition 20,366
Hospital
Total Investments / Commitments $ 1,684,223
** Exchange rate as of date of acquisition used
for foreign investments.
(1) Includes a portfolio of seven hospitals in five states for $600 million and an equity investment and acquisition loan of approximately
$300 million. The investment amount excludes cash of approximately $89 million acquired at time of acquisition.
Includes three licensed hospitals and one
free-standing emergency department and health center in northwest New Jersey.
Includes 8 facilities in Italy acquired through a joint venture in an Italian
Regulated Fund.
SUMMARY OF DEVELOPMENT PROJECTS AS OF DECEMBER 31, 2015
($
amounts in thousands)
Costs Incurred Estimated
Property Location Property
Type Operator Commitment as of Completion
12/31/2015 Date
First Choice
ER—Houston Houston, TX Acute Care Hospital Adeptus Health $ 5,257 $ 2,535 1Q 2016
First Choice ER—Denver Denver, CO Acute Care Hospital Adeptus Health
5,300 2,435 2Q 2016
First Choice ER—Phoenix Phoenix, AZ Acute Care Hospital Adeptus Health 6,728 3,275 2Q 2016
First Choice ER—San Antonio San Antonio, TX Acute Care Hospital Adeptus Health 7,530 3,690 2Q 2016
First Choice ER Texas Acute Care Hospital Adeptus Health 16,422 3,924 2Q 2016
Inpatient
Rehabilitation
Rehabilitation Hospital of Northwest Ohio Toledo, OH Ernest Health 19,212 13,693 2Q 2016
Hospital
First Choice ER—Houston Houston, TX Acute Care Hospital Adeptus Health 45,961
19,613 3Q 2016
First Choice Emergency Rooms Various Acute Care Hospital Adeptus Health 200,090 — Various
$ 306,500 $ 49,165
Q4 2015 | SUPPLEMENTAL INFORMATION 13
MEDICALPROPERTIESTRUST.COM
FINANCIAL STATEMENTS
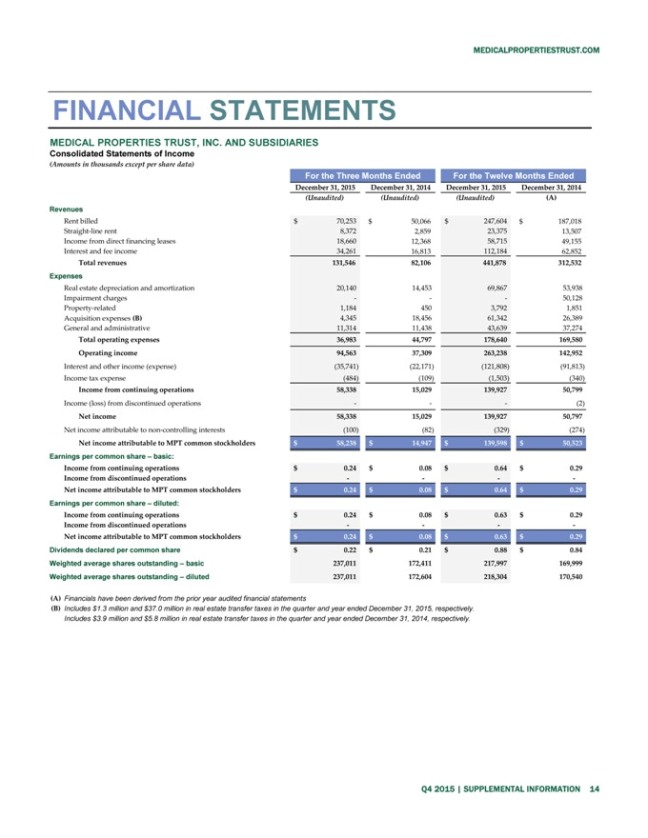
MEDICAL PROPERTIES TRUST, INC. AND SUBSIDIARIES
Consolidated Statements of Income
(Amounts in thousands except per share data)
For the Three Months Ended For the Twelve Months
Ended
December 31, 2015 December 31, 2014 December 31, 2015 December 31, 2014
(Unaudited) (Unaudited) (Unaudited) (A)
Revenues
Rent billed $ 70,253 $ 50,066 $ 247,604 $ 187,018
Straight-line rent 8,372 2,859 23,375 13,507
Income from direct financing leases 18,660 12,368 58,715 49,155
Interest and
fee income 34,261 16,813 112,184 62,852
Total revenues 131,546 82,106 441,878 312,532
Expenses
Real estate depreciation and amortization 20,140 14,453 69,867 53,938
Impairment charges — — — 50,128
Property-related 1,184 450 3,792 1,851
Acquisition expenses (B) 4,345 18,456 61,342 26,389
General and
administrative 11,314 11,438 43,639 37,274
Total operating expenses 36,983 44,797 178,640 169,580
Operating income 94,563 37,309 263,238 142,952
Interest and other income (expense)
(35,741) (22,171) (121,808) (91,813)
Income tax expense (484) (109) (1,503) (340)
Income from continuing operations 58,338 15,029 139,927 50,799
Income (loss) from discontinued
operations — — — (2)
Net income 58,338 15,029 139,927 50,797
Net income attributable to non-controlling interests (100) (82) (329) (274)
Net income attributable to MPT common stockholders $ 58,238 $ 14,947 $ 139,598 $ 50,523
Earnings per common share – basic:
Income from continuing operations $
0.24 $ 0.08 $ 0.64 $ 0.29
Income from discontinued operations — — — -
Net income attributable to MPT common stockholders $ 0.24 $ 0.08 $ 0.64 $ 0.29
Earnings per
common share – diluted:
Income from continuing operations $ 0.24 $ 0.08 $ 0.63 $ 0.29
Income from discontinued operations — — — -
Net income attributable to MPT
common stockholders $ 0.24 $ 0.08 $ 0.63 $ 0.29
Dividends declared per common share $ 0.22 $ 0.21 $ 0.88 $ 0.84
Weighted average shares outstanding – basic 237,011 172,411 217,997 169,999
Weighted
average shares outstanding – diluted 237,011 172,604 218,304 170,540
Financials have been derived from the prior year audited financial statements
Includes $1.3 million and $37.0 million in real estate transfer taxes in the quarter and year ended December 31, 2015, respectively. Includes $3.9 million and $5.8 million in
real estate transfer taxes in the quarter and year ended December 31, 2014, respectively.
Q4 2015 | SUPPLEMENTAL INFORMATION 14
MEDICALPROPERTIESTRUST.COM
FINANCIAL STATEMENTS
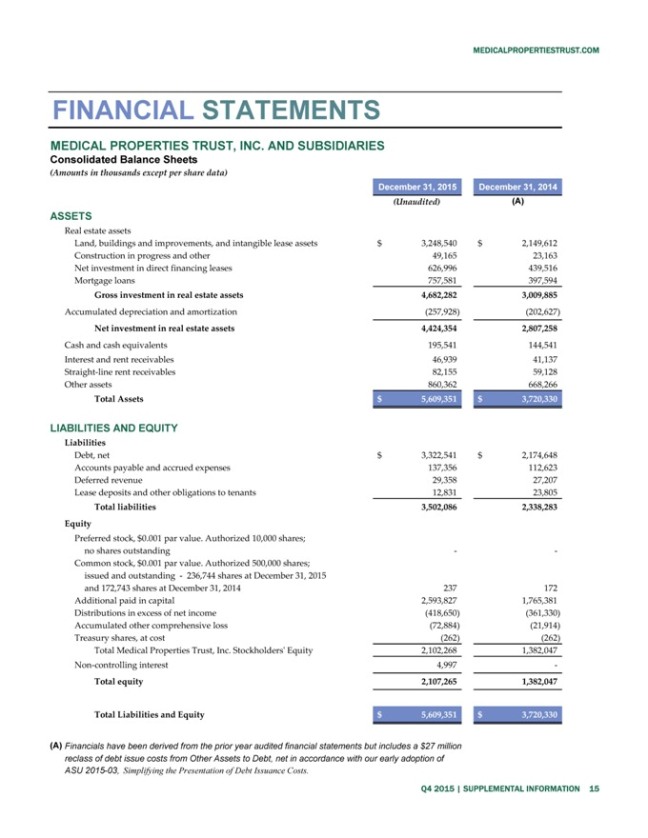
MEDICAL PROPERTIES TRUST, INC. AND SUBSIDIARIES
Consolidated Balance Sheets
(Amounts in thousands except per share data)
December 31, 2015 December 31, 2014
(Unaudited) (A)
ASSETS
Real estate assets
Land, buildings and improvements, and intangible lease assets $ 3,248,540 $ 2,149,612
Construction in progress and other 49,165 23,163
Net investment in direct
financing leases 626,996 439,516
Mortgage loans 757,581 397,594
Gross
investment in real estate assets 4,682,282 3,009,885
Accumulated depreciation and amortization (257,928) (202,627)
Net investment in real estate assets 4,424,354 2,807,258
Cash and cash equivalents 195,541
144,541
Interest and rent receivables 46,939 41,137
Straight-line rent
receivables 82,155 59,128
Other assets 860,362 668,266
Total Assets $
5,609,351 $ 3,720,330
LIABILITIES AND EQUITY
Liabilities
Debt, net $ 3,322,541 $ 2,174,648
Accounts payable and accrued expenses 137,356 112,623
Deferred revenue 29,358 27,207
Lease deposits and other obligations to
tenants 12,831 23,805
Total liabilities 3,502,086 2,338,283
Equity
Preferred stock, $0.001 par value. Authorized 10,000 shares;
no shares
outstanding — -
Common stock, $0.001 par value. Authorized 500,000 shares;
issued and outstanding—236,744 shares at December 31, 2015
and
172,743 shares at December 31, 2014 237 172
Additional paid in capital 2,593,827 1,765,381
Distributions in excess of net income (418,650) (361,330)
Accumulated other comprehensive
loss (72,884) (21,914)
Treasury shares, at cost (262) (262)
Total
Medical Properties Trust, Inc. Stockholders’ Equity 2,102,268 1,382,047
Non-controlling interest 4,997 -
Total equity 2,107,265 1,382,047
Total Liabilities and Equity $ 5,609,351 $ 3,720,330
Financials have been derived from the prior year audited financial statements but includes a $27 million reclass of debt issue costs from Other Assets to Debt, net
in accordance with our early adoption of ASU 2015-03, Simplifying the Presentation of Debt Issuance Costs.
Q4 2015 | SUPPLEMENTAL INFORMATION 15
MEDICALPROPERTIESTRUST.COM
FINANCIAL STATEMENTS
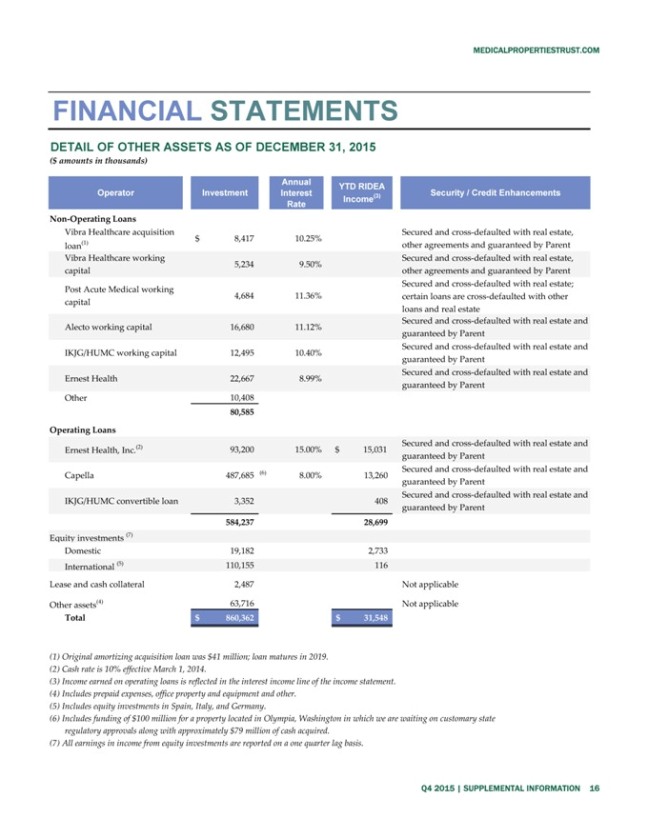
DETAIL OF OTHER ASSETS AS OF DECEMBER 31, 2015
($ amounts in thousands)
Annual YTD RIDEA
Operator Investment Interest
Rate Income(3)
Non-Operating Loans
Vibra Healthcare acquisition
$ 8,417 10.25%
loan(1)
Vibra Healthcare working
5,234 9.50%
capital
Post Acute Medical working
4,684 11.36%
capital
Alecto working capital 16,680 11.12%
IKJG/HUMC working capital 12,495 10.40%
Ernest Health 22,667 8.99%
Other 10,408
80,585
Operating Loans
Ernest Health, Inc.(2) 93,200 15.00% $ 15,031
Capella 487,685 (6) 8.00% 13,260
IKJG/HUMC convertible loan 3,352 408
584,237 28,699
Equity investments (7)
Domestic 19,182 2,733
International (5) 110,155 116
Lease and cash collateral 2,487
Other assets(4) 63,716
Total $ 860,362 $ 31,548
Security / Credit Enhancements
Secured and cross-defaulted with real estate, other agreements
and guaranteed by Parent Secured and cross-defaulted with real estate, other agreements and guaranteed by Parent Secured and cross-defaulted with real estate; certain loans are cross-defaulted with other loans and real estate Secured and
cross-defaulted with real estate and guaranteed by Parent Secured and cross-defaulted with real estate and guaranteed by Parent Secured and cross-defaulted with real estate and guaranteed by Parent
Secured and cross-defaulted with real estate and guaranteed by Parent Secured and cross-defaulted with real estate and guaranteed by Parent Secured and cross-defaulted with real
estate and guaranteed by Parent
Not applicable
Not applicable
(1) Original amortizing acquisition loan was $41 million; loan matures in 2019. (2) Cash rate is 10% effective March 1, 2014.
(3) Income earned on operating loans is reflected in the interest income line of the income statement. (4) Includes prepaid expenses, office property and equipment and other.
(5) Includes equity investments in Spain, Italy, and Germany.
(6) Includes
funding of $100 million for a property located in Olympia, Washington in which we are waiting on customary state regulatory approvals along with approximately $79 million of cash acquired.
(7) All earnings in income from equity investments are reported on a one quarter lag basis.
Q4
2015 | SUPPLEMENTAL INFORMATION 16

1000 Urban Center Drive, Suite 501 Birmingham, AL 35242 (205)
969-3755 NYSE: MPW www.medicalpropertiestrust.com
Contact:
Charles Lambert,
Managing Director - Capital Markets
(205) 397-8897 or clambert@medicalpropertiestrust.com or Tim Berryman, Director - Investor Relations
(205) 397-8589 or tberryman@medicalpropertiestrust.com
At the Very heArt of heAlthcAre.