Attached files
| file | filename |
|---|---|
| 8-K - LM 8-K CREDIT SUISSE PRESENTATION - LEGG MASON, INC. | lm_8kxcreditsuissepresenta.htm |

For internal use only. Not for distribution to the public. For internal use only. Not for distribution to the public. Credit Suisse Financial Services Forum Brandywine Global | ClearBridge Investments | Martin Currie | Permal | QS Investors | RARE Infrastructure | Royce & Associates | Western Asset February 2016 Pete Nachtwey Chief Financial Officer

Page 1 Important Disclosures Forward-Looking Statements This presentation may contain forward-looking statements within the meaning of the Private Securities Litigation Reform Act of 1995. These forward-looking statements are not statements of facts or guarantees of future performance, and are subject to risks, uncertainties and other factors that may cause actual results to differ materially from those discussed in the statements. For a discussion of these risks and uncertainties, please see “Risk Factors” and “Management’s Discussion and Analysis of Financial Condition and Results of Operations” in the Company’s Annual Report on Form 10-K for the fiscal year ended March 31, 2015 and in the Company’s quarterly reports on Form 10-Q. Non-GAAP Financial Measures This presentation includes certain non-GAAP financial measures. These non-GAAP measures are in addition to, not a substitute for or superior to, measures of financial performance determined in accordance with GAAP. The company undertakes no obligation to update the information contained in this presentation to reflect subsequently occurring events or circumstances.
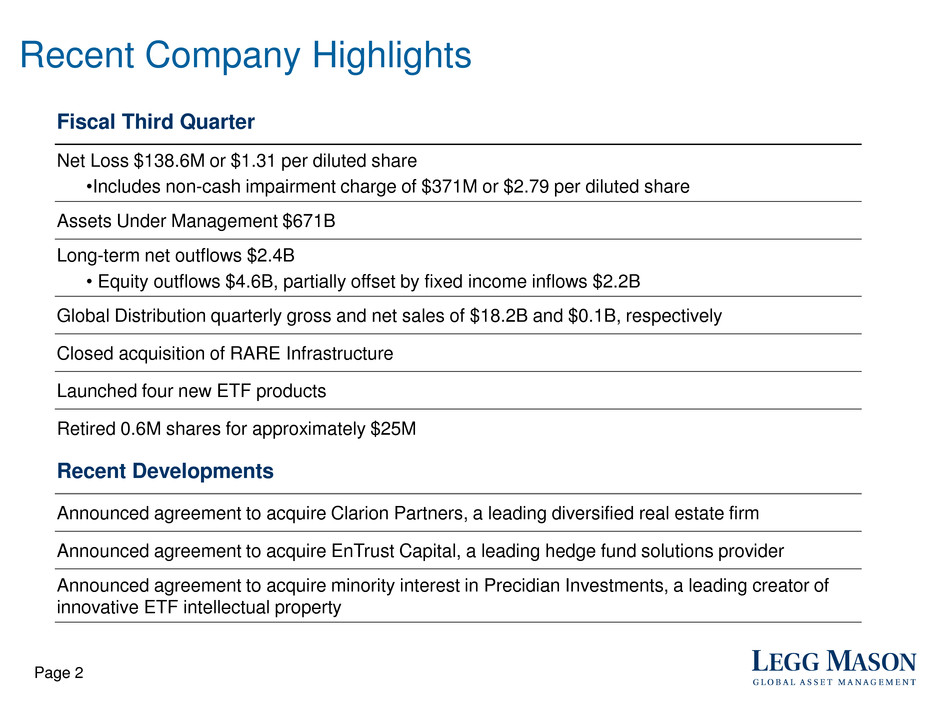
Page 2 Recent Company Highlights Fiscal Third Quarter Net Loss $138.6M or $1.31 per diluted share •Includes non-cash impairment charge of $371M or $2.79 per diluted share Assets Under Management $671B Long-term net outflows $2.4B • Equity outflows $4.6B, partially offset by fixed income inflows $2.2B Global Distribution quarterly gross and net sales of $18.2B and $0.1B, respectively Closed acquisition of RARE Infrastructure Launched four new ETF products Retired 0.6M shares for approximately $25M Recent Developments Announced agreement to acquire Clarion Partners, a leading diversified real estate firm Announced agreement to acquire EnTrust Capital, a leading hedge fund solutions provider Announced agreement to acquire minority interest in Precidian Investments, a leading creator of innovative ETF intellectual property
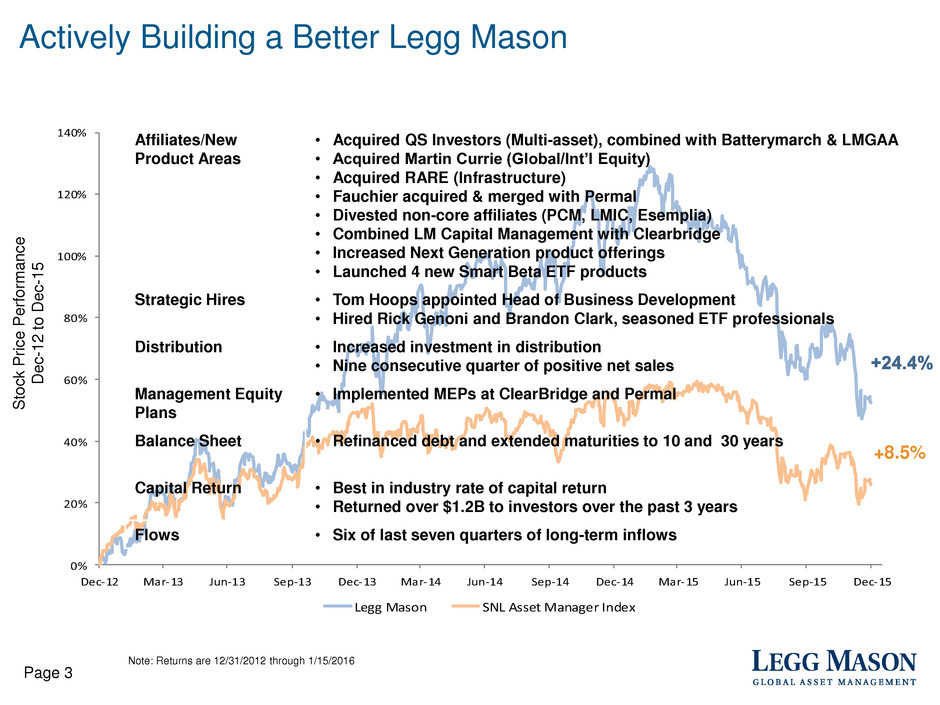
0% 20% 40% 60% 80% 100% 120% 140% Dec-12 Mar-13 Jun-13 Sep-13 Dec-13 Mar-14 Jun-14 Sep-14 Dec-14 Mar-15 Jun-15 Sep-15 Dec-15 Legg Mason SNL Asset Manager Index Affiliates/New Product Areas • Acquired QS Investors (Multi-asset), combined with Batterymarch & LMGAA • Acquired Martin Currie (Global/Int’l Equity) • Acquired RARE (Infrastructure) • Fauchier acquired & merged with Permal • Divested non-core affiliates (PCM, LMIC, Esemplia) • Combined LM Capital Management with Clearbridge • Increased Next Generation product offerings • Launched 4 new Smart Beta ETF products Strategic Hires • Tom Hoops appointed Head of Business Development • Hired Rick Genoni and Brandon Clark, seasoned ETF professionals Distribution • Increased investment in distribution • Nine consecutive quarter of positive net sales Management Equity Plans • Implemented MEPs at ClearBridge and Permal Balance Sheet • Refinanced debt and extended maturities to 10 and 30 years Capital Return • Best in industry rate of capital return • Returned over $1.2B to investors over the past 3 years Flows • Six of last seven quarters of long-term inflows +8.5% Actively Building a Better Legg Mason Page 3 S to ck P ri c e P e rf o rm a n c e D e c -1 2 t o D e c -1 5 Note: Returns are 12/31/2012 through 1/15/2016
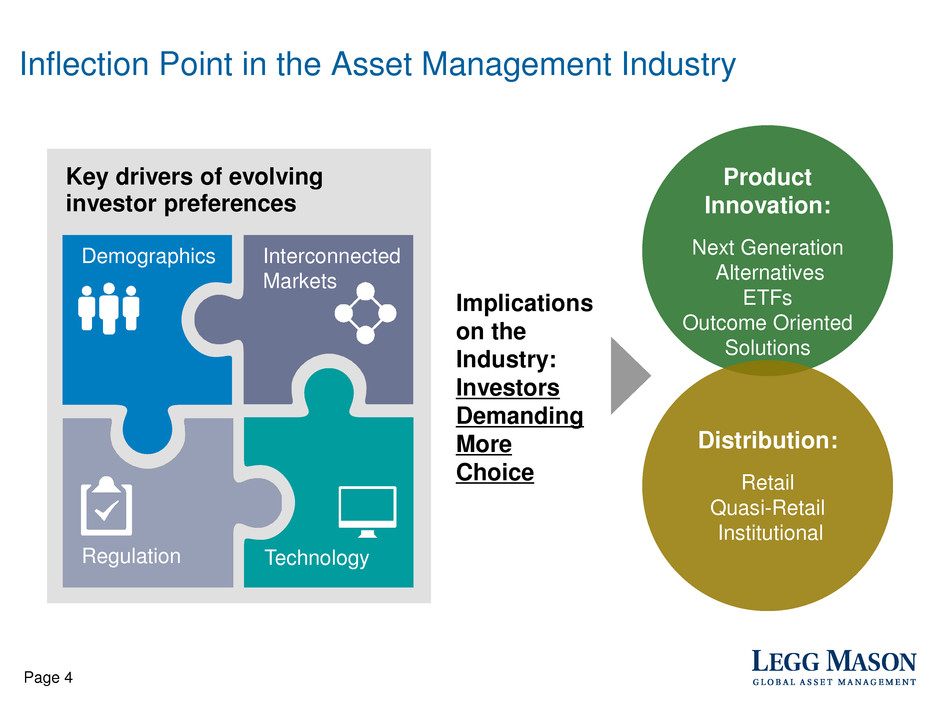
Key drivers of evolving investor preferences Inflection Point in the Asset Management Industry Page 4 Demographics Interconnected Markets Regulation Technology Implications on the Industry: Investors Demanding More Choice Product Innovation: Next Generation Alternatives ETFs Outcome Oriented Solutions Distribution: Retail Quasi-Retail Institutional

Changing Investor Demand Driving Investment Strategy Migration Page 5 Note: Excludes China Source: Casey Quirk Report: The Roar of the Crowd: How Individual Investors Transform Competition in Asset Management. November 2015 Cap-Weighted Passive, 0.8 Smart Beta, 0.3 Traditional Equity, -2.4 Traditional Fixed Income, 0.6 Trading Strategies, 0.3 Real Assets & Private Capital, 1.1 Multi-Asset Strategies, 1.3 Unconstrained Equity, 0.3 Next-Gen Fixed Income 0.9 ($3.0) ($2.0) ($1.0) $0.0 $1.0 $2.0 $3.0 $4.0 $5.0 Classic Active Next Generation Active Traditional Passive $3T projected net new flows across all segments Global Asset Management Industry Net New Flows by Strategy Type, 2016E-2020E (US$ Trillions)

Changing Demand for US Investment Vehicles Page 6 1 Reflects short-term and long-term mutual funds combined Source: Cerulli Associates 2015E US Investment Vehicles Marketshare 2015E- 2018E US Investment Vehicle Projected 3 Yr Annualized Growth • Since 2000, mutual fund asset market-share1 has declined as investors moved into ETFs where the share is approximately 11% vs. less than 1% in 2000. This trend is expected to accelerate in the next five years

Industry Marketshare by Distribution Channel Page 7 Source: Cerulli Associates Note: Retail Direct includes Direct, Robo Advisors, & Online 2014 Marketshare By Channel 2008-2019E Marketshare Gain/Loss • Marketshare in the wirehouse channel fell from 31% in 2008 to 27% in 2014 • Retail direct has benefited since 2008 as its marketshare has increased from 18% to 22% • RIA channel also has increased marketshare from 7% in 2008 to 9% in 2014
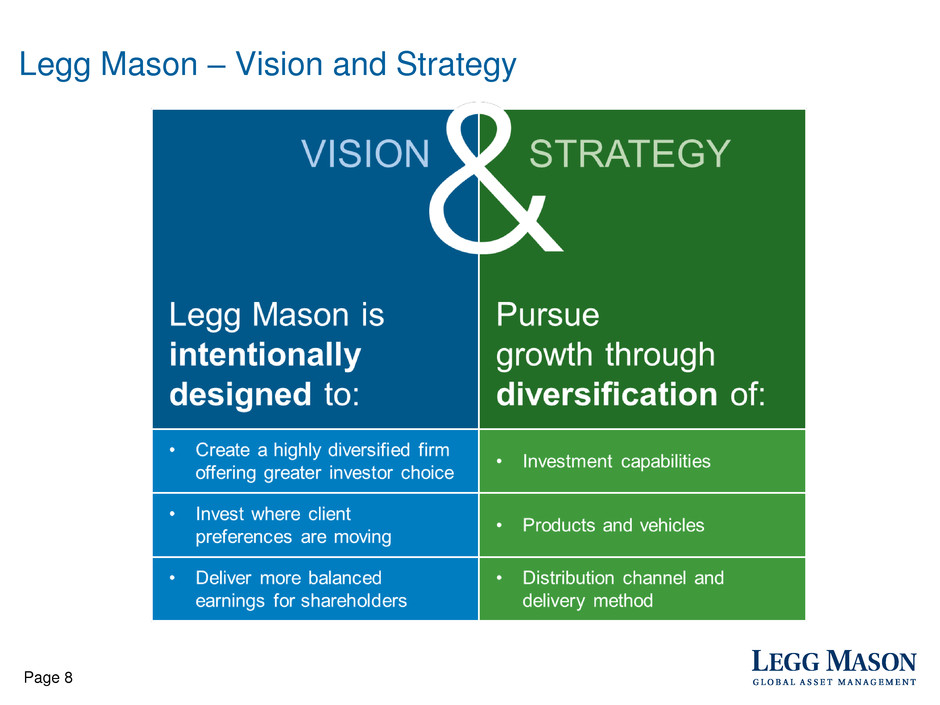
Legg Mason – Vision and Strategy Page 8

Legg Mason Investment Capabilities Worldwide Product Opportunities 2012 2016* Domestic Equity + + Domestic Fixed Income + + Global Fixed Income + + Emerging Market Debt + + Fund of Hedge Funds + + Global/International Equity +/‒ + Emerging Market Equity +/‒ + Liquid Alternatives +/‒ + Solutions/Multi-Asset Class +/‒ + Smart Beta ETFs ‒ + Active ETFs ‒ + Other Illiquid Alternatives +/‒ + Passive ‒ ‒ + LM Capability +/‒ LM Capability, but Sub-Scale ‒ No LM Capability Expansion of Legg Mason’s Investment Capabilities * Investment Capabilities for 2016 include recently announced acquisitions of Clarion Partners, EnTrust and Precidian Invesments Page 9

Steps Taken Transitioning to Building the Legg Mason of Tomorrow • Began by building a better Legg Mason positioned to win today • Transitioning to building the Legg Mason of tomorrow Page 10 Priorities identified in 2013 Multi-Asset Solutions • Add talent/capabilities • Few stand-alone platforms, focus on under levered subs International Equity • Prioritize actionable, high performing platforms Alternative Solutions Platform (Hedge Fund Solutions) • Opportunistic M&A Liquid Alternatives • Strategies include broad hedge fund universe (e.g. distressed debt, commodities/CTA) • Prioritize quality, sub-scale players Illiquid Alternatives • Strategies include private equity, real estate, infrastructure, natural resources/energy • Few quality options that offer both institutional and retail products Specialized ETFs • Focus on active ETFs and niche oriented firms • Few available scale players

Overview of Announced Transactions Total Assets $12B $40B ActiveShares awaiting SEC approval Location New York, NY New York, NY Bedminster, NJ Description • Leading Hedge Funds Solutions provider • Investment Capabilities across Core Funds, Strategic Partnerships and Special Opportunities • Leading Real Estate investment manager • Broad Real Estate investment capabilities across Core, Core-plus and Value-Add / Opportunistic themes • Innovative ETF product and market structure solutions • Relatively easy integration into existing broker dealer systems and capability to mask daily holdings from threat of reverse engineering Themes Addressed Alternative Solutions Platform (Hedge Fund Solutions) Illiquid Alternatives (Real Estate) Specialized ETFs Strategic Rationale • Leading Alternative Asset Management brand • Platform to grow multi-alternative capabilities • Consistent AUM growth through market cycles; approx. 18% CAGR since 2007 • Combined firm will be #3 in the industry • Well known historical brand • Fills gap in Real Estate capabilities • Demonstrated ability to grow: AUM up 50% since 2010 • High quality earnings attributes • New product potential in LM Global Distribution • Address ETF product gap • Proprietary technology and expertise in creation of innovative financial products • Specialization in ETF and mutual fund development, and associated trading and pricing techniques Page 11

Assets2 / AEFR $12B / 125bps $40B / 50bps Location New York, NY New York, NY Description • Leading Hedge Funds Solutions provider • Investment Capabilities across Core Funds, Strategic Partnerships and Special Opportunities • Leading Real Estate investment manager • Broad Real Estate investment capabilities across Core, Core-plus and Value-Add / Opportunistic themes Themes Addressed Alternative Solutions Platform (Hedge Fund Solutions) Illiquid Alternatives (Real Estate) Asset Trend2 Page 12 6.4 8.1 9.5 10.6 12.1 - 2.5 5.0 7.5 10.0 12.5 15.0 2011 2012 2013 2014 2015 24.3 27.9 30.0 33.1 40.0 - 10.0 20.0 30.0 40.0 50.0 2011 2012 2013 2014 2015 P&L Impacts From Announced Transactions Year 1 estimated EPS accretion $0.10 - $0.201 1Based on LM equity ownership of 65% and 83% in EnTrustPermal and Clarion, respectively. Net of taxes and minority interest. Assumes an average effective fee rate (ex Performance fees) of approximately 125bps and 50bps for EnTrust and Clarion, respectively. Reflects expected year one cost saves, offset by amortization of intangibles, cost of additional debt service and 35% minority interest in Permal. Excludes expected deal related charges noted on slide 14. 2Total EnTrust assets include AUM, assets under advisory and unfunded contractually committed assets. • Intangible amortization shared according to equity ownership • Intangible amortization estimated between $20M - $30M, subject to change based on final purchase price allocation • Tax shield increase of $0.9B, resulting in $0.4B tax benefit over time

Management Equity Plan1 - Increased Revenue Share to LM Shareholders Page 13 • A component of Royce’s existing share of revenues equitized into a minority interest, through the issuance of equity units, with an option for additional equitization over the next three years – The initial awards to key employees will total 7%-9% of revenues with 3%-5% held for issuance in future years • As part of the transaction, Legg Mason will receive a permanent increase of two net revenue percentage points, phased in over 12 months • Financial Impact – Increases LM revenue share and operating margin – Approximate non-cash charge of $35 – $50 million on initial issuance – Projected non-cash charges on additional issuances of approximately $15 – $30 million – No cash charge, now or in the future, for issuance of additional equity • Strategically we believe this form of management equity is more appropriate for where Royce’s business is today versus our “traditional” MEP 1. The proposed Management Equity Plan terms have been agreed in principle. Final documentation must be signed to implement the plan. The final implementation is expected to occur in F4Q16

F4Q16 & FY17 Expected Charges Related to Deal Activity Charges Related to: F4Q16 FY17 Royce MEP Non-cash charge $35M to $50M Clarion Investments Non-cash MEP Charge $10M to $15M EnTrust/Permal Combination Severance and related charges $30M to $35M $20M to $25M Non-cash real estate related $5M to $10M $30M to $35M LM Corporate Bankers’ fees and accounting/legal costs $5M to $10M $5M to $10M Page 14

M&A Financing Options Page 15 1 Bank Term loan assumes floating with 2 hikes per year 2 Year 1 Total Debt/Preferred includes an expected $50M of delevering If debt markets are closed, we have the financial flexibility to finance all announced transactions with our Bank Term Loan and cash Total Current Potential Interst/Div Rates Current Debt Financing Options Year 1 US Senior Debt 5 year 2.70% $250 US Senior Debt 10 year 3.95% $250 US Senior Debt 30 year 5.625% $550 AUD Debt 7 year 3.60% $200 $7 US Senior Debt 10 year 4.31% $500 $22 Preferred/Hybrid 6.50% $300 $20 Bank Term Loan/Revolver 1 Yr1 2.30% $40 $400 $9 Yr2 2.80% Total Interest / Pref Div Expense $58 Total Debt/Preferred $1,090 $1,400 $1,350 2
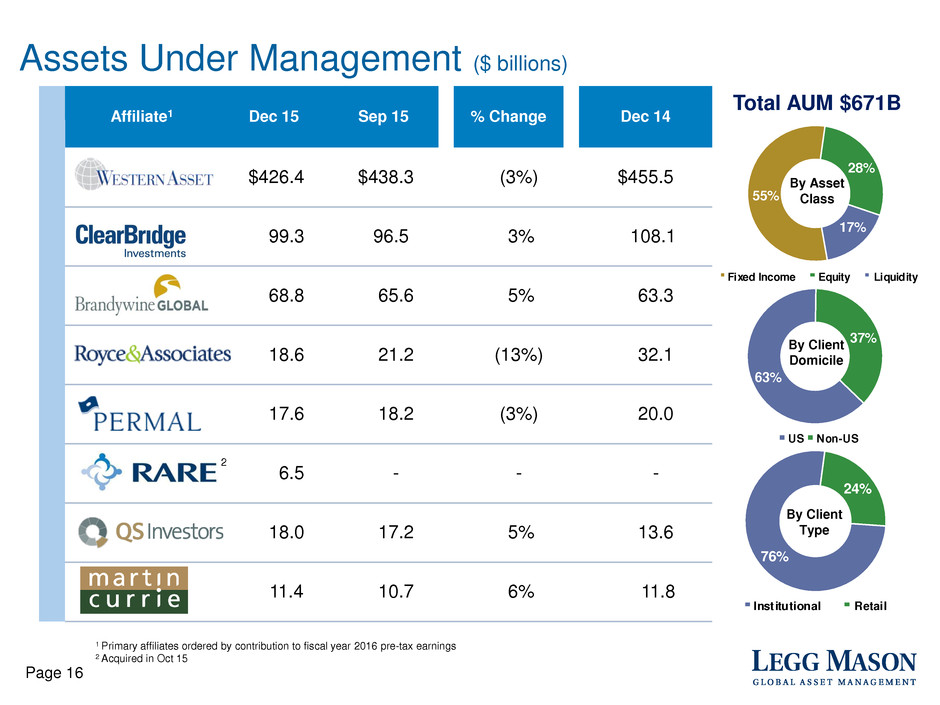
Assets Under Management ($ billions) Affiliate1 Dec 15 Sep 15 % Change Dec 14 $426.4 $438.3 (3%) $455.5 99.3 96.5 3% 108.1 68.8 65.6 5% 63.3 18.6 21.2 (13%) 32.1 17.6 18.2 (3%) 20.0 6.5 - - - 18.0 17.2 5% 13.6 11.4 10.7 6% 11.8 Page 16 1 Primary affiliates ordered by contribution to fiscal year 2016 pre-tax earnings 2 Acquired in Oct 15 55% 28% 17% Fixed Income Equity Liquidity Total AUM $671B 63% 37% US Non-US 76% 24% Inst itutional Retail By Asset Class By Client Type By Client Domicile 2

Page 17 Fiscal Third Quarter Affiliate Overview • $2.8B total inflows − $3.1B fixed income − ($0.3B) equity • $1.2B unfunded wins • $0.5B outflows • $0.4B unfunded wins • $2.0B outflows • $1.4B unfunded wins • $0.3B inflows • $2.8B outflows • $0.8B long-term outflows • $10.9B liquidity outflows • $3.5B unfunded wins • $0.1B total inflows • $0.1B unfunded wins • Breakeven flows

Page 18 Global Distribution 1 For LMGD, Assets Under Advisement are included in long-term assets, gross sales and net sales. Net sales equals gross sales less redemptions. As of December 31, 2015 long-term assets include $9.3B of AUA. Quarterly AUA gross and net sales for F3Q16 are $1.0B and $0.4B, respectively, for F2Q16 are $1.0B and $0.4B, respectively, and for F3Q15 are $1.2B and $0.7B, respectively Total Long-Term Assets1: $265B ($ Billions) F3Q16 F2Q16 F3Q15 Gross Sales1: US $10.9 $13.9 $17.9 Int’l 7.3 4.2 6.5 Total $18.2 $18.1 $24.4 Net Sales1: US $(3.1) $ 0.6 $ 6.5 Int’l 3.2 (0.1) 0.4 Total $ 0.1 $ 0.5 $ 6.9 • Gross sales of $18.2B – Up 1% from F2Q16 – Down 25% from F3Q15 • Net sales of $0.1B vs $0.5B in F2Q16 • Ninth consecutive quarter of positive net sales • Quarterly global redemption rate at 27% – US redemption rate 26% Distribution Highlights 17.2 15.4 16.3 19.6 24.2 22.1 19.0 18.1 18.2 1.7 1.5 2.1 5.0 6.9 5.3 1.1 0.5 0.1 0.0 5.0 10.0 15.0 20.0 25.0 30.0 Dec 13 Mar 14 Jun 14 Sep 14 Dec 14 Mar 15 Jun 15 Sep 15 Dec 15 Gros Sales Net Sales Quarterly Gross and Net Sales Trends ($B) Top Funds Driving Gross Sales FYTD16 Western Asset Core Plus Bond Fund ClearBridge Aggressive Growth Fund Western Asset Macro Opportunities Bond Fund Western Asset Core Bond Fund ClearBridge US Aggressive Growth Fund (Dublin) Brandywine Global Sovereign Credit Fund Brandywine Global Opportunities Bond Fund ClearBridge Dividend Strategy Fund Western Asset Managed unicipals Fund ClearBridge Appreciation Fund

80% 83% Page 19 Investment Performance % of Long-Term U.S. Fund Assets beating Lipper Category Average2 1 See appendix for details regarding strategy performance 2 Includes open-end, closed-end, and variable annuity funds. Source: Lipper Inc. Past performance is no guarantee of future results. The information shown above does not reflect the performance of any specific fund. Individual fund performance will differ. * As of December 31, 2015 % of Strategy AUM beating Benchmark1 63% 3 Year 3 Year 60% 80% 83% 88% 0% 20% 40% 60% 80% 100% 1 Year 3 Year 5 Year 10 Year 43% 63% 72% 60% 0% 20% 40% 60% 80% 100% 1 Year 3 Year 5 Year 10 Year 5 Year 72% 5 Year
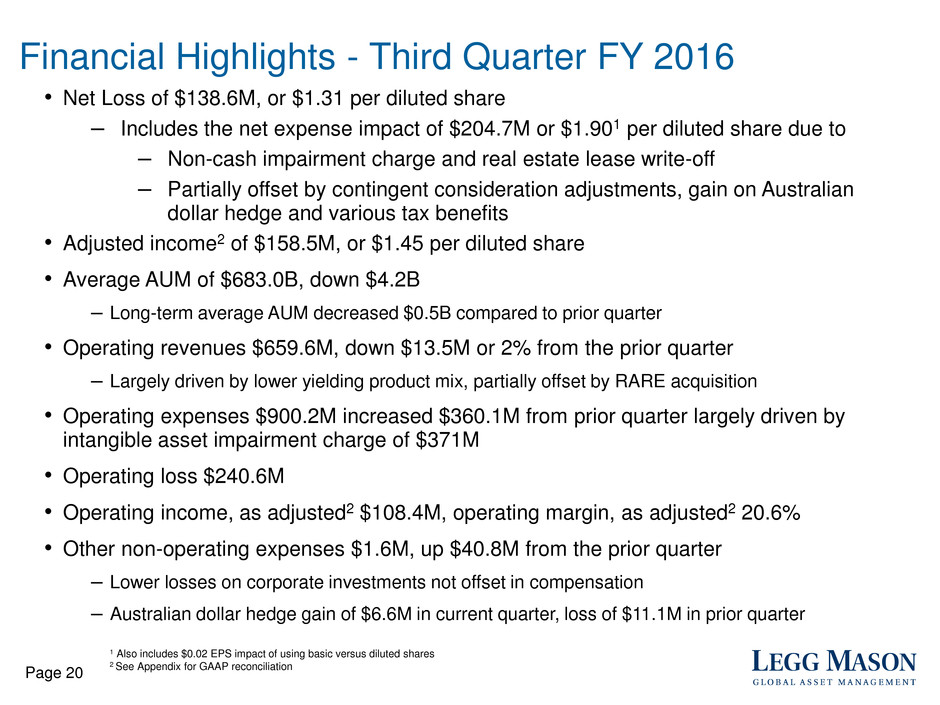
Page 20 Financial Highlights - Third Quarter FY 2016 • Net Loss of $138.6M, or $1.31 per diluted share ‒ Includes the net expense impact of $204.7M or $1.901 per diluted share due to ‒ Non-cash impairment charge and real estate lease write-off ‒ Partially offset by contingent consideration adjustments, gain on Australian dollar hedge and various tax benefits • Adjusted income2 of $158.5M, or $1.45 per diluted share • Average AUM of $683.0B, down $4.2B – Long-term average AUM decreased $0.5B compared to prior quarter • Operating revenues $659.6M, down $13.5M or 2% from the prior quarter – Largely driven by lower yielding product mix, partially offset by RARE acquisition • Operating expenses $900.2M increased $360.1M from prior quarter largely driven by intangible asset impairment charge of $371M • Operating loss $240.6M • Operating income, as adjusted2 $108.4M, operating margin, as adjusted2 20.6% • Other non-operating expenses $1.6M, up $40.8M from the prior quarter – Lower losses on corporate investments not offset in compensation – Australian dollar hedge gain of $6.6M in current quarter, loss of $11.1M in prior quarter 1 Also includes $0.02 EPS impact of using basic versus diluted shares 2 See Appendix for GAAP reconciliation

Page 21 Assets Under Management by Asset Class • AUM decreased $0.6B from prior quarter − Market appreciation of $6.4B and negative FX impact of $0.5B − Acquisition of RARE Infrastructure $6.8B − Liquidity outflows of $10.9B − Long-term outflows of $2.4B $143 $127 $130 $126 $115 $367 $376 $372 $368 $370 $199 $200 $197 $178 $186 $709 $703 $699 $672 $671 0 200 400 600 800 Dec 14 Mar 15 Jun 15 Sep 15 Dec 15 Liquidity Fixed Income Equity ($ billions) 20% 19% 17% 52% 55% 55% 28% 28% 26% % Mix Dec 14 % Mix Sep 15 % Mix Dec 15

Page 22 Net Flows – Quarterly • Fixed income inflows driven by Global Opportunistic $2.8B and Corporate Bond $1.3B, partially offset by outflows of Long Duration $0.8B and Structured Securities $0.6B • Equity outflows driven by Small Cap $3.1B, Large Cap $0.7B and Equity Income $0.5B 9.9 7.6 2.6 3.0 2.2 -6 -4 -2 0 2 4 6 8 10 Dec 14 Mar 15 Jun 15 Sep 15 Dec 15 ($ B illi on s) Fixed Income (1.1) (1.4) (1.3) 0.1 (4.6)-6 -4 -2 0 2 4 6 8 10 Dec 14 Mar 15 Jun 15 Sep 15 Dec 15 ($ B ill io ns ) Equity 8.8 6.2 1.3 3.1 (2.4) -6 -4 -2 0 2 4 6 8 10 ec 14 Mar 15 Jun 15 Sep 15 Dec 15 ($ B illi on s) Total Long-Term (10.6) (15.3) 2.3 (3.0) (10.9) -20 -15 -10 -5 0 5 10 15 Dec 14 Mar 15 Jun 15 Sep 15 Dec 15 ($ B ill io ns ) Liquidity (1.8) (9.1) 3.6 0.1 (13.3) -20 -15 -10 -5 0 5 10 15 Dec 14 Mar 5 Jun 15 Sep 15 Dec 15 ($ B ill io ns ) Total Flows

20% 20% 18% 18% 53% 52% 54% 54% 27% 28% 28% 28% 39.6 bps 38.5 bps 38.4 bps 37.8 bps 35.0 37.5 40.0 42.5 $- $200 $400 $600 $800 Dec 13 Mar 14 Jun 14 Sep 14 Dec 14 Mar 15 Jun 15 Sep 15 Dec 15 Op era tin g R ev en ue Yi eld (b ps ) Av er ag e A UM ($ B) Liquidity Fixed Income Equity Operating Revenue Yield Page 23 Operating Revenue Yield1 / Average AUM 1 Operating revenues = total operating revenues less performance fees Performance fees for Dec 14, Sep 15, and Dec 15 are $29.1M, $7.9M, and $9.2M, respectively • Total average AUM down $4.2B – Equity AUM down $1.4B and fixed income AUM up $0.9B – Liquidity AUM down $3.6B • Operating revenue yield down 0.6 bps primarily due to lower yield driven by a change in product mix

Page 24 Operating Margin, as Adjusted 24.1% 23.3% 22.9% 23.8% 21.4% 23.8% 22.6% 24.0% 20.6% 5% 10% 15% 20% 25% $400 $500 $600 $700 $800 Dec 13 Mar 14 Jun 14 Sep 14 Dec 14 Mar 15 Jun 15 Sep 15 Dec 15 O p M ar gi n, a s Ad j Av er ag e AU M ($ B ) Avg AUM Operating Margin, as adjusted Note: See Appendix for GAAP reconciliation • Impact of real estate charges and deal-related costs on operating margin, as adjusted was 2.0%

Page 25 $0.58 $0.02 ($0.06) $0.05 ($1.90) ($1.31) $(0.50) $- $0.50 $1.00 Sep Qtr EPS Q2 Items Lower Op Inc Change in MTM Q3 Items Dec Qtr EPS E P S 1 • Lower operating income due to decline in operating revenue yield driven by a change in product mix, increased advertising, conference and ETF expenses, as well as deal-related costs • Q3 items include intangible assets impairment charge, contingent consideration adjustments, real estate lease write-off, Australian dollar hedge gain related to RARE purchase price, various tax adjustments, and the impact of using basic rather than fully diluted shares 1 Australian dollar hedge loss $11.1M, RARE acquisition costs $0.7M and discrete tax benefit $5.0M Third Quarter Earnings Per Share Rollforward ($1.31)
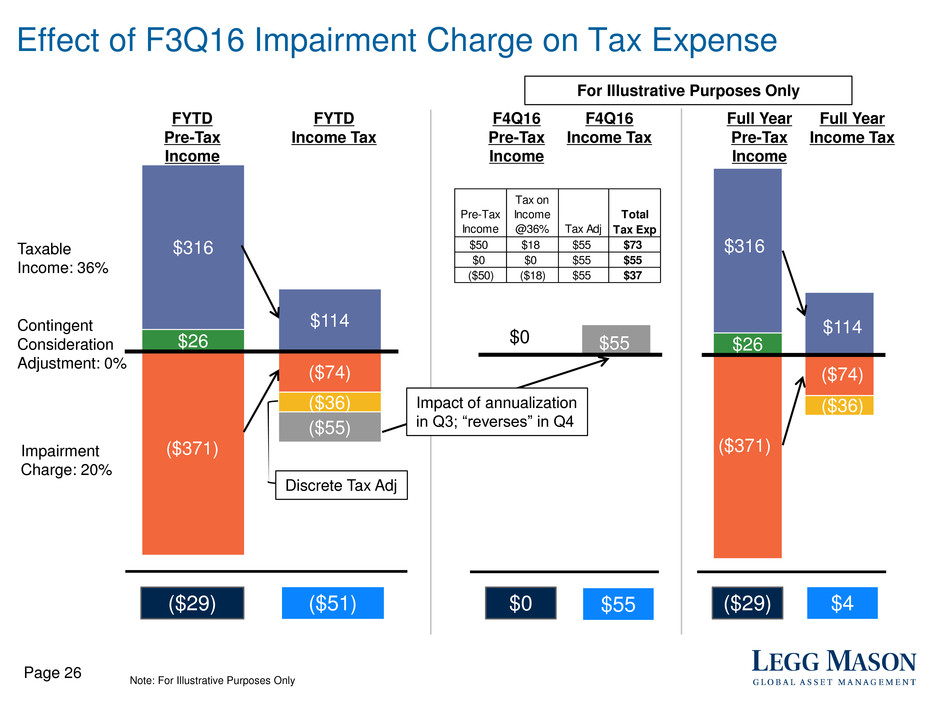
$26 $316 $114 ($74) ($36) ($55) $06 Impact of annualization in Q3; “reverses” in Q4 Discrete Tax Adj $0 Effect of F3Q16 Impairment Charge on Tax Expense Taxable Income: 36% Impairment Charge: 20% Contingent Consideration Adjustment: 0% FYTD Pre-Tax Income FYTD Income Tax ($29) ($51) Page 26 F4Q16 Pre-Tax Income F4Q16 Income Tax $55 ($371) $55 Full Year Pre-Tax Income Full Year Income Tax $26 ($371) $316 $114 ($74) ($36) ($29) $4 Note: For Illustrative Purposes Only Pre-Tax Income Tax on Income @36% Tax Adj Total Tax Exp $50 $18 $55 $73 $0 $0 $55 $55 ($50) ($18) $55 $37 For Illustrative Purposes Only
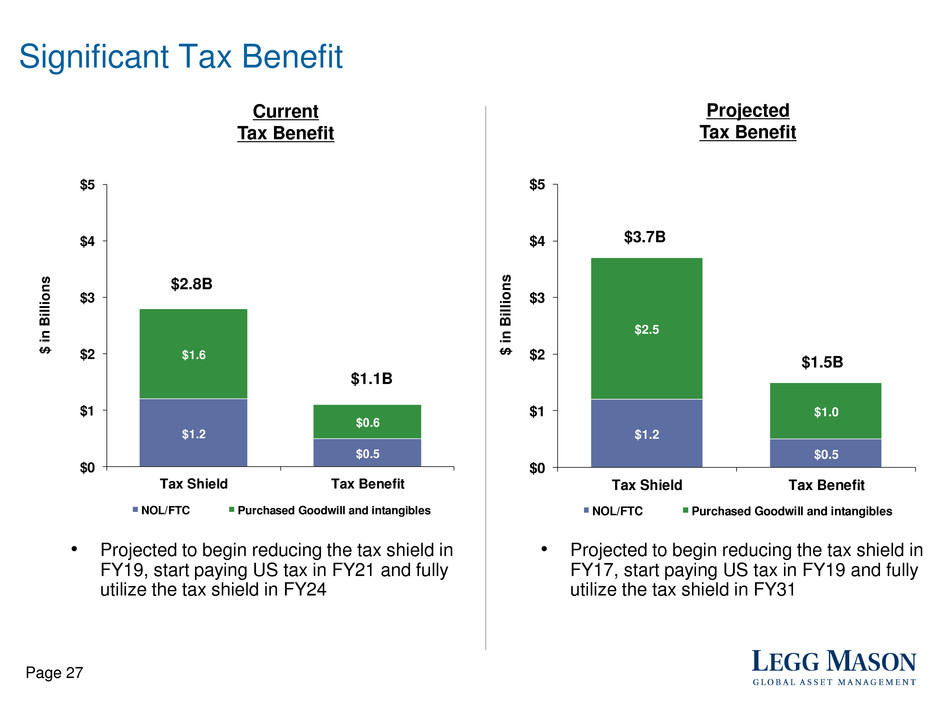
Page 27 Significant Tax Benefit $1.2 $0.5 $1.6 $0.6 $0 $1 $2 $3 $4 $5 Tax Shield Tax Benefit $ in B ill io ns NOL/FTC Purchased Goodwill and intangibles • Projected to begin reducing the tax shield in FY19, start paying US tax in FY21 and fully utilize the tax shield in FY24 $2.8B $1.1B $1.2 $0.5 $2.5 $1.0 $0 $1 $2 $3 $4 $5 Tax Shield Tax Benefit $ in B ill io ns NOL/FTC Purchased Goodwill and intangibles $3.7B $1.5B Current Tax Benefit Projected Tax Benefit • Projected to begin reducing the tax shield in FY17, start paying US tax in FY19 and fully utilize the tax shield in FY31

Capital Deployment Page 28 163 150 140 125 117 111 108 75 100 125 150 175 Mar 10 Mar 11 Mar 12 Mar 13 Mar 14 Mar 15 Dec 15 Shares Outstanding (M) 665 670 530 619 563 $0 $200 $400 $600 $800 Dec 14 Mar 15 Jun 15 Sep 15 Dec 15 Quarterly Cash Position ($M) 1 Market value as of December 31, 2015 Annualized Quarterly Dividend Declared (Per Share) $0.12 $0.24 $0.32 $0.44 $0.52 $0.64 $0.80 $0.00 $0.10 $0.20 $0.30 $0.40 $0.50 $0.60 $0.70 $0.80 $0.90 Mar 10 Mar 11 Mar 12 Mar 13 Mar 14 Mar 15 Dec 15 Seed Investments of $364M 1 40% 22% 38% Equity Fixed Income Alternative • Industry leader in the rate of returning capital, while continuing to invest in the business • Since March 2010 returned $2.5B
Appendix

Page 30 Appendix – GAAP Reconciliation Adjusted Income1 ($ millions, except per share amounts) Dec 15 Sep 15 Dec 14 Dec 15 Dec 14 Net Income (loss) Attributable to Legg Mason, Inc. (138.6)$ 64.3$ 77.0$ 20.2$ 154.1$ Plus (less): Amortization of intangible assets 1.6 0.7 0.7 3.0 2.0 Impairment charges 371.0 - - 371.0 - Contingent consideration fair value adjustment (26.4) - - (26.4) - Deferred income taxes on intangible assets: Impairment charges (74.2) - - (74.2) - Tax Amortization benefit 33.5 34.1 35.4 101.8 104.8 UK tax rate adjustment (8.4) - - (8.4) - Adjusted Income 158.5$ 99.1$ 113.1$ 387.0$ 260.9$ Net Income (loss) per Diluted Share Attributable to Legg Mason, Inc. (1.31)$ 0.58$ 0.67$ 0.17$ 1.32$ Plus (less): Amortization of intangible assets 0.01 - 0.01 0.03 0.02 Impairment charges 3.49 - - 3.41 - Contingent consideration fair value adjustment (0.25) - - (0.24) - Deferred income taxes on intangible assets: Impairment charges (0.70) - - (0.68) - Tax amortization benefit 0.31 0.31 0.30 0.94 0.89 UK tax rate adjustment (0.08) - - (0.08) - Adjustment to include particpating securities (0.02) - - (0.08) - Adjusted Income per Diluted Share 1.45$ 0.89$ 0.98$ 3.47$ 2.23$ 1 See explanations for Use of Supplemental Non-GAAP Financial Information in earnings release. Quarters Ended Nine Months Ended

Page 31 Appendix – GAAP Reconciliation Operating Margin, as adjusted1 ($ millions) Dec 13 Mar 14 Jun 14 Sep 14 Dec 14 Mar 15 Jun 15 Sep 15 Dec 15 Operating Revenues, GAAP basis 720.1$ 681.4$ 693.9$ 703.9$ 719.0$ 702.3$ 708.6$ 673.1$ 659.6$ Plus (less): Operating revenues eliminated upon consolidation of investment vehicles 0.5 0.3 0.2 0.2 0.2 0.2 0.1 0.1 0.1 Distribution and servicing expense excluding consolidated investment vehicles (148.8) (144.9) (148.7) (155.1) (147.5) (143.5) (149.3) (138.9) (132.9) Operating Revenues, as Adjusted 571.8$ 536.8$ 545.4$ 549.0$ 571.7$ 559.0$ 559.4$ 534.3$ 526.8$ Operating Income (Loss), GAAP basis 121.7$ 119.3$ 119.6$ 130.4$ 119.4$ 128.9$ 124.5$ 133.0$ (240.6)$ Plus (less): Gains (losses) on deferred compensation and seed investments, net 6.5 4.4 4.5 (0.4) 2.1 3.1 1.2 (5.5) 2.7 Contingent consideration fair value adjustment 5.0 - - - - - - - (26.4) Amortization of intangible assets 4.2 0.9 0.9 0.5 0.7 0.6 0.7 0.7 1.6 Impairment of intangible assets - - - - - - - - 371.0 Operating income of consolidated investment vehicles, net 0.6 0.5 0.2 0.2 0.2 0.3 0.1 0.1 0.1 Operating Income, as Adjusted 138.0$ 125.1$ 125.2$ 130.7$ 122.4$ 132.9$ 126.5$ 128.3$ 108.4$ Operating Margin, GAAP basis 16.9% 17.5% 17.2% 18.5% 16.6% 18.4% 17.6% 19.8% (36.5%) Operating Margin, as Adjusted 24.1% 23.3% 23.0% 23.8% 21.4% 23.8% 22.6% 24.0% 20.6% 1 See explanations for Use of Supplemental Data as Non-GAAP Financial Information in earnings release. Quarters Ended

Page 32 Appendix - Asset & Revenue Diversity Total AUM $671B FYTD 16 Operating Revenues $2.0B Data as of December 31, 2015 55% 28% 17% Fi xed Income Equity Li qui dity 63% 37% US Non-US 76% 24% Institutiona l Retail By Asset Class By Client Type By Client Domicile 40% 47% 9%4% Fixed Income Equity Alternative Liquidity 65% 35% US Non-US 52% 48% Institutiona l Retail By Asset Class By Client Type By Client Domicile

Page 33 December 31, 2015 December 31, 2014 1-Year 3-Year 5-Year 10-Year 1-Year 3-Year 5-Year 10-Year Total (includes liquidity) 60% 80% 83% 88% 75% 85% 86% 91% Equity: Large cap 32% 67% 64% 90% 57% 61% 75% 88% Small cap 18% 16% 27% 39% 10% 28% 22% 69% Total Equity (includes other equity) 38% 60% 63% 80% 47% 59% 64% 82% Fixed Income: US taxable 72% 86% 86% 87% 74% 94% 93% 88% US tax-exempt 100% 100% 100% 100% 100% 100% 100% 100% Global taxable 21% 76% 86% 84% 83% 89% 88% 94% Total Fixed Income 57% 83% 87% 87% 79% 92% 92% 91% Appendix – Additional Investment Performance Detail % of Strategy AUM Beating Benchmark1 1 See appendix for details regarding strategy performance. Past performance is no guarantee of future results. The information shown above does not reflect the performance of any specific iiifund. Individual fund performance will differ

Page 34 December 31, 2015 December 31, 2014 1-Year 3-Year 5-Year 10-Year 1-Year 3-Year 5-Year 10-Year Total (excludes liquidity) 43% 63% 72% 60% 62% 63% 60% 71% Equity: Large cap 31% 79% 87% 47% 76% 79% 70% 66% Small cap 12% 23% 18% 51% 19% 23% 22% 72% Total Equity (includes other equity) 33% 61% 66% 48% 53% 56% 52% 66% Fixed Income: US taxable 81% 84% 84% 78% 79% 84% 84% 82% US tax-exempt 23% 50% 72% 89% 69% 55% 58% 86% Global taxable 33% 36% 81% 20% 85% 86% 80% 54% Total Fixed Income 58% 67% 80% 78% 77% 75% 75% 81% Appendix – Additional Investment Performance Detail % of Long-Term U.S. Fund Assets beating Lipper Category Average1 1 Includes open-end, closed-end, and variable annuity funds. Source: Lipper Inc. Past performance is no guarantee of future results. The information shown above does not reflect the iiiiperformance of any specific fund. Individual fund performance will differ

Page 35 Appendix – Strategy Performance For purposes of investment performance comparisons, strategies are an aggregation of discretionary portfolios (separate accounts, investment funds, and other products) into a single group that represents a particular investment objective. In the case of separate accounts, the investment performance of the account is based upon the performance of the strategy to which the account has been assigned. Each of our asset managers has its own specific guidelines for including portfolios in their strategies. For those managers which manage both separate accounts and investment funds in the same strategy, the performance comparison for all of the assets is based upon the performance of the separate account. Approximately ninety percent of total AUM is included in strategy AUM as of December 31, 2015, although not all strategies have three, five, and ten year histories. Total strategy AUM includes liquidity assets. Certain assets are not included in reported performance comparisons. These include: accounts that are not managed in accordance with the guidelines outlined above; accounts in strategies not marketed to potential clients; accounts that have not yet been assigned to a strategy; and certain smaller products at some of our affiliates. Past performance is not indicative of future results. For AUM included in institutional and retail separate accounts and investment funds managed in the same strategy as separate accounts, performance comparisons are based on gross-of-fee performance. For investment funds (including fund-of-hedge funds) which are not managed in a separate account format, performance comparisons are based on net-of-fee performance. These performance comparisons do not reflect the actual performance of any specific separate account or investment fund; individual separate account and investment fund performance may differ. The information in this presentation is provided solely for use in connection with this presentation, and is not directed toward existing or potential clients of Legg Mason.
