Attached files
| file | filename |
|---|---|
| 8-K - CURRENT REPORT - Western New England Bancorp, Inc. | wfd-8k_020816.htm |
Exhibit 99.1

W ESTFIELD F INANCIAL , I NC . NASDAQ: WFD I NVESTOR P RESENTATION

F ORWARD – LOOKING STATEMENTS Today’s presentation may contain forward - looking statements, which may be identified by the use of such words as “believe,” “expect,” “anticipate,” “should,” “planned,” “estimated” and “potential . ” Examples of forward - looking statements include, but are not limited to, estimates with respect to our financial condition and results of operation and business that are subject to various factors which could cause actual results to differ materially from these estimates . These factors include, but are not limited to : changes in the interest rate environment that reduce margins; changes in the regulatory environment; the highly competitive industry and market area in which we operate; general economic conditions, either nationally or regionally, resulting in, among other things, a deterioration in credit qua lit y; changes in business conditions and inflation; changes in credit market conditions; changes in the securities markets which affect investment management revenues; increases in Federal Deposit Insurance Corporation deposit insurance premiums and assessments could adversely affect our fina nci al condition; changes in technology used in the banking business; the soundness of other financial services institutions which may adversely affect our credit risk; certain of our intangible assets may become impaired in the future; our controls and procedures may fail or be circumvented; new line of business or new products and services, which may subject us to additional risks; changes in key management personnel which may adversely impact our operations; the effect on our operations of governmental legislation and regulation, including changes in accounting regulation or standa rds , the nature and timing of the adoption and effectiveness of new requirements under the Dodd - Frank Act, Basel guidelines, capital requirements and other applicable laws and regulations; severe weather, natural disasters, acts of war or terrorism and other external events which could significantly impact our bu sin ess; and other factors detailed from time to time in our Securities and Exchange Commission (“SEC”) filings. Any or all of our forward - looking statements in today’s presentation or in any other public statements we make may turn out to be wrong . They can be affected by inaccurate assumptions we might make or known or unknown risks and uncertainties . Consequently, no forward - looking statements can be guaranteed . We disclaim any obligation to subsequently revise any forward - looking statements to reflect events or circumstances after the date of such statements, or to reflect the occurrence of anticipated or unanticipated events . 2

W ESTFIELD F INANCIAL O VERVIEW – W HO W E A RE ▪ A bank holding company headquartered in Westfield, MA with $ 1 . 3 billion in assets and 13 branches throughout western Massachusetts and northern Connecticut . ▪ Successfully transitioned to a commercial bank model from a legacy mutual thrift . ▪ 57 . 6 % commercial loans to total loans with 43 . 7 % in C & I and non - owner occupied CRE to total loans . ▪ Strong credit quality always essential – NPA/Assets of 0 . 60 % as of December 31 , 2015 . ▪ Target small to mid - sized businesses that are underserved by larger banks . ▪ Ranked # 4 in deposit market share in cities where we have branches (# 6 in Hampden County, Massachusetts) . ▪ Extremely strong regulatory capital ratios . Capital rationalization remains a priority . ▪ Strong and seasoned management team with long tenure at WFD . Top 5 senior officers have a combined 123 years banking experience, 92 years with Westfield Bank . ( 1 ) Does not include the Connecticut Banking Centers’ deposit total 3 (1)

W ESTFIELD F INANCIAL O VERVIEW – W HO W E A RE C ORPORATE S UMMARY Westfield Financial, Inc. – NASDAQ (WFD) Corporate Headquarters – Westfield, MA Third quarter 2014, established a commercial lending hub for our middle market and commercial real estate lending teams located in downtown Springfield, along the I - 91 “Knowledge Corridor ” extending our reach into the Hartford metro area. A second Connecticut banking center, located in Enfield, was opened in November 2014. 13 Branches; 12 Stand alone ATMS/Cash Machines. Financial Overview – As of December 31, 2015 Total Assets $1.3 billion Total Loans $818 million Total Deposits $900 million Total Common Equity $139 million 4

C OMMERCIAL L ENDING T EAM WITH R EGIONAL B ANK E XPERIENCE Years Lending Years with Westfield Bank Prior Experience James Hagan President and CEO 31 21 Fleet Bank, Bank of New England Allen Miles EVP and Senior Lender 27 17 Westbank, Bank of New England Commercial Lenders: Dennis Keefe 36 4 Berkshire Bank, Fleet Bank Richard Hanchett 29 8 New Alliance Bank, Westbank Bernard Donnelly 27 6 Peoples United Bank, Bank of Boston Thomas Cebula 19 4 Fleet Bank, Bank of New England Michael Harrington 17 8 New Alliance Bank, Westbank Sharon Czarnecki 8 23 Credit Analyst, Westfield Bank Brittany Kelleher 6 8 Credit Analyst, Westfield Bank Sean Millane 15 1 Rockville Bank Christopher Fager 3 Hired 3 rd quarter 2015 Citizens Bank 5

M ARKET O VERVIEW 6 Source: (1) Knowledge Corridor website; (2) Masslive website Big Concentrated Market (1) Nation’s 20 th largest metro region, with 2.77 million people, ranks ahead of Denver and St. Louis. Robust Business Sectors (1 ) Key areas of excellence, focus and investment include: • Financial Services • Health Care • Precision Manufacturing • Insurance • Education Academic Powerhouse (1) High academic concentration with 41 colleges and universities and approximately 215,000 students. Exceptional Achievement (1) Consistently among the nation’s top 10 in percentage of population with advanced degrees, science - engineering doctorates and new patents registered. $2.48 Billion in Springfield Economic Development Projects (2) Springfield’s chief development officer announced in March 2014 it has planned or in - progress projects totaling $2.48 billion. WFD Branch Footprint K NOWLEDGE C ORRIDOR An interstate partnership of regional economic development, planning, business, tourism and educational institutions that work together to advance the region’s economic progress.
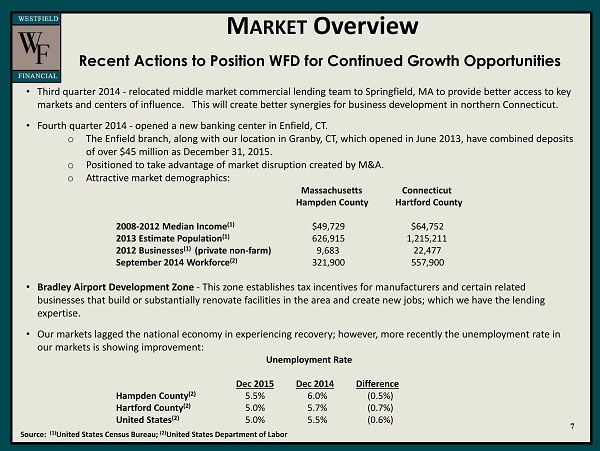
M ARKET Overview 7 Source: (1) United States Census Bureau; (2) United States Department of Labor • Third quarter 2014 - relocated middle market commercial lending team to Springfield, MA to provide better access to key markets and centers of influence. This will create better synergies for business development in northern Connecticut. • Fourth quarter 2014 - opened a new banking center in Enfield, CT. o The Enfield branch, along with our location in Granby, CT, which opened in June 2013, have combined deposits of over $45 million as December 31, 2015. o Positioned to take advantage of market disruption created by M&A. o Attractive market demographics : Massachusetts Connecticut Hampden County Hartford County 2008 - 2012 Median Income (1 ) $ 49,729 $64,752 2013 E stimate Population (1) 626,915 1,215,211 2012 Businesses (1) (private non - farm) 9,683 22,477 September 2014 Workforce (2) 321,900 557,900 • Bradley Airport Development Zone - This zone establishes tax incentives for manufacturers and certain related businesses that build or substantially renovate facilities in the area and create new jobs; which we have the lending expertise. • Our markets lagged the national economy in experiencing recovery; however, more recently the unemployment rate in our markets is showing improvement: Unemployment Rate Dec 2015 Dec 2014 Difference Hampden County (2) 5.5% 6.0% (0.5%) Hartford County (2) 5.0% 5.7% (0.7%) United States (2) 5.0% 5.5% (0.6%) Recent Actions to Position WFD for Continued Growth Opportunities

W E A RE E XECUTING O UR S TRATEGY • Favorable shift in interest earning assets by way of loan growth with less reliance on investment portfolio. o For the twelve months ended December 31, 2015, loans grew by $93.5 million , or 12.9%, while investments decreased by $72.9 million, or 14.3%. • Target small and mid - sized businesses, which are underserved by the larger banks. For the twelve months ended December 31, 2015: o C&I and CRE loans growth of $27.2 million or 6.1%. o Opened 461 business transactional deposit accounts with an aggregate YTD average balance of $5.1 million. o Efficient pipeline: Loan Committee meets on a weekly basis regarding decision making on large loans. Credit scoring used for small business loan originations under $500,000. • Grow residential real estate lending to diversify risk and deepen customer relationships. o Residential loans grew $63.8 million, or 23.0%, for the twelve months ended December 31, 2015. o Improved residential lending ability within our branch network through staff training and licensing. o Implemented new processes to speed up turnaround time on loan decisions and closings. 8

I MPROVED MIX OF INTEREST EARNING ASSETS I NCREASING LOANS AND REDUCING SECURITIES 9 $ in millions 558 584 583 595 596 607 620 637 648 686 720 725 730 759 809 818 658 654 664 636 631 607 558 554 542 496 511 509 515 517 456 437 400 450 500 550 600 650 700 750 800 850 Q1 2012 Q2 2012 Q3 2012 Q4 2012 Q1 2013 Q2 2013 Q3 2013 Q4 2013 Q1 2014 Q2 2014 Q3 2014 Q4 2014 Q1 2015 Q2 2015 Q3 2015 Q4 2015 Loans Securities

L OAN P ORTFOLIO C OMPOSITION $ in millions As of December 31, 2015 10 Owner Occupied $113.6 14% Non - Owner Occupied $189.2 23% Consumer Loans $ 1.6 Home equity $43.6 5% Residential Real Estate $301.8 37% Commercial & Industrial $168.4 21%

C OMMERCIAL L OAN P ORTFOLIO 11 $ in millions As of December 31, 2015 Granularity of commercial loan relationships Diversified amongst a variety of segments >$5 Million & < $ 10 million $112.7 24% Over $10 million $141.7 30% Under $5 Million $216.8 46% Manufacturing $49.4 10% Wholesale Trade $42.9 11% Retail Trade $34.2 7% Real Estate, Rental & Leasing $170.6 36% Professional, Scientific & Technical $29.6 6% Educational & Health Care $36.7 8% Arts, Entertainment & Recreation $ 31.0 7% Other $77.0 16%

O UR C URRENT D EPOSIT M ARKET C ITIES & T OWNS WHERE WE HAVE BRANCHES $ in thousands Source: SNL Financial (1) - Does not include the Connecticut Banking Centers’ deposit total . 12 Deposits Market Bank Name Branches 06/30/2015 Share 1 TD Bank National Association 13 1,018,144 15.57% 2 Bank of America, NA 10 964,389 14.75% 3 PeoplesBank 10 916,008 14.01% 4 Westfield Bank 11 861,992 13.18% 5 United Bank 10 852,010 13.03% 6 Berkshire Bank 10 809,341 12.38% 7 First Niagra Bank NA 8 252,305 3.86% 8 Peoples United Bank 3 240,492 3.68% 9 RBS Citizens NA 11 175,396 2.68% 10 Merchants Bank 1 142,624 2.18% 11 Easthampton Savings Bank 2 81,559 1.25% 12 Chicopee Savings Bank 1 79,258 1.21% 13 Santander Bank NA 2 78,933 1.21% 14 Webster Bank, NA 4 65,797 1.01% (1)
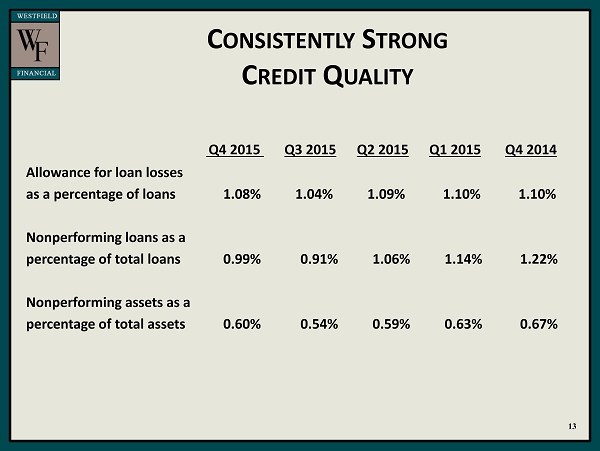
C ONSISTENTLY S TRONG C REDIT Q UALITY 13 Q4 2015 Q3 2015 Q2 2015 Q1 2015 Q4 2014 Allowance for loan losses as a percentage of loans 1.08% 1.04% 1.09% 1.10% 1.10% Nonperforming loans as a percentage of total loans 0.99% 0.91% 1.06% 1.14% 1.22% Nonperforming assets as a percentage of total assets 0.60% 0.54% 0.59% 0.63% 0.67%

F OCUS ON C ORE D EPOSITS O VER FIVE YEAR PERIOD , TOTAL DEPOSITS GREW $200 MILLION ( 28.57%), WHILE N ON - MATURITY DEPOSITS GREW $158 MILLION (45.66%) December 31, 2015 December 31, 2010 14 Noninterest checking , 12% Interest - bearing checking , 12% Savings and MMDA , 25% Time , 51% Noninterest checking , 18% Interest - bearing checking , 3% Savings and MMDA , 35% Time , 44% $900 million total deposits $700 million total deposits

W HY I NVEST IN W ESTFIELD F INANCIAL • Stock trading near tangible book . • Experienced, disciplined regional leadership team. • Continued opportunities for organic growth. • Expansion into demographically attractive markets. • Improving mix of interest earning assets. • High credit quality. • Balance sheet mix well positioned for rising rates. • Noninterest income opportunities from new wealth management services. 15