Attached files
| file | filename |
|---|---|
| 8-K - 8-K - BEACON ROOFING SUPPLY INC | v430590_8k.htm |
| EX-99.1 - EXHIBIT 99.1 - BEACON ROOFING SUPPLY INC | v430590_ex99-1.htm |
 Exhibit
99.2
Exhibit
99.2
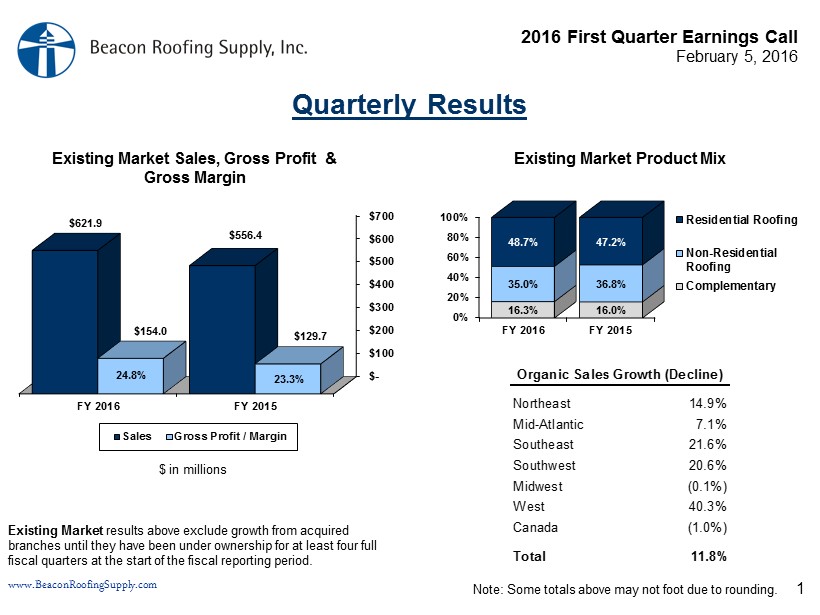
2016 First Quarter Earnings Call February 5, 2016 www.BeaconRoofingSupply.com 0% 20% 40% 60% 80% 100% FY 2016 FY 2015 16.3% 16.0% 35.0% 36.8% 48.7% 47.2% Residential Roofing Non-Residential Roofing Complementary $- $100 $200 $300 $400 $500 $600 $700 FY 2016 FY 2015 $621.9 $556.4 $154.0 $129.7 Sales Gross Profit / Margin 1 Quarterly Results Existing Market Product Mix Northeast 14.9% Mid-Atlantic 7.1% Southeast 21.6% Southwest 20.6% Midwest (0.1%) West 40.3% Canada (1.0%) Total 11.8% Organic Sales Growth (Decline) $ in millions 23.3% Existing Market Sales, Gross Profit & Gross Margin 24.8% Note: Some totals above may not foot due to rounding. Existing Market results above exclude growth from acquired branches until they have been under ownership for at least four full fiscal quarters at the start of the fiscal reporting period.

2016 First Quarter Earnings Call February 5, 2016 www.BeaconRoofingSupply.com $- $20 $40 $60 $80 $100 $120 FY 2016 FY 2015 $111.5 $106.0 2 $ in millions 17.9% of Sales 19.1% of Sales Existing Market Operating Expenses Quarterly Results Note: Some totals above may not foot due to rounding. Existing Market results above exclude growth from acquired branches until they have been under ownership for at least four full fiscal quarters at the start of the fiscal reporting period. Payroll and employee benefit costs 3.3$ Allowance for uncollectible accounts 2.2 New Greenfield branch investments 1.4 Depreciation & amortization (0.2) Warehouse and G&A expenses (0.4) Selling expenses (0.8) Other (0.1) Total 5.5$ Operating Expense Incr. (Decr.)

2016 First Quarter Earnings Call February 5, 2016 www.BeaconRoofingSupply.com $36 $38 $40 $42 $44 $46 FY 2015 FY 2016 3 $44.7 $40.2 $ in millions Cash Flow From Operations Quarterly Results Note: Some totals above may not foot due to rounding. CF from Ops. $37.6 $27.3 Non - Cash & WC Adj. $7.1 $12.9 Net Income FY 2016 FY 2015