Attached files
| file | filename |
|---|---|
| 8-K - FORM 8-K - NATIONAL FUEL GAS CO | d64215d8k.htm |
 National Fuel Gas Company
Investor Presentation
February 2016 Exhibit 99 |
 Safe Harbor For Forward Looking Statements
2 This presentation may contain “forward-looking statements” as defined by the Private Securities Litigation Reform Act of
1995, including statements regarding future prospects,
plans, objectives, goals, projections, estimates of oil and gas quantities, strategies, future events or performance and underlying assumptions, capital structure, anticipated capital expenditures, completion of construction projects, projections for pension and other post-retirement benefit obligations,
impacts of the adoption of new accounting rules, and possible
outcomes of litigation or regulatory proceedings, as well as
statements that are identified by the use of the words “anticipates,” “estimates,” “expects,” “forecasts,” “intends,” “plans,” “predicts,” “projects,” “believes,” “seeks,”
“will,” “may,” and similar expressions. Forward-looking statements involve risks and uncertainties which could cause actual results or outcomes to differ materially from those expressed in the forward-looking statements. The Company’s
expectations, beliefs and projections are expressed in good faith
and are believed by the Company to have a reasonable basis, but there can be no assurance that management’s expectations, beliefs or projections will result or be achieved or accomplished. In addition to other factors, the following are important factors that, in the view of the Company, could cause actual results to differ
materially from those discussed in the forward-looking
statements: Impairments under the SEC’s full cost ceiling test for natural gas and oil reserves; changes in the price of natural gas or oil; financial and economic conditions, including the availability of credit, and occurrences affecting the Company’s ability to obtain financing on acceptable
terms for working capital, capital expenditures and other
investments, including any downgrades in the Company’s credit ratings and changes in interest rates and other capital market conditions; delays or changes in costs or plans with respect to Company projects or related projects of other companies, including difficulties or delays in obtaining necessary
governmental approvals, permits or orders or in obtaining the
cooperation of interconnecting facility operators; factors affecting the Company’s ability to successfully identify, drill for and produce economically viable natural gas and oil reserves, including among others geology, lease availability, title disputes, weather conditions,
shortages, delays or unavailability of equipment and services
required
in drilling operations, insufficient gathering, processing and transportation capacity, the need to obtain governmental approvals and permits, and compliance with environmental laws and regulations; changes in laws, regulations or judicial interpretations to which the Company is subject, including
those involving derivatives, taxes, safety, employment, climate
change, other environmental matters, real property, and exploration and production activities such as hydraulic fracturing; governmental/regulatory actions, initiatives and proceedings, including those involving rate cases (which address, among other things, target rates of return, rate
design and retained natural gas), environmental/safety
requirements, affiliate relationships, industry structure, and franchise renewal; changes in price differentials between similar quantities of natural gas or oil at different geographic locations, and the effect of such changes on commodity production, revenues and demand for pipeline transportation
capacity to or from such locations; other changes in price
differentials between similar quantities of natural gas or oil having different quality, heating value, hydrocarbon mix or delivery date; the cost and effects of legal and administrative claims against the Company or activist shareholder campaigns to effect changes at the Company; uncertainty of
oil and gas reserve estimates; significant differences between the
Company’s projected and actual production levels for natural gas or oil; changes in demographic patterns and weather conditions; changes in the availability, price or accounting treatment of derivative financial instruments; changes in economic conditions, including global,
national or regional recessions, and their effect on the demand
for, and customers’ ability to pay for, the Company’s products and services; the creditworthiness or performance of the Company’s key suppliers, customers and counterparties; economic disruptions or uninsured losses resulting from major accidents, fires, severe weather, natural disasters,
terrorist activities, acts of war, cyber attacks or pest
infestation; significant differences between the Company’s projected and actual capital expenditures and operating expenses; changes in laws, actuarial assumptions, the interest rate environment and the return on plan/trust assets related to the Company’s pension and other
post-retirement benefits, which can affect future funding
obligations and costs and plan liabilities; increasing health care costs and the resulting effect on health insurance premiums and on the obligation to provide other post- retirement benefits; or Increasing costs of insurance, changes in coverage and the ability to obtain insurance.
Forward-looking statements include estimates of oil and gas quantities.
Proved oil and gas reserves are those quantities of oil and gas which, by analysis of geoscience and engineering data, can be estimated with reasonable certainty to be economically producible under existing economic conditions, operating
methods and government regulations. Other estimates of oil
and gas quantities, including estimates of probable reserves, possible reserves, and resource potential, are by their nature more speculative than estimates of proved reserves. Accordingly, estimates other than proved reserves are subject to substantially greater risk of being actually
realized. Investors are urged to consider closely the disclosure in
our Form 10-K available at www.nationalfuelgas.com. You can also obtain this form on the SEC’s website at www.sec.gov.
For a discussion of the risks set forth above and other factors that could cause
actual results to differ materially from results referred to in the
forward-looking statements, see “Risk Factors” in the
Company’s Form 10-K for the fiscal year ended September 30, 2015 and the Form 10-Q for the quarter ended December 31, 2015. The Company disclaims any obligation to update any forward-looking statements to reflect events or circumstances after the date thereof or to reflect the
occurrence of unanticipated events. Corporate
|
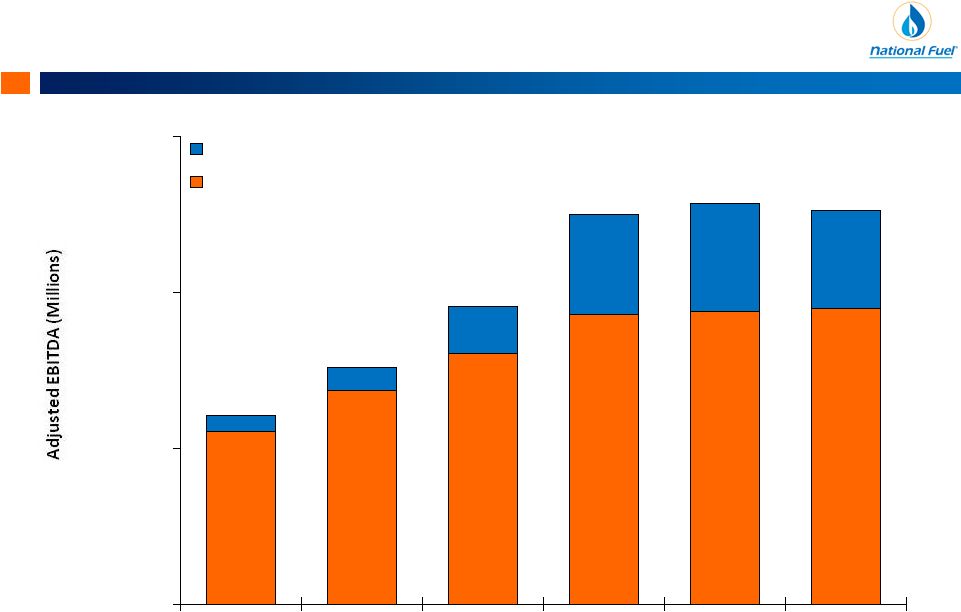
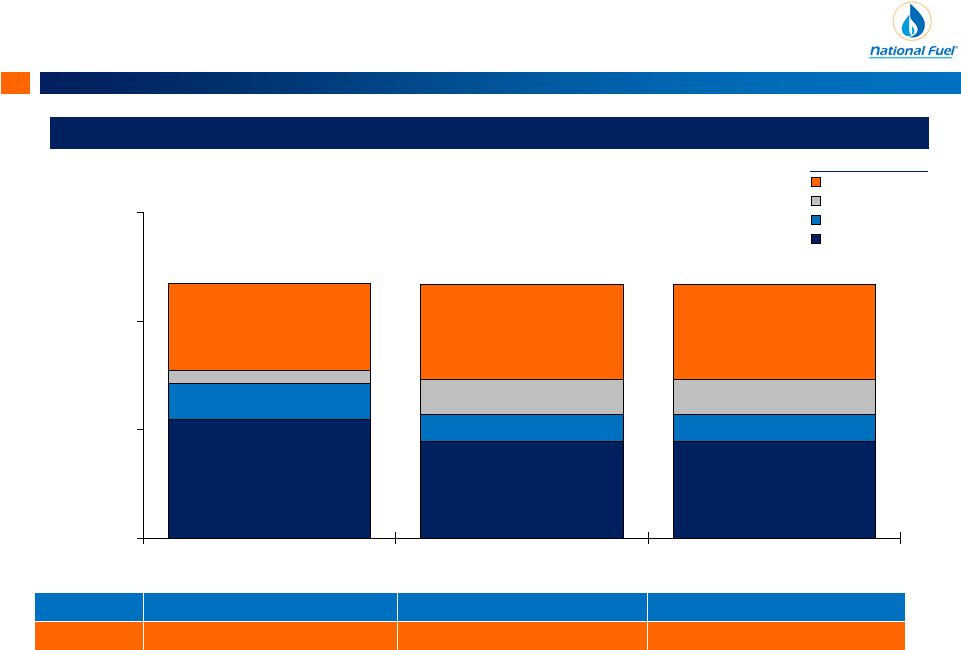
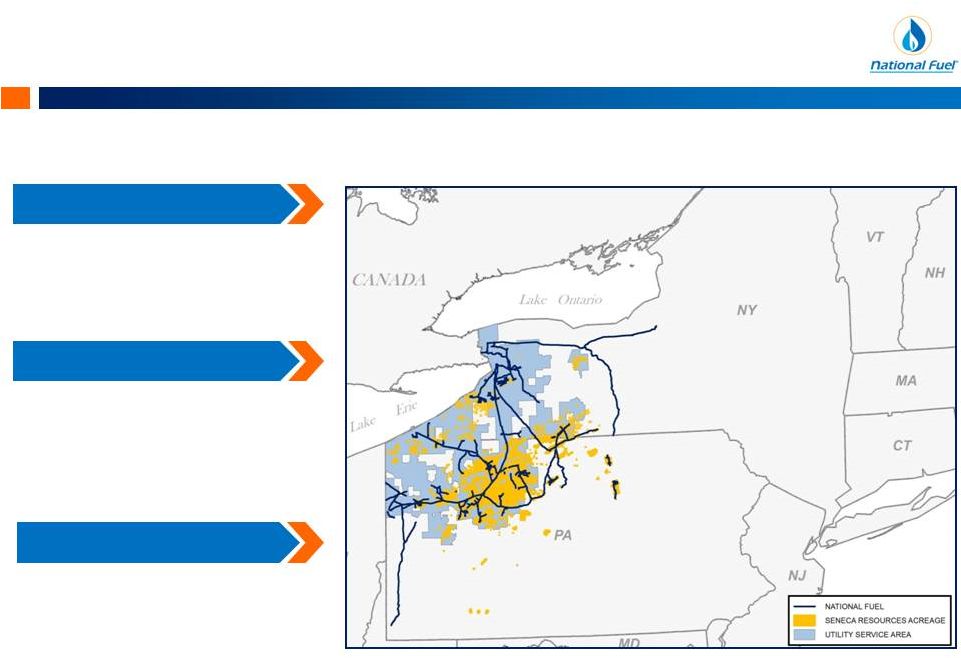 Corporate • 2.3 Tcfe Proved Reserves (1) • 785,000 net acres in Marcellus Shale • 3 million Bbls/year California crude oil production 3 National Fuel Gas Company Upstream Downstream Quality Assets | Exceptional Location | Unique Integration
• $252 million adjusted EBITDA (2) • $1.2 billion midstream investments since 2010 • Coordinated infrastructure build-out in Appalachia with NFG Upstream • 740,000 Utility customer accounts • Stable, regulated earnings & cash flows • Supports investment grade credit rating Midstream Corporate (1) Total proved reserves are as of September 30, 2015.
(2)
For the trailing twelve months ended December 31, 2015. A reconciliation of
Adjusted EBITDA to Net Income as presented on the Consolidated Statement of Income and Earnings Reinvested in the Business is included at the end of this presentation. |
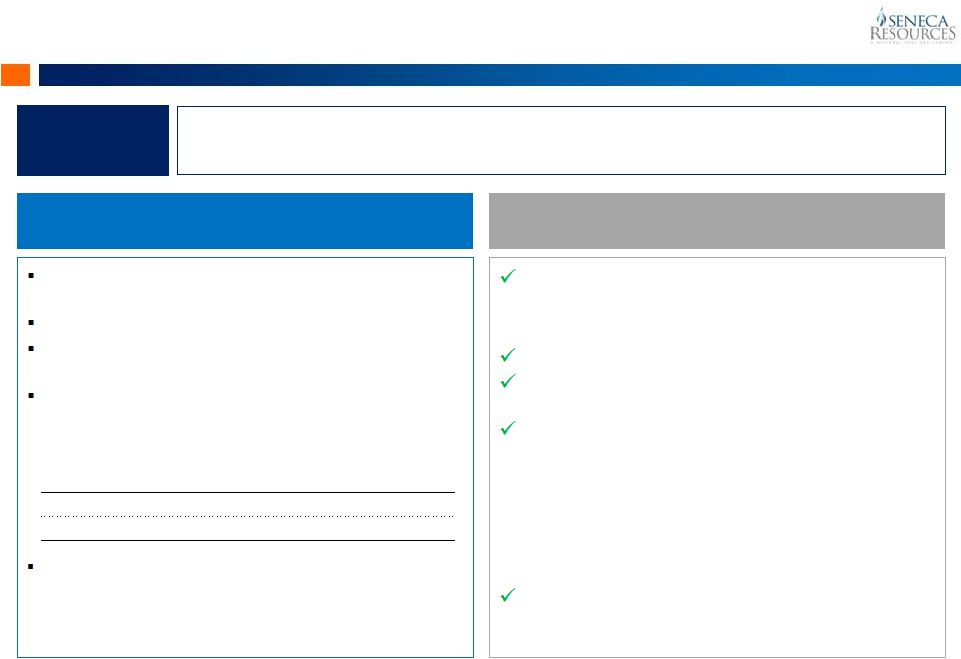
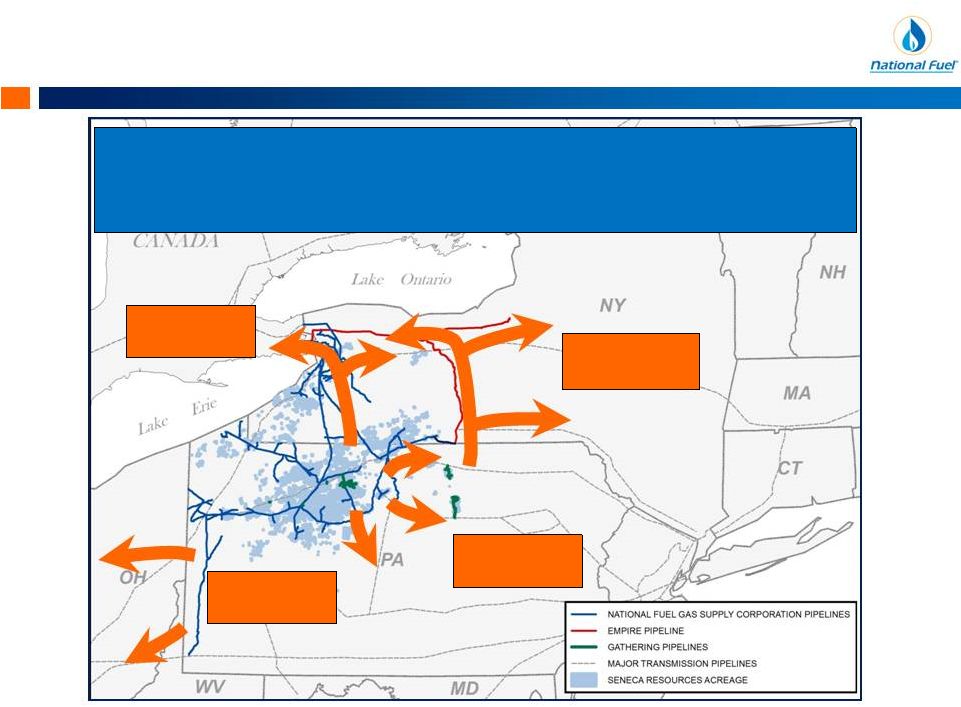
 Corporate Unique Asset Mix and Integrated Model Provide Balance and Stability The National Fuel Value Proposition 4 Fee ownership on ~715,000 net acres in WDA = limited royalties or drilling commitments
Seneca has >900,000 Dth/day of firm transportation & sales contracts
by start of fiscal 2018 Stacked pay potential in Utica and
Geneseo shales across Marcellus acreage Coordinated gathering
& interstate pipeline infrastructure build-out with NFG midstream Opportunity for further pipeline expansion to accommodate Appalachian supply growth
Creating long-term sustainable value remains our #1 shareholder
priority Considerable Upstream and Midstream Growth Opportunities in
Appalachia Geographical and operational integration drives
capital flexibility and reduces costs Cash flow from
rate-regulated businesses supports interest costs and funds the dividend NFG is Well Positioned to Endure Current Commodity Price Environment Investment grade credit rating and liquidity to support long-term Appalachian growth strategy
Strong hedge book helps insulate near-term earnings and cash flows from
commodity volatility Disciplined and flexible capital investment
that is focused on economic returns Corporate
|
 Appalachia Overview
Exploration & Production | Gathering | Pipeline
& Storage 5
Appalachia Overview
Exploration & Production | Gathering | Pipeline
& Storage |
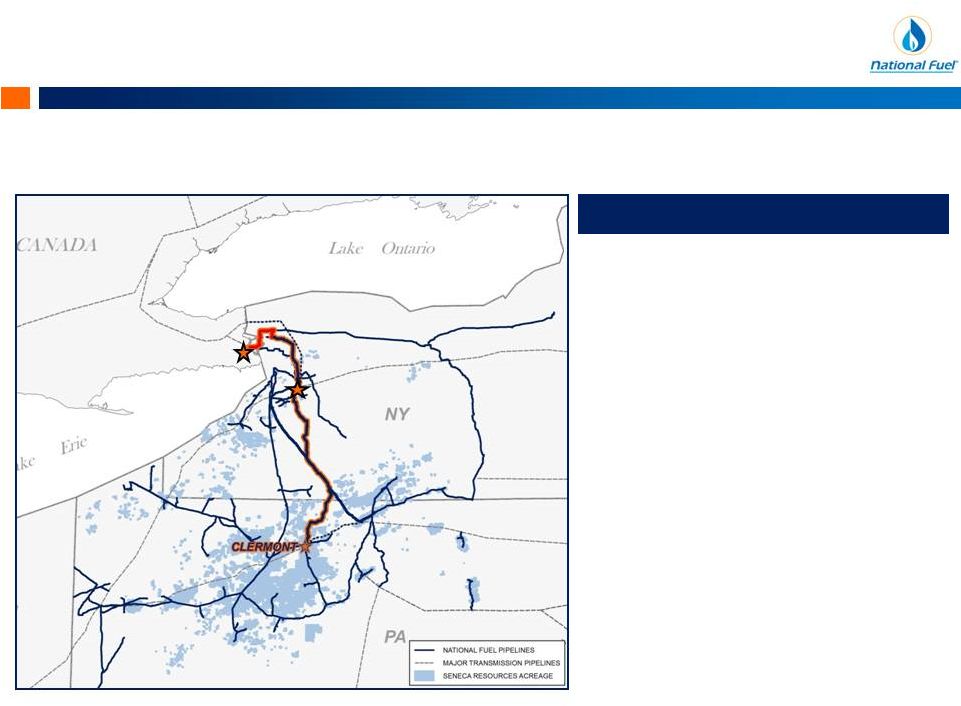
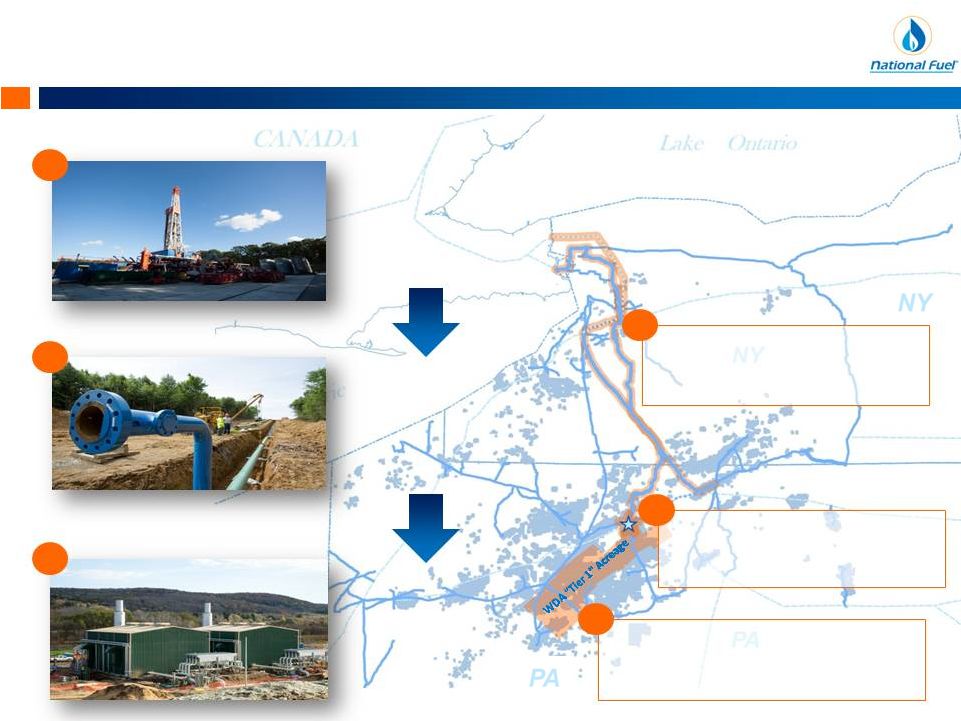          Appalachia 200,000 “Tier 1” WDA acres in Pa. Fee acreage economic < $2.50/MMBtu with minimal lease expiration Just-in-time build-out of Clermont Gathering System limits stranded pipeline assets/capital Northern Access projects to transport 660 MDth/d of Seneca- operated WDA production by FY18 Integrated Vision for Long-term Growth 6 Exploration & Production Pipeline & Storage Gathering 1 2 3 1 2 Long-term, return- driven approach to developing vast acreage position Connecting Our Production to Our Interstate Pipeline System Expanding Our Interstate Pipeline System to Reach Premium Markets 3 Appalachia |
 Exploration & Production
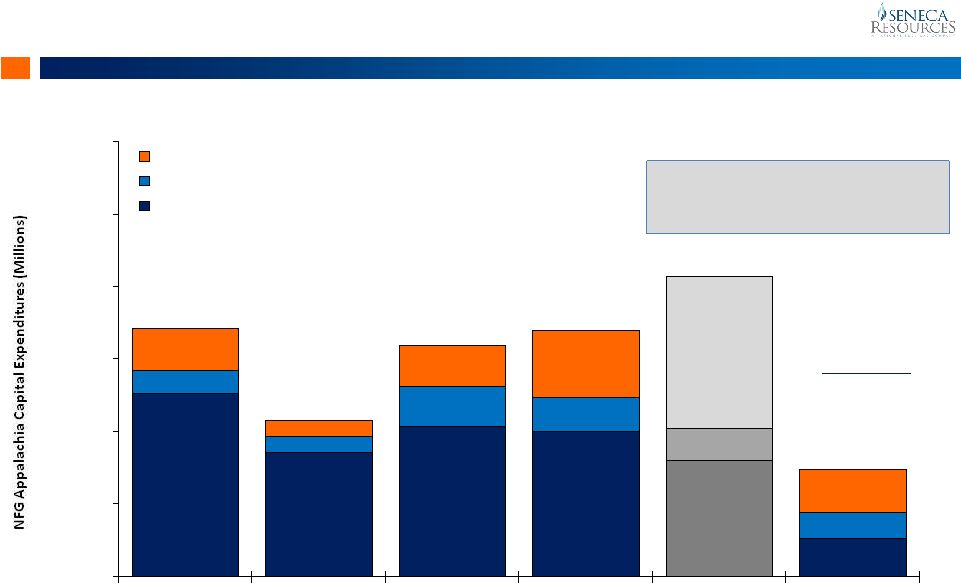
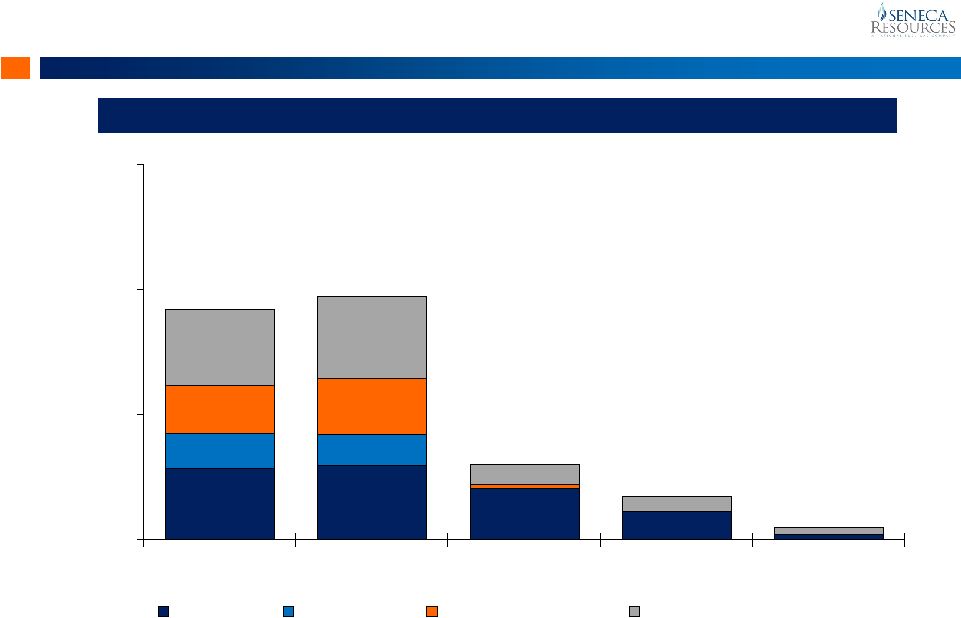
Appalachia $631 $428 $520 $500 $370-$425 $110-$150
$80 $55 $138 $118 $100-$125 $85-$95
$144 $56 $140 $230 $500-$550 $125-$175 $855 $539 $798 $848 $970-$1,100 $320-$420 $0 $250 $500 $750 $1,000 $1,250 $1,500 2012 2013 2014 2015 2016E (March '15) 2016E (Current) Pipeline & Storage Gathering E&P - Appalachia Appalachia Capital Reductions 7 Exercising Capital Flexibility and Discipline to Respond to Commodity Price Environment (1) FY2016 Appalachia Capital Budget Cut $665 million, or 64%, since preliminary budget released in March 2015 (1) Executed “Drill-Co” JDA (2) 1-rig program (3) Northern Access delay KEY ACTIONS (1) FY2016 capital expenditure guidance reflects the netting of up-front proceeds received from joint development partner for capital
spent on wells drilled and/or completed prior to the execution date of the joint development agreement. The E&P segment’s FY16 capital budget would be reduced by an additional $90-$110 million if
joint development partner exercises right to participate on remaining 38 wells. Note: A
reconciliation to Capital Expenditures as presented on the Consolidated Statement of Cash Flows is included at the end of
this presentation. Refer to slide 40 for NFG consolidated capital expenditures.
Exploration & Production |
 Exploration & Production
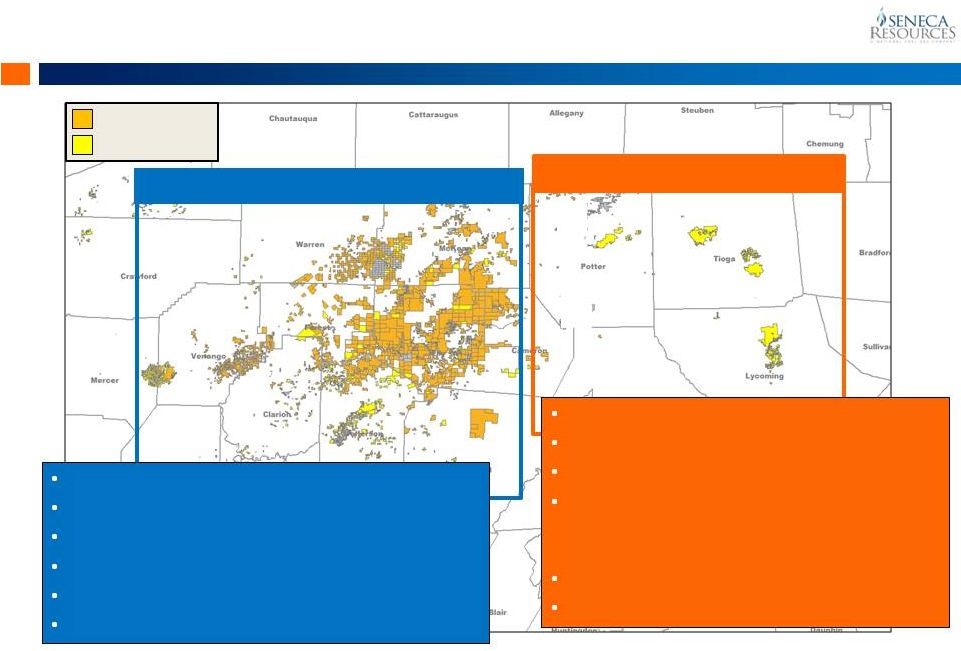
Appalachia Significant Appalachian Acreage Position 8 153 wells able to produce 350 MMcf/d 40-50 remaining Marcellus locations Additional strong Utica & Geneseo potential Limited development drilling until firm transportation on Atlantic Sunrise (190 MDth/d) is available in late 2017 Mostly leased (16-18% royalty) No near-term lease expirations 83 wells able to produce 255 MMcf/d Large inventory of high quality Marcellus acreage NFG midstream infrastructure supporting growth 660 MDth/d firm transportation by fiscal 2018 Mineral fee ownership enhances economics Highly contiguous nature drives efficiencies Seneca Lease Seneca Fee 715,000 Acres 70,000 Acres Western Development Area (WDA) Eastern Development Area (EDA) Exploration & Production Appalachia (1) (1) |
 Exploration & Production
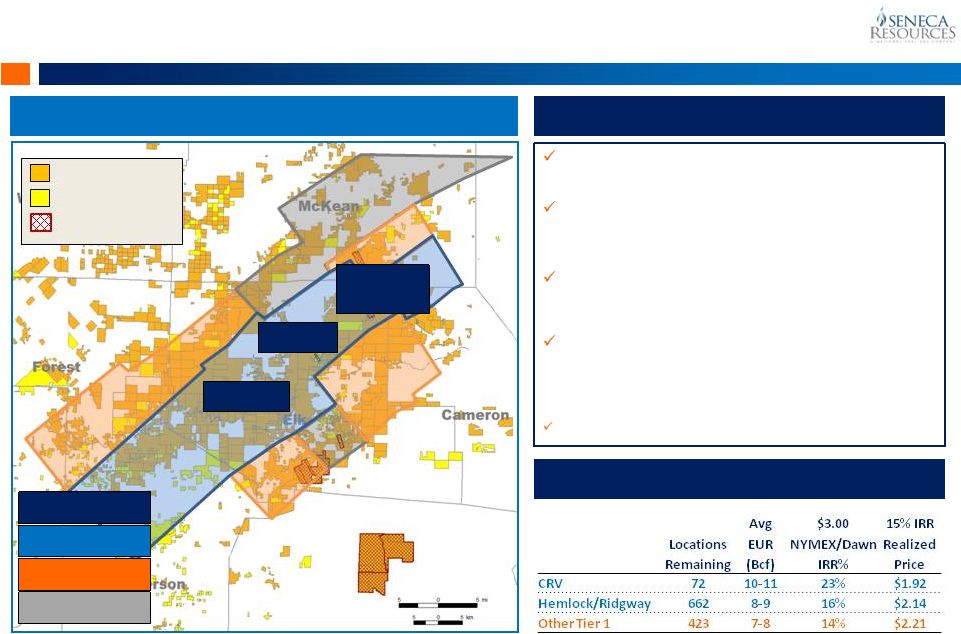
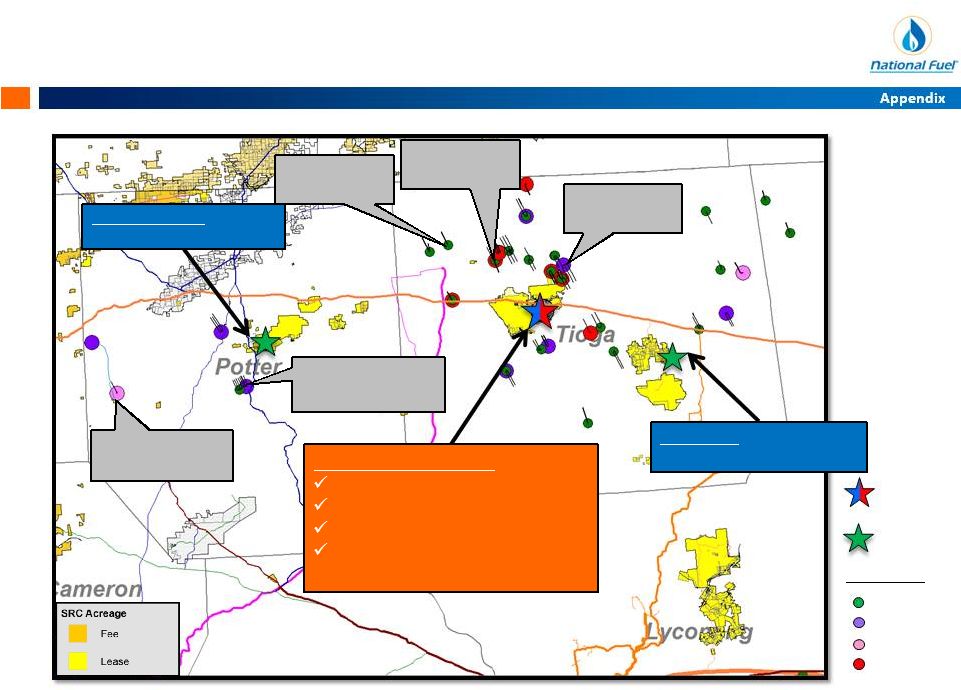
Appalachia Marcellus Shale: Western Development Area 9 WDA Tier 1 Acreage – 200,000 Acres WDA Tier 1 Marcellus Economics (1) WDA Highlights Large drilling inventory of quality Marcellus dry gas o ~1,200 locations economic < $2.50/MMBtu NFG midstream infrastructure supporting growth o NFG Clermont Gathering System o 660 MDth/d firm transport on NFG projects by FY18 Fee acreage enhances economics o No royalty on most acreage o No lease expirations or requirements to drill acreage Highly contiguous position drives D&C efficiencies o Multi-well pad drilling averaging 10 wells per pad o Average lateral length to date = 7,800 ft. o Centralized water sourcing & disposal infrastructure 2 Utica tests expected in fiscal 2016/2017 SRC Fee Acreage SRC Lease Acreage SRC / EOG Earned Acreage Clermont/ Rich Valley Hemlock Ridgway 2 - 4 BCF/well 6 - 10 BCF/well 4 - 6 BCF/well EUR Color Key (1) Internal rate of return (IRR) is pre-tax and includes estimated well costs under the current well design and cost structure and
projected firm transportation, gathering, LOE and other operating costs. CRV and Hemlock/Ridgway well designs assume 8,800 ft. lateral and 190 ft. frac stage spacing. Other Tier 1 well designs assume
8,500 ft. lateral and 190 ft. frac stage spacing. |
 Transaction Seneca WDA Joint Development Agreement 10 Key Terms On December 2, 2015, Seneca entered into an asset-level joint development agreement with IOG CRV-Marcellus
Capital, LLC, an affiliate of IOG Capital, LP, and funds managed by affiliates
of Fortress Investment Group, LLC, to jointly develop Marcellus
Shale natural gas assets located in Elk, McKean and Cameron counties in north-central PA. Assets: 80 current and future Marcellus development wells
in the Clermont/Rich Valley region of Seneca’s WDA.
Partner’s Initial Obligation: 42
wells Partner Option:
Partner has one-time option to participate in remaining 38 wells on or before July 1, 2016. Economics: Partner participates as an 80% working interest owner until the Partner achieves a 15% IRR hurdle. Seneca retains a 7.5% royalty and remaining 20% working interest. Strategic Rationale Significantly reduces near-term upstream capital spending Initial 42 wells - $200 million (1) 38 well option
- $180 million (1) Validates quality of Seneca’s Tier 1 Marcellus WDA acreage Seneca maintains current activity level driving additional Marcellus drilling and completion efficiencies Solidifies NFG’s midstream growth strategy: Gathering - All production from JV wells will flow through NFG Midstream’s Clermont Gathering System Pipeline & Storage
- Provides production growth that will utilize the 660 MDth/d of firm transportation capacity on NFG’s Northern Access pipeline expansion projects Strengthens balance sheet and makes Seneca cash flow positive in near-term Marketing: Partner to receive same realized price before
hedging as Seneca on production from the joint
development wells, including firm sales and the cost of firm
transportation.
Interests on Initial 42
Wells Seneca Partner Working Interest 20% 80% Net Revenue Interest 26% 74% (1) Estimated reduction in capital expenditures from joint development agreement assumes current wells costs.
Exploration & Production
Appalachia |
 Exploration & Production
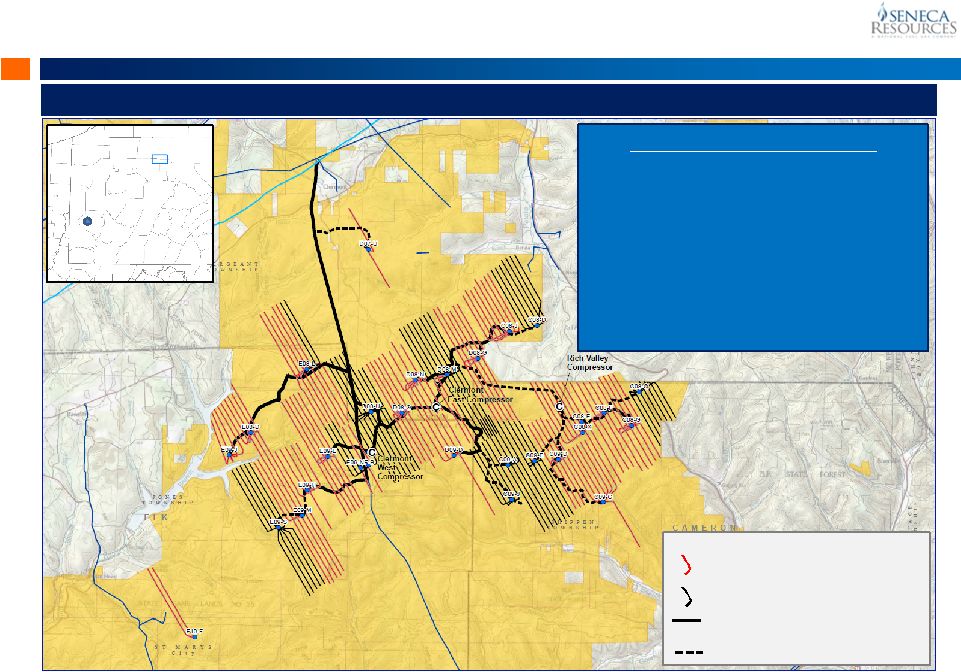
Appalachia 11 Clermont/Rich Valley Development Map Pittsburgh Clermont/Rich Valley Area Legend Drilled Wells Planned Wells Clermont Gathering System (in-service) Clermont Gathering System (future) CRV Development Summary • Current: 62 wells able to produce ~200 MMcf/d •
200+ MMcf/d gross firm sales in fiscal 2016
• Currently operating 2-rigs (down from 3 to start year). Will drop to 1 rig in March 2016 • Just-in-time gathering infrastructure build-out provides significant capital flexibility based on pace of Seneca’s development program • Regional focus of development minimizes capital outlay and improve returns Exploration & Production Appalachia Integrated WDA Development - Upstream |
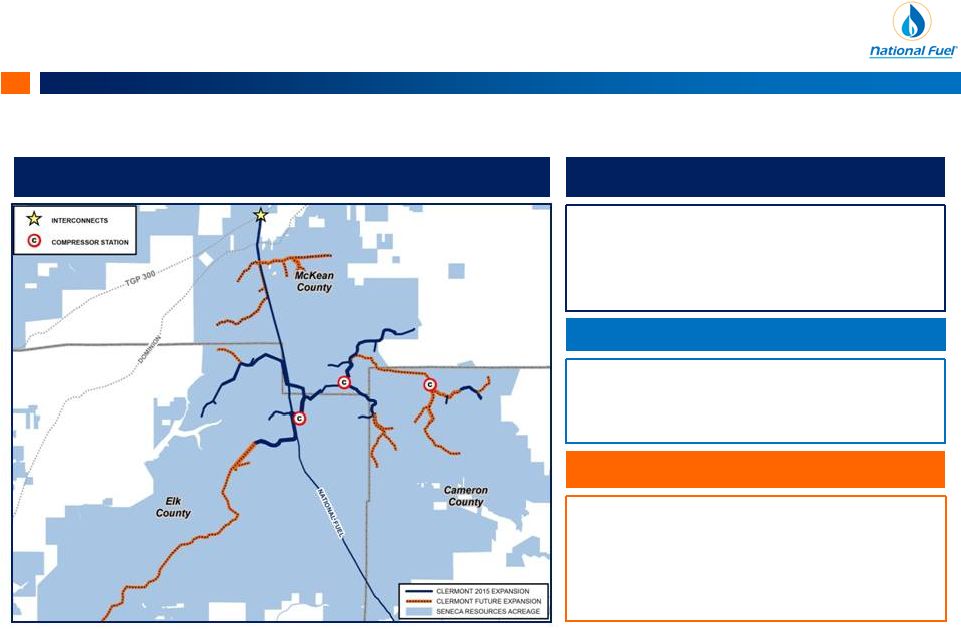 Appalachia Gathering Integrated WDA Development - Gathering 12 Current System In-Service • ~44 miles of pipe/13,800 HP of compression • Current Capacity: 470 MMcf per day • Interconnects with TGP 300 • Total CapEx To Date: $235 million Fiscal 2016 Build Out • FY16 CapEx: $60 to $75 million • Exit FY16 with > 52 miles of pipe installed and >26,220 HP commissioned Future Build-Out (FY17+) • Ultimate capacity can exceed 1 Bcf/d • Over 100 miles of pipelines and five compressor stations (+60,000 HP installed) • Deliverability into TGP 300 and NFG Supply • Future third-party volume opportunities Gathering System Build-Out Tailored to Accommodate Seneca’s WDA Development Clermont Gathering System Map |
 Appalachia Pipeline & Storage Integrated WDA Development - Interstate Pipelines 13 (1) 40,000 Dth per day went in-service on November 1, 2015. The remaining 100,000 Dth per day was placed in-service on December
1, 2015. Northern Access 2015
• Customer: Seneca Resources (NFG) • In-Service: November 2015 (1) • System: NFG Supply Corp. • Capacity: 140,000 Dth per day o Leased to TGP as part of TGP’s Niagara Expansion project • Interconnect o Niagara (TransCanada) • Total Cost: $67.5 Million • Major Facilities o 23,000 hp Compression Expanding Our Interstate Pipelines to Deliver Seneca’s WDA Production to Canada
Pipeline & Storage
Appalachia |
 14 Northern Access 2016 • Customer: Seneca Resources (NFG) • In-Service: Now targeting Nov. 1, 2017 • Capacity: 490,000 Dth/d • Interconnects: o o TGP 200 – East Aurora (140 MDth/d) • Total Cost: ~$455 Million • Major Facilities: o 98.5 miles – 16/24” Pipeline o 22,214 hp & 5,350 hp Compression • FERC Status o Pre-filing: July 2014 o Certificate filing: March 2015 o Certificate amendment filed Nov. 2015 Northern Access 2016 to Increase Transport Capacity out of WDA to Canada by 490,000 Dth/d by FY18 Integrated WDA Development - Interstate Pipelines Chippawa East Aurora Pipeline & Storage Appalachia TransCanada – Chippawa (350 MDth/d) |
 Exploration & Production
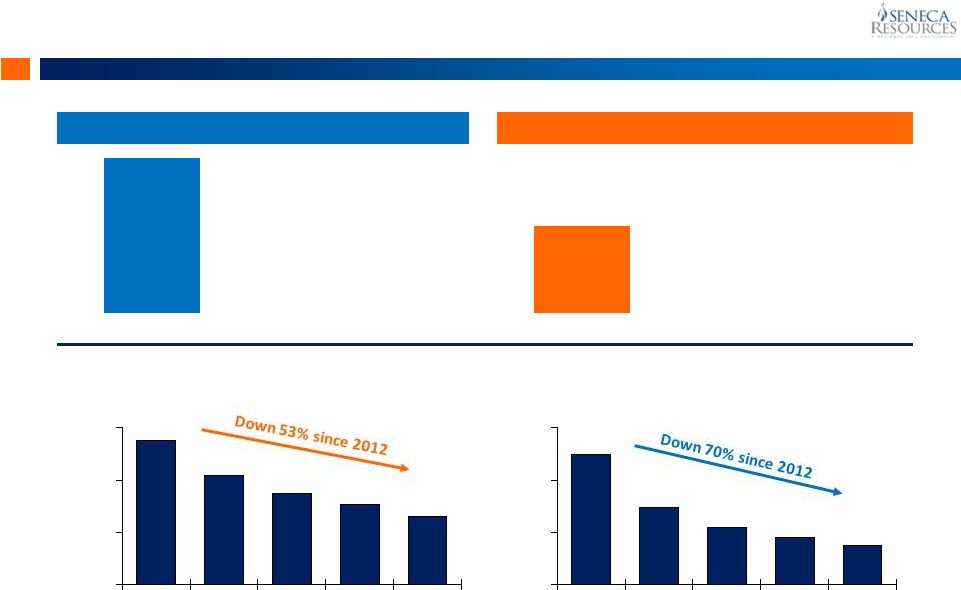
Appalachia $248 $148 $109 $91 $75 $0 $100 $200 $300 FY 2012 FY 2013 FY 2014 FY 2015 FY 2016 15 (1) Excludes pad construction costs. FY 2016 well costs assume actual costs incurred through December 31, 2016 and projects costs for
the remainder of the fiscal year under the current cost structure. (2) Includes dollars spent to drill and complete development wells only. Excludes exploration and delineation wells.
$275 $208 $174 $153 $130 $0 $100 $200 $300 FY 2012 FY 2013 FY 2014 FY 2015 FY 2016 $8.7 MM Well Cost $4.9 MM Well Cost Fiscal 2012 Average Development Well (1) Fiscal 2016 Average Development Well (1) Lateral Length: 5,100 ft Measured Depth: 13,700 ft Completion Stages: 20 Lateral Length: 7,600 ft Measured Depth: 14,300 ft Completion Stages: 40 Drilling Cost per Foot (2) Completion Cost per Stage (2) (000s) Marcellus Drilling and Completion Efficiencies |
 WDA Upstream & Midstream Development
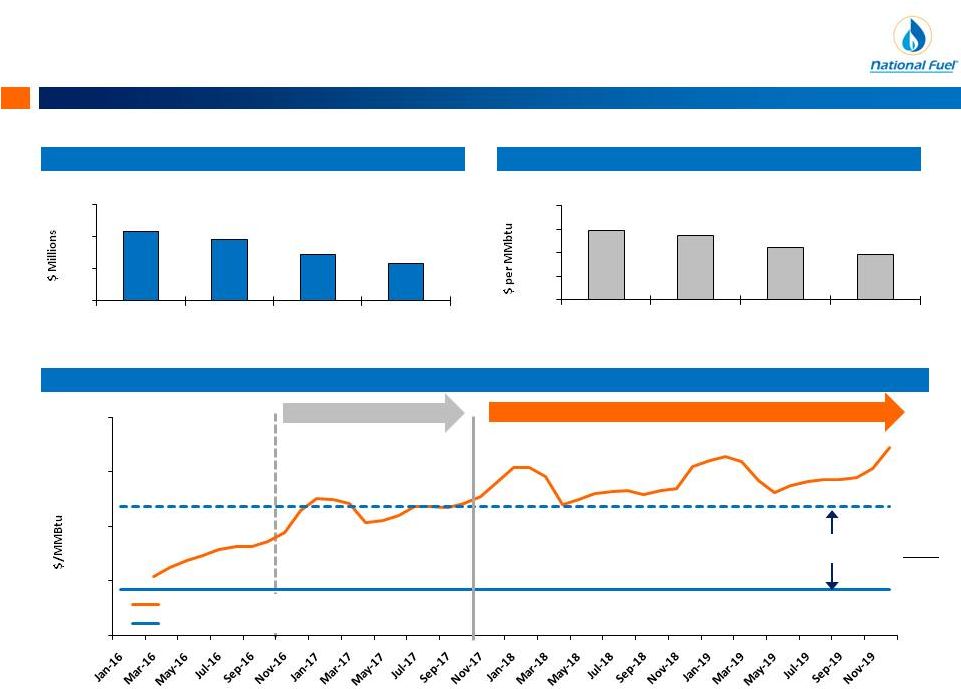
16 WDA Well Costs WDA Clermont / Rich Valley Economics WDA Clermont / Valley Economics vs. NYMEX Futures Strip $10.8 $9.6 $7.2 $5.8 $0 $5 $10 $15 FY 2013 FY 2014 FY 2015 FY 2016E $2.94 $2.71 $2.22 $1.92 $0.00 $1.00 $2.00 $3.00 $4.00 FY 2013 FY 2014 FY 2015 FY 2016E Normalized for a 8,800 ft. Lateral Length Normalized for a 8,800 ft. Lateral Length NA 2016 FT Cost (2) Northern Access 2016 In-Service (+490 Mdth/d) (1) Internal Rate of Return (IRR) is pre-tax and includes estimated well costs under current cost structure, LOE and gathering tariffs
anticipated for each prospect. Assumes Dawn is on par with NYMEX.
(2) Northern Access 2016 FT cost reflects $0.70 per Dth reservation charge and assumes approximately $0.06 per Dth of variable fees
(commodity, fuel, etc.) While Seneca has consistently driven down
its well costs and break-even economics … …
near-term development pace modified to achieve value-added returns on investments NA 2016 1-year Delay $0.76 Appalachia $2.68 $1.92 $1.50 $2.00 $2.50 $3.00 $3.50 NYMEX Futures Strip (2/2/16) CRV Break-even Realized Price (1) Realized Price Required for 15% IRR |
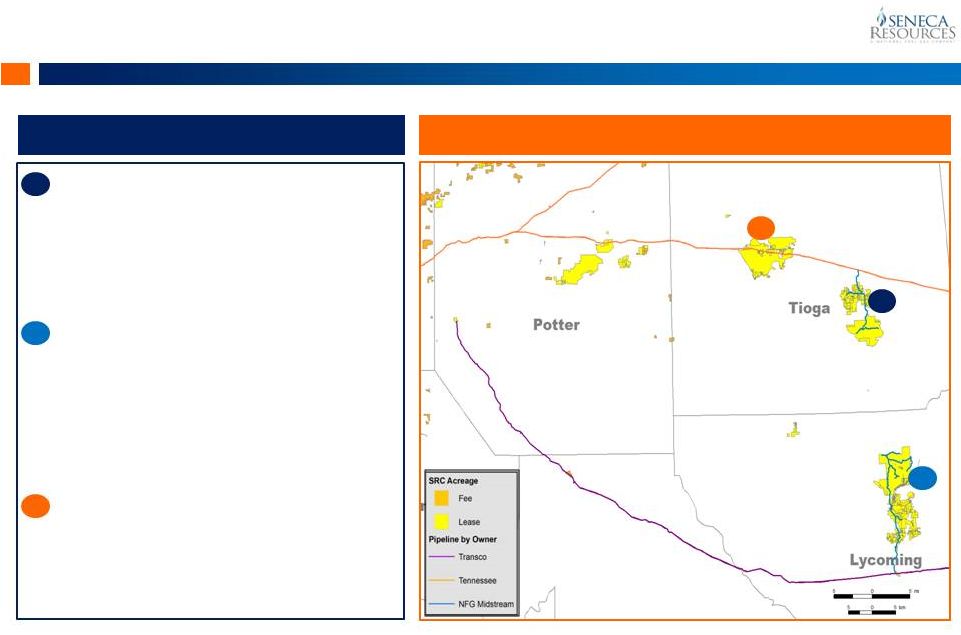 Marcellus Shale: Eastern Development Area
17 (1) One well included in the total for both Tract 595 and Tract 100 is drilled into and producing from the Geneseo
Shale. EDA Acreage –
70,000 Acres 1 2 3 EDA Highlights 1 Covington & DCNR Tract 595 o Tioga County, Pa. o 92 wells (1) with 110 MMcf/d productive capacity o 75 MMcf/d firm sales/FT in FY16 o NFG Covington Gathering System o Opportunity for future Geneseo & Utica dev. DCNR Tract 100 & Gamble o Lycoming County, Pa. o 61 wells (1) with 240 MMcf/d productive capacity o 130-185 MMcf/d firm sales/FT in FY16 o Atlantic Sunrise capacity (190 MDth/d) in FY18 o NFG Trout Run Gathering System o Geneseo to provide additional 100-120 locations DCNR Tract 007 o Tioga County, Pa. o 1 Utica and 1 Marcellus exploration well o Utica well 24 IP = 22.7 MMcf/d o Utica Resource potential = ~1 Tcf 2 3 Exploration & Production Appalachia |
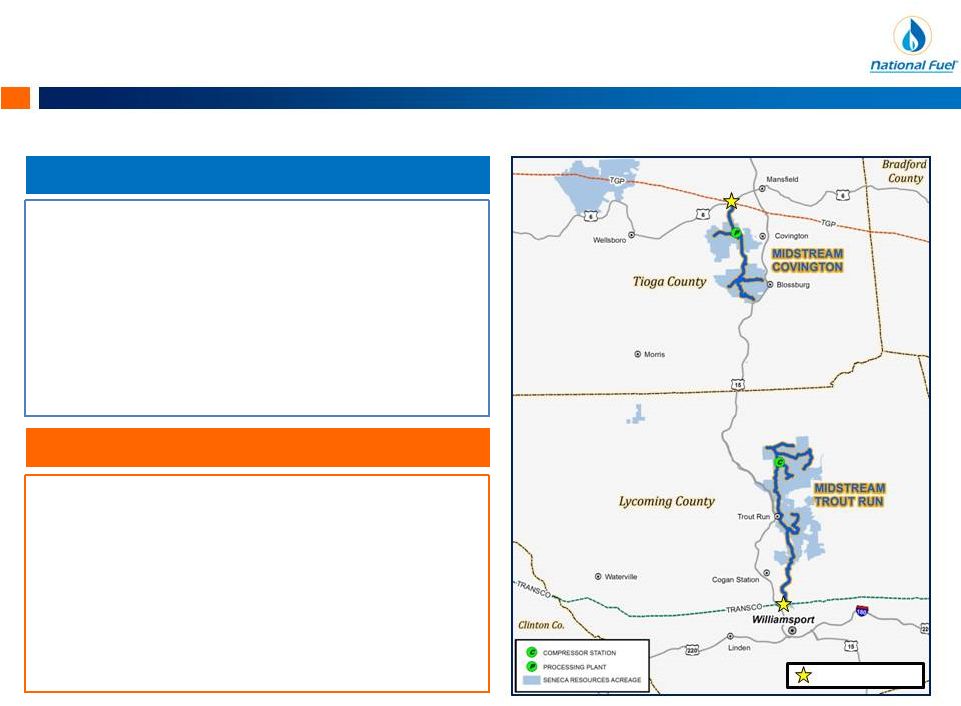 Integrated EDA Development -
Gathering 18 • In-Service Date: November 2009
• Capital Expenditures (to date): $33 Million • Capacity: 220,000 Dth per day • Production Source: Seneca Resources – Tioga Co. (Covington and DCNR Tract 595 acreage) • Interconnect: TGP 300 • Facilities: Pipelines and dehydration
• Future third-party volume opportunities Interconnects • In-Service Date: May 2012 • Capital Expenditures (to date): $166 Million
• Capacity: 466,000 to 585,000 Dth per day
• Production Source: Seneca Resources – Lycoming Co. (DCNR Tract 100 and Gamble acreage) • Interconnect: Transco – Leidy Lateral • Facilities: Pipelines, compression, and dehydration
• Future third-party volume opportunities Covington Gathering System Trout Run Gathering System Gathering Segment Supporting Seneca’s EDA Production & Future Development
Gathering Appalachia |
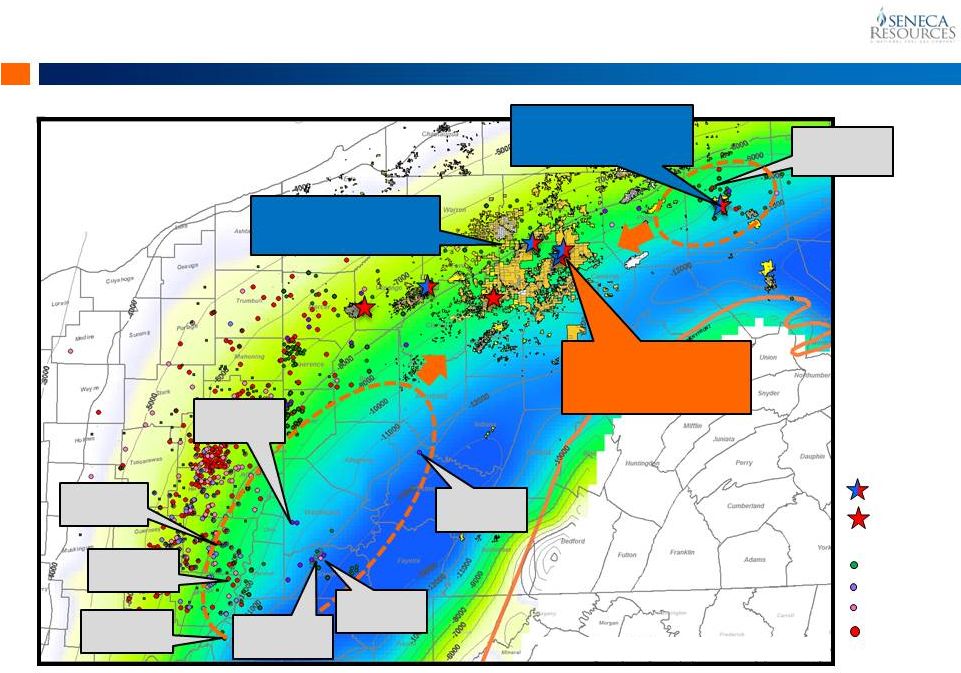 Utica/Point Pleasant: Industry Activity
19 Range 59 MMcf/d Rice 42 MMcf/d Shell 26.5 MMcf/d Permitted Drilling Completed Production Seneca Vert. Seneca Horiz. EQT 73 MMcf/d Color-filled contours are Trenton TVDSS; CI = 1000’ Seneca – Mt. Jewett IP: 8.9 MMcf/d CNX 61 MMcf/d MHR 46 MMcf/d Seneca – WDA 2 Utica Test Wells Planned for FY16/17 Seneca - DCNR 007 IP: 22.7 MMcf/d CNX 61.9 MMcf/d CNX 44 MMcf/d Appalachia Exploration & Production |
 Exploration & Production
Appalachia Exploration & Production Appalachia Exploration & Production 20 32.8 Bcf 150 – 180 Bcfe 59.4 Bcf 29.3 Bcf 4.9 Bcf 0 - 30 Bcf ~21 Bcfe 2.5 Bcf (3) 129 – 159 Bcf 0 50 100 150 200 250 Q1 East Division Production Firm Sales + Hedges Fixed Price Firm Sales NYMEX Firm Sales (No Hedge) Spot Sales Production Total Appalachia West Coast (CA) Total Seneca Production Remaining FY16 Production with Price Certainty 88.7 Bcf Realizing ~$3.25/Mcf (1) 4.9 Bcf of Additional Basis Protection (2) Appalachia Productive Capacity Seneca Total Productive Capacity (1) Average realized price reflects uplift from financial hedges less fixed differentials under firm sales contracts and firm transportation
costs. (2)
Indicates firm sales contracts with fixed index differentials to NYMEX but not
backed by a matching NYMEX financial hedge. (3)
Represents 2.5 Bcf of non-operated production from Western Development Area
. FY 2016 Production -
Firm Sales & Spot Exposure |
 Exploration & Production
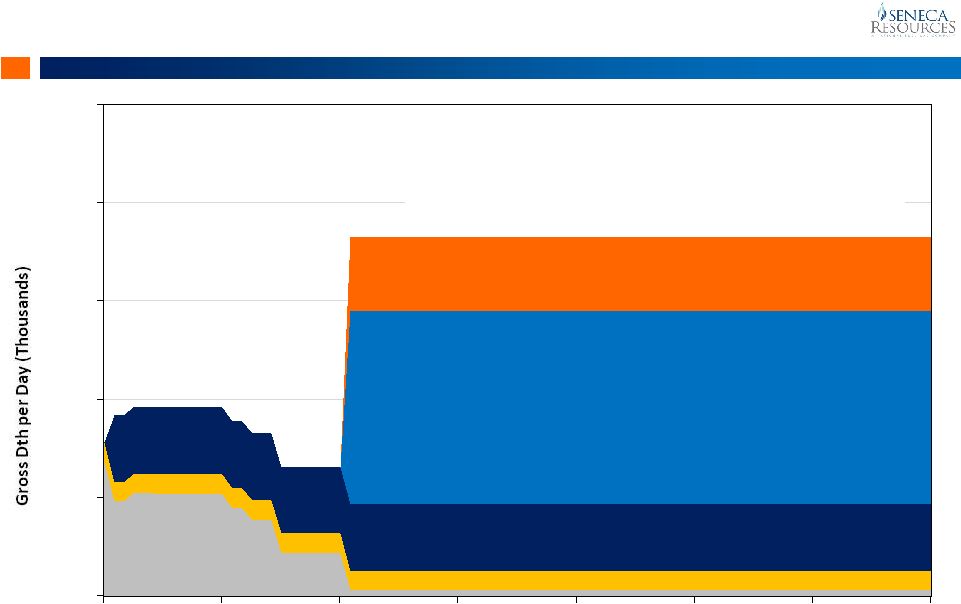
Appalachia - 250 500 750 1,000 1,250 2016 2017 2018 2019 2020 2021 2022 2023 Fiscal Year Start Significant Base of Long-Term Firm Contracts 21 Atlantic Sunrise (Transco) Delivery Markets: Mid-Atlantic & Southeast U.S. 189,405 Dth/d Northern Access 2016 (NFG (1) , TransCanada & Union) Delivery Markets: Canada-Dawn & NY-TGP200 490,000 Dth/d Niagara Expansion (TGP & NFG) Delivery Markets: Canada-Dawn & TETCO 170,000 Dth/d Firm Sales (2) 914,405 Dth per day Total Gross Firm Contracts by FY2018 (1) Includes capacity on both National Fuel Gas Supply Corp. and Empire Pipeline, Inc., both wholly owned subsidiaries of National Fuel Gas
Company. (2)
Includes base firm sales contracts not tied to firm transportation capacity.
Northeast Supply Diversification 50,000 Dth/d |
 Exploration & Production
Appalachia 28.5 29.5 20.4 11.4 14.1 12.7 19.0 22.1 30.4 32.9 8.0 5.8 92.0 97.2 30.2 17.2 4.9 0 50 100 150 FY 2016 FY 2017 FY 2018 FY 2019 FY 2020 NYMEX Dominion Dawn & MichCon Fixed Price Physical Sales Strong Hedge Book in Fiscal 2016 and 2017 22 FY 2016 = 78% hedged (1) at $3.53 per MMBtu Natural Gas Swap & Fixed Physical Sales Contracts (Million MMBtu) (3) (2) (2) (1) Assumes midpoint of natural gas production guidance, adjusted for year-to-date actual results. (2) For the remaining nine months ended September 30, 2016.
(3)
Fixed price physical sales exclude joint development partner’s share
of fixed price contract WDA volumes as specified under the joint development agreement. |
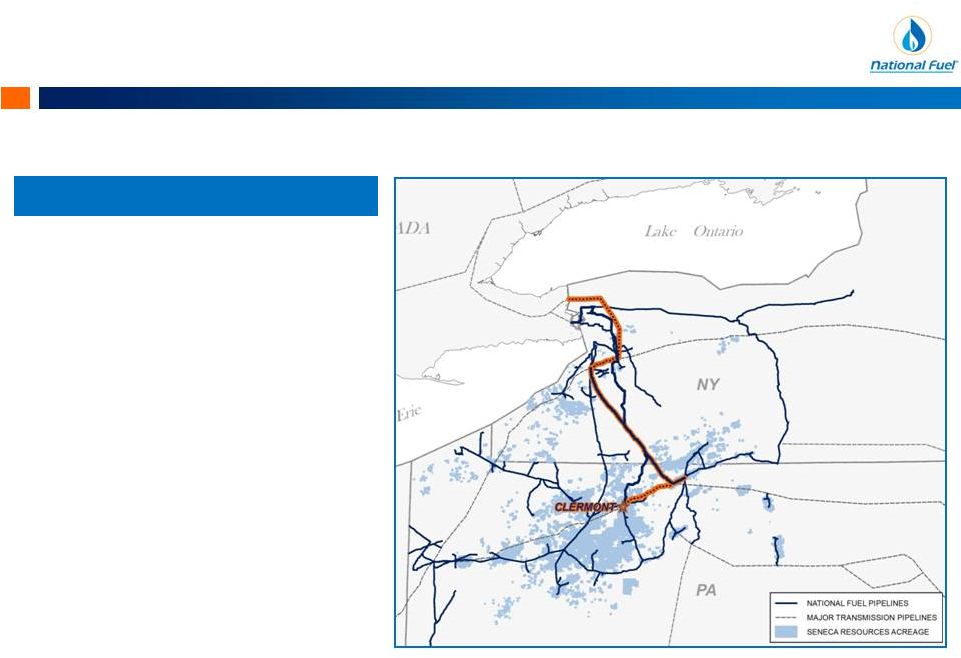
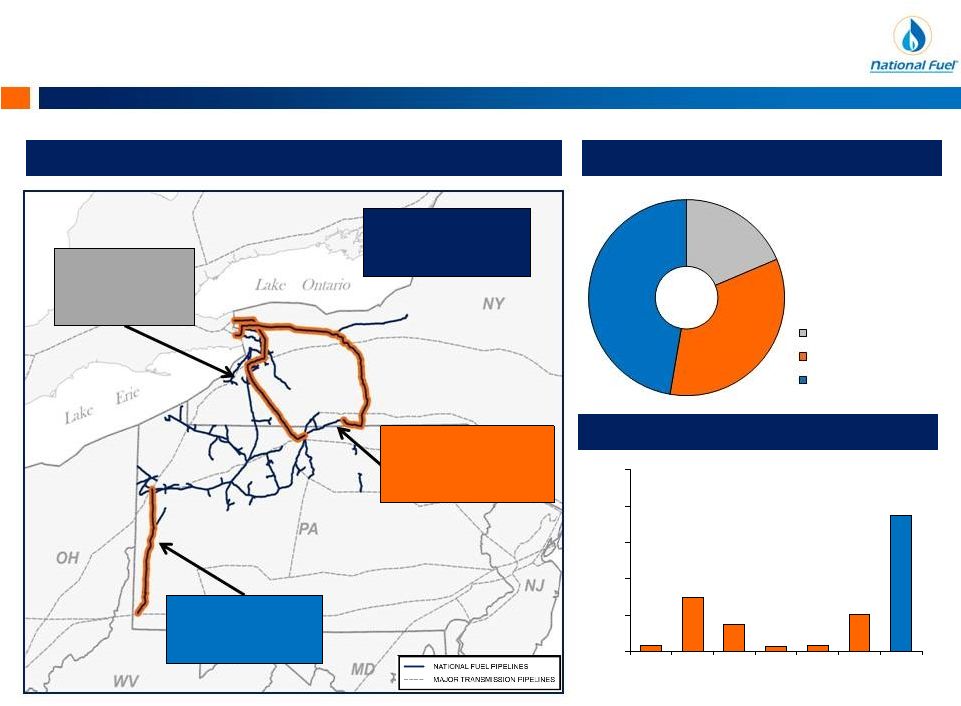
 Pipeline & Storage: Premier Appalachian Position
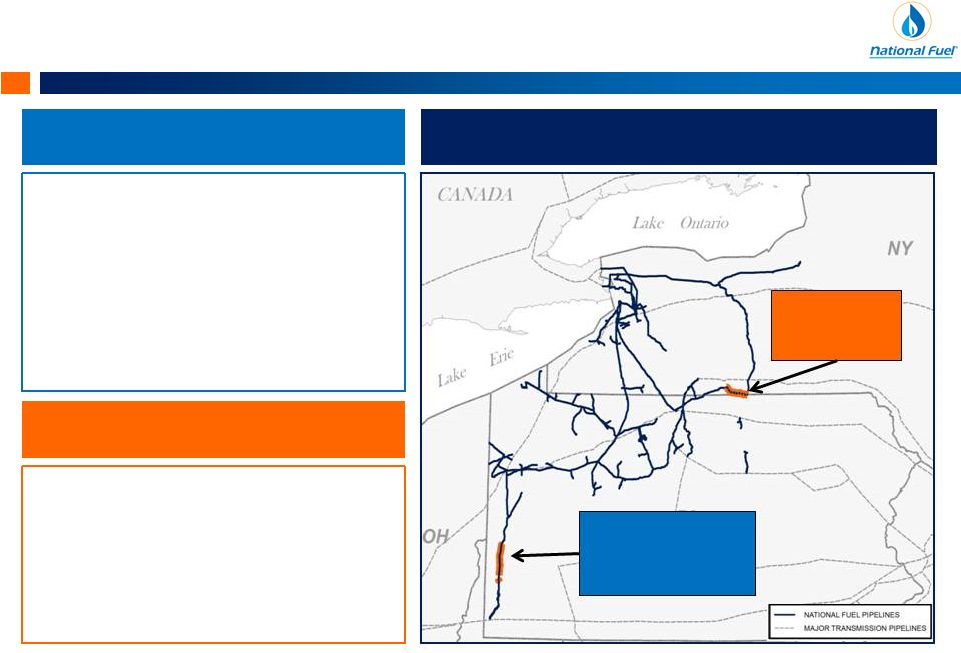
23 In addition to serving our own upstream and downstream subsidiaries, NFG is uniquely positioned to expand our regional pipeline systems and provide valuable outlets for 3 rd party producers and shippers in Appalachia Canada & Michigan New England & Northeast Midwest & Southeast Mid-Atlantic Appalachia Pipeline & Storage |
 Appalachia Pipeline & Storage Recent 3 rd Party Expansions Highly Successful 24 Expansions for 3 rd Parties since 2010 Line N Projects +633 MDth/d Northern Access 2012 +320 MDth/d Empire & Lamont Expansions +489 MDth/d 3 rd Party Expansion Capital Cost ($MM) Annual Expansion Revenues Added ($MM) $387 million since FY 2010 1,442 MDth/d since FY2010 $4 $37 $19 $4 $5 $25 ~$95 $0 $25 $50 $75 $100 $125 FY11 FY12 FY13 FY14 FY15 FY16E Cum. $72 $132 $183 Northern Access 2012 Empire & Lamont Line N Projects |
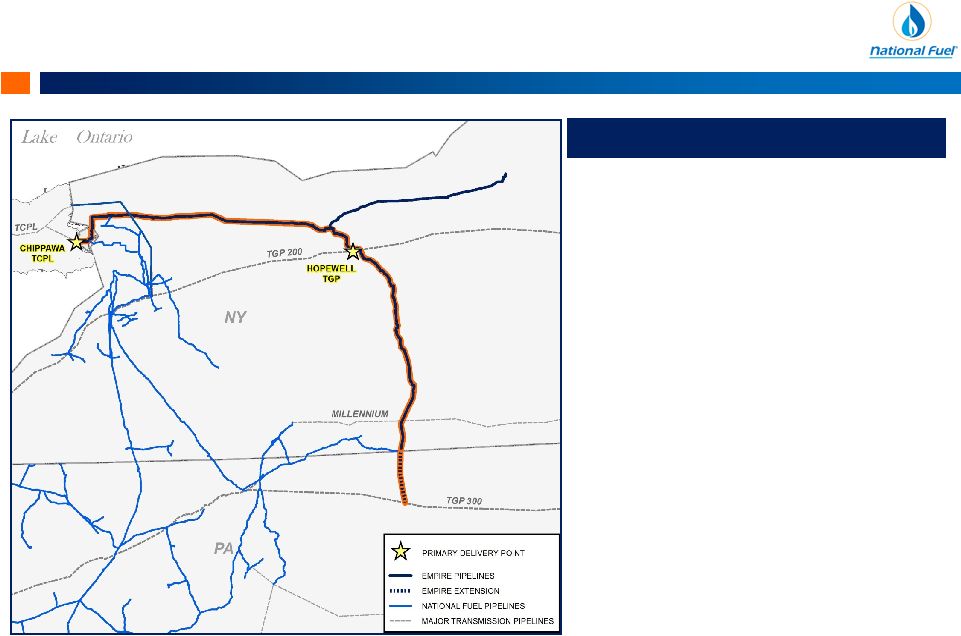 Appalachia Pipeline & Storage Planned Empire System Expansion 25 Empire North Expansion Project • Target In-Service: Late 2018 • System: Empire Pipeline • Target Market: o Marcellus & Utica producers in Tioga & Potter County, Pa. • Open Season Capacity: 300,000 Dth/d • Delivery Points: o 180,000 Dth/d to Chippawa (TCPL) o Up to 158,000 Dth/d to Hopewell (TGP) • Estimated Cost: $185 million • Major Facilities: o 3 new compressor stations • FERC Status: o Open Season concluded in Nov. 2015 o Preparing precedent agreements |
 Appalachia $111 $137 $161 $186 $188 $190 $10 $15 $30 $64 $69 $62 $121 $152 $191 $250 $257 $252 $0 $100 $200 $300 2011 2012 2013 2014 2015 TTM 12-31-2015 Fiscal Year Gathering Pipeline & Storage Midstream Businesses EBITDA 26 Note: A reconciliation of Adjusted EBITDA to Net Income as presented on the Consolidated Statement of Income and Earnings Reinvested in
the Business is included at the end of this presentation. |
 Downstream Overview
Utility | Energy Marketing
27 |
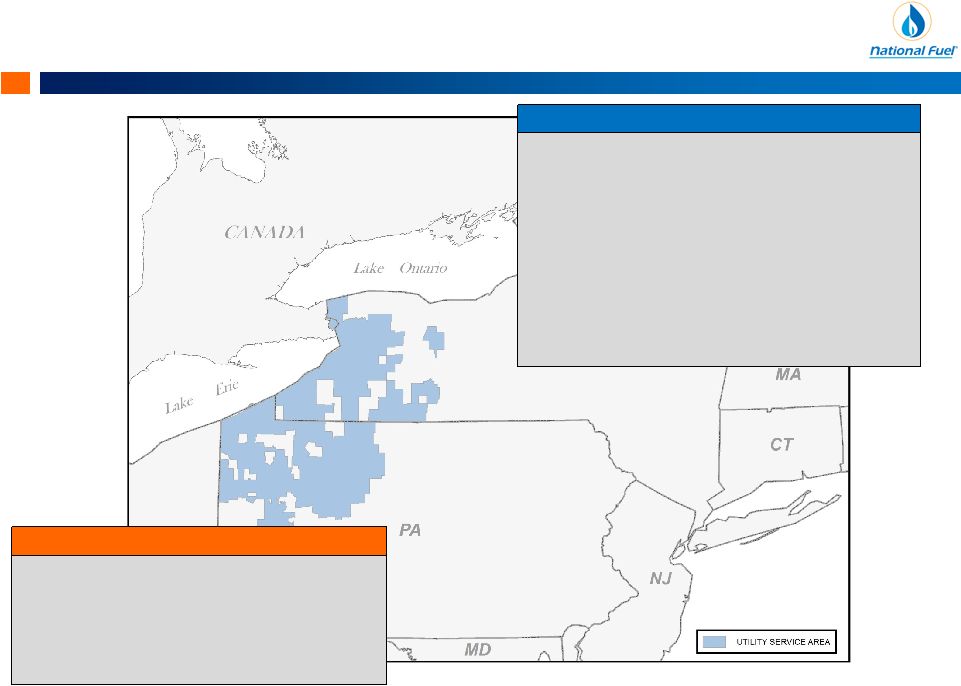 Downstream New York & Pennsylvania Service Territories 28 (1) As of September 30, 2015. New York Pennsylvania Total Customers (1) : 526,323 ROE: 9.1% (NY PSC Rate Case Settlement, May 2014)
Rate Mechanisms:
o Earnings Sharing o Revenue Decoupling o Weather Normalization o Low Income Rates o Merchant Function Charge (Uncollectibles Adj.) o 90/10 Sharing (Large Customers) Total Customers (1) : 213,652 ROE: Black Box Settlement (2007) Rate Mechanisms: o Low Income Rates o Merchant Function Charge |
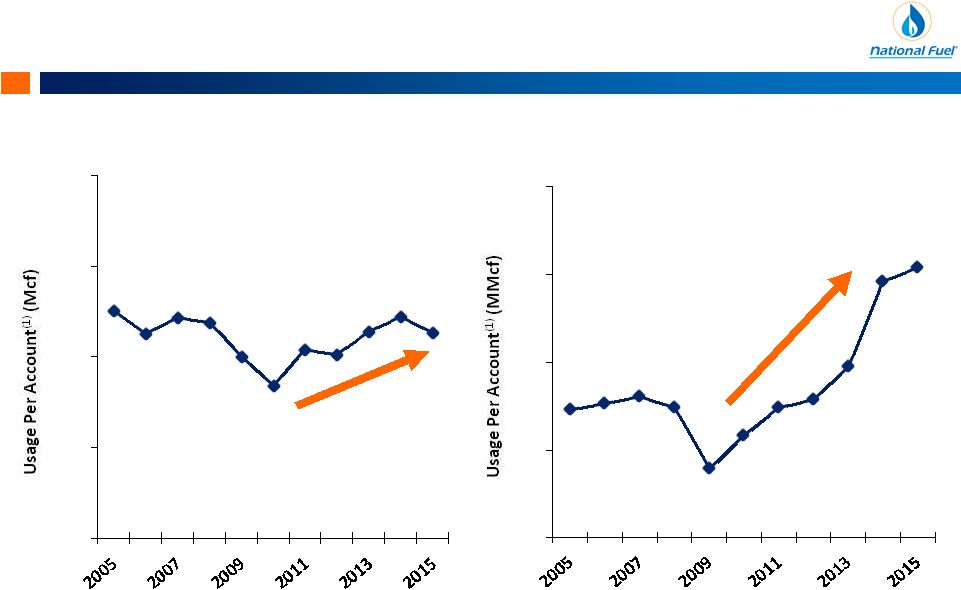 Downstream Utility: Shifting Trends in Customer Usage 29 (1) Weighted Average of New York and Pennsylvania service territories (assumes normal weather).
80 90 100 110 120 12-Months Ended December 31 20 25 30 35 40 12-Months Ended December 31 Residential Usage Industrial Usage |
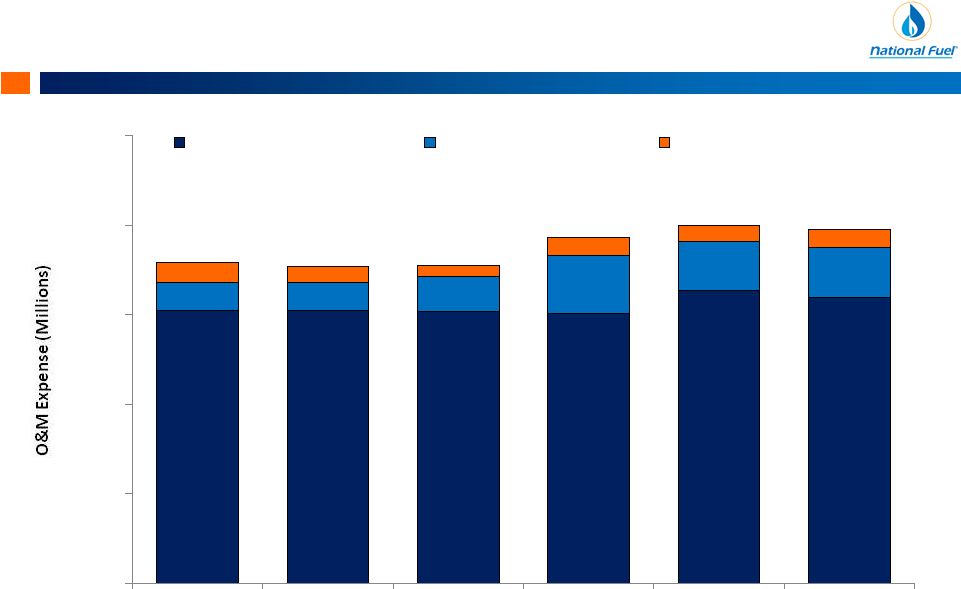 Downstream $152 $152 $152 $151 $163 $160 $16 $16 $20 $33 $28 $28 $11 $9 $6 $10 $9 $10 $179 $177 $178 $193 $200 $198 $0 $50 $100 $150 $200 $250 2011 2012 2013 2014 2015 12 Months ended 12/31/15 Fiscal Year All Other O&M Expenses O&M Pension Expense O&M Uncollectible Expense A Proven History of Controlling Costs 30 (1) $10 million of increase in pension costs from fiscal 2013 primarily due to the NY PSC rate case settlement in May
2014. (1) |
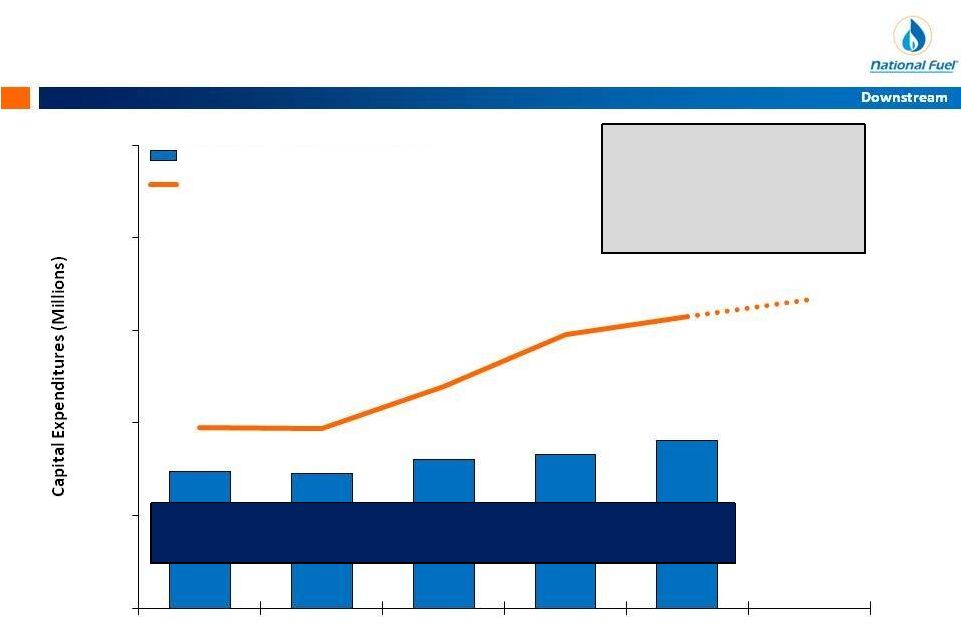 Downstream The Utility remains focused on maintaining the ongoing safety and reliability of its system Utility: Strong Commitment to Safety 31 Near-term increase due to ~$60MM upgrade of the Utility’s Customer Information System and anticipated acceleration of pipeline replacement program $44.3 $43.8 $48.1 $49.8 $54.4 $58.4 $58.3 $72.0 $88.8 $94.4 $95 - $105 0 30 60 90 120 150 2011 2012 2013 2014 2015 2016E Fiscal Year Capital Expenditures for Safety Total Capital Expenditures |
 32 32 California Exploration & Production |
 California: Stable Production; Modest Growth
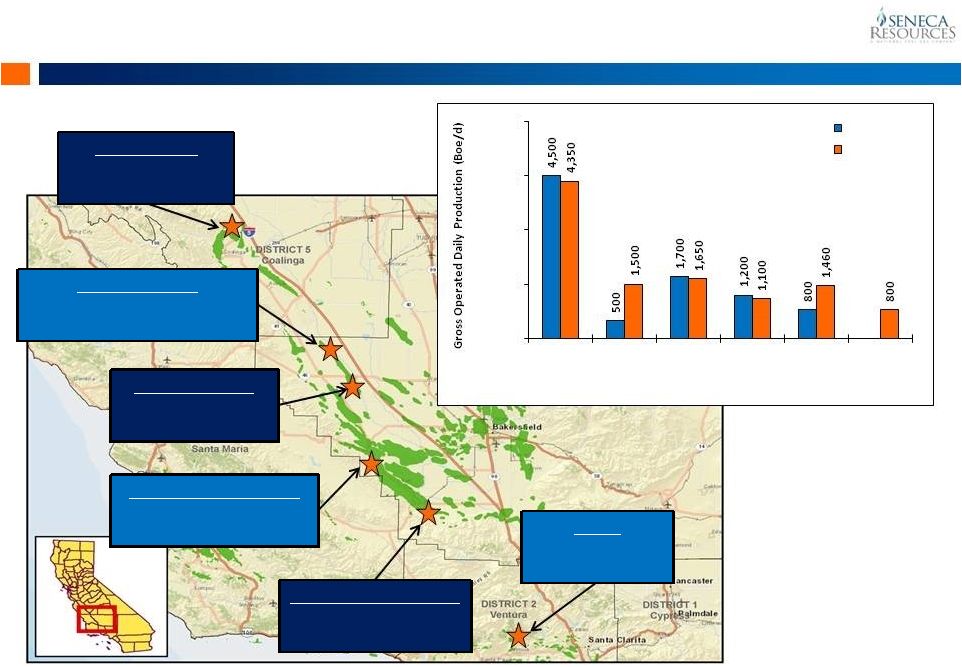
33 East Coalinga Temblor Formation Primary North Lost Hills Tulare & Etchegoin Formation Primary/Steamflood South Lost Hills Monterey Shale Primary North Midway Sunset Tulare & Potter Formation Steamflood South Midway Sunset Antelope Formation Steamflood Sespe Sespe Formation Primary 0 1,500 3,000 4,500 6,000 North Midway Sunset South Midway Sunset South Lost Hills North Lost Hills Sespe East Coalinga FY 2010 FY 2015 Upstream |
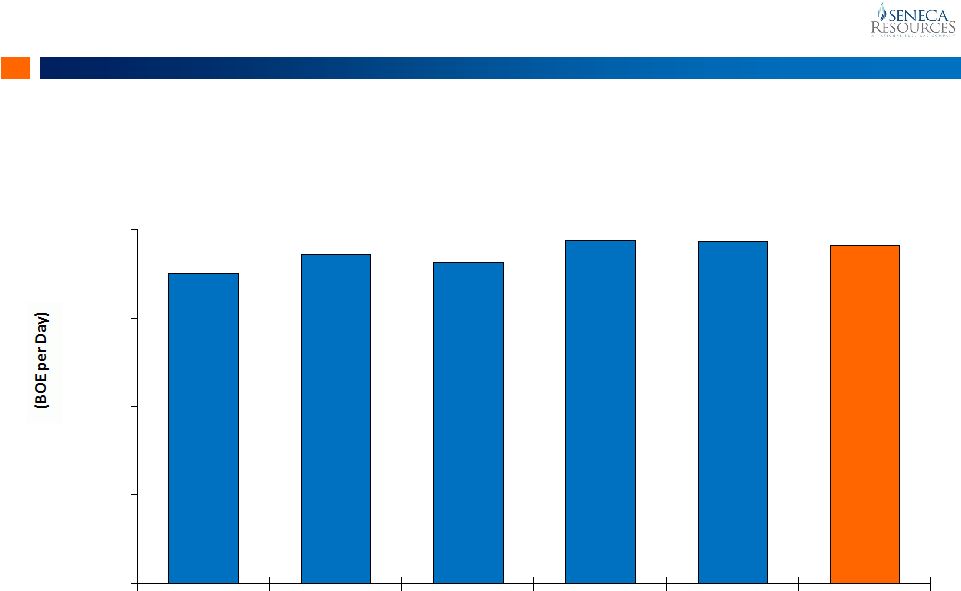 Upstream 8,773 9,322 9,078 9,699 9,674 9,560 0 2,500 5,000 7,500 10,000 2011 2012 2013 2014 2015 2016 Forecast Fiscal Year California Average Daily Net Production 34 $40-$50 Million Annual Capital Spending to Keep Production Flat |
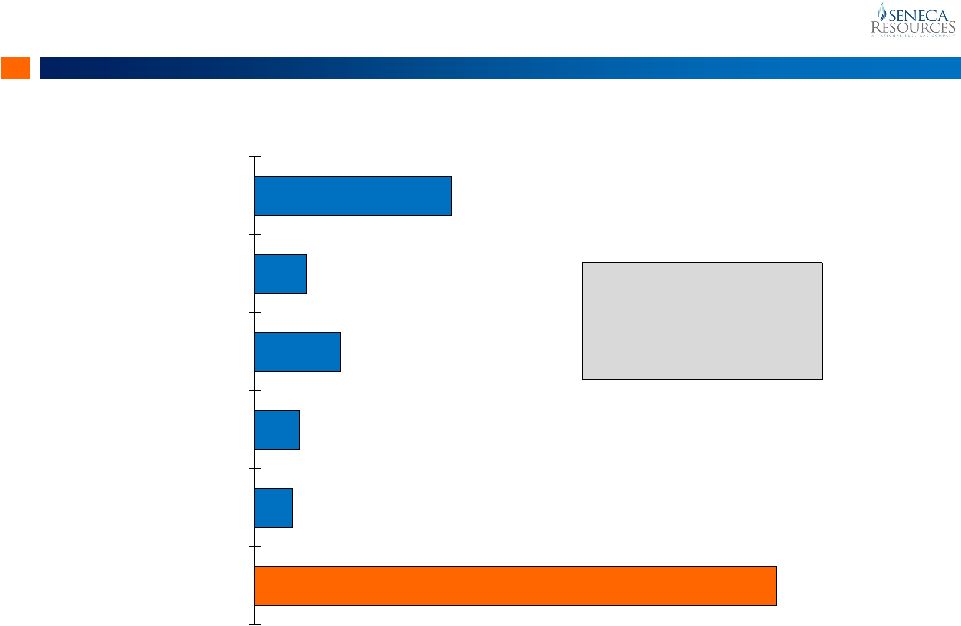 Upstream Strong Margins Support Significant Free Cash Flow 35 $12.74 $3.37 $5.56 $2.90 $2.44 $33.83 Non-Steam Fuel LOE Steam Fuel G&A Production & Other Taxes Other Operating Costs Adjusted EBITDA West Division Adjusted EBITDA per BOE (1) Trailing 12-months Ended 12/31/15 DD&A Average Revenue for TTM 12/31/15 (1) $60.84 per BOE (1) Average revenue per BOE includes impact of hedging and other revenues. Note: A
reconciliation of Adjusted EBITDA margin to Net Income as presented on the Consolidated Statement of Income and Earnings
Reinvested in the Business is included at the end of this
presentation. EBITDA per BOE includes Seneca corporate results and eliminations. |
 Consolidated Financial Overview
Upstream | Midstream | Downstream
36 |
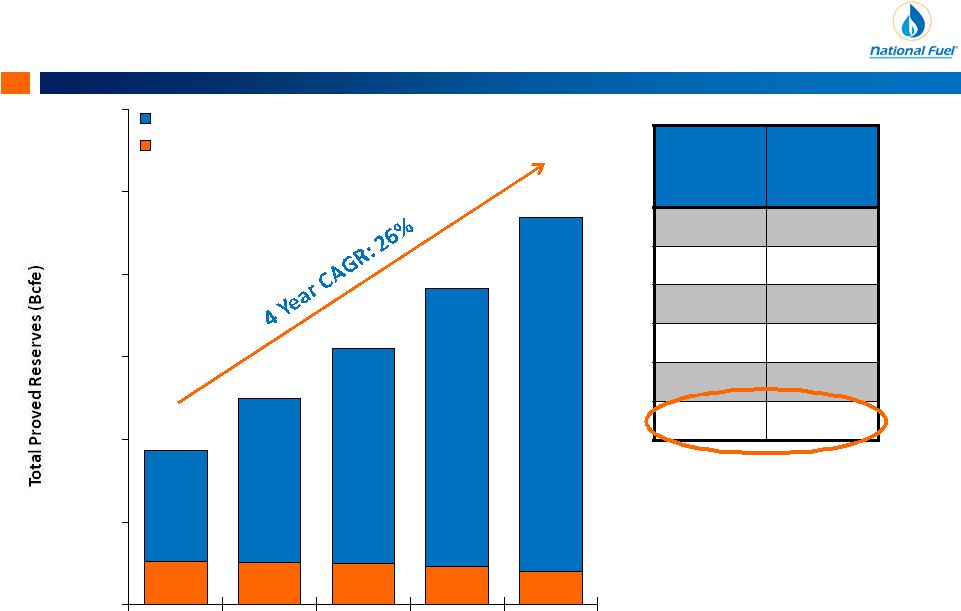 Corporate Appalachia Driving Proved Reserve Growth 37 43.3 42.9 41.6 38.5 33.7 675 988 1,300 1,683 2,142 935 1,246 1,549 1,914 2,344 0 500 1,000 1,500 2,000 2,500 3,000 2011 2012 2013 2014 2015 At September 30 Natural Gas (Bcf) Crude Oil (MMbbl) Fiscal Years 3-Year F&D Cost (2) ($/Mcfe) 2008-2010 $2.37 2009-2011 $2.09 2010-2012 $1.87 2011-2013 $1.67 2012-2014 $1.38 2013-2015 $1.12 • 2015 F&D Cost = $0.96 • Marcellus F&D: $0.79 • 373% Reserve Replacement Rate • 65% Proved Developed (1) (1) Includes approximately 150 Bcf of natural gas PUD reserves in Clermont/Rich Valley that will be transferred in fiscal 2016 as interests
in the joint development wells are conveyed to the partner. (2) Represents a three-year average U.S. finding and development cost. |
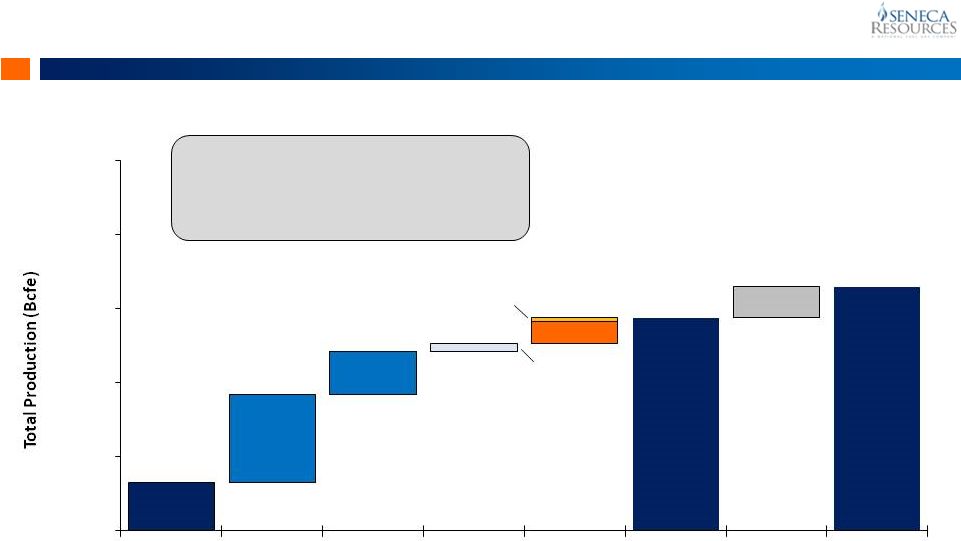
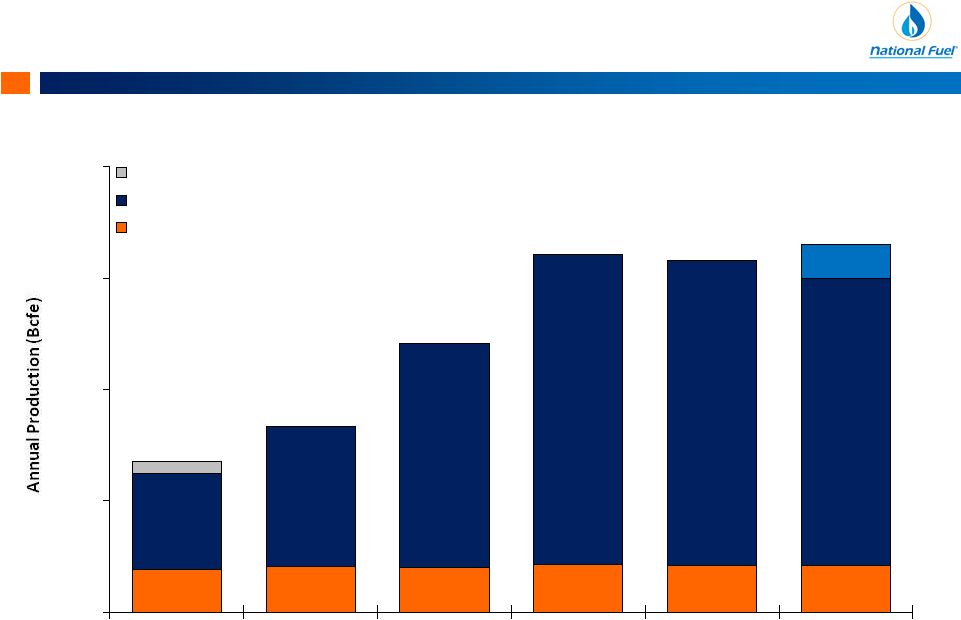 Corporate Seneca Production 38 (1) Refer to slide 20 for additional details on fiscal 2016 firm sales and local Appalachian spot market exposure.
19.2 20.5 20.0 21.2 21.2 ~21 43.2 62.9 100.7 139.3 136.6 129.0 Appalachia Spot Sales 67.6 83.4 120.7 160.5 157.8 150 – 180 Bcfe 0 50 100 150 200 2011 2012 2013 2014 2015 2016E Fiscal Year Gulf of Mexico (Divested in 2011) Appalachia Division West Coast Division (1) |
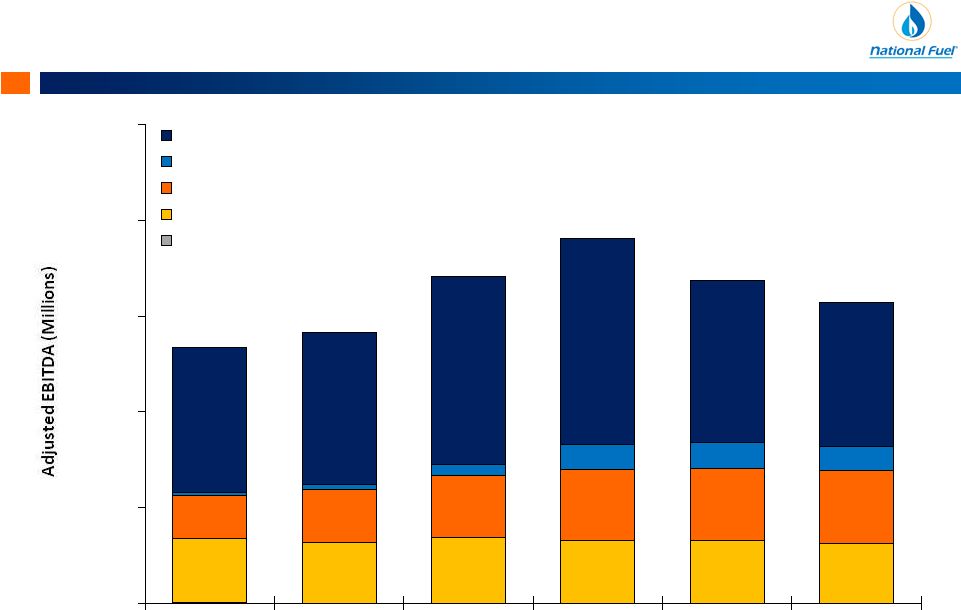 Corporate $169 $160 $172 $165 $164 $157 $111 $137 $161 $186 $188 $190 $64 $69 $62 $377 $397 $492 $539 $422 $378 $668 $704 $852 $953 $843 $785 $0 $250 $500 $750 $1,000 $1,250 2011 2012 2013 2014 2015 TTM 12/31/15 Fiscal Year Exploration & Production Segment Gathering Segment Pipeline & Storage Segment Utility Segment Energy Marketing & Other EBITDA Contribution by Segment 39 Note: A reconciliation of Adjusted EBITDA to Net Income as presented on the Consolidated Statement of Income and Earnings Reinvested in
the Business is included at the end of this presentation. |
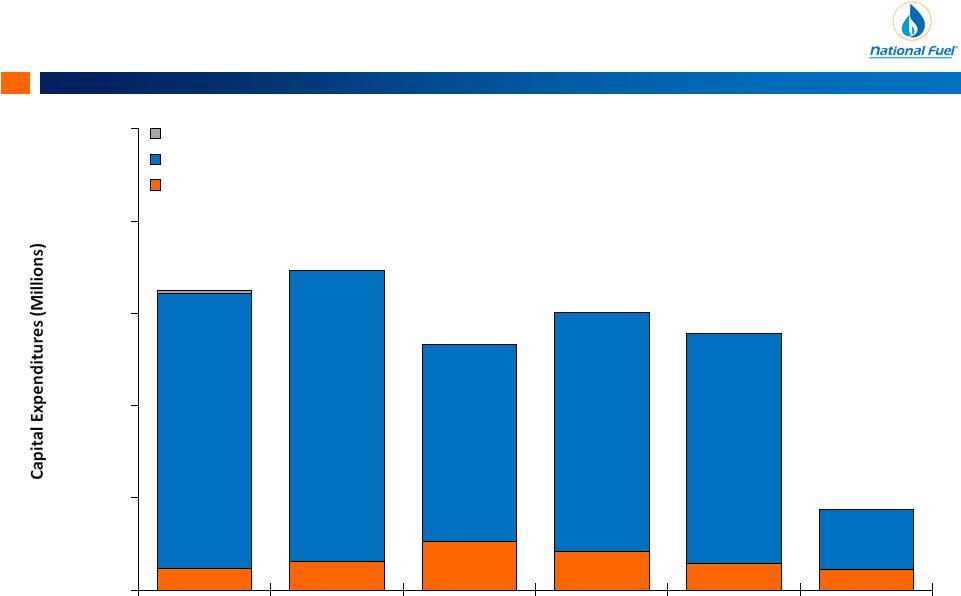
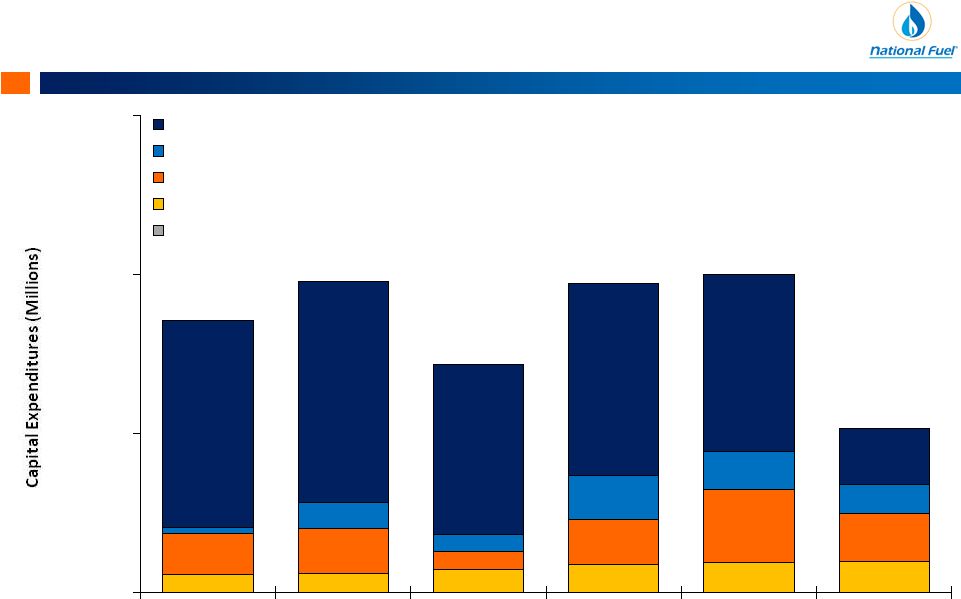 Corporate $58 $58 $72 $89 $94 $95-$105 $129 $144 $56 $140 $230 $125-$175 $80 $55 $138 $118 $85-$95 $649 $694 533 $603 $557 $150-$200 $854 $977 $717 $970 $1,001 $455- $575 $0 $500 $1,000 $1,500 2011 2012 2013 2014 2015 2016E Fiscal Year Exploration & Production Segment Gathering Segment Pipeline & Storage Segment Utility Segment Energy Marketing & Other Capital Expenditures by Segment 40 (1) (1) FY2016 capital expenditure guidance reflects the netting of up-front proceeds received from joint development partner for capital
spent on wells drilled and/or completed prior to the execution date of the joint development agreement. The E&P segment’s FY16 capital budget would be reduced by an additional $90-$110 million if
joint development partner exercises right to participate in remaining 38 wells. Note: A reconciliation to Capital Expenditures as presented on the Consolidated Statement of Cash Flows is included at the end of this
presentation. |
 Corporate Financial Position & Liquidity 41 Note: A reconciliation of Adjusted EBITDA to Net Income is included at the end of this presentation.
Total Debt 54% $3.9 Billion Total Capitalization as of December 31, 2015 Debt/Adjusted EBITDA Capitalization Debt Maturity Profile ($MM) Liquidity Committed Credit Facilities Short-term Debt Outstanding Available Short-term Credit Facilities Cash Balance at 12/31/15 Total Liquidity at 12/31/15 $ 1,250 MM $ 31 MM $ 1,219 MM $ 36 MM $ 1,255 MM Total Equity 46% 1.75 x 1.89 x 1.89 x 1.77 x 2.27 x 2.52 x 2011 2012 2013 2014 2015 TTM
12-31-15
Fiscal Year $300 $250 $500 $549 $500 $0 $200 $400 $600 |
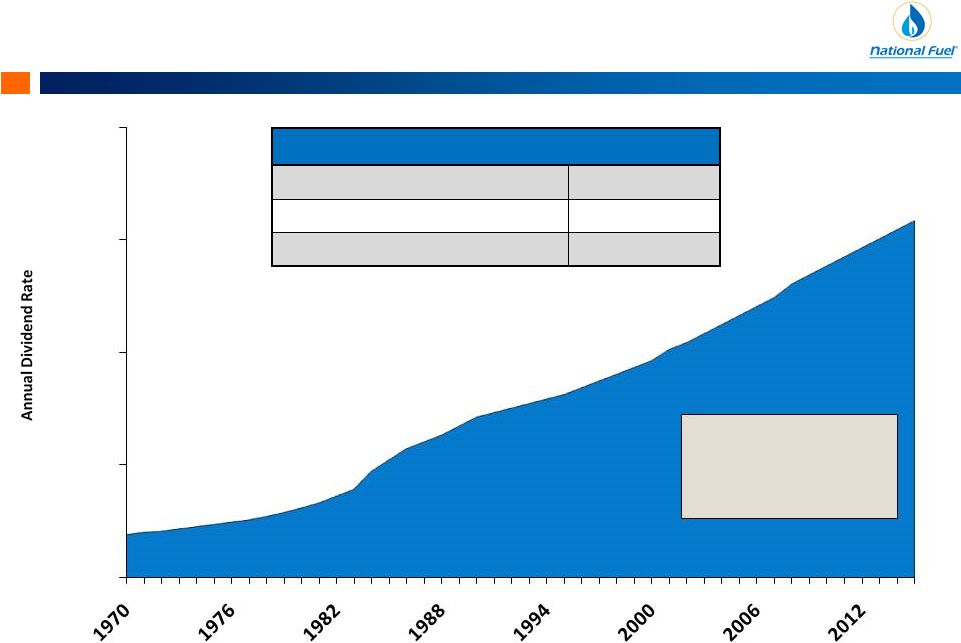 Corporate Dividend Track Record 42 (1) As of February 3, 2016. Current Dividend Yield (1) 3.4% Dividend Consistency Consecutive Dividend Payments 113 Years Consecutive Dividend Increases 45 Years Current Annualized Dividend Rate $1.58 per Share $0.00 $0.50 $1.00 $1.50 $2.00 Annual Rate at Fiscal Year End |
 Appendix 43 43 |
 Appendix 2015 Pipeline Expansion Projects In-Service 44 Westside Expansion & Modernization In-Service (October 2015) Tuscarora Lateral In-Service (November 2015) 2015 Completed Pipeline Expansion Projects • Total Cost: $60.0 million • Incremental annual revenues of $10.9 million on 49,000 Dth per day capacity • Preserves $16.1 million in annual revenues on existing FT (192,500 Dth/d) and retained storage (3.3 Bcf) services • Total Cost: $86 million o Expansion: $45 million o Modernization: $41 million • Incremental Annual Revenues: $8.8 million • Capacity: 175,000 Dth per day o Range Resources (145,000 Dth/d) o Seneca Resources (30,000 Dth/d) Tuscarora Lateral Westside Expansion & Modernization |
 Appendix Total Seneca Capital Spending by Division 45 $47 $63 $105 $83 $57 $40-$50 $596 $631 $428 $520 $500 $110- $150 $649 $694 $533 $603 $557 $150 - $200 $0 $200 $400 $600 $800 $1,000 2011 2012 2013 2014 2015 2016E Fiscal Year Gulf of Mexico (Divested in 2011) Appalachia West Coast (California) (2) (1) (1) FY2016 capital expenditure guidance reflects the netting of up-front proceeds received from joint development partner for capital
spent on wells drilled and/or completed prior to the execution date of the joint development agreement. The FY16 capital budget would be reduced by an additional $90-$110 million if joint development partner
exercises right to participate in remaining 38 wells.
(2) Seneca’s West Coast division includes Seneca corporate and eliminations. |
 Exploration & Production
Appalachia Marcellus Operated Well Results 46 EDA Development Wells: Area Producing Well Count Average IP Rate (MMcfd) Average 30-Day (MMcf/d) Average Treatable Lateral Length (ft) Covington Tioga County 47 5.2 4.1 4,023’ Tract 595 Tioga County 44 (2) 7.4 4.9 4,754’ Tract 100 Lycoming County 57 (2) 16.8 12.6 5,270’ Area Producing Well Count Average IP Rate (MMcfd) Average 30-Day (MMcf/d) Average Treatable Lateral Length (ft) Clermont/Rich Valley (CRV) & Hemlock Elk, Cameron & McKean counties 56 (1) 7.5 5.7 (1) 6,823’ WDA Development Wells: (1) Excludes 2 wells now operated by Seneca that were drilled by another operator as part of a joint-venture. 30-day average
excludes 2 wells that have not been on line 30 days. (2) Does not include 1 well drilled into and producing from the Geneseo Shale. |
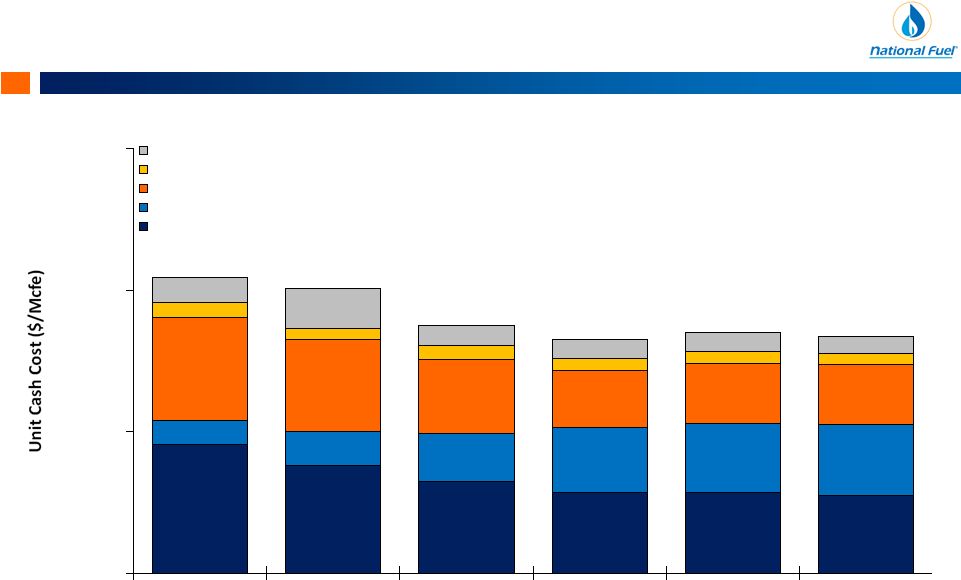 Appendix $0.91 $0.76 $0.65 $0.57 $0.57 $0.55 $0.17 $0.24 $0.34 $0.46 $0.49 $0.50 $0.73 $0.65 $0.52 $0.40 $0.42 $0.43 $0.18 $0.28 $0.14 $0.13 $0.13 $0.13 $2.09 $2.01 $1.74 $1.65 $1.70 ~$1.68 $0.00 $1.00 $2.00 $3.00 2011 2012 2013 2014 2015 2016E Fiscal Year Property, Franchise & Other Taxes Other O&M Expense General & Administrative Expense Lease Operating & Transportation Expense (Gathering Only) Lease Operating & Transportation Expense (Excl. Gathering) Highly Competitive Cost Structure 47 (1) (2) (2) (3) (1) (2) (2) (1) Represents the midpoint of General & Administrative Expense guidance of $0.40 to $0.45 per Mcfe for fiscal 2016. (2) The total of the two LOE components represents the midpoint of LOE guidance of $1.00 to $1.10 per Mcfe for fiscal 2016. (3) The cost of firm transportation is reflected in price realizations (a deduction to gross revenues). As such, it is not included in LOE. |
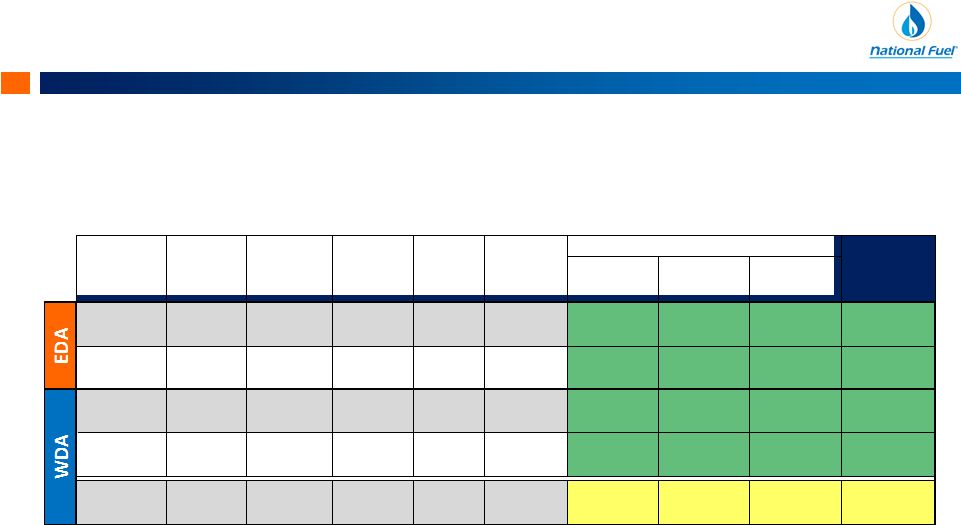  Appendix Marcellus Shale Program Economics ~1,200 WDA Locations Economic Below $2.50/MMBtu $3.25 IRR % (1) $3.00 IRR % (1) $2.75 IRR % (1) DCNR 100 Dry Gas 12 5,400 13-14 1033 78% 59% 43% $1.57 Gamble Dry Gas 44 4,600 11-12 1033 47% 35% 22% $1.83 CRV Dry Gas 72 8,800 10-11 1045 32% 23% 17% $1.92 Hemlock / Ridgway Dry Gas 662 8,800 8-9 1045 - 1110 23% 16% 11% $2.14 Remaining Tier 1 Dry Gas 423 8,500 7-8 1030 - 1110 21% 14% 10% $2.31 15% IRR (1) Realized Price NYMEX / DAWN Pricing Prospect Product Locations Remaining to Be Drilled Completed Lateral Length (ft) Average EUR (Bcf) BTU (1) Internal Rate of Return (IRR) is pre-tax and includes estimated well costs under current cost structure, LOE, and Gathering tariffs
anticipated for each prospect. 48
|
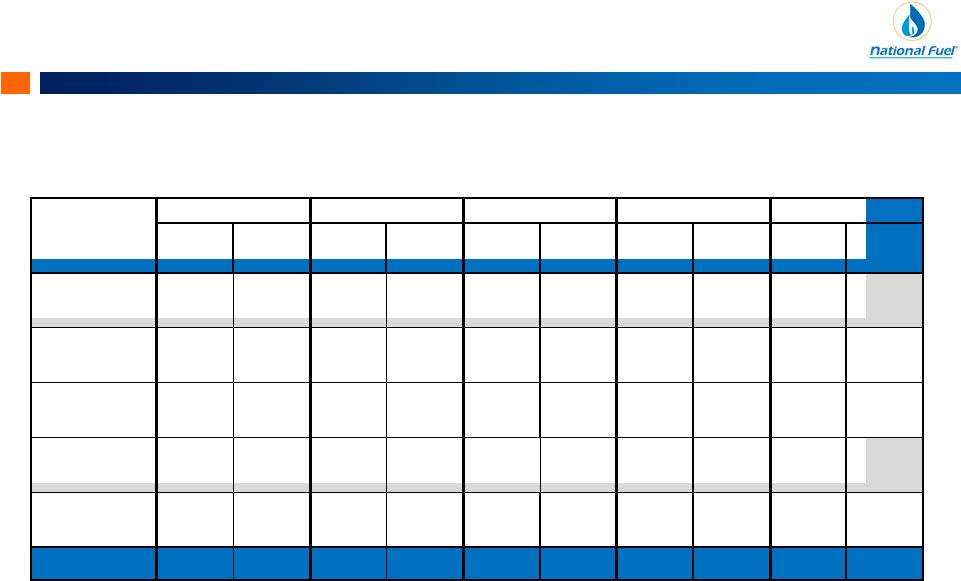
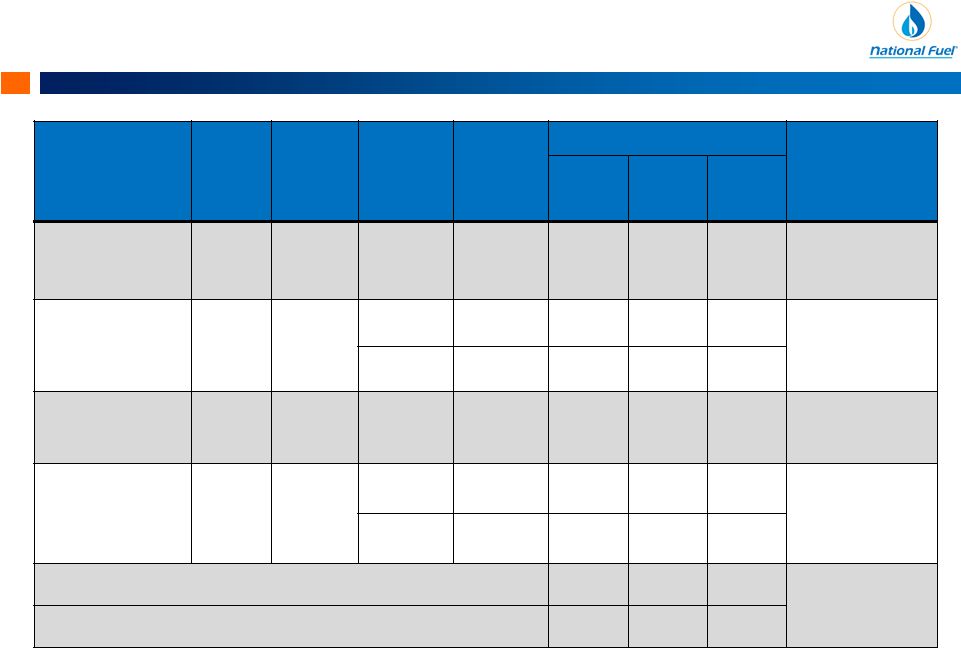 Appendix Firm Transportation Portfolio 49 (1) A large majority of the executed firm sales agreements continue for the remainder of the firm transportation contract
term. (2)
Excludes throughput-based commodity charges, fuel charges and other
surcharges. Project
(Counterparty) In- Service Date Contract Term Delivery Market Demand Charge ($/Dth) Gross FT Capacity (Dth/day) Matched Firm Sales Contracts Fiscal 2016 Fiscal 2017 Fiscal 2018 Northeast Supply Diversification Project (TGP) Nov. 2012 15 years Canada $0.49 50,000 50,000 50,000 Executed Contracts 50,000 Dth/d for 10 years Niagara Expansion (TGP & NFG) Nov. 2015 15 years Canada $0.67 158,000 158,000 158,000 Executed Contracts 140,000 Dth/d for 15 years TETCO $0.12 12,000 12,000 12,000 Atlantic Sunrise (Transco) Sept. 2017 15 years Mid- Atlantic/ Southeast $0.73 --- --- 189,405 Executed Contracts 189,405 Dth/d for first 5 years (1) Northern Access 2016 (NFG/ TransCanada/ Union) Nov. 2017 15 years Canada $0.70 --- --- 350,000 Executed Contracts 145,000 Dth/d For first 3 years TGP 200 (NY) $0.38 --- --- 140,000 Total Firm Transportation Capacity 220,000 220,000 899,405 Weighted Average Transportation Charge per Dth (2) $0.59 $0.60 $0.63 |
 Appendix 219,698 Plus $0.07 178,098 Less: $0.01 178,098 Less: $0.01 65,000 Less: $0.55 50,000 Less: $0.33 50,000 Less: $0.33 25,000 Less: $0.02 65,000 Less: $0.01 65,000 Less: $0.01 160,000 $2.78 175,000 $2.61 175,000 $2.61 469,698 468,098 468,098 0 200,000 400,000 600,000 Q2 Q3 Q4 Fixed Price Dawn Dominion SP NYMEX Firm Sales Provide Market for Appalachian Production 50 (1) Reflects gross firm sales volumes before impact of lease royalties in EDA or net revenue interests assigned to joint
development partner on certain contracts in WDA.
(2) Values shown represent the price or differential to a reference price (netback price) at the point of sale.
WDA (1) 209,600/d 263,000/d 263,000/d EDA (1) 260,098/d 205,098/d 205,098/d Fiscal 2016 Firm Sales by Fiscal Quarter Pricing Index Key: EDA/WDA Split: Gross Contracted Volumes (Dth per day) (1) Contracted Index Price Differentials ($ per Dth) (2) |
 Exploration & Production
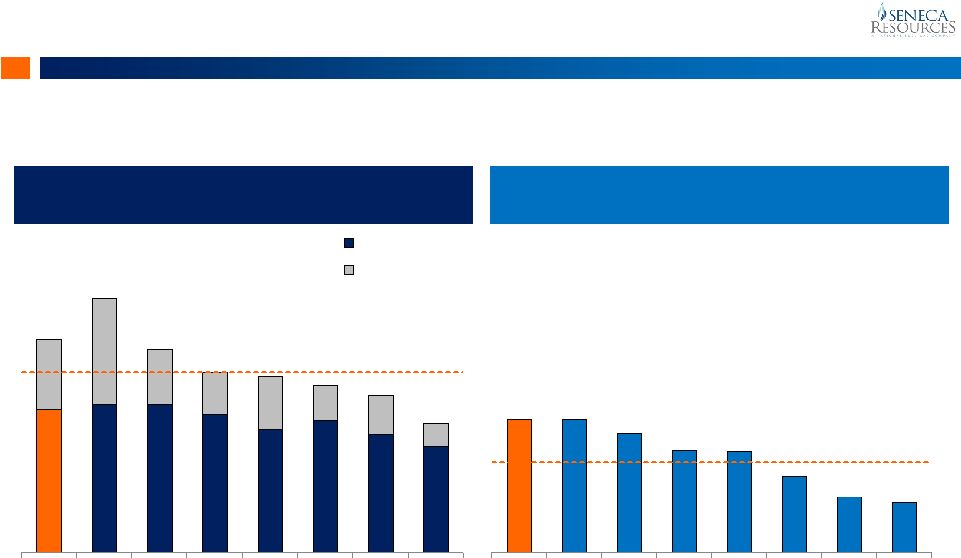
Appalachia $3.35 $3.99 $3.18 $2.83 $2.77 $2.62 $2.46 $2.02 NFG P1 P2 P3 P4 P5 P6 P7 Before Hedging Hedging Uplift $2.06 $2.06 $1.85 $1.58 $1.57 $1.18 $0.86 $0.77 NFG P1 P2 P5 P4 P7 P6 P3 Peer Average $1.41/Mcfe Appalachian Price Realizations & Margins 51 Q4 FY15 Average Natural Gas Realizations per Mcf vs. Appalachian Peer Group (1) Q4 FY15 Adjusted EBITDA per Mcfe (2) vs. Appalachian Peer Group (1) Strong hedge book, firm sales portfolio, and cost discipline generating impressive natural gas price realizations and margins in challenging commodity environment
Peer Average $2.84/Mcf Appalachia Appalachia (1) Appalachian peer group includes AR, COG, CNX, EQT, GPOR, RICE, &RRC . Peer group information obtained or estimated by National
Fuel Gas Company from peer company quarterly public filings (press release & Form 10-Q) for the quarter-ended September 30, 2015. Where necessary, peer company realizations and margins were adjusted
to reflect cash settled hedges and results of exploration and production operations only.
(2)
Note: A reconciliation of Adjusted EBITDA per Mcfe to Net Income as presented
on the Consolidated Statement of Income and Earnings Reinvested in the Business is included at the end of this presentation. |
    Appendix Volume Avg. Price Volume Avg. Price Volume Avg. Price Volume Avg. Price Volume Avg. Price NYMEX Swaps 28,440 $3.92 29,530 $4.20 20,350 $3.62 11,400 $3.39 2,000 $3.49 Dominion Swaps 14,130 $3.78 12,720 $3.87 - - - - - - MichCon Swaps 9,000 $4.10 3,000 $4.10 - - - - - - Dawn Swaps 9,990 $3.92 19,100 $3.70 1,800 $3.40 - - - - Fixed Price Physical Sales 30,426 $2.75 32,893 $3.03 8,010 $3.21 5,840 $3.25 2,928 $3.25 Total 91,986 $3.53 97,243 $3.66 30,160 $3.50 17,240 $3.34 4,928 $3.35 Fiscal 2019 Fiscal 2020 Fiscal 2016 Fiscal 2017 Fiscal 2018 Natural Gas Hedge Positions 52 (Volumes in thousands MMBtu; Prices in $/MMBtu) (1) For the remaining nine months of Fiscal 2016. (2) Fixed price physical sales exclude joint development partner’s share of fixed price contract WDA volumes as specified under the
joint development agreement. (1)
(2) |
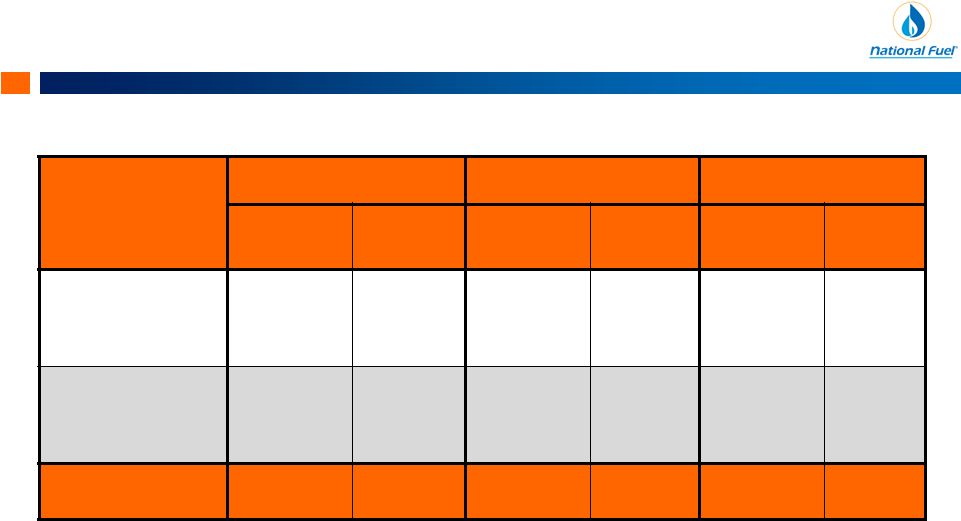 Appendix Crude Oil Hedge Positions 53 Fiscal 2016 Fiscal 2017 Fiscal 2018 Volume Avg. Price Volume Avg. Price Volume Avg. Price Brent Swaps 404,000 $94.63 231,000 $92.14 51,000 $91.00 NYMEX Swaps 640,000 $83.33 465,000 $66.77 24,000 $90.52 Total 1,044,000 $87.70 696,000 $75.19 75,000 $90.85 (Volumes & Prices in Bbl) (1) For the remaining nine months of Fiscal 2016. (1) |
 Utica/Point Pleasant: EDA Opportunities
54 Shell: Gee 11.2 MMcf/d PGE Vertical Tests Permitted Drilling Completed Producing Seneca Horizontal Planned or Potential Shell: Neal 26.5 MMcf/d Other Operators DCNR Tract 001 Potential Future Location DCNR 595 Potential Future Location JKLM Pt Pleasant Test Seneca DCNR Tract 007 IP: 22.7 MMcf/d Lateral Length: 4,640’ Potential locations: ~ 70 Anticipated Development Well Cost: $7-$10 Million (5,500’ Lat.) Travis Peak: Currently Drilling |
 Appendix Comparable GAAP Financial Measure Slides & Reconciliations 55 This presentation contains certain non-GAAP financial measures. For pages that contain non-GAAP financial measures, pages containing the most directly comparable GAAP financial measures and reconciliations are provided in the slides that follow. The Company believes that its non-GAAP financial measures are useful to investors because they provide an alternative method for assessing the Company’s ongoing operating results, for measuring the Company’s cash flow and liquidity, and for comparing the Company’s financial performance to other companies. The Company’s management uses these non-GAAP financial measures for the same purpose, and for planning and forecasting purposes. The presentation of non-GAAP financial measures is not meant to be a substitute for financial measures prepared in accordance with GAAP. The Company defines Adjusted EBITDA as reported GAAP earnings before the following items: interest expense, depreciation, depletion and amortization, interest and other income, impairments, items impacting comparability and income taxes. |
 Appendix National Fuel Gas Company 56 Reconciliation of Adjusted EBITDA to Consolidated Net Income ($ Thousands) FY 2011 FY 2012 Total Adjusted EBITDA Exploration & Production Adjusted EBITDA 377,457 $ 397,129 $ 492,383 $
539,472 $
422,289 $
377,998 Pipeline & Storage Adjusted EBITDA 111,474 136,914 161,226 186,022 188,042 189,890 Gathering Adjusted EBITDA 9,386 14,814 29,777 64,060 68,783 62,478 Utility Adjusted EBITDA 168,540 159,986 171,669 164,643 164,037 156,524 Energy Marketing Adjusted EBITDA 13,178 5,945 6,963 10,335 12,150 9,355 Corporate & All Other Adjusted EBITDA
(12,346) (10,674) (9,920) (11,078) (11,900) (11,391) Total Adjusted EBITDA 667,689 $ 704,114 $ 852,098 $
953,454 $
843,401 $
784,854 $ Total Adjusted EBITDA 667,689 $ 704,114 $ 852,098 $
953,454 $
843,401 $
784,854 $ Minus: Interest Expense (78,121) (86,240) (94,111) (94,277) (99,471) (108,122) Plus: Interest and Other Income 8,863 8,822 9,032 13,631 11,961 13,737 Minus: Income Tax Expense (164,381) (150,554) (172,758) (189,614) 319,136 518,646 Minus: Depreciation, Depletion & Amortization (226,527) (271,530) (326,760) (383,781) (336,158) (303,962) Minus: Impairment of Oil and Gas Properties (E&P) - - - -
(1,126,257) (1,561,708) Plus: Reversal of Stock-Based Compensation - - - -
7,961 7,961 Plus: Gain on Sale of Unconsolidated Subsidiaries (Corp. & All Other)
50,879 - - -
- -
Plus: Elimination of Other
Post-Retirement Regulatory Liability (P&S) -
21,672
-
- -
- Minus: Pennsylvania Impact Fee Related to Prior Fiscal Years (E&P)
- (6,206) - -
- -
Minus: New York Regulatory Adjustment
(Utility) -
-
(7,500)
-
- -
Rounding
- (1) -
- -
- Minus: Joint Development Agreement Professional Fees
- - - -
- (4,682)
Consolidated Net Income
258,402 $ 220,077 $ 260,001 $
299,413 $
(379,427) $ (653,276) $ Consolidated Debt to Total Adjusted EBITDA Long-Term Debt, Net of Current Portion (End of Period) 899,000 $ 1,149,000 $ 1,649,000 $ 1,649,000 $ 2,099,000 $ 2,099,000 $ Current Portion of Long-Term Debt (End of Period) 150,000 250,000 - -
- -
Notes Payable to Banks and Commercial
Paper (End of Period) 40,000
171,000
- 85,600
-
31,400 Total Debt (End of Period) 1,089,000 $ 1,570,000 $ 1,649,000 $ 1,734,600 $ 2,099,000 $ 2,130,400 $ Long-Term Debt, Net of Current Portion (Start of Period) 1,049,000 $ 899,000 1,149,000 1,649,000 1,649,000 1,649,000 Current Portion of Long-Term Debt (Start of Period) 200,000 150,000 250,000 - -
- Notes Payable to Banks and Commercial Paper (Start of Period)
- 40,000 171,000 - 85,600
172,900
Total Debt (Start of Period)
1,249,000 $ 1,089,000 $ 1,570,000 $ 1,649,000 $ 1,734,600 $ 1,821,900 $ Average Total Debt 1,169,000 $ 1,329,500 $ 1,609,500 $ 1,691,800 $ 1,916,800 $ 1,976,150 $ Average Total Debt to Total Adjusted EBITDA 1.75 x 1.89 x 1.89 x 1.77 x 2.27 x 2.52 x FY 2013 12-Months Ended 12/31/15 FY 2014 FY 2015 |
 Appendix National Fuel Gas Company 57 Reconciliation of Exploration & Production - West Coast division Adjusted EBITDA per Mboe of Production
($ Thousands) 12-Months Ended 12/31/15 Appalachia Division Adjusted EBITDA 259,134 $ West Coast Division Adjusted EBITDA 118,864 Total Exploration & Production Adjusted EBITDA
377,998 $ West Coast Division Adjusted EBITDA 118,864 $ West Coast Production (Mboe) 3,514 West Coast Division Adjusted EBITDA per Mboe
33.83 $ Note: Seneca West Coast division includes Seneca corporate and eliminations. |
 Appendix National Fuel Gas Company 58 (1) FY2016 Exploration and Production capital expenditure guidance reflects the netting of up-front proceeds received from joint
development partner for capital spent on wells drilled and/or
completed prior to the execution date of the joint development agreement.
Reconciliation of Segment Capital Expenditures to
Consolidated Capital Expenditures
($ Thousands) FY 2016 FY 2011 FY 2012 FY 2013 FY 2014 FY 2015 Forecast Capital Expenditures from Continuing Operations Exploration & Production Capital Expenditures 648,815 $ 693,810 $ 533,129 $ 602,705 $ 557,313 $ $150,000-200,000 Pipeline & Storage Capital Expenditures 129,206 144,167 56,144 $ 139,821 $ 230,192 $ $125,000-175,000 Gathering Segment Capital Expenditures 17,021 80,012 54,792 $ 137,799 $ 118,166 $ $85,000-95,000 Utility Capital Expenditures 58,398 58,284 71,970 $ 88,810 $ 94,371 $ $95,000-105,000 Energy Marketing, Corporate & All Other Capital Expenditures 746 1,121 1,062 $ 772 $
467 $
- Total Capital Expenditures
from Continuing Operations 854,186
$
977,394 $ 717,097 $ 969,907 $ 1,000,509 $ $455,000-575,000 Capital Expenditures from Discountinued Operations All Other Capital Expenditures - $
- $
- $
- $
- $
- $
Plus (Minus) Accrued Capital
Expenditures Exploration & Production FY 2015 Accrued Capital
Expenditures -
$
-
$
-
$
-
$
(46,173)
$
Exploration & Production FY 2014 Accrued Capital Expenditures
- - - (80,108) 80,108 Exploration & Production FY 2013 Accrued Capital Expenditures - - (58,478) 58,478 - - Exploration &
Production FY 2012 Accrued Capital Expenditures -
(38,861)
38,861 - - - Exploration &
Production FY 2011 Accrued Capital Expenditures (103,287)
103,287 - - - - Exploration &
Production FY 2010 Accrued Capital Expenditures 78,633
- - - - - Pipeline & Storage FY
2015 Accrued Capital Expenditures -
- - - (33,925) Pipeline & Storage FY 2014 Accrued Capital Expenditures - - - (28,122) 28,122 Pipeline & Storage FY 2013 Accrued Capital Expenditures - - (5,633) 5,633 - - Pipeline & Storage FY
2012 Accrued Capital Expenditures -
(12,699)
12,699 - - - Pipeline & Storage FY
2011 Accrued Capital Expenditures (16,431)
16,431 - - - - Pipeline & Storage FY
2010 Accrued Capital Expenditures 3,681
-
-
-
-
-
Gathering FY 2015 Accrued Capital Expenditures - - - - (22,416) Gathering FY 2014 Accrued Capital Expenditures - - - (20,084) 20,084 Gathering FY 2013 Accrued Capital Expenditures - - (6,700) 6,700 - - Gathering FY 2012 Accrued
Capital Expenditures -
(12,690)
12,690 - - - Gathering FY 2011 Accrued
Capital Expenditures (3,079)
3,079 - - - - Utility FY 2015 Accrued
Capital Expenditures -
-
-
-
(16,445)
Utility FY 2014 Accrued Capital Expenditures
- - - (8,315) 8,315 Utility FY 2013 Accrued Capital Expenditures
- - (10,328) 10,328 - - Utility FY 2012 Accrued
Capital Expenditures -
(3,253)
3,253 - - - Utility FY 2011 Accrued
Capital Expenditures (2,319)
2,319 - - - - Utility FY 2010 Accrued
Capital Expenditures 2,894
-
-
-
-
-
Total Accrued Capital Expenditures (39,908) $ 57,613 $ (13,636) $ (55,490) $ 17,670 $ - $
Eliminations
- $
- $
- $
- $
- $
- $
Total Capital Expenditures per
Statement of Cash Flows 814,278
$
1,035,007 $ 703,461 $ 914,417 $ 1,018,179 $ $455,000-575,000 (1) |
 Appendix National Fuel Gas Company 59 Reconciliation of Exploration & Production Adjusted EBITDA for Appalachia and West Coast divisions
to Exploration & Production Segment Net Income
($ Thousands) Appalachia West Coast Total E&P Appalachia West Coast Total E&P Appalachia West Coast Total E&P Appalachia West Coast Total E&P Reported GAAP Earnings (144,511) $ (62,508) $ (207,019) $ 12,104 $ 21,557 $ 33,661 $ (378,594) $ (178,380) $ (556,974) $ 47,962 $ 73,607 $ 121,569 $ Depreciation, Depletion and Amortization 36,837 9,440 46,277 65,422 15,609 81,031 188,489 51,329 239,818 238,541 57,669 296,210 Interest and Other Income - (661) (661) - (604) (604) - (2,554) (2,554) - (1,909) (1,909) Interest Expense 13,613 563 14,176 9,977 607 10,584 44,798 1,928 46,726 40,015 2,217 42,232 Income Taxes (123,825) (45,796) (169,621) (4,190) 18,336 14,146 (295,912) (132,305) (428,217) 18,179 63,191 81,370 Impairment of Oil and Gas Producing Properties 285,038 132,159 417,197 - - - 730,115 396,142 1,126,257 - - - Reversal of Stock Based Compensation
(825) (1,942) (2,767) - - - (825) (1,942) (2,767) - - - Adjusted EBITDA 66,327 $ 31,255 $ 97,582 $ 83,313 $ 55,505 $ 138,818 $ 288,071 $ 134,218 $ 422,289 $ 344,697 $ 194,775 $ 539,472 $ Appalachia West Coast Total E&P Appalachia West Coast Total E&P Appalachia West Coast Total E&P Appalachia West Coast Total E&P Production: Gas Production (MMcf) 32,183 785 32,968 40,456 808 41,264 136,404 3,159 139,563 139,097 3,210 142,307 Oil Production (MBbl) 8 770 778 8 774 782 30 3,004 3,034 31 3,005 3,036 Total Production (Mmcfe) 32,231 5,405 37,636 40,504 5,452 45,956 136,584 21,183 157,767 139,283 21,240 160,523 Adjusted EBITDA Margin per Mcfe 2.06 $ 5.78 $ 2.59 $ 2.06 $ 10.18 $ 3.02 $ 2.11 $ 6.34 $ 2.68 $ 2.47 $ 9.17 $ 3.36 $ Total Production (Mboe) 5,372 901 6,273 6,751 909 7,660 22,764 3,531 26,295 23,214 3,540 26,754 Adjusted EBITDA Margin per Boe 12.35 $ 34.69 $ 15.56 $ 12.34 $ 61.06 $ 18.12 $ 12.65 $ 38.01 $ 16.06 $ 14.85 $ 55.02 $ 20.16 $ Note: Seneca West Coast division includes Seneca corporate and eliminations. Three Months Ended September 30, 2015 Three Months Ended September 30, 2014 Twelve Months Ended September 30, 2015 Twelve Months Ended September 30, 2014 |