Attached files
| file | filename |
|---|---|
| 8-K - 8-K - FRANKLIN FINANCIAL SERVICES CORP /PA/ | fraf-20160204x8k.htm |
 STATEMENTS In order for you to better understand the business of the Company – where we all have been and where we want to go – our remarks today (those of the Company officers who will speak or respond to questions) will include forward looking statements related to anticipated financial performance, future operating results, business prospects, new products, and similar matters. These statements represent our best judgment, based upon present circumstances and the information now available to us, of what we think may occur in the future – and, of course, it is possible that actual results may differ materially from those we envision today. For a more complete discussion on the subject of forward looking statements, including a list of some of the risk factors that might adversely affect future operating results, we refer you to the section entitled “Forward Looking Statements” which appears in our annual report on Form 10-K as filed with the Securities and Exchange Commission. FORWARD LOOKING 2

 COMPANY PROFILE •F&M Trust founded in 1906 •Franklin Financial formed in 1984 •Headquartered in Chambersburg, PA •22 offices throughout Cumberland, Franklin, Fulton and Huntingdon Counties •$1.035 billion in assets at December 31, 2015 •$709 million in brokerage and trust assets under management FRANKLIN FINANCIAL AND F&M TRUST 4
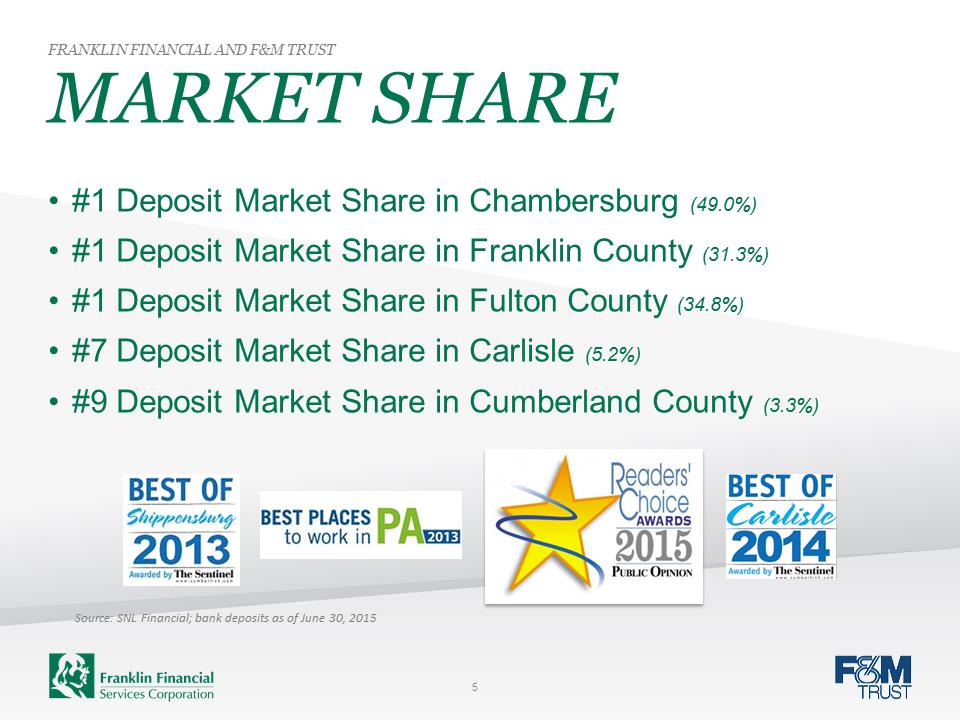 MARKET SHARE •#1 Deposit Market Share in Chambersburg (49.0%) •#1 Deposit Market Share in Franklin County (31.3%) •#1 Deposit Market Share in Fulton County (34.8%) •#7 Deposit Market Share in Carlisle (5.2%) •#9 Deposit Market Share in Cumberland County (3.3%) Source: SNL Financial; bank deposits as of June 30, 2015 FRANKLIN FINANCIAL AND F&M TRUST 5
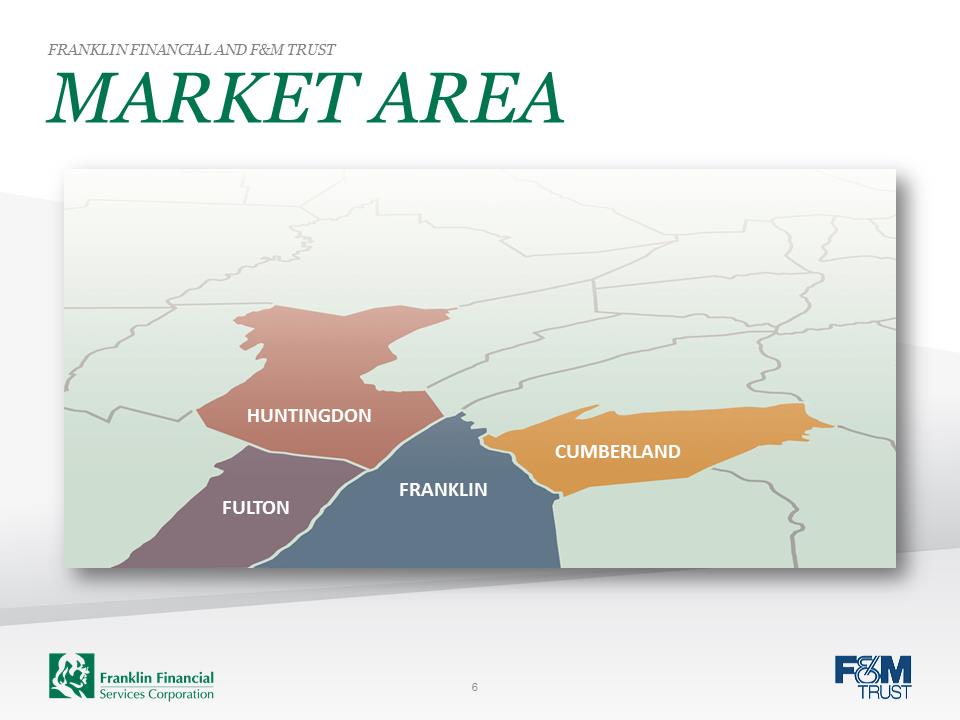 FULTON FRANKLIN CUMBERLAND HUNTINGDON MARKET AREA FRANKLIN FINANCIAL AND F&M TRUST 6
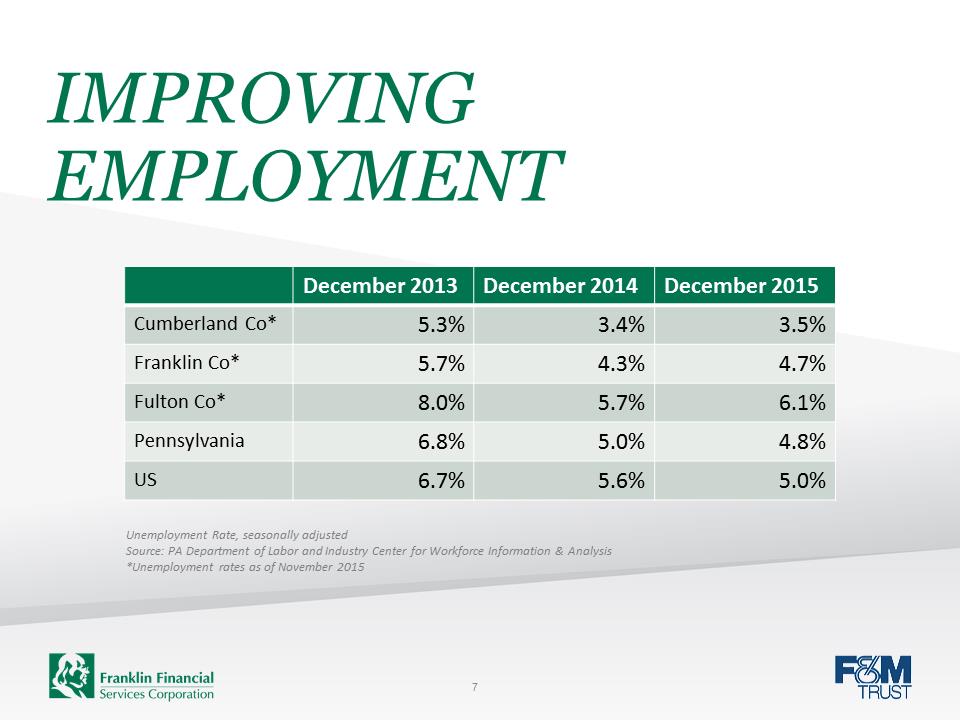 IMPROVING EMPLOYMENT December 2013 December 2014 December 2015 Cumberland Co* 5.3% 3.4% 3.5% Franklin Co* 5.7% 4.3% 4.7% Fulton Co* 8.0% 5.7% 6.1% Pennsylvania 6.8% 5.0% 4.8% US 6.7% 5.6% 5.0% Unemployment Rate, seasonally adjusted Source: PA Department of Labor and Industry Center for Workforce Information & Analysis *Unemployment rates as of November 2015 7
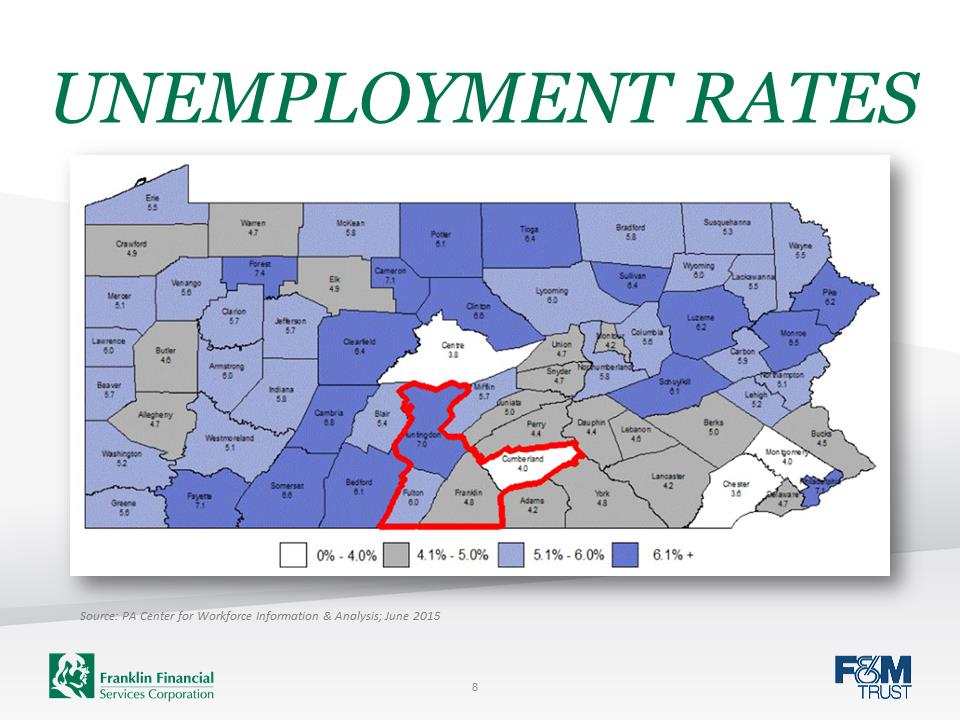 UNEMPLOYMENT RATES Source: PA Center for Workforce Information & Analysis; June 2015 8
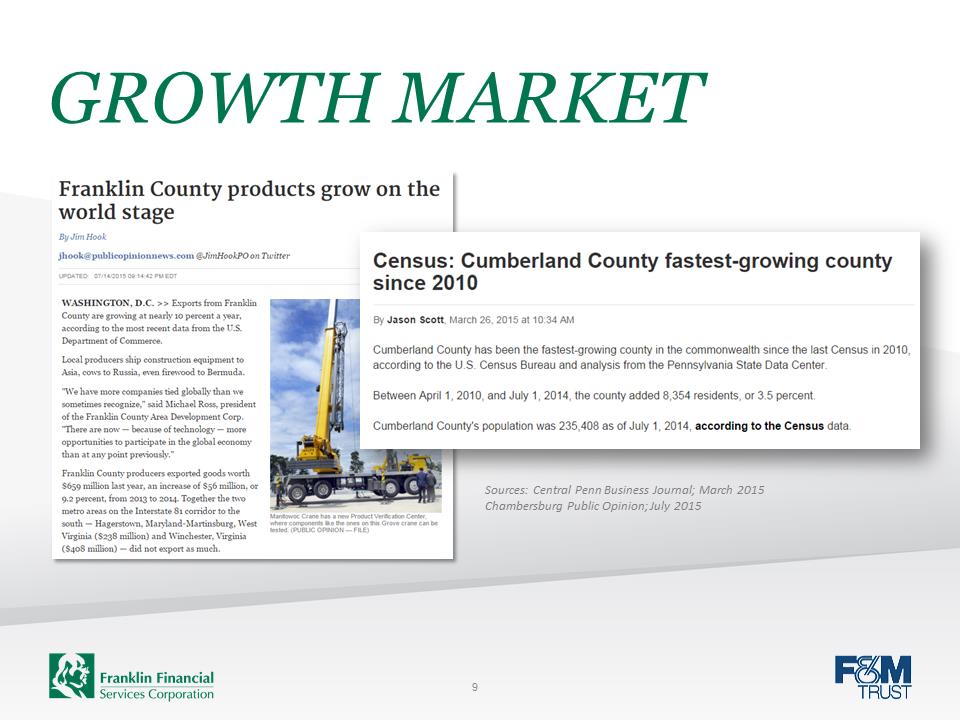 GROWTH MARKET Sources: Central Penn Business Journal; March 2015 Chambersburg Public Opinion; July 2015 9
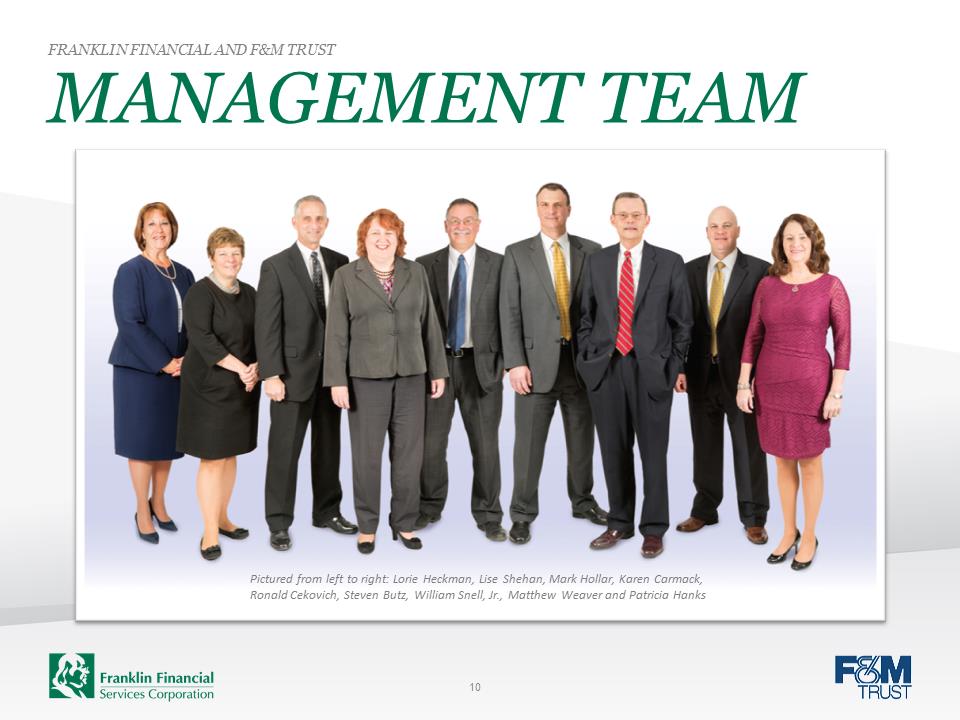 MANAGEMENT TEAM FRANKLIN FINANCIAL AND F&M TRUST Pictured from left to right: Lorie Heckman, Lise Shehan, Mark Hollar, Karen Carmack, Ronald Cekovich, Steven Butz, William Snell, Jr., Matthew Weaver and Patricia Hanks 10
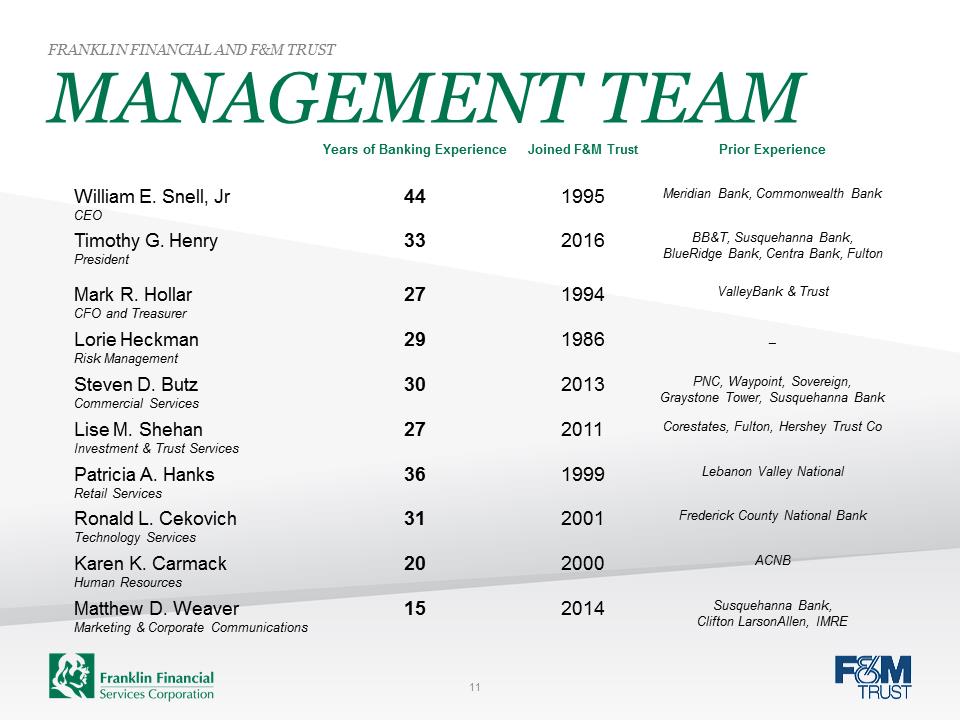 MANAGEMENT TEAM FRANKLIN FINANCIAL AND F&M TRUST Years of Banking Experience Joined F&M Trust Prior Experience William E. Snell, Jr CEO 44 1995 Meridian Bank, Commonwealth Bank Timothy G. Henry President 33 2016 BB&T, Susquehanna Bank, BlueRidge Bank, Centra Bank, Fulton Mark R. Hollar CFO and Treasurer 27 1994 ValleyBank & Trust Lorie Heckman Risk Management 29 1986 _ Steven D. Butz Commercial Services 30 2013 PNC, Waypoint, Sovereign, Graystone Tower, Susquehanna Bank Lise M. Shehan Investment & Trust Services 27 2011 Corestates, Fulton, Hershey Trust Co Patricia A. Hanks Retail Services 36 1999 Lebanon Valley National Ronald L. Cekovich Technology Services 31 2001 Frederick County National Bank Karen K. Carmack Human Resources 20 2000 ACNB Matthew D. Weaver Marketing & Corporate Communications 15 2014 Susquehanna Bank, Clifton LarsonAllen, IMRE 11
 STRATEGIC PLAN FOCUS FRANKLIN FINANCIAL AND F&M TRUST •Quality Loan Growth •Increasing Fee-Based Lines of Business •Further Development of Sales Culture •Expense Control •Board and Management Succession Plans •Continue to Improve Overall Loan Quality 12

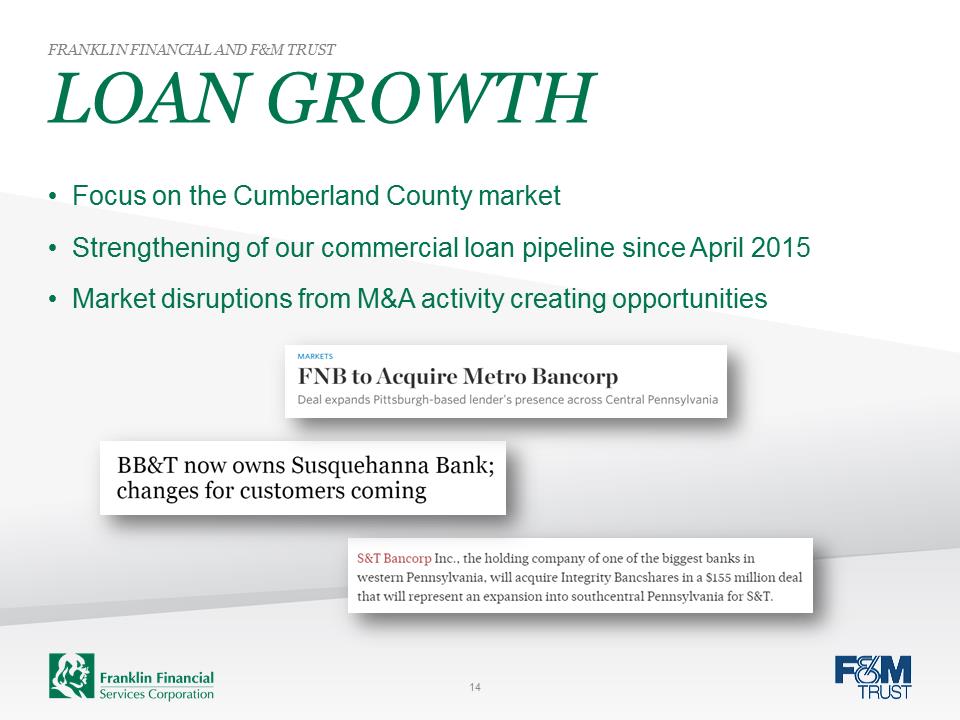 LOAN GROWTH FRANKLIN FINANCIAL AND F&M TRUST •Focus on the Cumberland County market •Strengthening of our commercial loan pipeline since April 2015 •Market disruptions from M&A activity creating opportunities 14
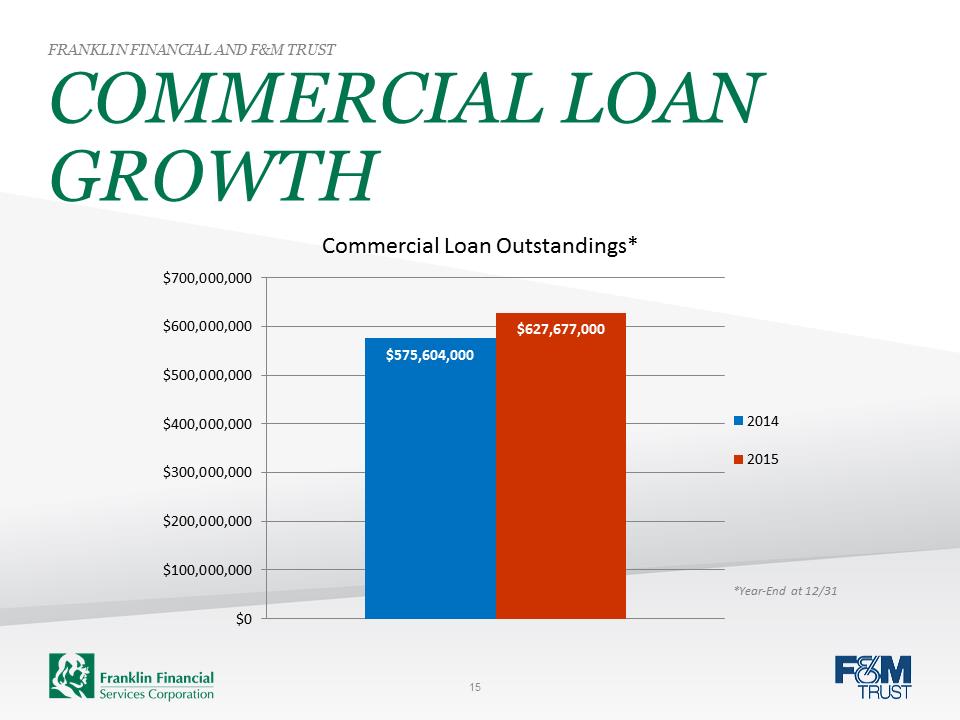 COMMERCIAL LOAN GROWTH FRANKLIN FINANCIAL AND F&M TRUST $575,604,000 $627,677,000 $0$100,000,000$200,000,000$300,000,000$400,000,000$500,000,000$600,000,000$700,000,000Commercial Loan Outstandings* 20142015*Year-End at 12/3115
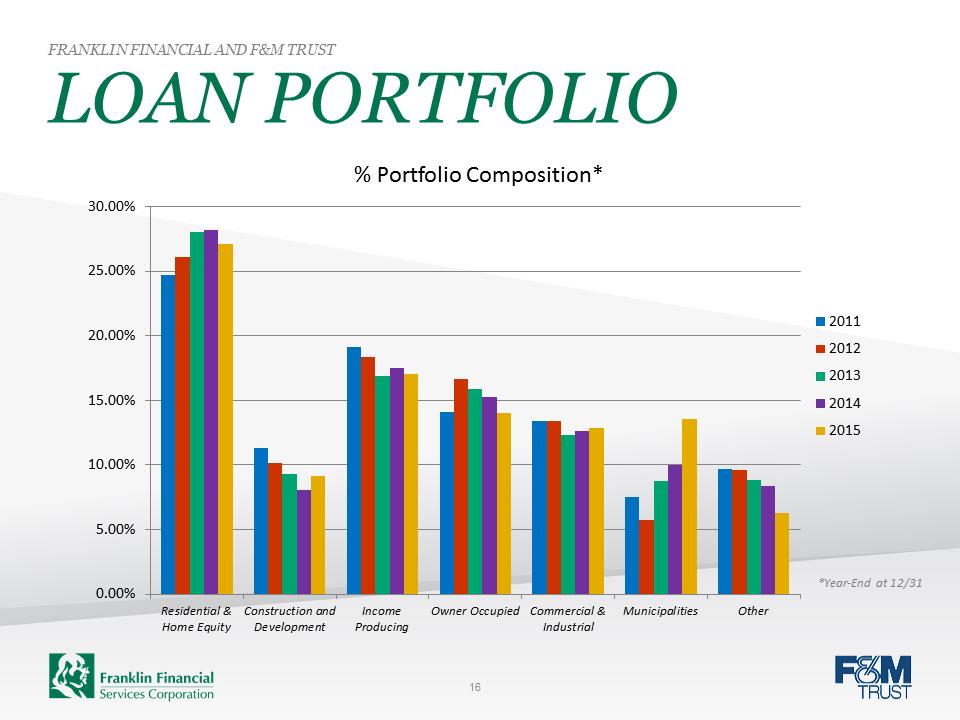 LOAN PORTFOLIO FRANKLIN FINANCIAL AND F&M TRUST 0.00%5.00%10.00%15.00%20.00%25.00%30.00%Residential &Home EquityConstruction andDevelopmentIncomeProducingOwner OccupiedCommercial &IndustrialMunicipalitiesOther% Portfolio Composition* 20112012201320142015*Year-End at 12/31 16

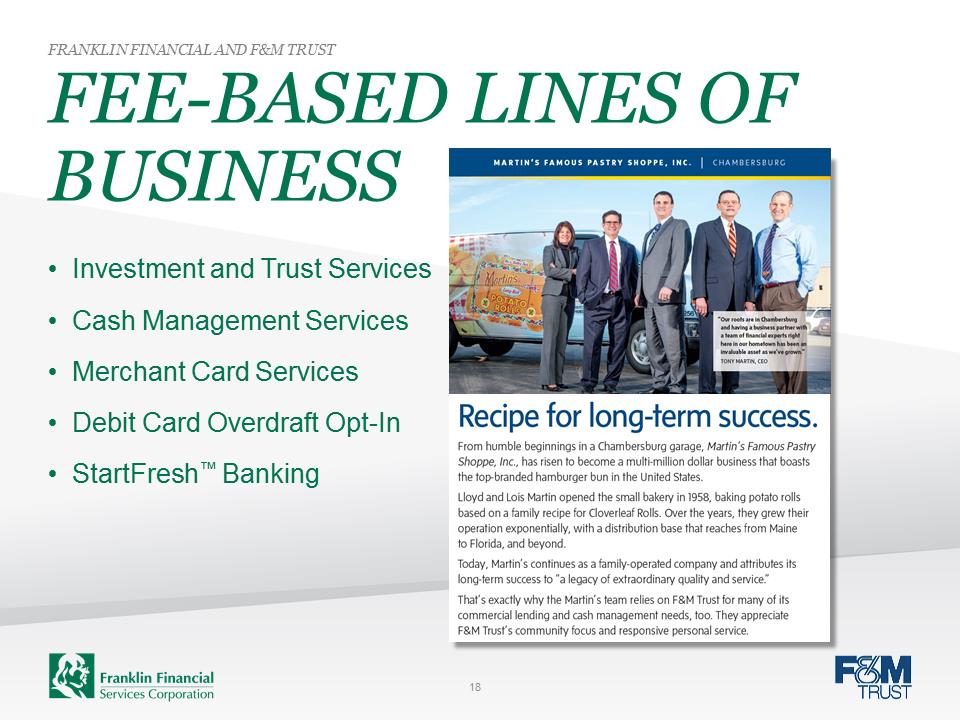 FEE-BASED LINES OF BUSINESS FRANKLIN FINANCIAL AND F&M TRUST •Investment and Trust Services •Cash Management Services •Merchant Card Services •Debit Card Overdraft Opt-In •StartFresh™ Banking 18
 INVESTMENT & TRUST SERVICES •Trust powers since our incorporation in 1906 •Fully integrated trust, investment, insurance and brokerage services, focused exclusively on client needs •Fee income increased by 10.1% for 2015 •Designated Regional Market Managers focused on growth in the West Shore region of Cumberland County, Franklin and Fulton Counties FRANKLIN FINANCIAL AND F&M TRUST 19
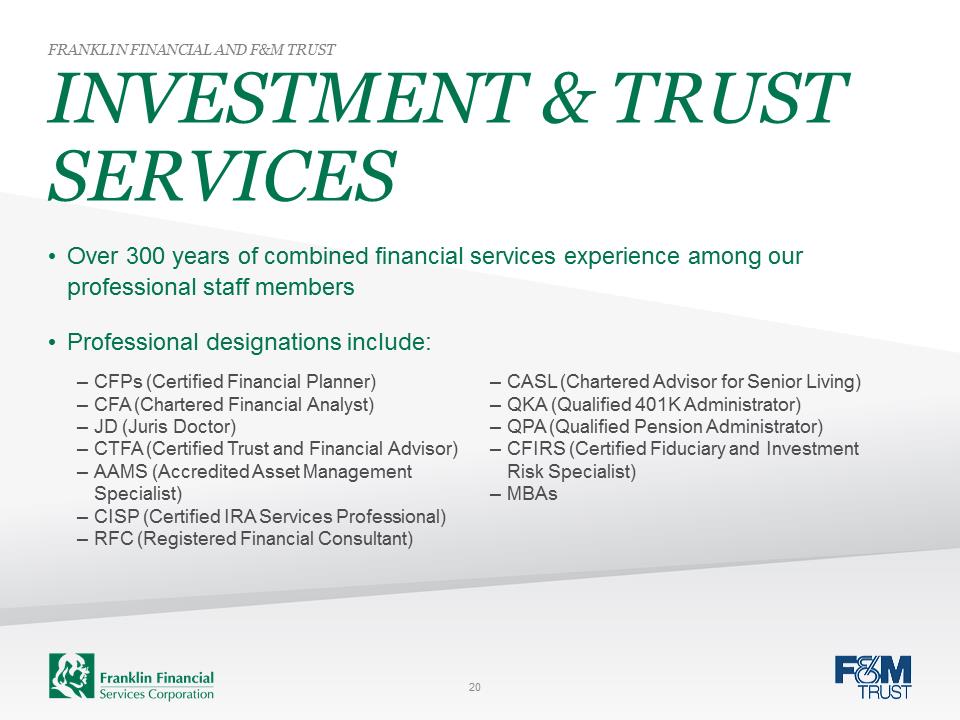 INVESTMENT & TRUST SERVICES •Over 300 years of combined financial services experience among our professional staff members •Professional designations include: FRANKLIN FINANCIAL AND F&M TRUST –CFPs (Certified Financial Planner) –CFA (Chartered Financial Analyst) –JD (Juris Doctor) –CTFA (Certified Trust and Financial Advisor) –AAMS (Accredited Asset Management Specialist) –CISP (Certified IRA Services Professional) –RFC (Registered Financial Consultant) –CASL (Chartered Advisor for Senior Living) –QKA (Qualified 401K Administrator) –QPA (Qualified Pension Administrator) –CFIRS (Certified Fiduciary and Investment Risk Specialist) –MBAs 20

 SALES CULTURE FRANKLIN FINANCIAL AND F&M TRUST •Partnership with the Anthony Cole Training Group •Utilize the Sales Person Skills Assessment tool for existing sales personnel and leadership •Evaluate new personnel for front-line sales positions during hiring process •Implement the Sales Managed Environment (SME®) QuickStart program •Process of building our sales management competencies 22

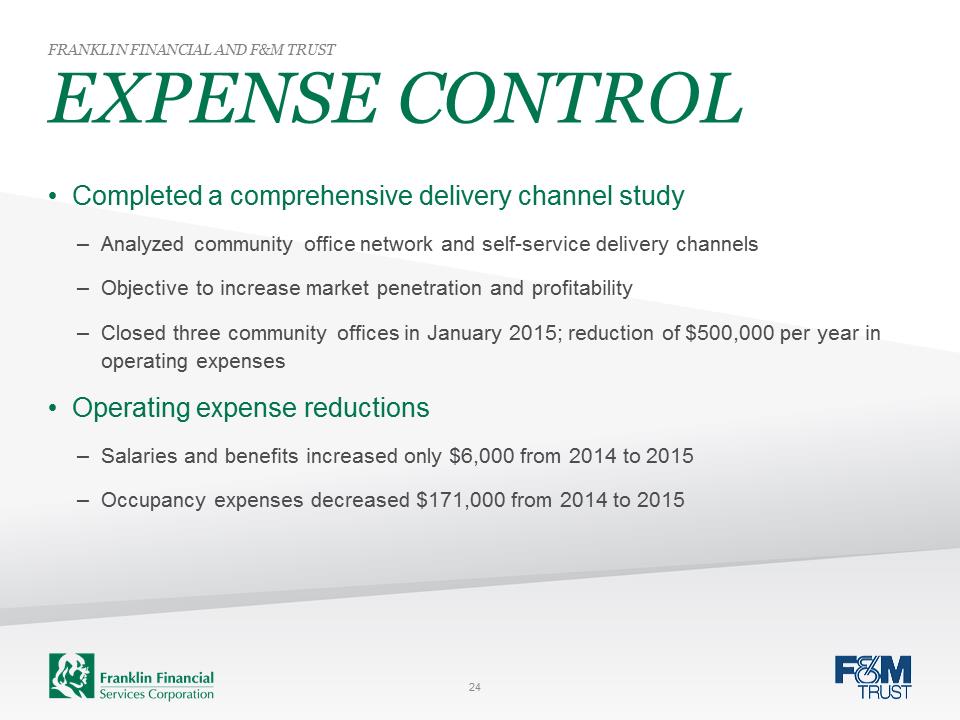 EXPENSE CONTROL FRANKLIN FINANCIAL AND F&M TRUST •Completed a comprehensive delivery channel study –Analyzed community office network and self-service delivery channels –Objective to increase market penetration and profitability –Closed three community offices in January 2015; reduction of $500,000 per year in operating expenses •Operating expense reductions –Salaries and benefits increased only $6,000 from 2014 to 2015 –Occupancy expenses decreased $171,000 from 2014 to 2015 24
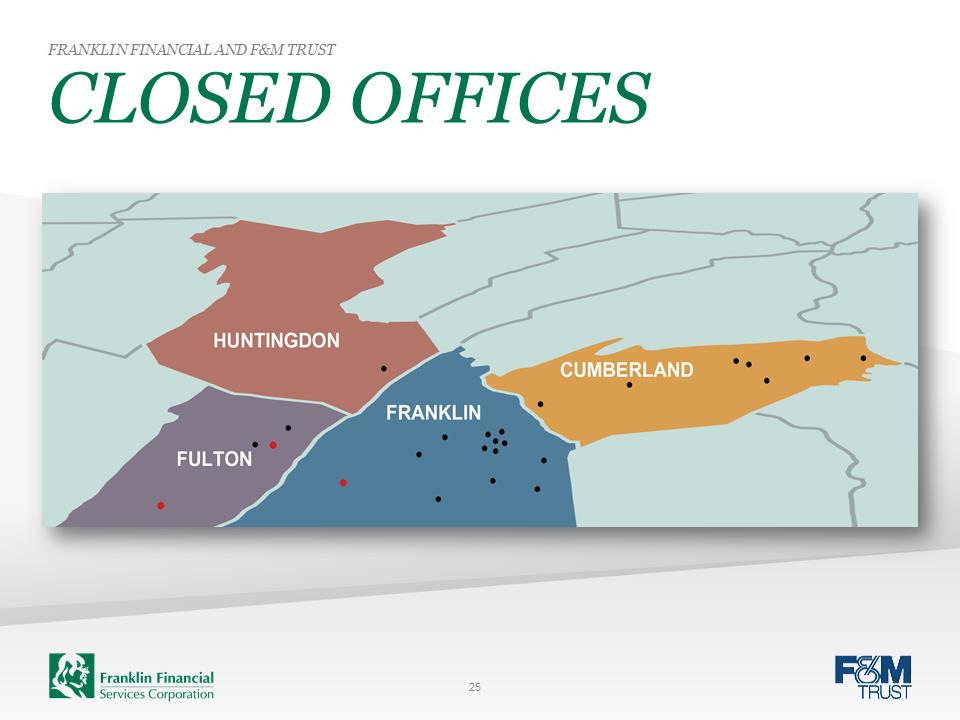 CLOSED OFFICES FRANKLIN FINANCIAL AND F&M TRUST 25
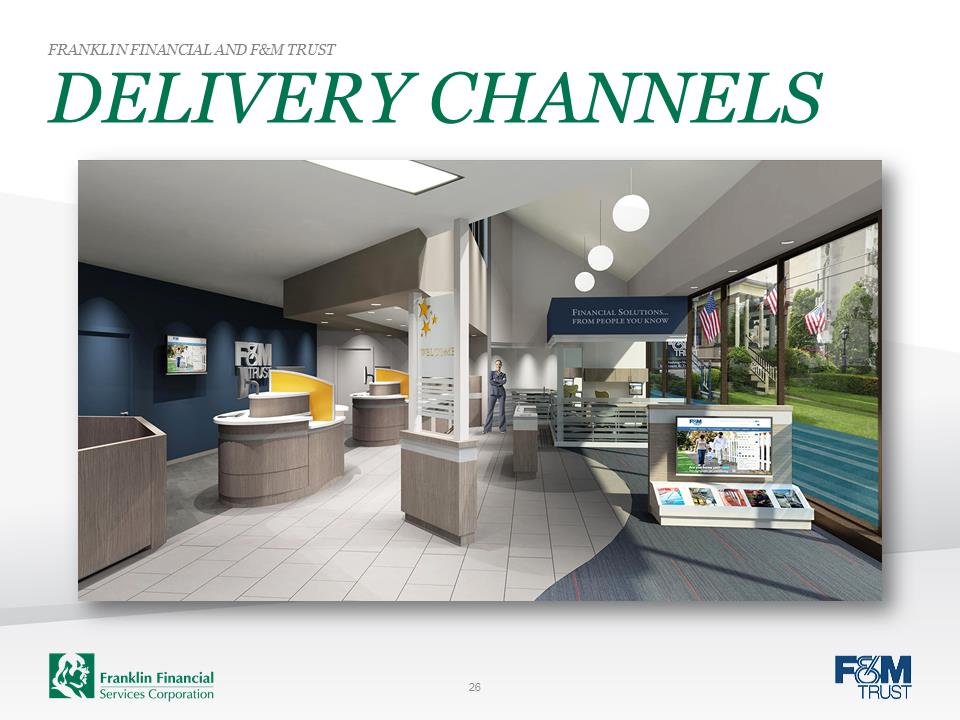 DELIVERY CHANNELS FRANKLIN FINANCIAL AND F&M TRUST 26
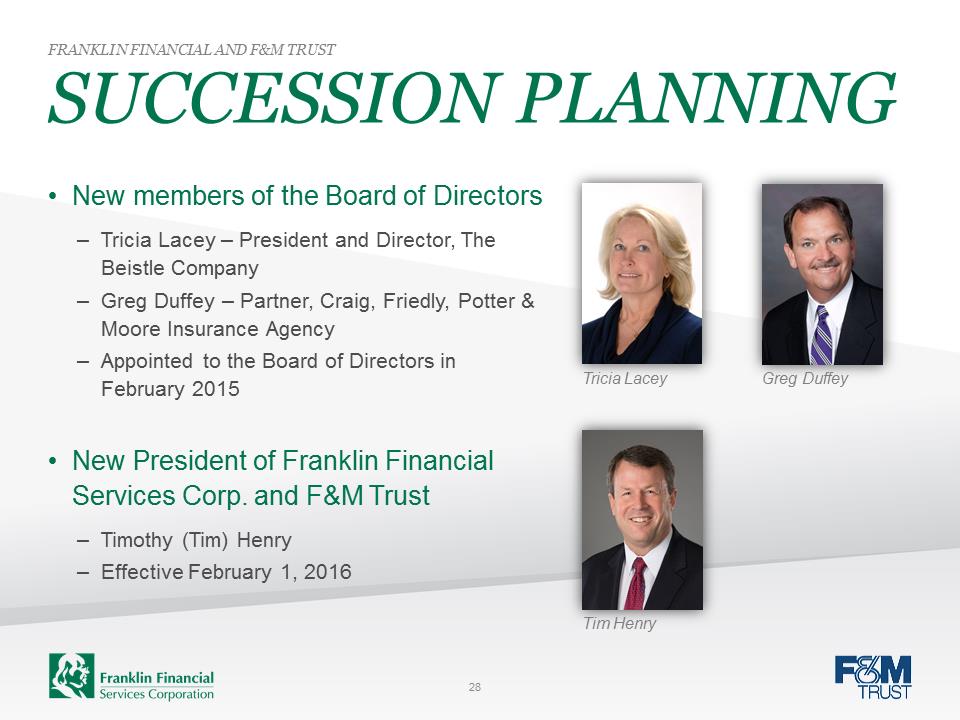 SUCCESSION PLANNING FRANKLIN FINANCIAL AND F&M TRUST Tricia Lacey •New members of the Board of Directors –Tricia Lacey – President and Director, The Beistle Company –Greg Duffey – Partner, Craig, Friedly, Potter & Moore Insurance Agency –Appointed to the Board of Directors in February 2015 •New President of Franklin Financial Services Corp. and F&M Trust –Timothy (Tim) Henry –Effective February 1, 2016 Greg Duffey Tim Henry 28
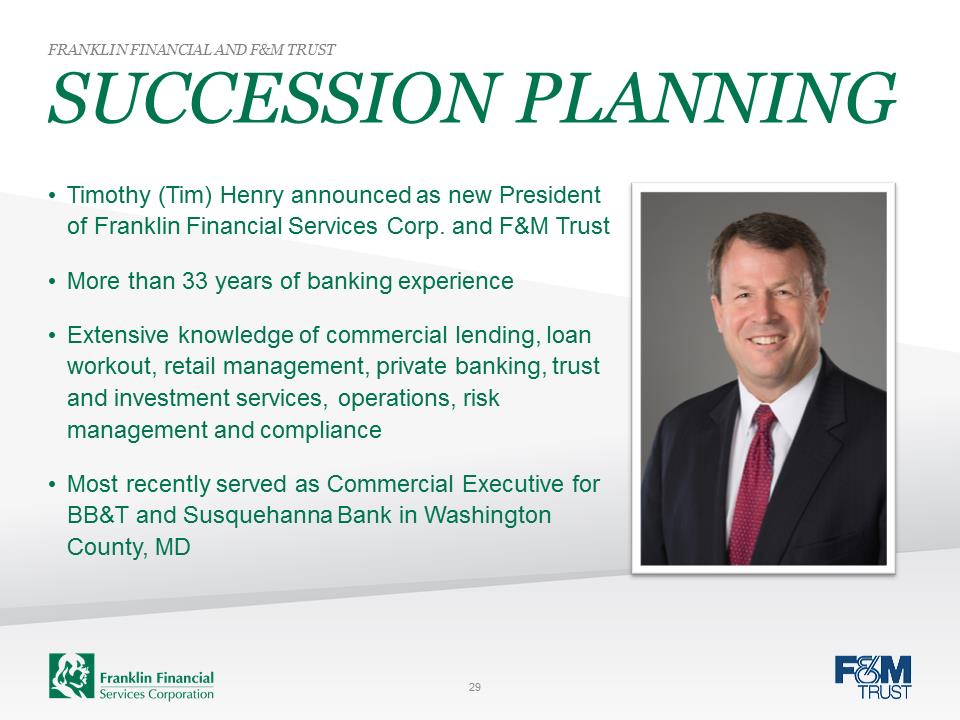 SUCCESSION PLANNING FRANKLIN FINANCIAL AND F&M TRUST •Timothy (Tim) Henry announced as new President of Franklin Financial Services Corp. and F&M Trust •More than 33 years of banking experience •Extensive knowledge of commercial lending, loan workout, retail management, private banking, trust and investment services, operations, risk management and compliance •Most recently served as Commercial Executive for BB&T and Susquehanna Bank in Washington County, MD 29
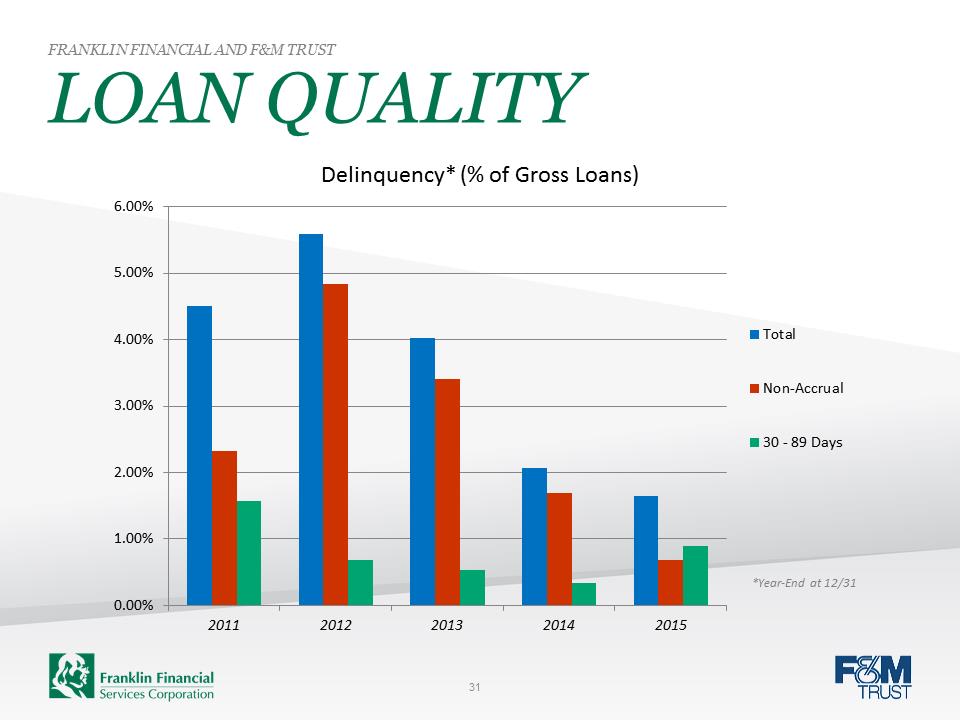 LOAN QUALITY FRANKLIN FINANCIAL AND F&M TRUST 0.00%1.00%2.00%3.00%4.00%5.00%6.00%20112012201320142015Delinquency* (% of Gross Loans) TotalNon-Accrual30 - 89 Days*Year-End at 12/31 31
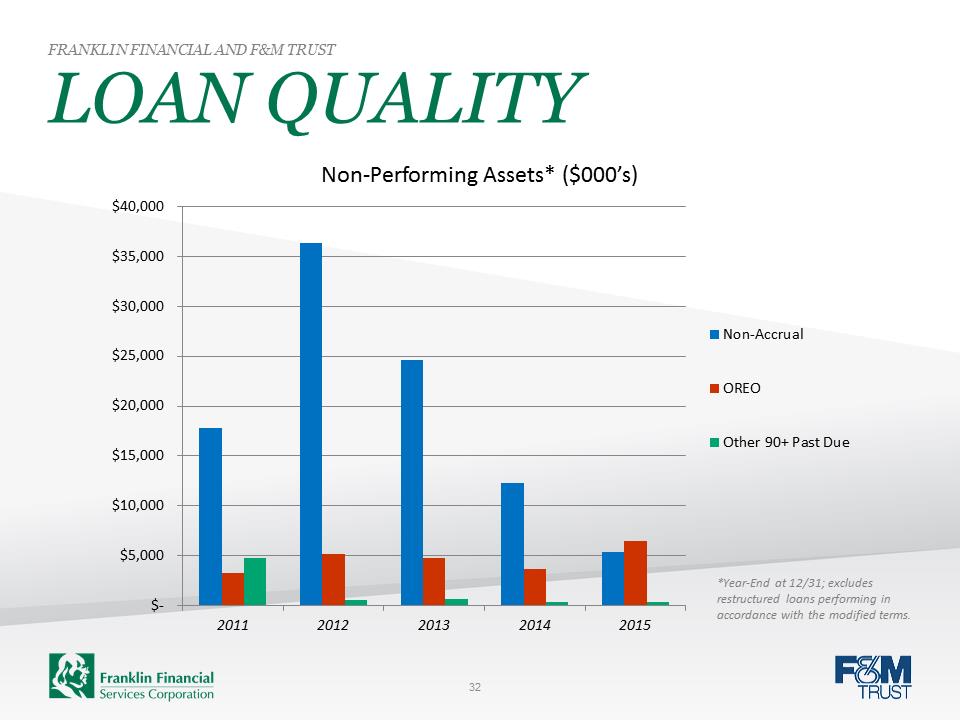 LOAN QUALITY FRANKLIN FINANCIAL AND F&M TRUST $- $5,000 $10,000 $15,000 $20,000 $25,000 $30,000 $35,000 $40,00020112012201320142015Non-Performing Assets* ($000’s) Non-AccrualOREOOther 90+ Past Due*Year-End at 12/31; excludes restructured loans performing in accordance with the modified terms. 32
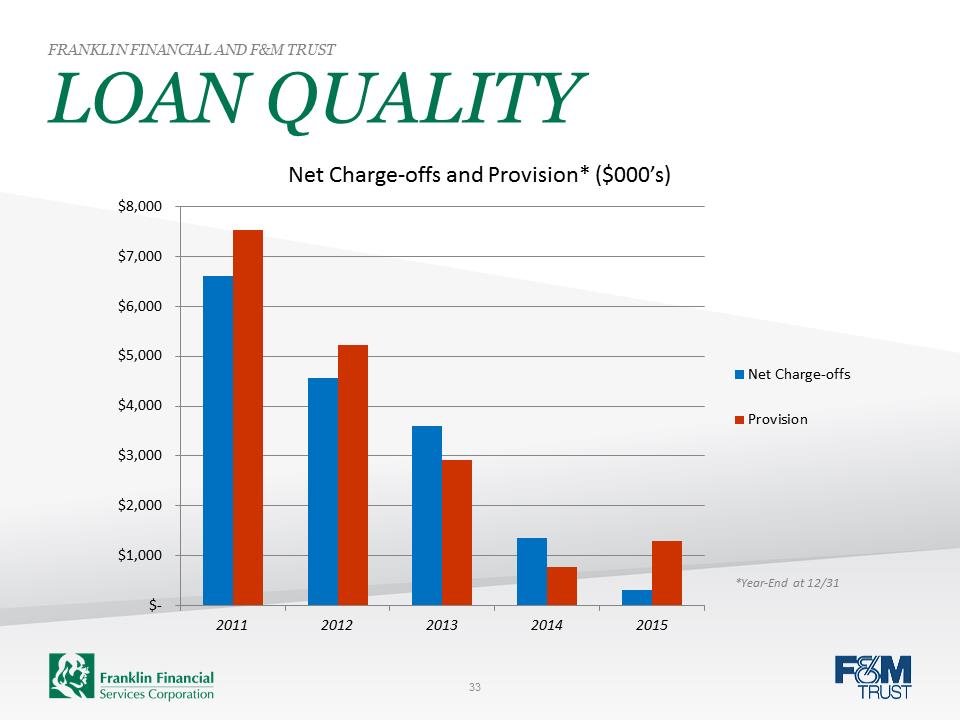 LOAN QUALITY FRANKLIN FINANCIAL AND F&M TRUST $- $1,000 $2,000 $3,000 $4,000 $5,000 $6,000 $7,000 $8,00020112012201320142015Net Charge-offs and Provision* ($000’s) Net Charge-offsProvision*Year-End at 12/31 33
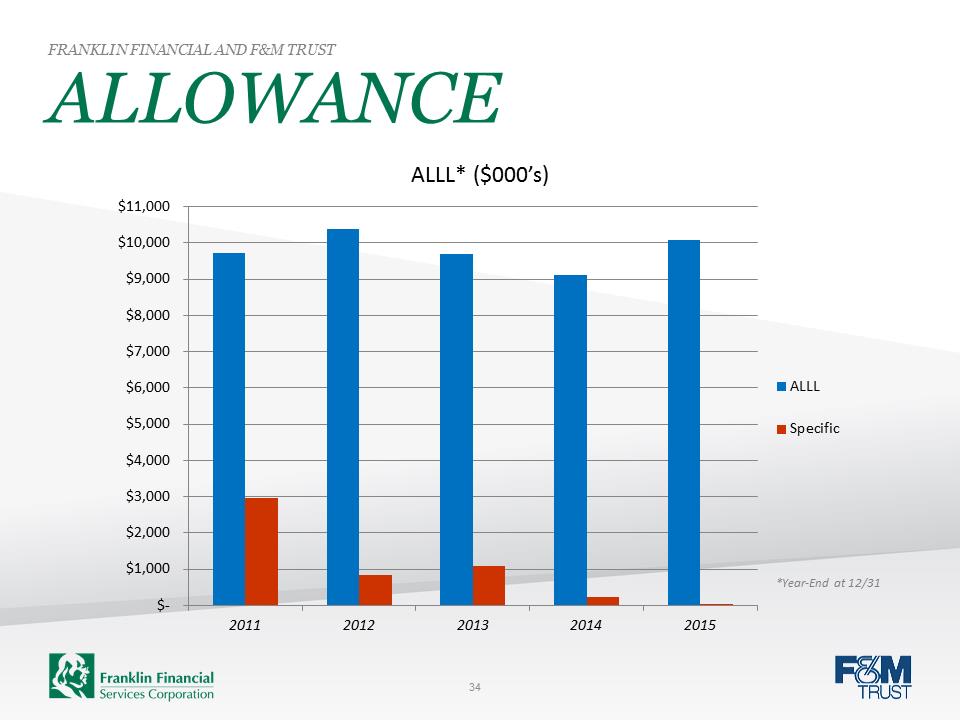 ALLOWANCE FRANKLIN FINANCIAL AND F&M TRUST $- $1,000 $2,000 $3,000 $4,000 $5,000 $6,000 $7,000 $8,000 $9,000 $10,000 $11,00020112012201320142015ALLL* ($000’s) ALLLSpecific*Year-End at 12/31 34
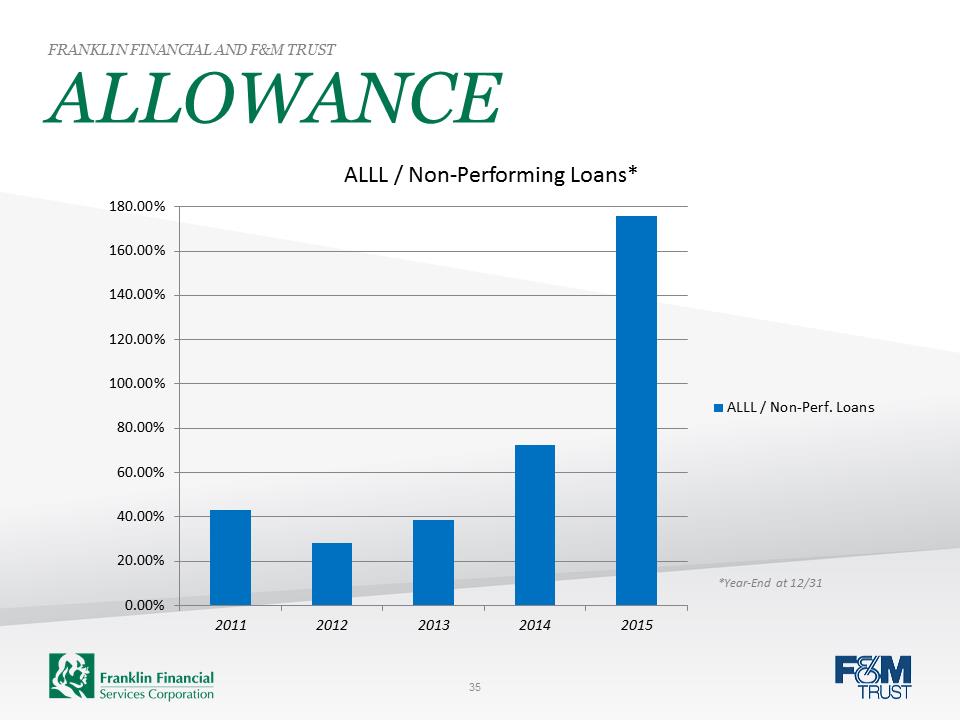 ALLOWANCE FRANKLIN FINANCIAL AND F&M TRUST 0.00%20.00%40.00%60.00%80.00%100.00%120.00%140.00%160.00%180.00%20112012201320142015ALLL / Non-Performing Loans* ALLL / Non-Perf. Loans*Year-End at 12/31 35

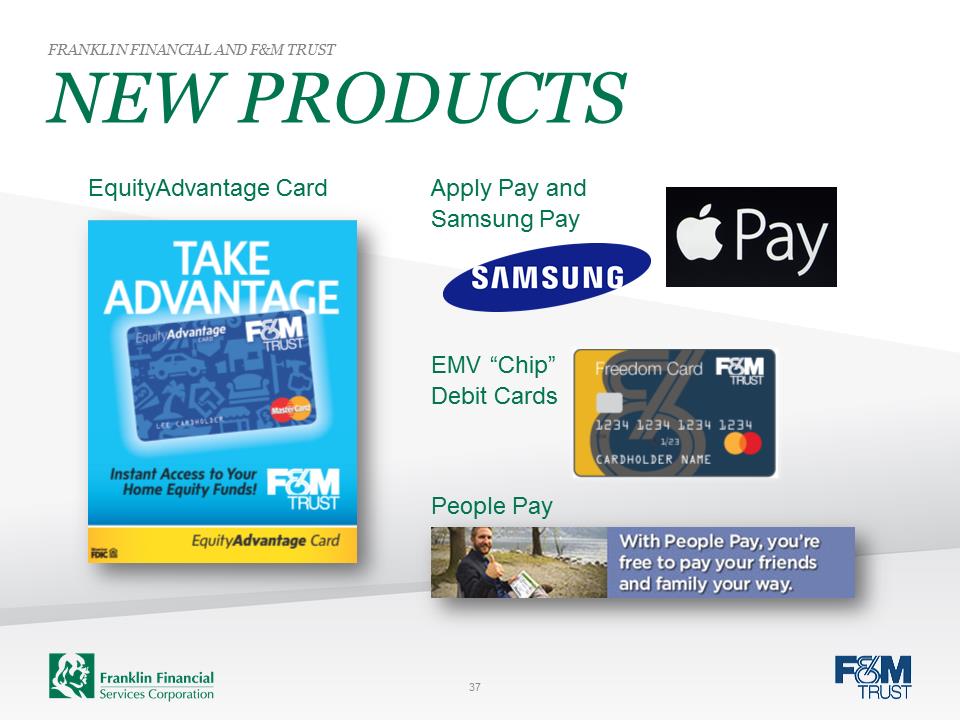 NEW PRODUCTS FRANKLIN FINANCIAL AND F&M TRUST EquityAdvantage Card http://mobileidworld.com/assets/Apple-Pay-1.jpgApply Pay and Samsung Pay EMV “Chip” Debit Cards People Pay 37

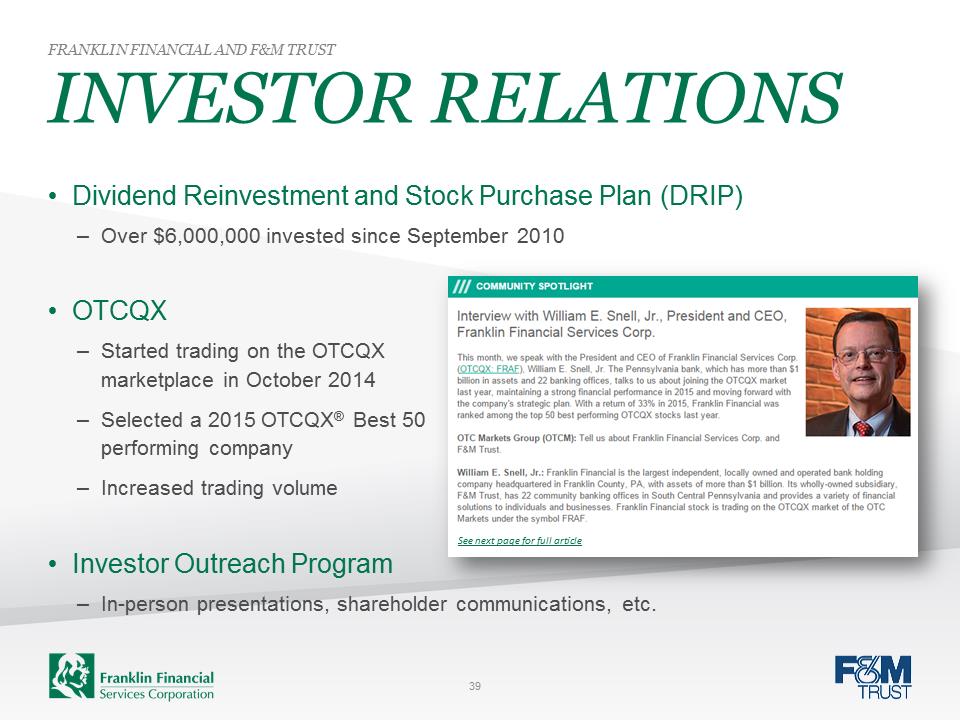 INVESTOR RELATIONS FRANKLIN FINANCIAL AND F&M TRUST •Dividend Reinvestment and Stock Purchase Plan (DRIP) –Over $6,000,000 invested since September 2010 •OTCQX –Started trading on the OTCQX marketplace in October 2014 –Selected a 2015 OTCQX® Best 50 performing company –Increased trading volume •Investor Outreach Program –In-person presentations, shareholder communications, etc. 39
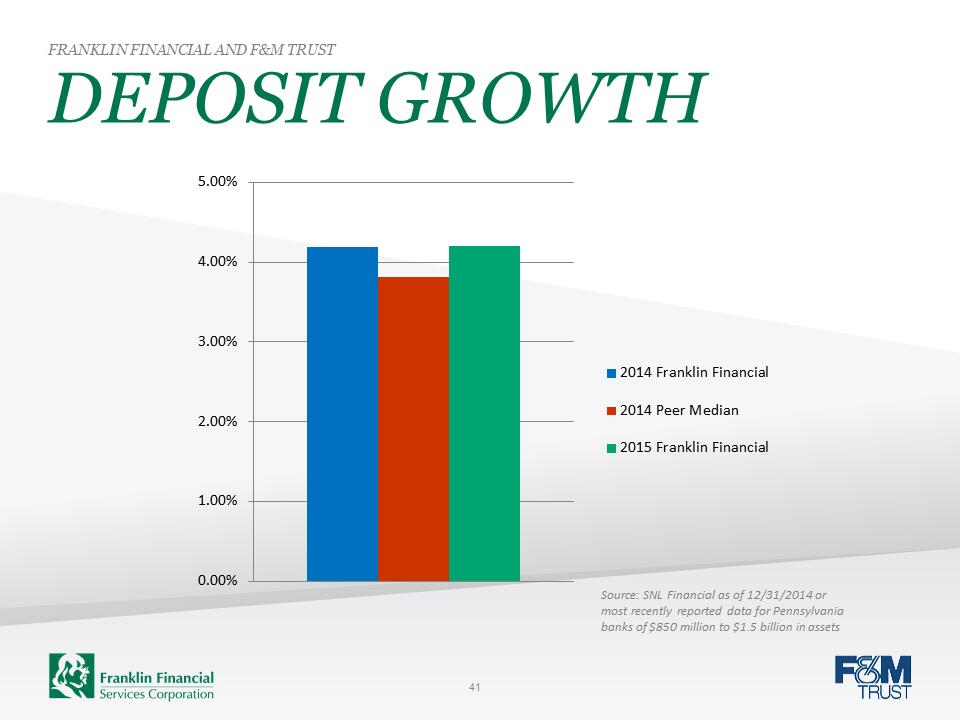 DEPOSIT GROWTH FRANKLIN FINANCIAL AND F&M TRUST Source: SNL Financial as of 12/31/2014 or most recently reported data for Pennsylvania banks of $850 million to $1.5 billion in assets 0.00%1.00%2.00%3.00%4.00%5.00%2014 Franklin Financial2014 Peer Median2015 Franklin Financial41
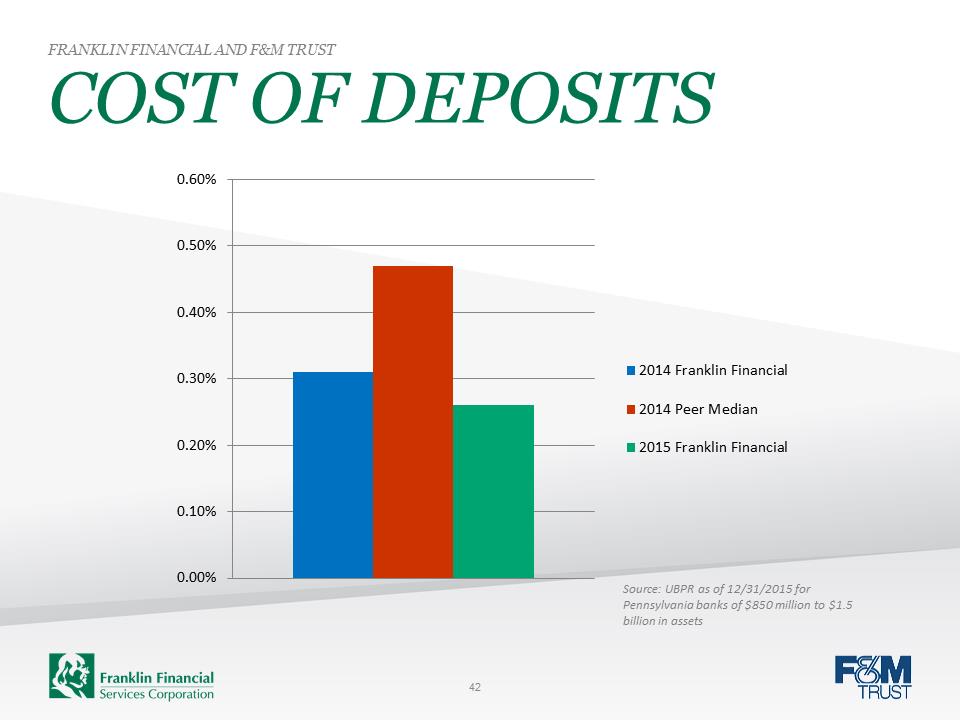 COST OF DEPOSITS FRANKLIN FINANCIAL AND F&M TRUST 0.00%0.10%0.20%0.30%0.40%0.50%0.60%2014 Franklin Financial2014 Peer Median2015 Franklin FinancialSource: UBPR as of 12/31/2015 for Pennsylvania banks of $850 million to $1.5 billion in assets 42
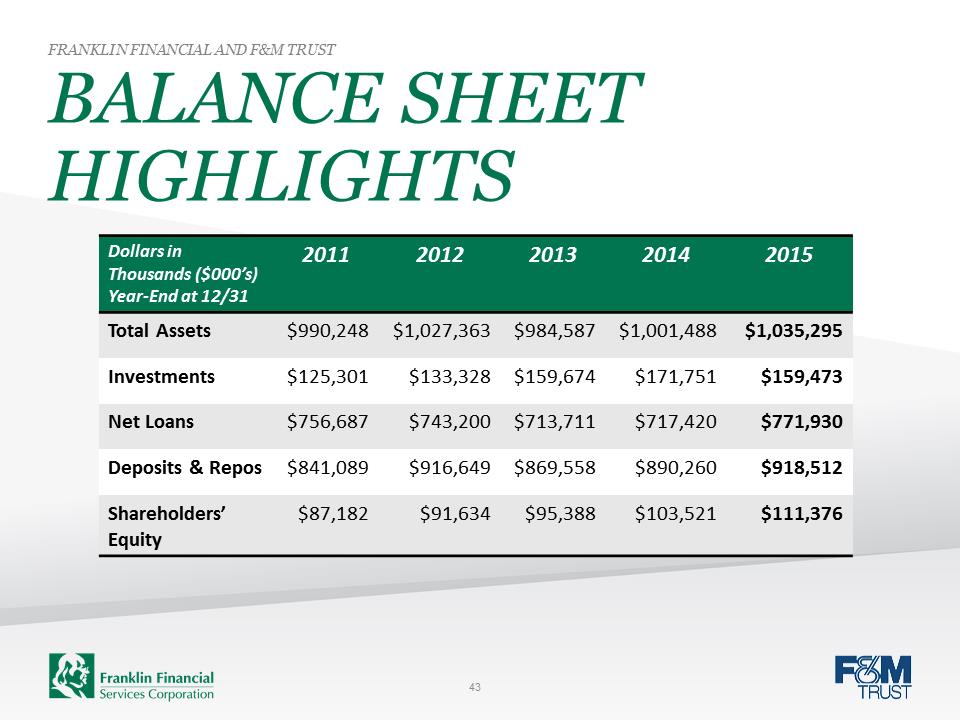 BALANCE SHEET HIGHLIGHTS FRANKLIN FINANCIAL AND F&M TRUST Dollars in Thousands ($000’s) Year-End at 12/31 2011 2012 2013 2014 2015 Total Assets $990,248 $1,027,363 $984,587 $1,001,488 $1,035,295 Investments $125,301 $133,328 $159,674 $171,751 $159,473 Net Loans $756,687 $743,200 $713,711 $717,420 $771,930 Deposits & Repos $841,089 $916,649 $869,558 $890,260 $918,512 Shareholders’ Equity $87,182 $91,634 $95,388 $103,521 $111,376 43
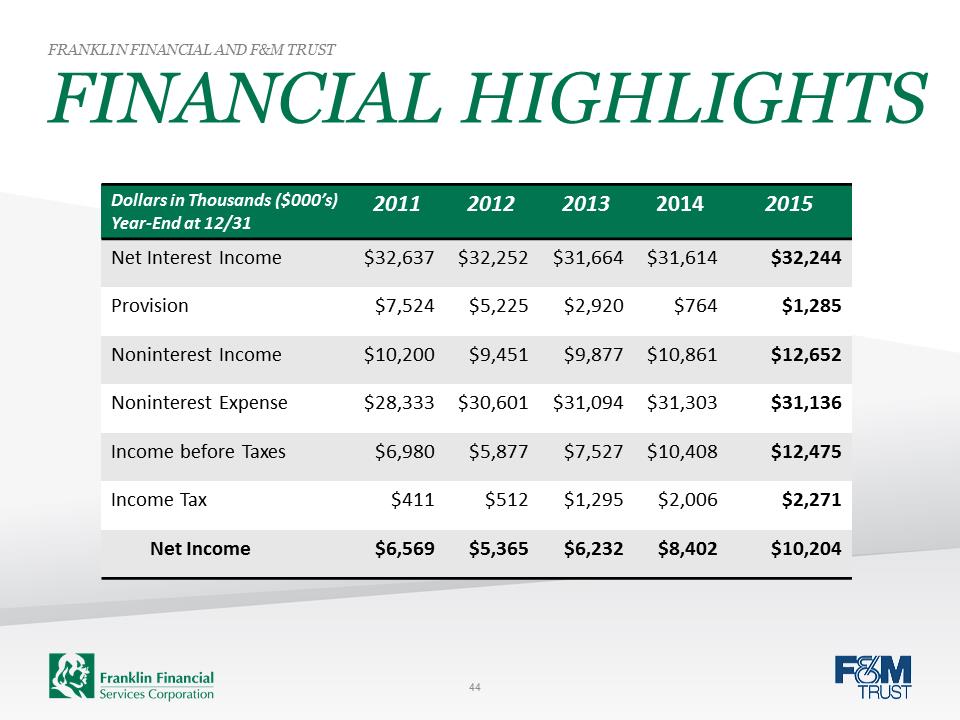 FINANCIAL HIGHLIGHTS FRANKLIN FINANCIAL AND F&M TRUST Dollars in Thousands ($000’s) Year-End at 12/31 2011 2012 2013 2014 2015 Net Interest Income $32,637 $32,252 $31,664 $31,614 $32,244 Provision $7,524 $5,225 $2,920 $764 $1,285 Noninterest Income $10,200 $9,451 $9,877 $10,861 $12,652 Noninterest Expense $28,333 $30,601 $31,094 $31,303 $31,136 Income before Taxes $6,980 $5,877 $7,527 $10,408 $12,475 Income Tax $411 $512 $1,295 $2,006 $2,271 Net Income $6,569 $5,365 $6,232 $8,402 $10,204 44
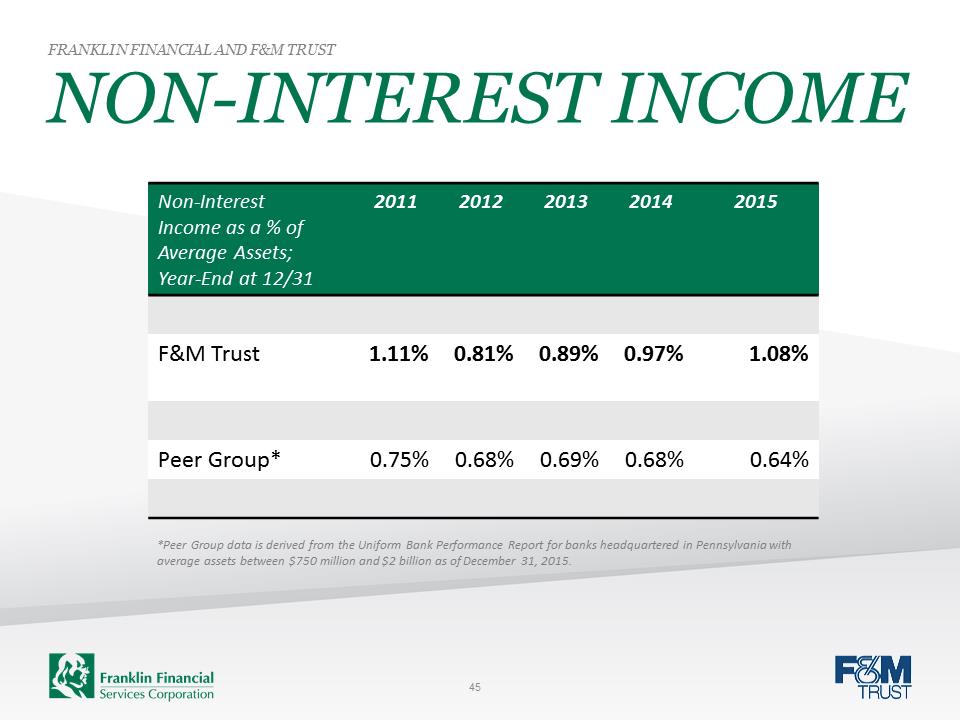 NON-INTEREST INCOME FRANKLIN FINANCIAL AND F&M TRUST Non-Interest Income as a % of Average Assets; Year-End at 12/31 2011 2012 2013 2014 2015 F&M Trust 1.11% 0.81% 0.89% 0.97% 1.08% Peer Group* 0.75% 0.68% 0.69% 0.68% 0.64% *Peer Group data is derived from the Uniform Bank Performance Report for banks headquartered in Pennsylvania with average assets between $750 million and $2 billion as of December 31, 2015. 45
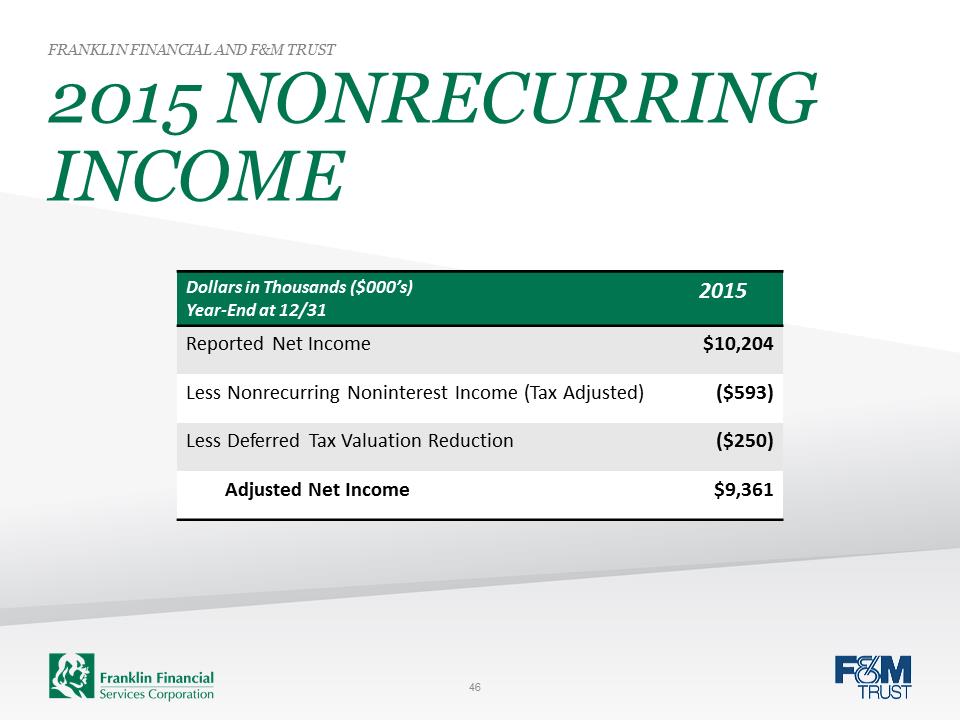 2015 NONRECURRING INCOME FRANKLIN FINANCIAL AND F&M TRUST Dollars in Thousands ($000’s) Year-End at 12/31 2015 Reported Net Income $10,204 Less Nonrecurring Noninterest Income (Tax Adjusted) ($593) Less Deferred Tax Valuation Reduction ($250) Adjusted Net Income $9,361 46
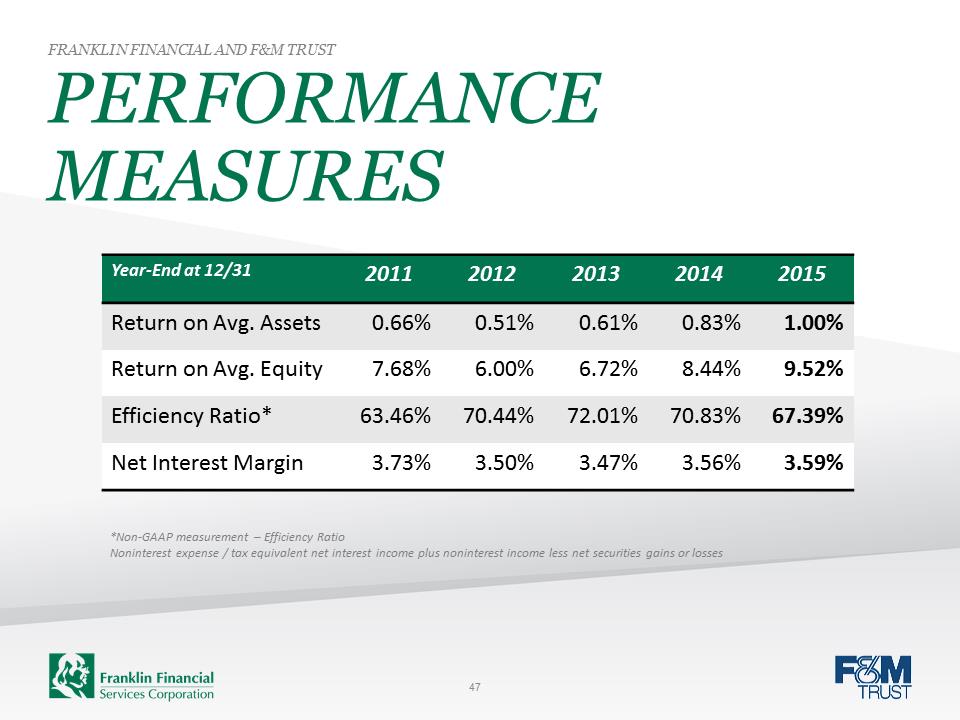 PERFORMANCE MEASURES FRANKLIN FINANCIAL AND F&M TRUST Year-End at 12/31 2011 2012 2013 2014 2015 Return on Avg. Assets 0.66% 0.51% 0.61% 0.83% 1.00% Return on Avg. Equity 7.68% 6.00% 6.72% 8.44% 9.52% Efficiency Ratio* 63.46% 70.44% 72.01% 70.83% 67.39% Net Interest Margin 3.73% 3.50% 3.47% 3.56% 3.59% *Non-GAAP measurement – Efficiency Ratio Noninterest expense / tax equivalent net interest income plus noninterest income less net securities gains or losses 47
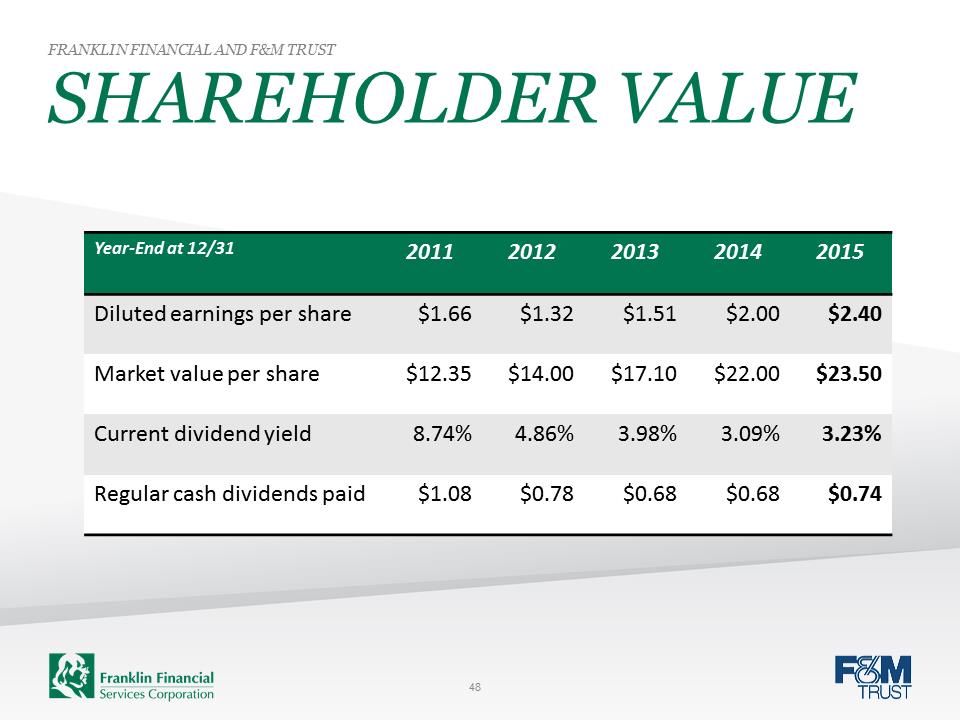 SHAREHOLDER VALUE FRANKLIN FINANCIAL AND F&M TRUST Year-End at 12/31 2011 2012 2013 2014 2015 Diluted earnings per share $1.66 $1.32 $1.51 $2.00 $2.40 Market value per share $12.35 $14.00 $17.10 $22.00 $23.50 Current dividend yield 8.74% 4.86% 3.98% 3.09% 3.23% Regular cash dividends paid $1.08 $0.78 $0.68 $0.68 $0.74 48
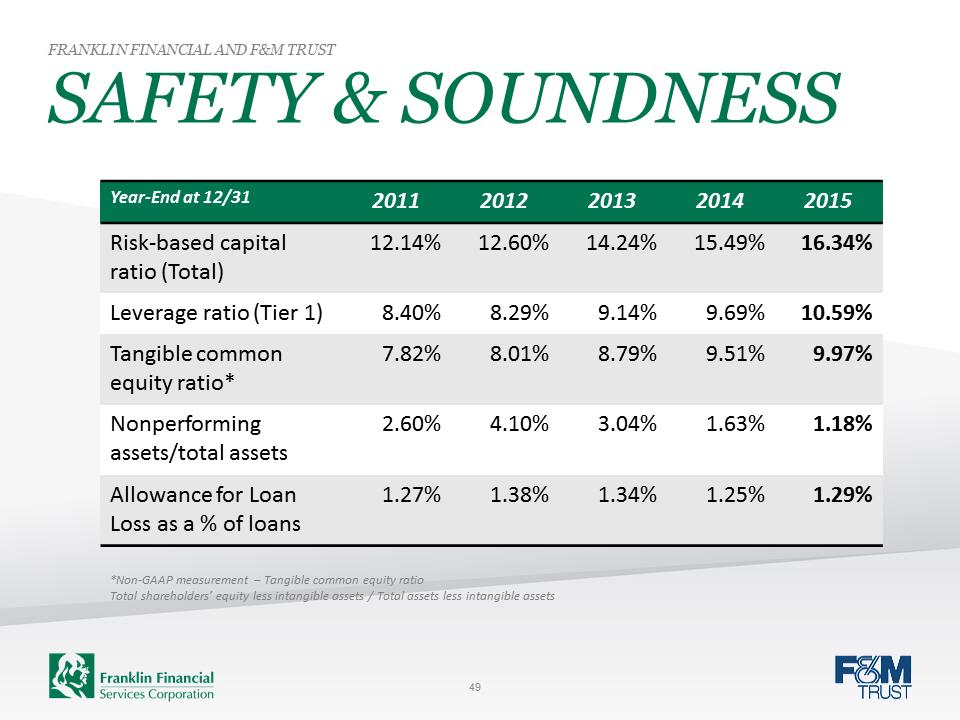 SAFETY & SOUNDNESS FRANKLIN FINANCIAL AND F&M TRUST Year-End at 12/31 2011 2012 2013 2014 2015 Risk-based capital ratio (Total) 12.14% 12.60% 14.24% 15.49% 16.34% Leverage ratio (Tier 1) 8.40% 8.29% 9.14% 9.69% 10.59% Tangible common equity ratio* 7.82% 8.01% 8.79% 9.51% 9.97% Nonperforming assets/total assets 2.60% 4.10% 3.04% 1.63% 1.18% Allowance for Loan Loss as a % of loans 1.27% 1.38% 1.34% 1.25% 1.29% *Non-GAAP measurement – Tangible common equity ratio Total shareholders’ equity less intangible assets / Total assets less intangible assets 49

 Stock Symbol: FRAF (OTCQX) www.franklinfin.com www.fmtrustonline.com 51