Attached files
| file | filename |
|---|---|
| 8-K - 8-K - ESTERLINE TECHNOLOGIES CORP | d126084d8k.htm |
| EX-99.1 - EX-99.1 - ESTERLINE TECHNOLOGIES CORP | d126084dex991.htm |
Q1 2016 Supplemental Financial Information February 4, 2016 Exhibit 99.2
This presentation may contain "forward-looking statements" within the meaning of the Private Securities Litigation Reform Act of 1995. These statements relate to future events or our future financial performance. In some cases, you can identify forward-looking statements by terminology such as “anticipate,” “believe,” “continue,” “could,” “estimate,” “expect,” “intend,” “may,” “might,” “plan,” “potential,” “predict,” “should” or “will,” or the negative of such terms, or other comparable terminology. These forward-looking statements are only predictions based on the current intent and expectations of the management of Esterline, are not guarantees of future performance or actions, and involve risks and uncertainties that are difficult to predict and may cause Esterline’s or its industry’s actual results, performance or achievements to be materially different from any future results, performance or achievements expressed or implied by the forward-looking statements. Esterline's actual results and the timing and outcome of events may differ materially from those expressed in or implied by the forward-looking statements due to risks detailed in Esterline's public filings with the Securities and Exchange Commission including its most recent Transition Report on Form 10-K. This presentation may also contain references to non-GAAP financial information subject to Regulation G. The reconciliations of each non-GAAP financial measure to its comparable GAAP measure as well as further information on management’s use of non-GAAP financial measures are included in Esterline’s press release dated February 4, 2016, included as Exhibit 99.1 to Form 8-K filed with the SEC on the same date, as well as in this presentation.
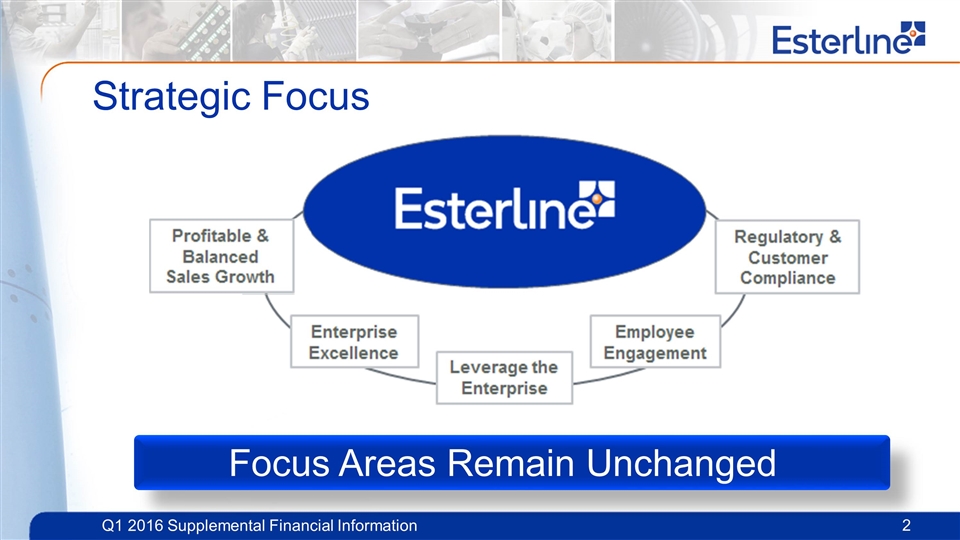
Strategic Focus Focus Areas Remain Unchanged
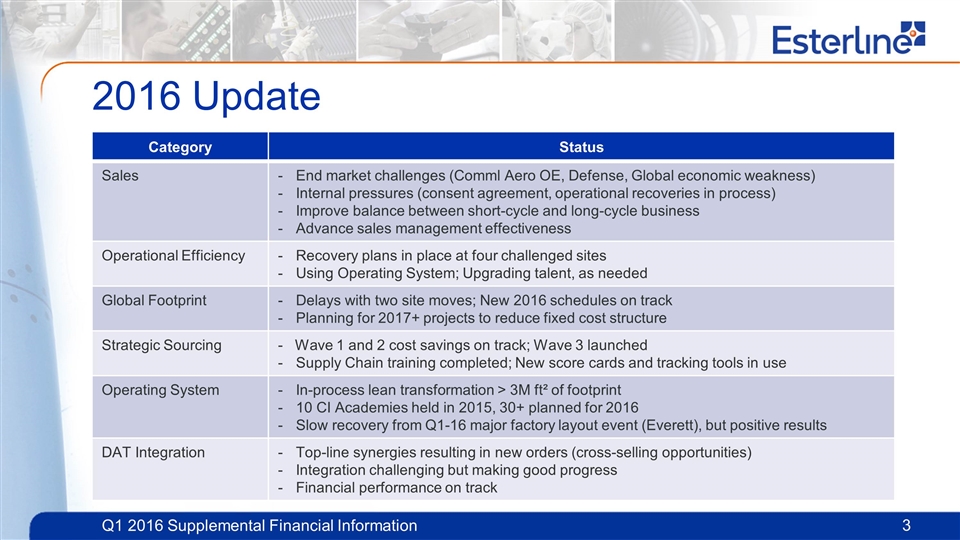
Category Status Sales End market challenges (Comml Aero OE, Defense, Global economic weakness) Internal pressures (consent agreement, operational recoveries in process) Improve balance between short-cycle and long-cycle business Advance sales management effectiveness Operational Efficiency Recovery plans in place at four challenged sites Using Operating System; Upgrading talent, as needed Global Footprint Delays with two site moves; New 2016 schedules on track Planning for 2017+ projects to reduce fixed cost structure Strategic Sourcing - Wave 1 and 2 cost savings on track; Wave 3 launched Supply Chain training completed; New score cards and tracking tools in use Operating System In-process lean transformation > 3M ft² of footprint 10 CI Academies held in 2015, 30+ planned for 2016 Slow recovery from Q1-16 major factory layout event (Everett), but positive results DAT Integration Top-line synergies resulting in new orders (cross-selling opportunities) Integration challenging but making good progress Financial performance on track 2016 Update
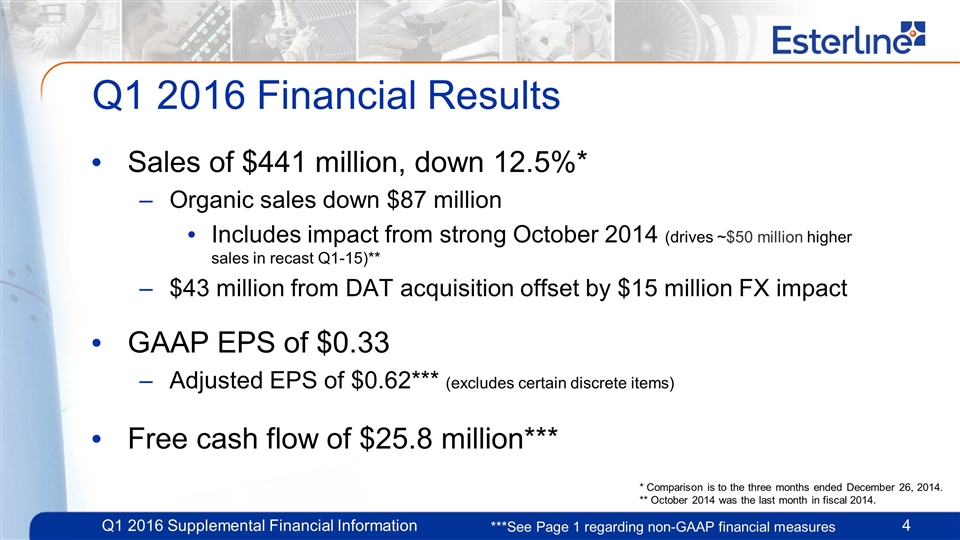
Q1 2016 Financial Results Sales of $441 million, down 12.5%* Organic sales down $87 million Includes impact from strong October 2014 (drives ~$50 million higher sales in recast Q1-15)** $43 million from DAT acquisition offset by $15 million FX impact GAAP EPS of $0.33 Adjusted EPS of $0.62*** (excludes certain discrete items) Free cash flow of $25.8 million*** ***See Page 1 regarding non-GAAP financial measures * Comparison is to the three months ended December 26, 2014. ** October 2014 was the last month in fiscal 2014.
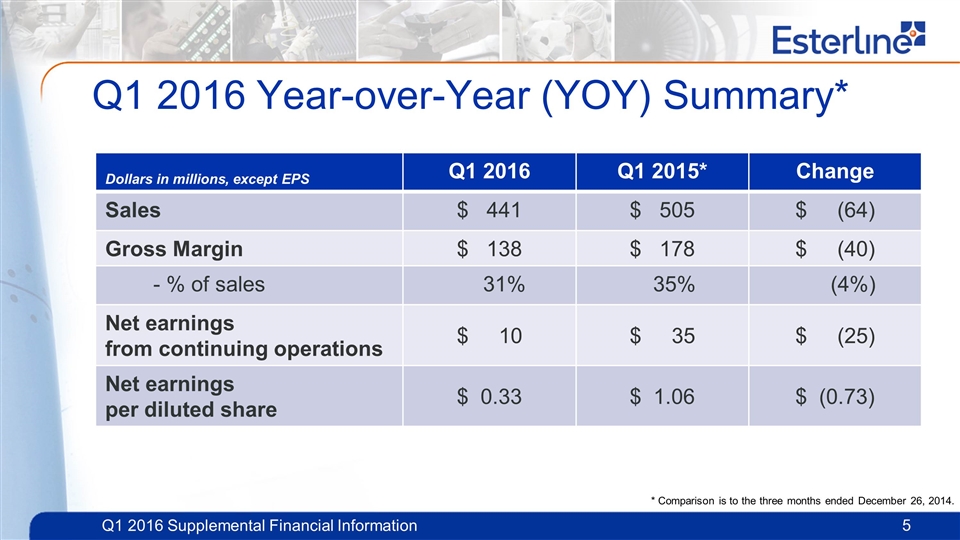
Q1 2016 Year-over-Year (YOY) Summary* Dollars in millions, except EPS Q1 2016 Q1 2015* Change Sales $ 441 $ 505 $ (64) Gross Margin $ 138 $ 178 $ (40) - % of sales 31% 35% (4%) Net earnings from continuing operations $ 10 $ 35 $ (25) Net earnings per diluted share $ 0.33 $ 1.06 $ (0.73) * Comparison is to the three months ended December 26, 2014.
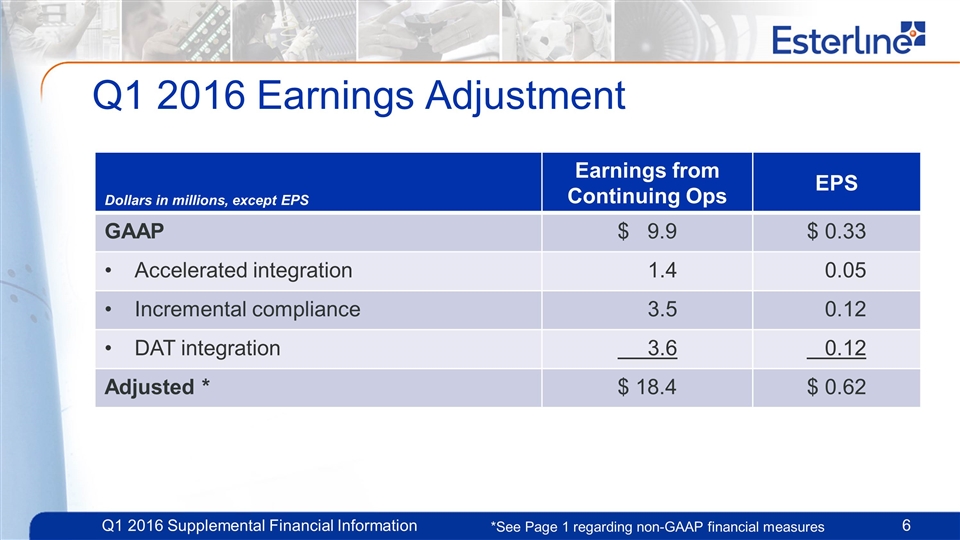
Q1 2016 Earnings Adjustment Dollars in millions, except EPS Earnings from Continuing Ops EPS GAAP $ 9.9 $ 0.33 Accelerated integration 1.4 0.05 Incremental compliance 3.5 0.12 DAT integration 3.6 0.12 Adjusted * $ 18.4 $ 0.62 *See Page 1 regarding non-GAAP financial measures
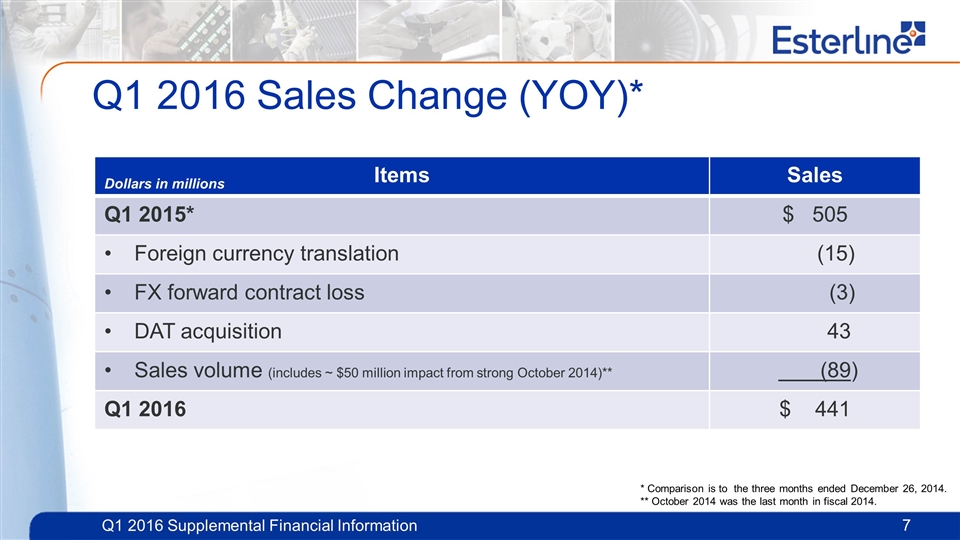
Q1 2016 Sales Change (YOY)* Items Sales Q1 2015* $ 505 Foreign currency translation (15) FX forward contract loss (3) DAT acquisition 43 Sales volume (includes ~ $50 million impact from strong October 2014)** (89) Q1 2016 $ 441 Dollars in millions * Comparison is to the three months ended December 26, 2014. ** October 2014 was the last month in fiscal 2014.
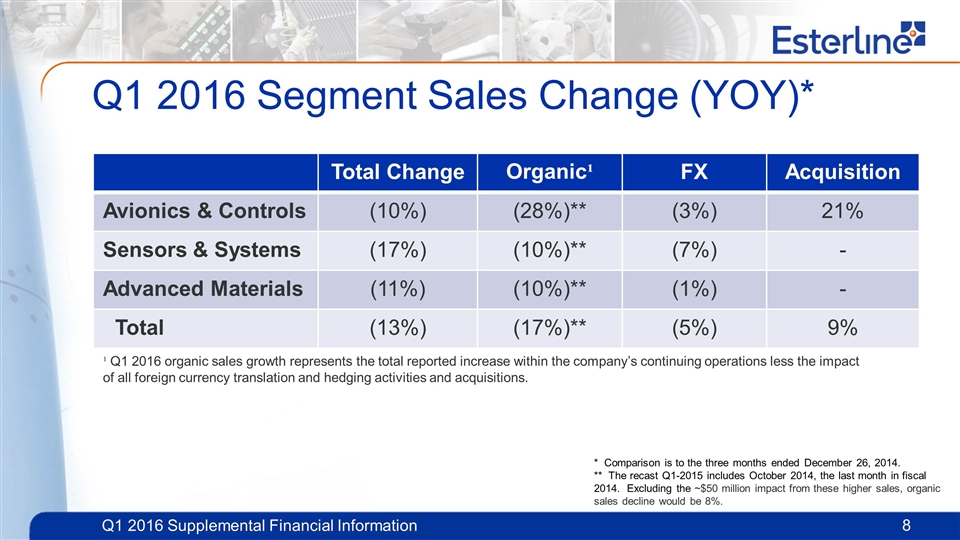
Q1 2016 Segment Sales Change (YOY)* Total Change Organic¹ FX Acquisition Avionics & Controls (10%) (28%)** (3%) 21% Sensors & Systems (17%) (10%)** (7%) - Advanced Materials (11%) (10%)** (1%) - Total (13%) (17%)** (5%) 9% ¹ Q1 2016 organic sales growth represents the total reported increase within the company’s continuing operations less the impact of all foreign currency translation and hedging activities and acquisitions. * Comparison is to the three months ended December 26, 2014. ** The recast Q1-2015 includes October 2014, the last month in fiscal 2014. Excluding the ~$50 million impact from these higher sales, organic sales decline would be 8%.
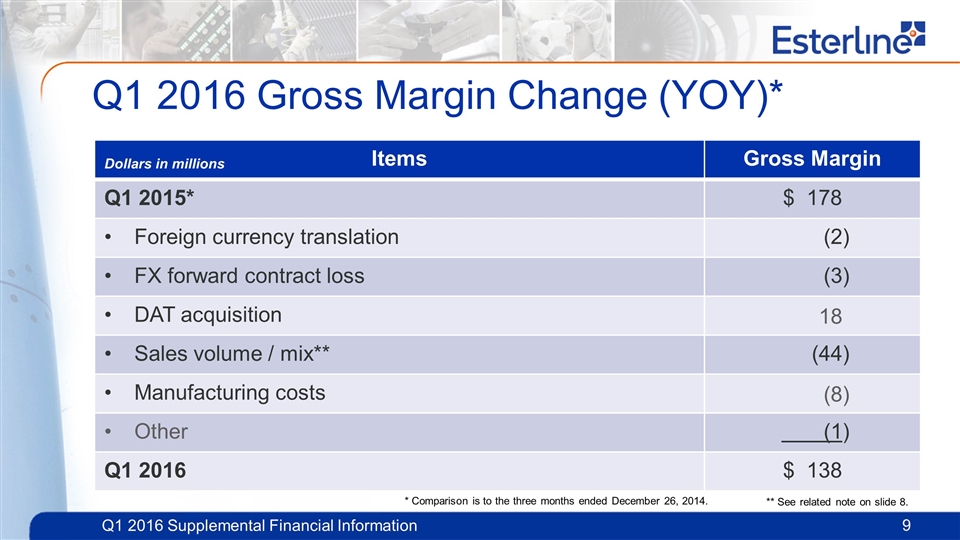
Q1 2016 Gross Margin Change (YOY)* Items Gross Margin Q1 2015* $ 178 Foreign currency translation (2) FX forward contract loss (3) DAT acquisition 18 Sales volume / mix** (44) Manufacturing costs (8) Other (1) Q1 2016 $ 138 Dollars in millions ** See related note on slide 8. * Comparison is to the three months ended December 26, 2014.
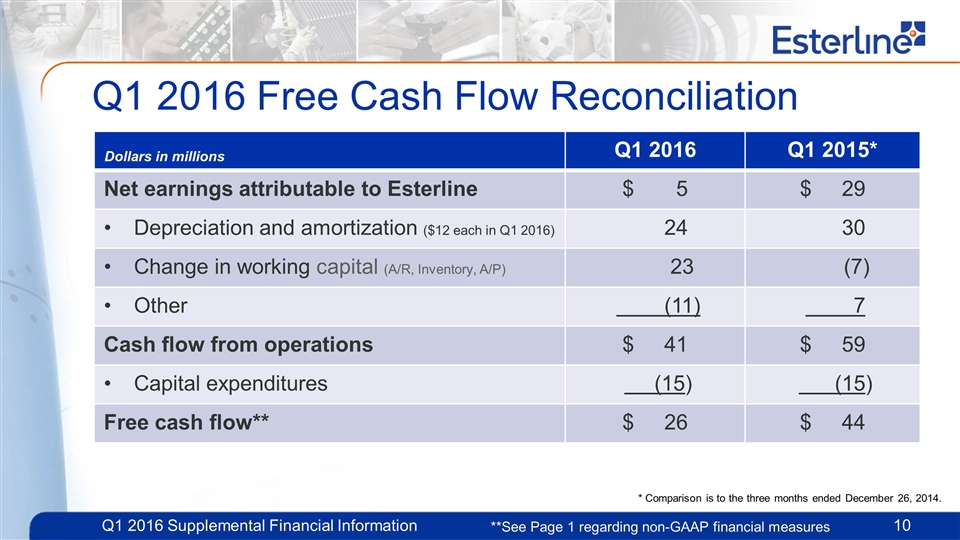
Q1 2016 Free Cash Flow Reconciliation Q1 2016 Q1 2015* Net earnings attributable to Esterline $ 5 $ 29 Depreciation and amortization ($12 each in Q1 2016) 24 30 Change in working capital (A/R, Inventory, A/P) 23 (7) Other (11) 7 Cash flow from operations $ 41 $ 59 Capital expenditures (15) (15) Free cash flow** $ 26 $ 44 Dollars in millions **See Page 1 regarding non-GAAP financial measures * Comparison is to the three months ended December 26, 2014.
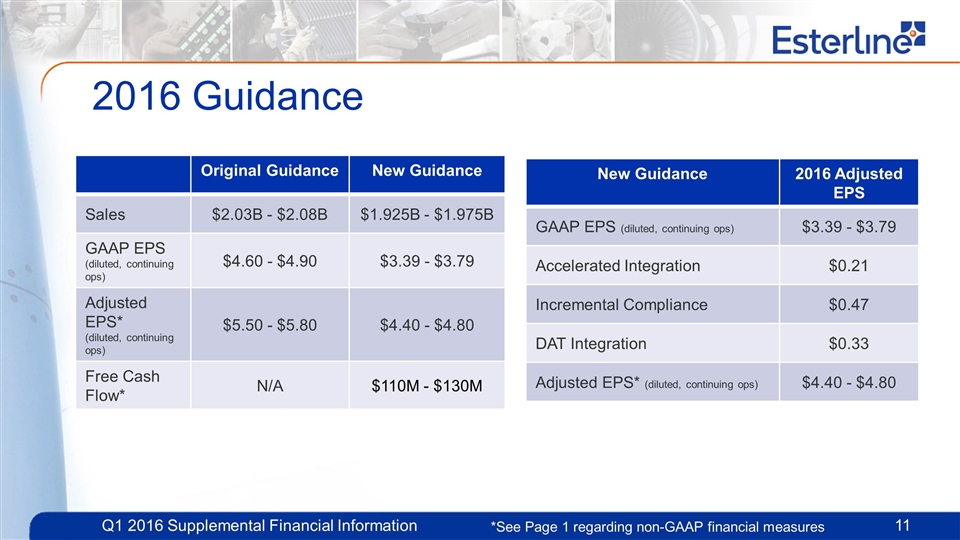
2016 Guidance Original Guidance New Guidance Sales $2.03B - $2.08B $1.925B - $1.975B GAAP EPS (diluted, continuing ops) $4.60 - $4.90 $3.39 - $3.79 Adjusted EPS* (diluted, continuing ops) $5.50 - $5.80 $4.40 - $4.80 Free Cash Flow* N/A $110M - $130M *See Page 1 regarding non-GAAP financial measures New Guidance 2016 Adjusted EPS GAAP EPS (diluted, continuing ops) $3.39 - $3.79 Accelerated Integration $0.21 Incremental Compliance $0.47 DAT Integration $0.33 Adjusted EPS* (diluted, continuing ops) $4.40 - $4.80
Appendix
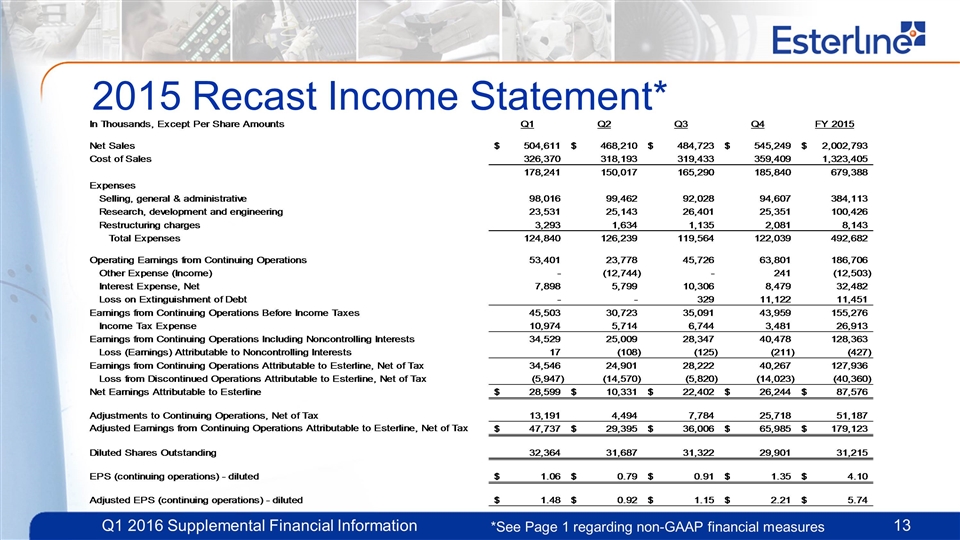
2015 Recast Income Statement* *See Page 1 regarding non-GAAP financial measures
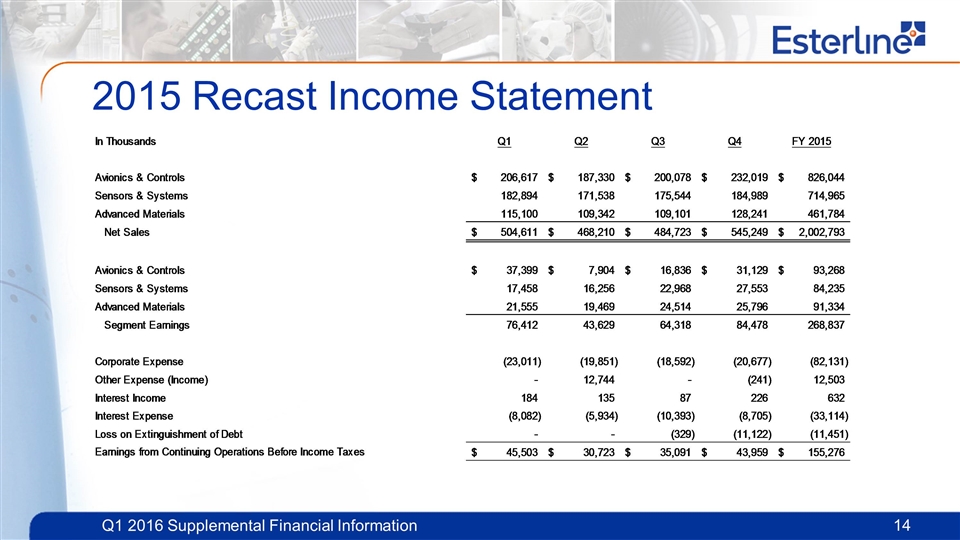
2015 Recast Income Statement
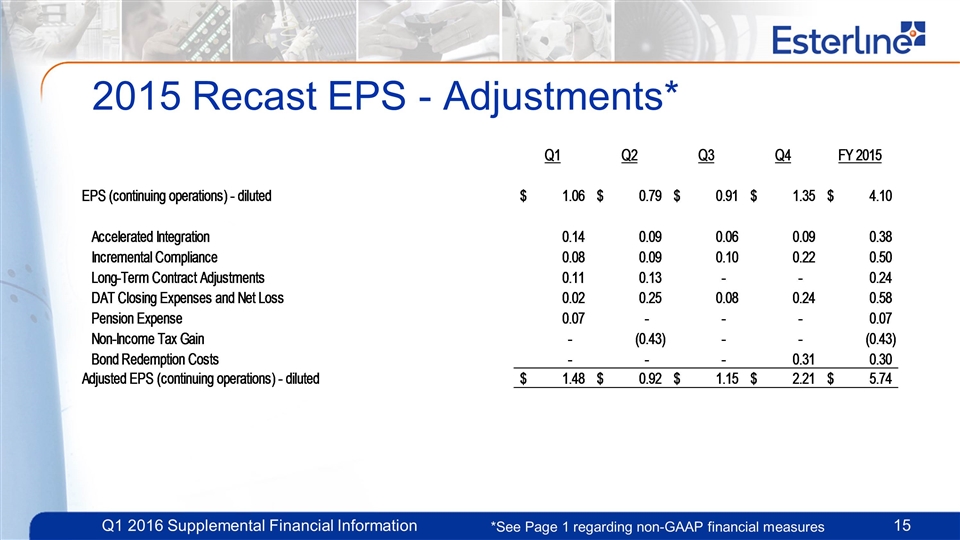
2015 Recast EPS - Adjustments* *See Page 1 regarding non-GAAP financial measures
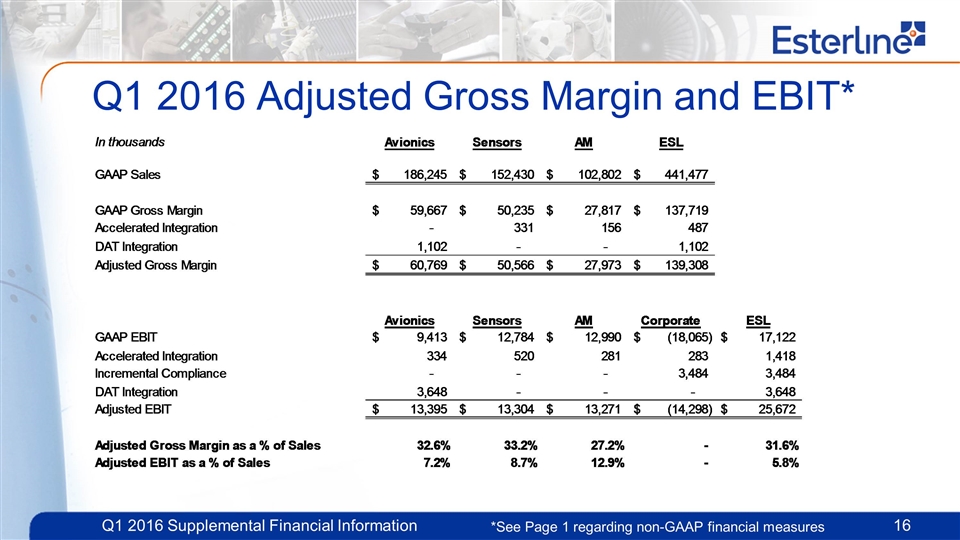
Q1 2016 Adjusted Gross Margin and EBIT* *See Page 1 regarding non-GAAP financial measures
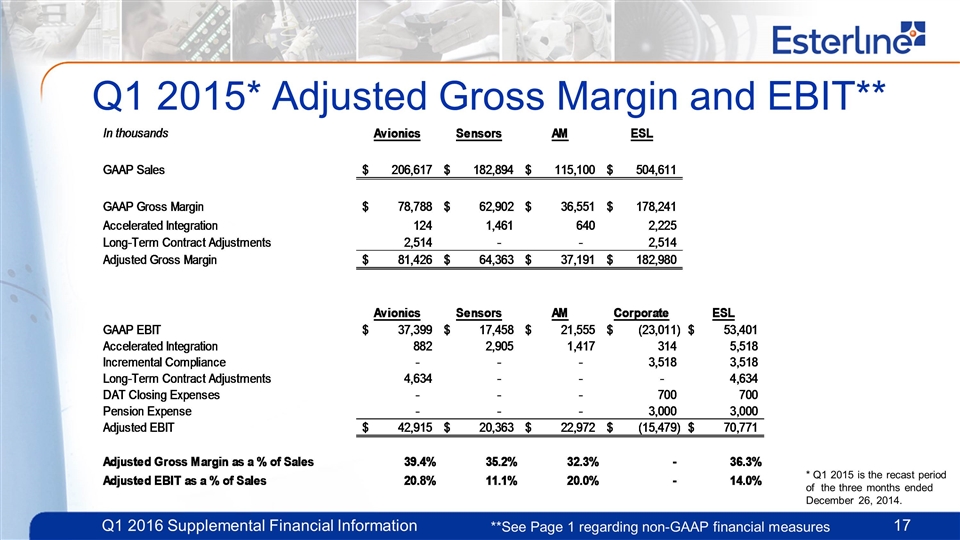
Q1 2015* Adjusted Gross Margin and EBIT** **See Page 1 regarding non-GAAP financial measures * Q1 2015 is the recast period of the three months ended December 26, 2014.
