Attached files
| file | filename |
|---|---|
| 8-K - 8-K - Carbonite Inc | a8-kq42015earningsrelease.htm |
| EX-99.1 - EXHIBIT 99.1 - Carbonite Inc | exhibit991q42015.htm |
| EX-10.1 - EXHIBIT 10.1 - Carbonite Inc | executiveseveranceplan.htm |

CARBONITE REPORTS FOURTH QUARTER AND FULL YEAR FINANCIAL RESULTS FOR 2015 February 4, 2016

EMILY WALT Director, Investor Relations

SAFE HARBOR STATEMENT These slides and the accompanying oral presentation contain "forward-looking statements" within the meaning of the Securities Act of 1933 and the Securities Exchange Act of 1934, as amended by the Private Securities Litigation Reform Act of 1995. These forward-looking statements represent the Company's views as of the date they were first made based on the current intent, belief or expectations, estimates, forecasts, assumptions and projections of the Company and members of our management team. Words such as "expect," "anticipate," "should," "believe," "hope," "target," "project," "goals," "estimate," "potential," "predict," "may," "will," "might," "could," "intend," variations of these terms or the negative of these terms and similar expressions are intended to identify these forward-looking statements. Those statements include, but are not limited to, statements regarding guidance on our future financial results and other projections or measures of future performance, the expected future results of the acquisition of EVault, including revenues and growth rates; the Company’s ability to successfully integrate EVault’s business; and the Company’s expectations regarding its future performance. Forward-looking statements are subject to a number of risks and uncertainties, many of which involve factors or circumstances that are beyond the Company's control. The Company's actual results could differ materially from those stated or implied in forward-looking statements due to a number of factors, including, but not limited to, the Company's ability to profitably attract new customers and retain existing customers, including the customers of EVault, the Company's dependence on the market for cloud backup services, the Company's ability to manage growth, and changes in economic or regulatory conditions or other trends affecting the Internet and the information technology industry. These and other important risk factors are discussed under the heading "Risk Factors" in our Annual Report on Form 10-K for the fiscal year ended December 31, 2014 filed with the Securities and Exchange Commission, which is available on www.sec.gov. Except as required by law, we do not undertake any obligation to update our forward-looking statements to reflect future events, new information or circumstances. This presentation contains non-GAAP financial measures including, but not limited to, non-GAAP Revenue, non-GAAP Gross Margin, non-GAAP EPS and Free Cash Flow. A reconciliation to GAAP can be found in the financial schedules included in our most recent earnings press release which can be found on Carbonite’s website, investors.carbonite.com, in the Company’s filings or with the SEC at www.sec.gov. 3

MOHAMAD ALI President & CEO

ANTHONY FOLGER CFO & Treasurer
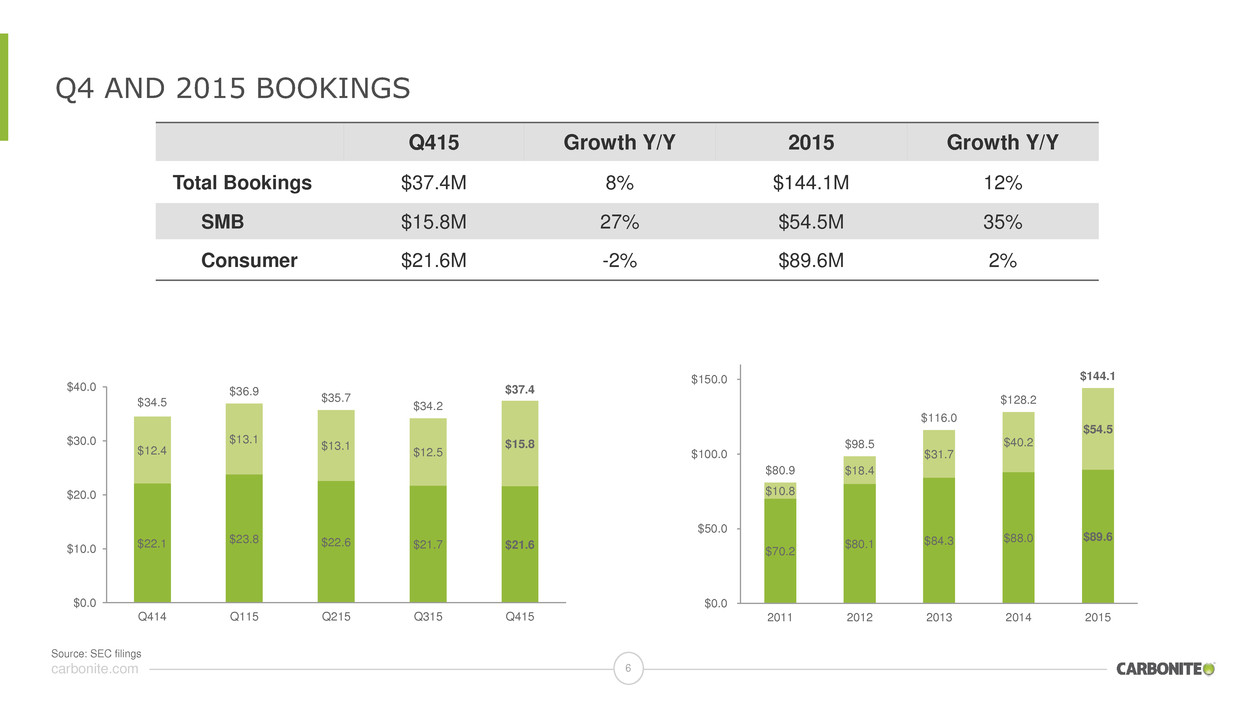
carbonite.com Q4 AND 2015 BOOKINGS 6 Q415 Growth Y/Y 2015 Growth Y/Y Total Bookings $37.4M 8% $144.1M 12% SMB $15.8M 27% $54.5M 35% Consumer $21.6M -2% $89.6M 2% $22.1 $23.8 $22.6 $21.7 $21.6 $12.4 $13.1 $13.1 $12.5 $15.8 $34.5 $36.9 $35.7 $34.2 $37.4 $0.0 $10.0 $20.0 $30.0 $40.0 Q414 Q115 Q215 Q315 Q415 $70.2 $80.1 $84.3 $88.0 $89.6 $10.8 $18.4 $31.7 $40.2 $54.5 $80.9 $98.5 $116.0 $128.2 $144.1 $0.0 $50.0 $100.0 $150.0 2011 2012 2013 2014 2015 Source: SEC filings

carbonite.com Q4 AND 2015 REVENUE 7 $31.9 $33.0 $34.0 $34.6 $35.1 $10.0 $20.0 $30.0 $40.0 Q414 Q115 Q215 Q315 Q415 Q415 Growth Y/Y 2015 Growth Y/Y Total Revenue $35.1M 10% $136.6M 11% $60.5 $84.0 $107.2 $122.6 $136.6 $0.0 $50.0 $100.0 $150.0 2011 2012 2013 2014 2015 Source: SEC filings

carbonite.com Q4 AND 2015 Non-GAAP GROSS MARGINS 8 69.5% 71.1% 72.6% 73.2% 75.3% 50.0% 60.0% 70.0% 80.0% Q414 Q115 Q215 Q315 Q415 For a full reconciliation of GAAP to non-GAAP, please see the Appendix. Q415 Growth Y/Y 2015 Growth Y/Y Non-GAAP Gross Margin 75.3% 580 bps 73.1% 380bps 62.2% 66.2% 68.4% 69.3% 73.1% 50.0% 60.0% 70.0% 80.0% 2011 2012 2013 2014 2015 Source: SEC filings

carbonite.com TOTAL CASH AND FREE CASH FLOW 9 $4.2 $1.5 $2.1 $7.1 $2.6 $3.2 $1.4 $7.1 Q114 Q214 Q314 Q414 Q115 Q215 Q315 Q415 Free Cash Flow For a full reconciliation of GAAP to non-GAAP, please see the Appendix Numbers may not foot due to rounding. 2015 Growth Y/Y Total Cash and Investments $64.9M 6% Total Stock Repurchases $5.4M ($6.0) ($4.1) $6.0 $15.1 $14.3 2011 2012 2013 2014 2015 Annual Free Cash Flow Source: SEC filings

carbonite.com 2016: INTEGRATION AND EXPECTED SYNERGIES 10 Products & Engineering Go-to-Market Infrastructure Three Areas of Focus • Reduce datacenter footprint • Increase automation • Transition to lower cost drives • Migrate critical systems to common platforms • Complete back-office integration • Combine engineering organizations • EVault packaging and pricing review • Introduce EVault to Carbonite resellers • Targeted lead routing for Sales • Unify partner programs
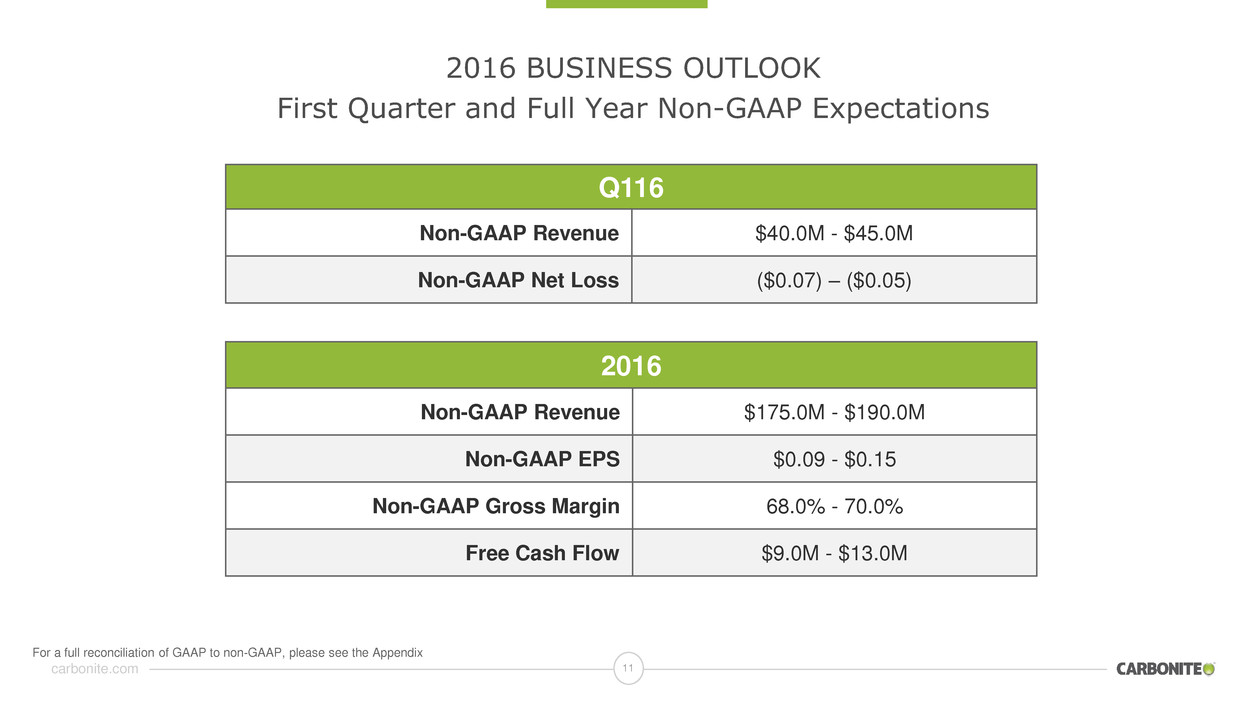
11 carbonite.com 2016 BUSINESS OUTLOOK First Quarter and Full Year Non-GAAP Expectations Q116 Non-GAAP Revenue $40.0M - $45.0M Non-GAAP Net Loss ($0.07) – ($0.05) 2016 Non-GAAP Revenue $175.0M - $190.0M Non-GAAP EPS $0.09 - $0.15 Non-GAAP Gross Margin 68.0% - 70.0% Free Cash Flow $9.0M - $13.0M For a full reconciliation of GAAP to non-GAAP, please see the Appendix

MOHAMAD ALI President & CEO

13 carbonite.com PARTNERS CUSTOMERS COST Improve GTM through Channel Partners Bring New Capabilities to Customers Drive Operational Synergies 2016 LOOKING AHEAD

carbonite.com GTM: IMPROVE GO-TO-MARKET THROUGH PARTNERSHIPS • Introduce Select Carbonite Resellers to EVault • Dramatically expand market reach • Drive Deals Through Strategic Alliances • Leverage existing relationships • Target MSPs to Expand Customer Base • Address new SMB market segments 14 Resellers Distributors DMRs VARs MSPs Strategic Alliances

carbonite.com Capabilities: CAPITALIZE ON GROWING MARKETS • Companies using cloud-based backup and disaster recovery will DOUBLE to 24% by 2017 • DRaaS market is expected to grow at a 30% CAGR by 2018 • Carbonite’s total addressable SMB market opportunity estimated at $40B worldwide 15 Source: Gartner, Carbonite

carbonite.com Capabilities: CARBONITE PRODUCT PORTFOLIO 16 • Great for small businesses, but missing functionality for midsized businesses

carbonite.com Capabilities: CARBONITE WITH EVAULT PRODUCT PORTFOLIO 17 • Full suite of solutions from home to high end of SMB market BY CARBONITE BY CARBONITE

carbonite.com Cloud Backup Success Story: WORLDWIDE HOSPITALITY LEADER RESTS EASY WITH EVAULT SOLUTION Customer: • $2B hotel leader in ~100 countries Challenge: • 1 solution to support 13 global call centers, 13 localized websites & 18,000 salespeople worldwide Solution: • EVault Cloud Backup and Recovery Appliance • Backups are replicated to the cloud • Single point of contact for all support needs Results: • EVault protects up to 75% of hotel’s IT infrastructure • Improved compliance with audit requirements automatically • Backup in minutes, recovery in as little as 1 hour 18 Source: EVault

carbonite.com DRaaS Success Story: NuCOMPASS MOBILITY MOVES FORWARD WITH EVAULT DISASTER RECOVERY PRODUCTS Customer: • Industry-leading domestic and global relocation management services company to corporate clients in 150 countries Challenge: • 1 solution for backup and disaster recovery that was simple, reliable and scalable Solution: • EVault Appliance with Cloud Disaster Recovery • Cloud DRaaS with real-time replication to “hot site” guarantees data is recoverable within 4 hours Results: • Passed SSAE 16 audit – which includes complete DR failover test - in record time with minimal disruption 19 Source: Evault
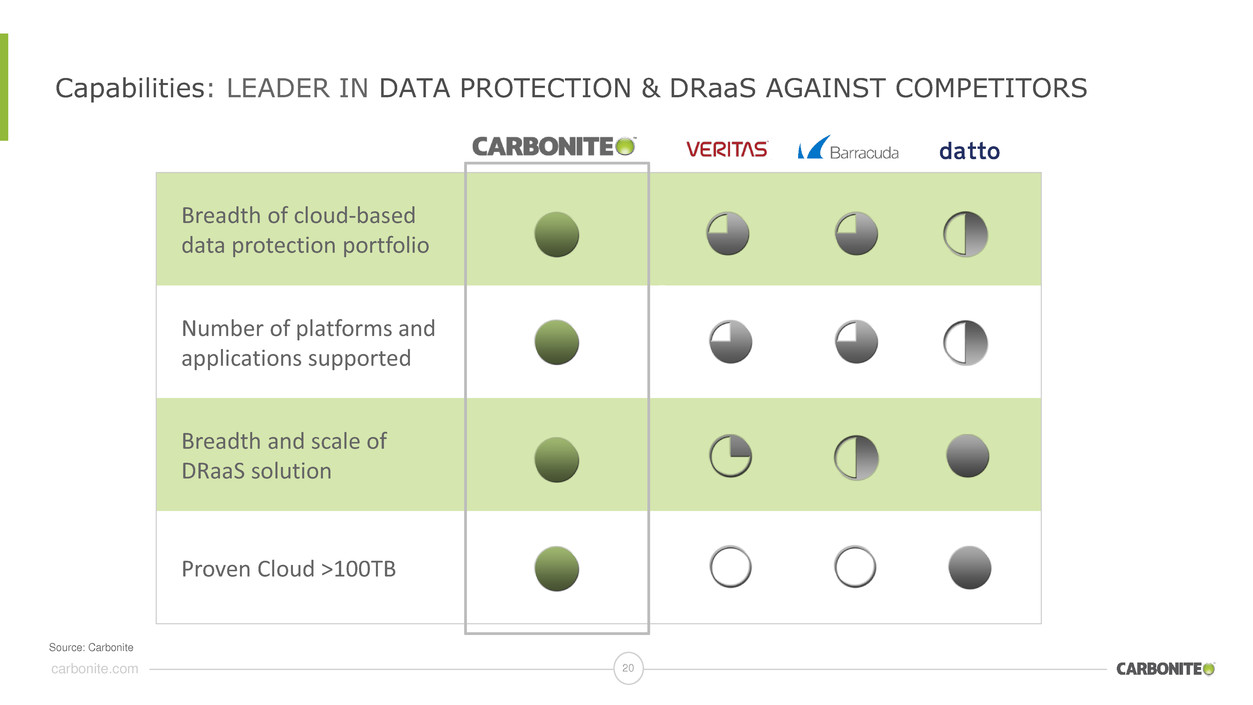
carbonite.com Capabilities: LEADER IN DATA PROTECTION & DRaaS AGAINST COMPETITORS 20 Breadth of cloud-based data protection portfolio Number of platforms and applications supported Breadth and scale of DRaaS solution Proven Cloud >100TB Source: Carbonite

carbonite.com Drive Operational Synergies: IMPROVE SCALE AND EFFICIENCY • Improve Data Center Efficiency • Reduce the number of EVault data centers • Leverage Carbonite expertise, reduce cost and optimize remaining data centers • Migrate Back Office Automation • Reduce, consolidate or replace systems where needed to drive cost savings $

22 carbonite.com 2016 Capitalize on the fast growing data protection and disaster recovery markets for SMBs Offer the industry’s most comprehensive products to our customers Drive growth through new products, new management & operational synergies

Questions?

APPENDIX

DEFINITION OF non-GAAP MEASURES Bookings: Represent the aggregate dollar value of customer subscriptions received during a period and are calculated as revenue recognized during a particular period plus the change in total deferred revenue, excluding deferred revenue recorded in connection with acquisitions, net of foreign exchange during the same period. Non-GAAP revenue: Excludes the impact of purchase accounting adjustments. Non-GAAP gross margin: Excludes amortization expense on intangible assets, stock-based compensation expense and acquisition-related expense. Non-GAAP net income (loss) and non-GAAP net income (loss) per share: Excludes amortization expense on intangible assets, stock-based compensation expense, litigation-related expense, restructuring-related expense, acquisition-related expense, hostile takeover-related expense, and CEO transition expense. Non-GAAP operating expense: Excludes amortization expense on intangible assets, stock-based compensation expense, litigation related expense, restructuring-related expense, acquisition-related expense, hostile takeover-related expense, and CEO transition expense. Free cash flow: Calculated by subtracting the cash paid for the purchase of property and equipment and adding the payments related to corporate headquarter relocation, acquisition-related payments, hostile takeover-related payments, CEO transition payments, litigation-related payments and the cash portion of the lease exit charge from net cash provided by operating activities.

