Attached files
| file | filename |
|---|---|
| 8-K - CURRENT REPORT - CMS ENERGY CORP | d80035d8k.htm |
Exhibit 99.1
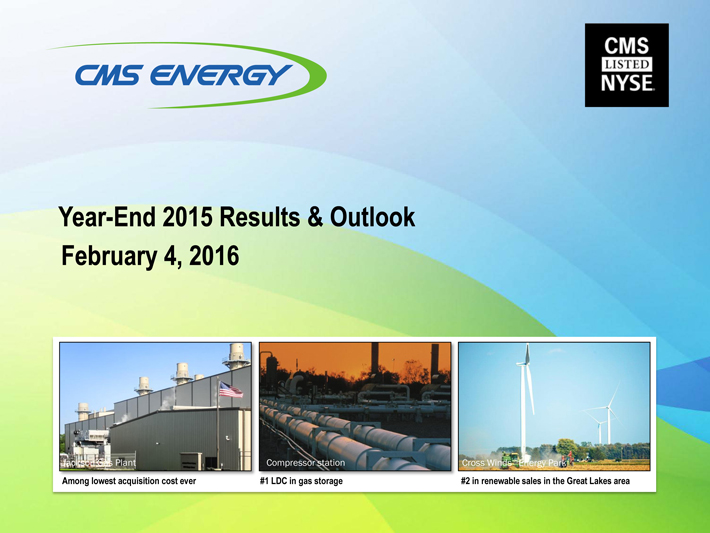
Exhibit 99.1
Year-End 2015 Results & Outlook February 4, 2016
Jackson Gas Plant
Among lowest acquisition cost ever
Compressor station
#1 LDC in gas storage
Cross Winds Energy Park
#2 in renewable sales in the Great Lakes area
This presentation is made as of the date hereof and contains “forward-looking statements” as defined in Rule 3b-6 of the Securities Exchange Act of 1934, Rule 175 of the Securities Act of 1933, and relevant legal decisions. The forward-looking statements are subject to risks and uncertainties. All forward-looking statements should be considered in the context of the risk and other factors detailed from time to time in CMS Energy’s and Consumers Energy’s Securities and Exchange Commission filings. Forward-looking statements should be read in conjunction with “FORWARD-LOOKING STATEMENTS AND INFORMATION” and “RISK FACTORS” sections of CMS Energy’s and Consumers Energy’s Form 10-K for the year ended December 31, 2014 and as updated in subsequent 10-Qs. CMS Energy’s and Consumers Energy’s “FORWARD-LOOKING STATEMENTS AND INFORMATION” and “RISK FACTORS” sections are incorporated herein by reference and discuss important factors that could cause CMS Energy’s and Consumers Energy’s results to differ materially from those anticipated in such statements. CMS Energy and Consumers Energy undertake no obligation to update any of the information presented herein to reflect facts, events or circumstances after the date hereof.
The presentation also includes non-GAAP measures when describing CMS Energy’s results of operations and financial performance. A reconciliation of each of these measures to the most directly comparable GAAP measure is included in the appendix and posted on our website at www.cmsenergy.com.
CMS Energy provides historical financial results on both a reported (GAAP) and adjusted (non-GAAP) basis and provides forward-looking guidance on an adjusted basis. Management views adjusted earnings as a key measure of the company’s present operating financial performance, unaffected by discontinued operations, asset sales, impairments, regulatory items from prior years, or other items. These items have the potential to impact, favorably or unfavorably, the company’s reported earnings in future periods.
Investors and others should note that CMS Energy routinely posts important information on its website and considers the Investor Relations section, www.cmsenergy.com/investor-relations, a channel of distribution.
1
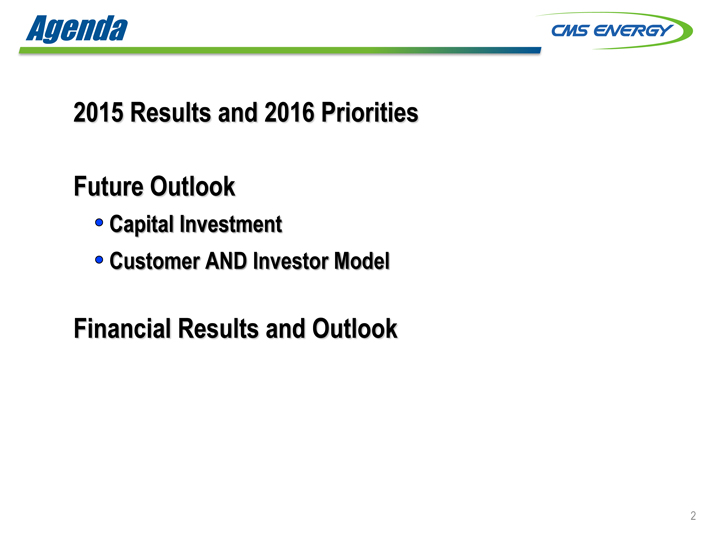
Agenda
2015 Results and 2016 Priorities
Future Outlook
Capital Investment
Customer AND Investor Model
Financial Results and Outlook
2
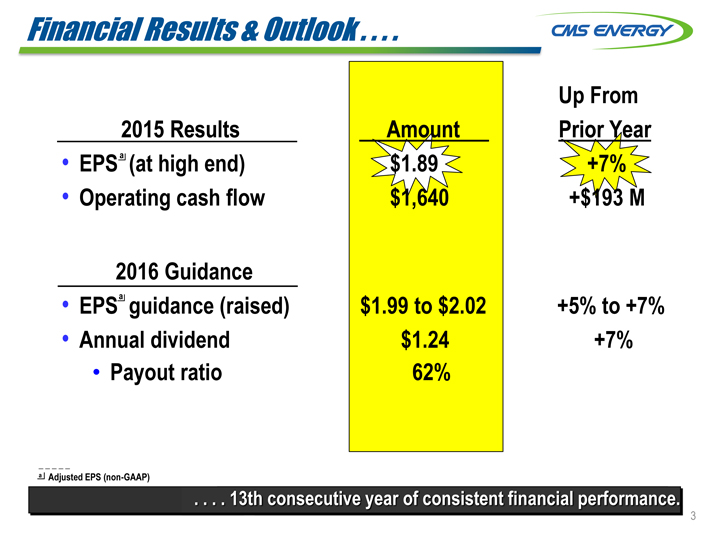
Financial Results & Outlook . . . .
2015 Results
EPSa (at high end) Operating cash flow
2016 Guidance EPSa guidance (raised) Annual dividend
Payout ratio
Up From
Amount Prior Year
$1.89 +7%
$1,640 +$193 M
$1.99 to $2.02 +5% to +7%
$1.24 +7%
62%
a Adjusted EPS (non-GAAP)
13th consecutive year of consistent financial performance.
3
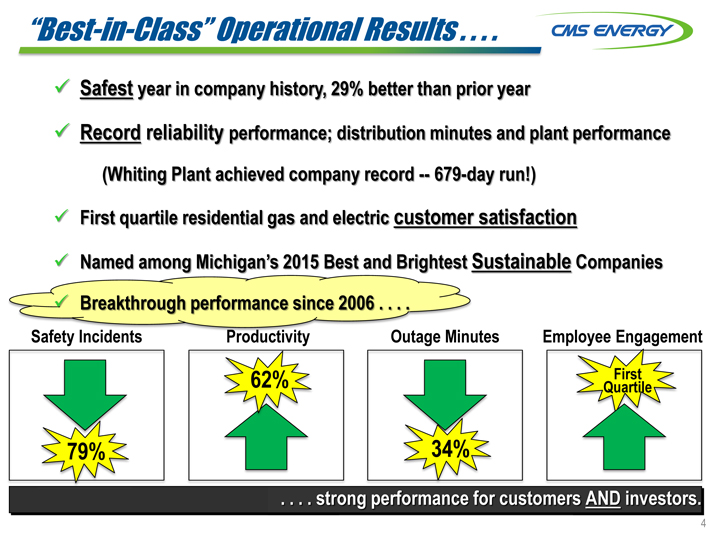
“Best-in-Class” Operational Results . . . .
Safest year in company history, 29% better than prior year
Record reliability performance; distribution minutes and plant performance (Whiting Plant achieved company record — 679-day run!)
First quartile residential gas and electric customer satisfaction
Named among Michigan’s 2015 Best and Brightest Sustainable Companies
Breakthrough performance since 2006 . . . .
Safety Incidents Productivity Outage Minutes Employee Engagement
62% Quartile First
79% 34%
. . . . strong performance for customers AND investors.
4
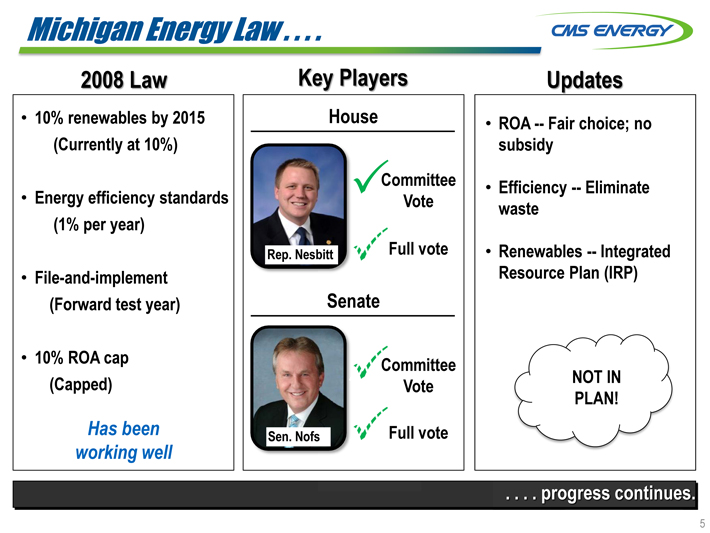
Michigan Energy Law . . . .
2008 Law
10% renewables by 2015 (Currently at 10%)
Energy efficiency standards (1% per year)
File-and-implement (Forward test year)
10% ROA cap (Capped)
Has been working well
Key Players
House
?Committee Vote
Rep. Nesbitt
Full vote
Senate
Committee Vote
Sen. Nofs
Full vote
Updates
ROA — Fair choice; no subsidy
Efficiency — Eliminate waste
Renewables — Integrated Resource Plan (IRP)
NOT IN PLAN!
. . . . progress continues.
5
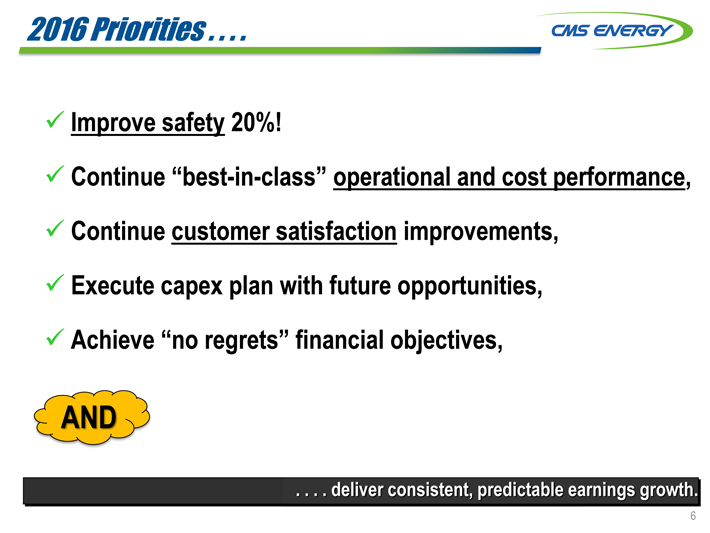
2016 Priorities . . . .
Improve safety 20%!
Continue “best-in-class” operational and cost performance, Continue customer satisfaction improvements, Execute capex plan with future opportunities,
Achieve “no regrets” financial objectives,
AND
. . . . deliver consistent, predictable earnings growth.
6
a
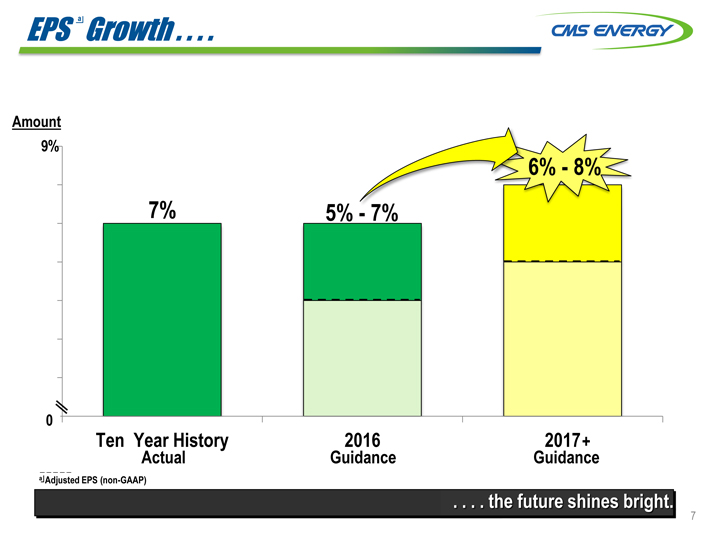
EPS Growth . . . .
Amount
9%
6%—8%
7% 5%—7%
0
Ten Year History 2016 2017 +
Actual Guidance Guidance
a Adjusted EPS (non-GAAP)
. . . . the future shines bright.
7
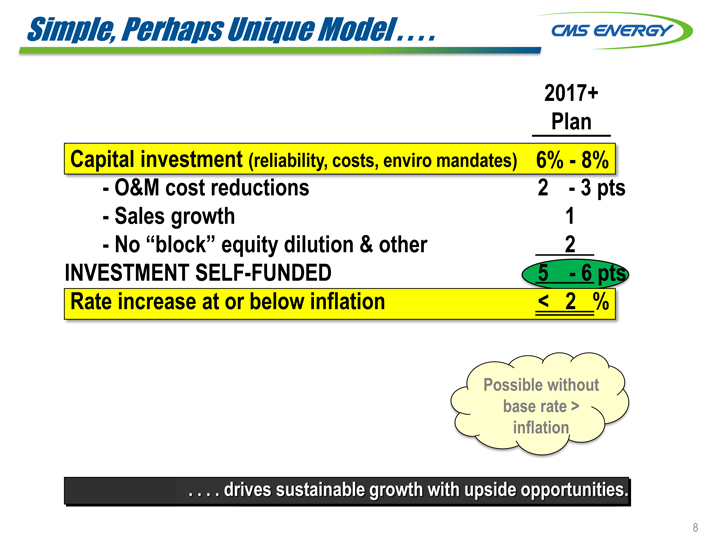
Simple, Perhaps Unique Model . . . .
2017+
Plan
Capital investment (reliability, costs, enviro mandates) 6%—8%
- O&M cost reductions 2—3 pts
- Sales growth 1
- No “block” equity dilution & other 2
INVESTMENT SELF-FUNDED 5—6 pts
Rate increase at or below inflation < 2 %
Possible without base rate > inflation
. . . . drives sustainable growth with upside opportunities.
8
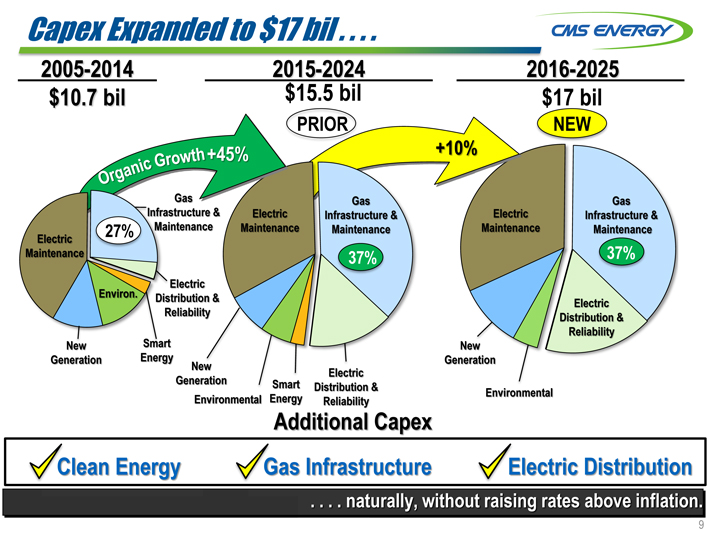
Capex Expanded to $17 bil . . . .
2005-2014 2015-2024 2016-2025
$10.7 bil $17 bil
Prior NEW
+45% +10%
Gas Gas Gas
Infrastructure & Electric Infrastructure & Electric Infrastructure &
Electric 27% Maintenance Maintenance Maintenance Maintenance Maintenance
Maintenance 37% 37%
Electric
Environ. Distribution &
Electric
Reliability Distribution &
Reliability
New Smart New
Generation Energy Generation
New Electric
Generation Smart Distribution &
Environmental Energy Reliability Environmental
Additional Capex
Clean Energy Gas Infrastructure Electric Distribution
. . . . naturally, without raising rates above inflation.
9
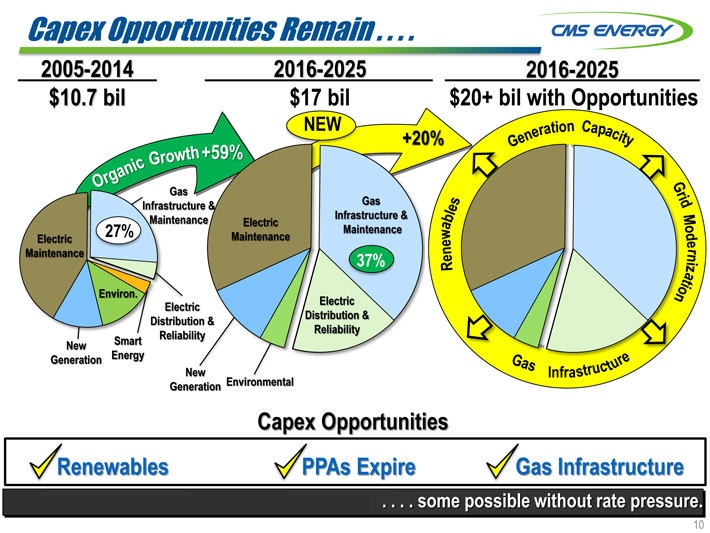
Capex Opportunities Remain . . . .
2005-2014 2016-2025 2016-2025
$10.7 bil $17 bil $20+ bil with Opportunities
NEW
+20%
Gas
Electric Infrastructure &
Electric 27% Maintenance Maintenance
Maintenance 37%
Environ
Electric Electric
Distribution & Distribution &
Reliability
New Smart Reliability
Generation Energy
New Infra
Generation Environmental
Capex Opportunities
Renewables PPAs Expire Gas Infrastructure
. . . . some possible without rate pressure.
10
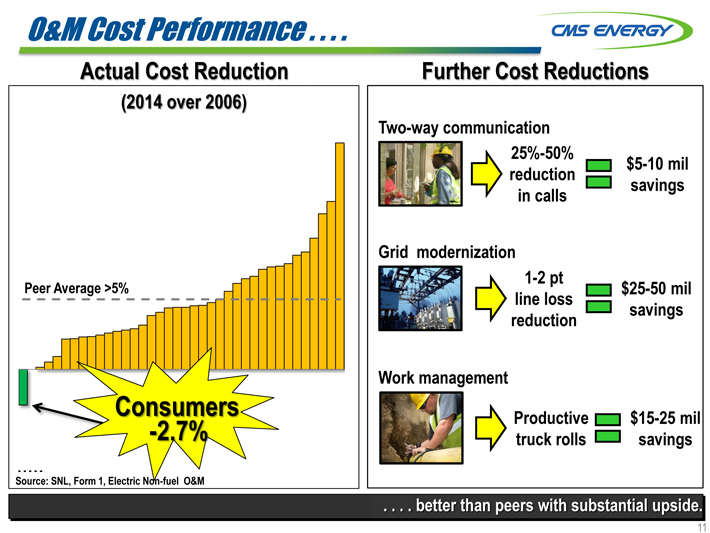
O&M Cost Performance . . . .
Actual Cost Reduction
(2014 over 2006)
Peer Average >5%
Consumers
-2.7%
Source: SNL, Form 1, Electric Non-fuel O&M
Further Cost Reductions
Two-way communication
25%-50%
reduction $5-10 mil
in calls savings
Grid modernization
1-2 pt
line loss $25-50 mil
reduction savings
Work management
Productive $15-25 mil
truck rolls savings
. . . . better than peers with substantial upside.
11
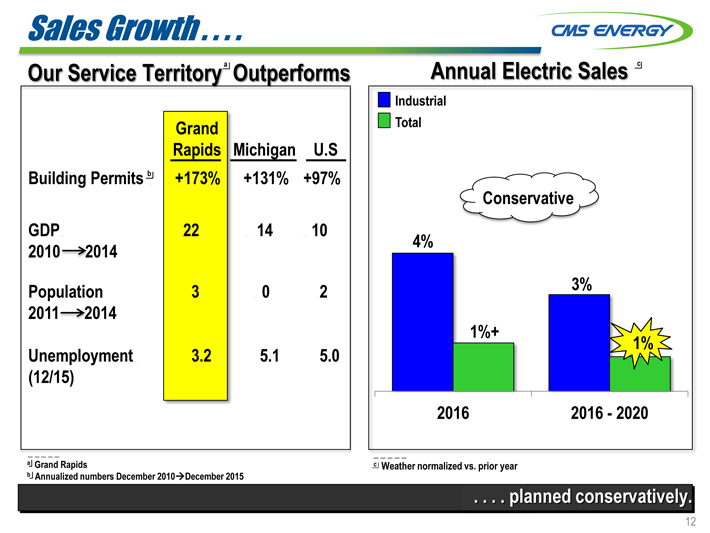
Sales Growth . . . .
Our Service Territorya Outperforms
Annual Electric Sales c
Industrial
Total
Conservative
4%
3%
1%+ 1%
2016 2016—2020
a Grand Rapids c Weather normalized vs. prior year
b Annualized numbers December 2010
December 2015
. . . . planned conservatively.
12
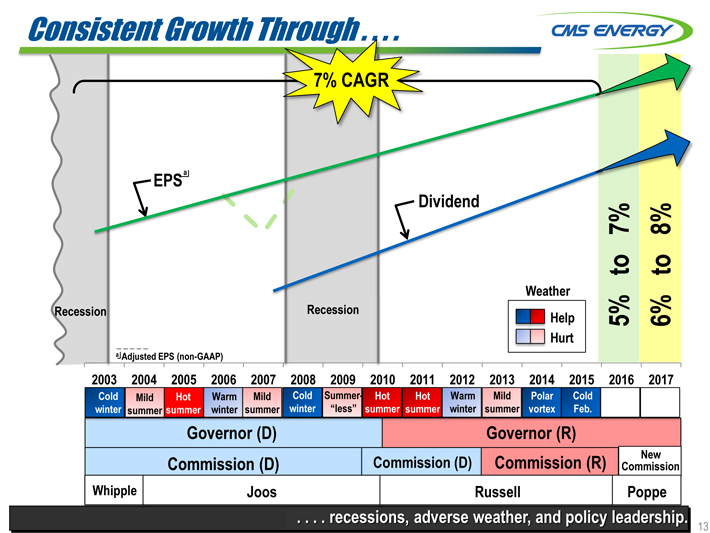
Consistent Growth Through . . . .
7% CAGR
7% 8%
to to
Weather
Recession Recession Help 5% 6%
Hurt
a Adjusted EPS (non-GAAP)
2003 2004 2005 2006 2007 2008 2009 2010 2011 2012 2013 2014 2015 2016 2017
Cold Mild Hot Warm Mild Cold Summer- Hot Hot Warm Mild Polar Cold
winter summer summer winter summer winter “less” summer summer winter summer vortex Feb.
Governor (D) Governor (R)
Commission (D) Commission (D) Commission (R) Commission New
Whipple Joos Russell Poppe
. . . . recessions, adverse weather, and policy leadership.
13
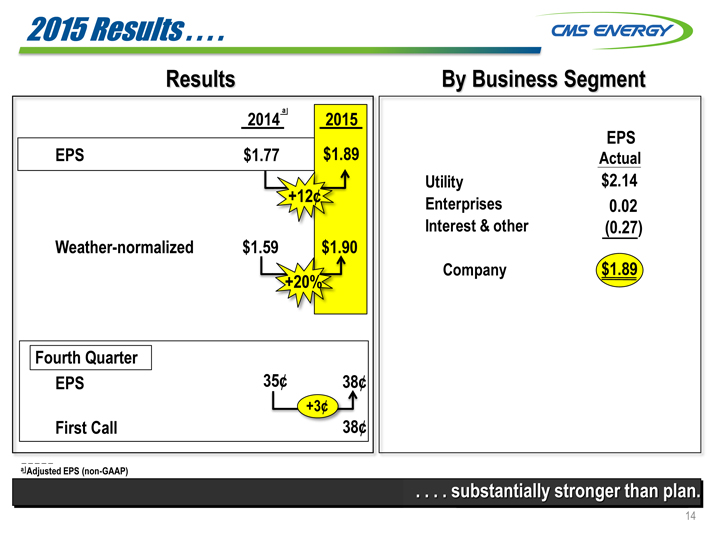
2015 Results . . . .
Results
2014 a 2015
EPS $1.77 $1.89
+12¢
Weather-normalized $1.59 $1.90
+20%
Fourth Quarter
EPS 35¢ 38¢
+3¢
First Call 38¢
By Business Segment
EPS
Actual
$2.14
0.02
(0.27)
$1.89
a Adjusted EPS (non-GAAP)
. . . . substantially stronger than plan.
14
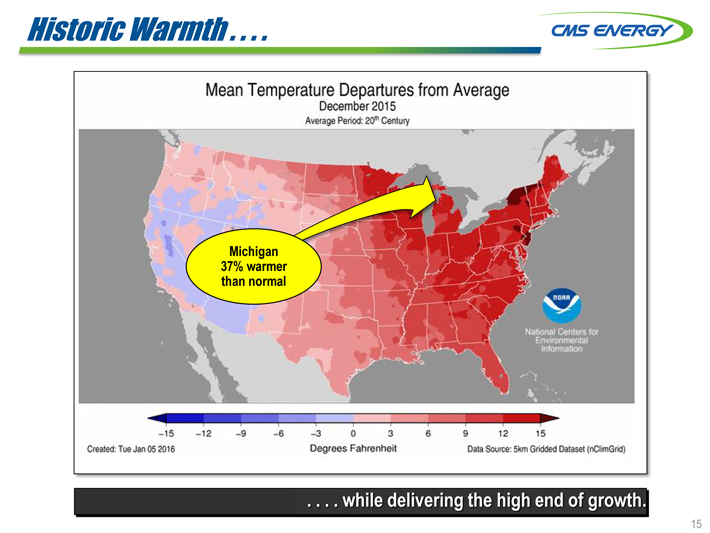
Historic Warmth . . . .
. . . . while delivering the high end of growth.
15
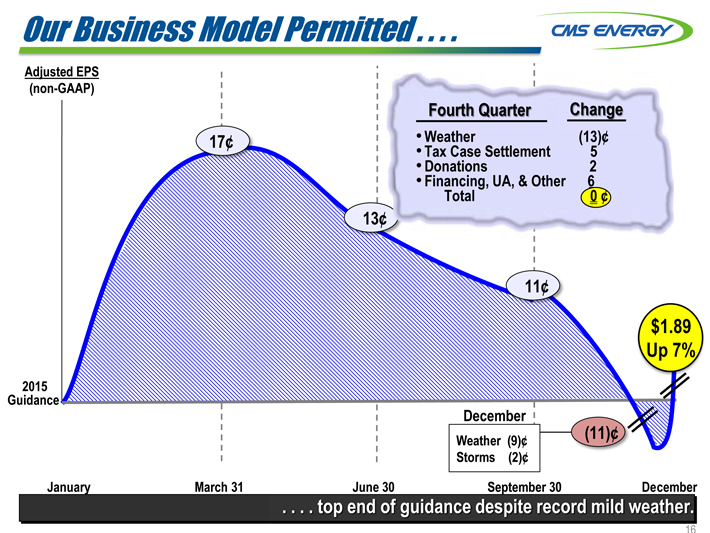
Our Business Model Permitted . . . .
Adjusted EPS
(non-GAAP)
Fourth Quarter Change
17¢ • Weather(13)¢
• Tax Case Settlement 5
• Donations 2
• Financing, UA, & Other 6
Total 0 ¢
13¢
11¢
$1.89
Up 7%
2015
Guidance
December
Weather (9)¢(11)¢
Storms(2)¢
January March 31 June 30 September 30 December
. . . . top end of guidance despite record mild weather.
16
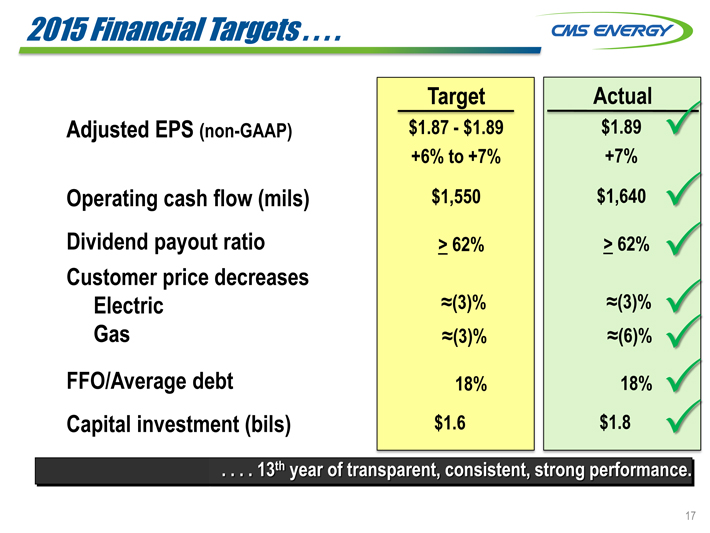
2015 Financial Targets . . . .
Target Actual
Adjusted EPS (non-GAAP) $1.87—$1.89 $1.89 ?
+6% to +7% +7%
Operating cash flow (mils) $1,550 $1,640 ?
Dividend payout ratio > 62% > 62% ?
Customer price decreases
Electric ?(3)% ?(3)%
Gas ?(3)% ?(6)%
FFO/Average debt 18% 18%
Capital investment (bils) $1.6 $1.8 ?
. . . . 13th year of transparent, consistent, strong performance
17
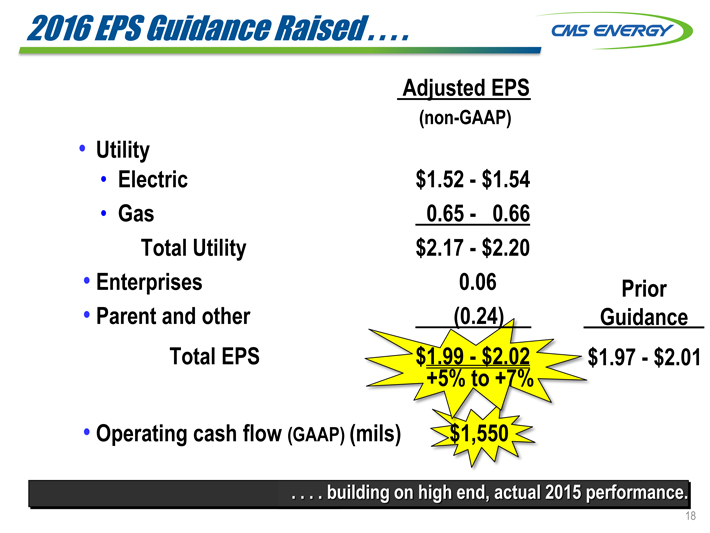
2016 EPS Guidance Raised . . . .
Utility
Electric
Gas
Total Utility
Enterprises
Parent and other Total EPS
Operating cash flow (GAAP) (mils)
Adjusted EPS
(non-GAAP)
$1.52
- $
1.54
0.65
-
0.66
$2.17
- $
2.20
0.06
(0.24)
$1.99
- $
2.02
+5%
to
+7%
$1,550
Prior Guidance $1.97—$2.01
. . . . building on high end, actual 2015 performance.
18
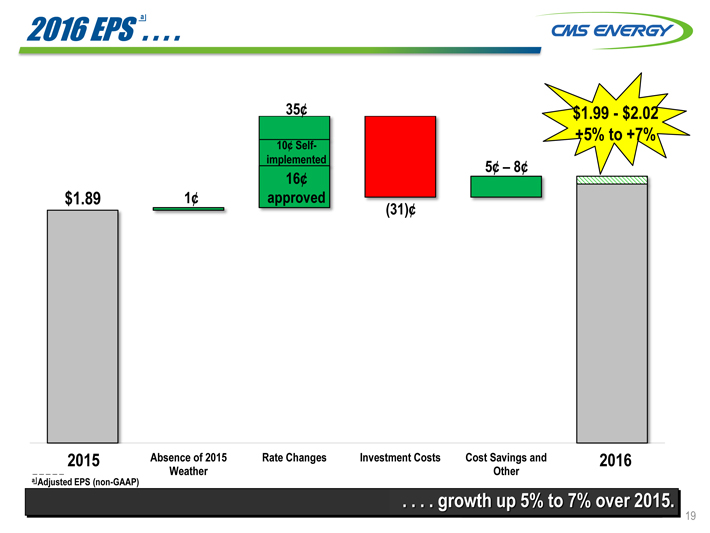
a
2016 EPS . . . .
| 35¢ |
|
$1.99—$2.02 |
+5% to +7%
| 10¢ |
|
Self- |
implemented 5¢ – 8¢
| 16¢ |
|
| $1.89 |
|
1¢ approved(31)¢ |
2015 Absence of 2015 Rate Changes Investment Costs Cost Savings and 2016
Weather Other
a Adjusted EPS (non-GAAP)
. . . . growth up 5% to 7% over 2015.
19
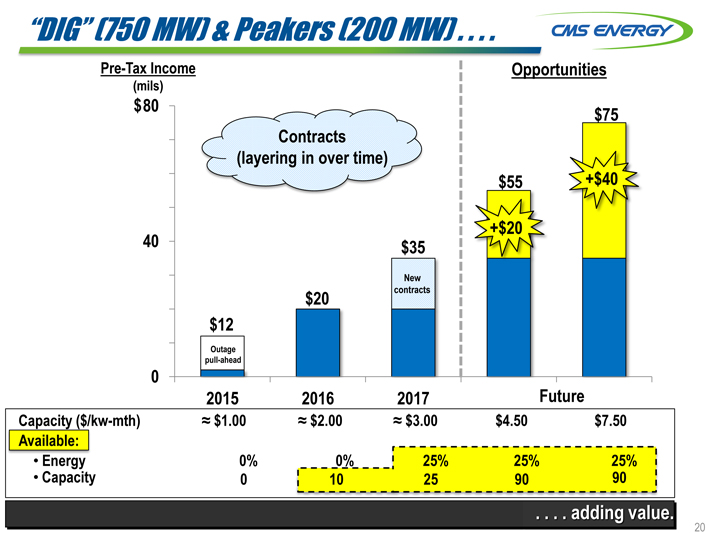
“DIG” (750 MW) & Peakers (200 MW) . . . .
Pre-Tax Income Opportunities
(mils)
$ 80 $75
Contracts
(layering in over time)
$ 55 +$ 40
+$ 20
40 $ 35
New
$20 contracts
$12
Outage
pull-ahead
0
2015 2016 2017 Future
Capacity ($/kw-mth) ? $1.00 ? $2.00 ? $3.00 $4.50 $7.50
Available:
• Energy 0% 0% 25% 25% 25%
Capacity 0 10 25 90 90
. . . . adding value.
20
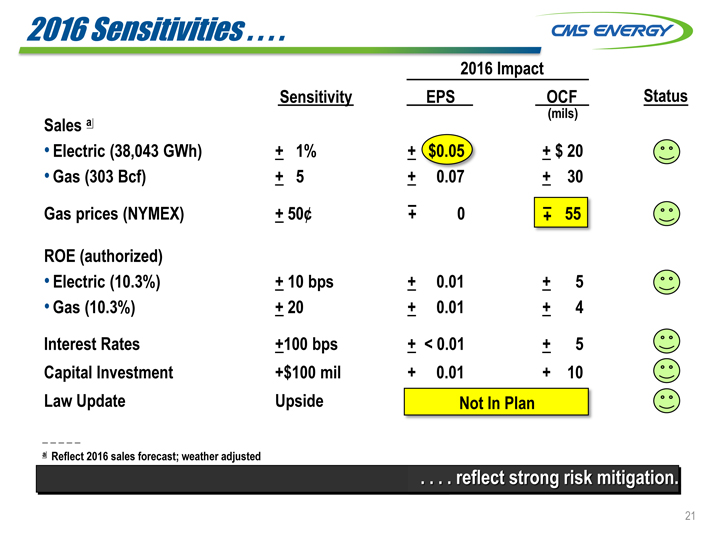
2016 Sensitivities . . . .
2016 Impact
Sensitivity EPS OCF Status
(mils)
Sales a
• Electric (38,043 GWh) + 1% + $0.05 + $ 20
• Gas (303 Bcf) + 5 + 0.07 + 30
Gas prices (NYMEX) + 50¢ + – 0 + – 55
ROE (authorized)
• Electric (10.3%) + 10 bps + 0.01 + 5
• Gas (10.3%) + 20 + 0.01 + 4
Interest Rates +100 bps + < 0.01 + 5
Capital Investment +$100 mil + 0.01 + 10
Law Update Upside Not In Plan
a Reflect 2016 sales forecast; weather adjusted
. . . . reflect strong risk mitigation.
21
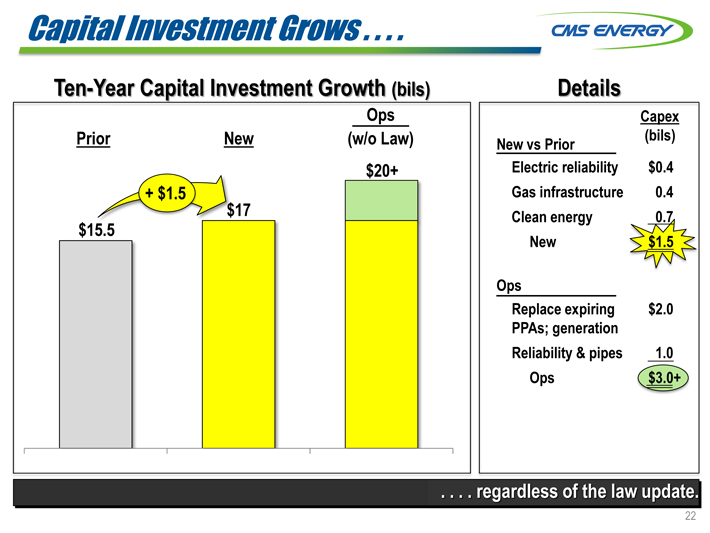
Capital Investment Grows . . . .
Ten-Year Capital Investment Growth (bils)
Ops
Prior New(w/o Law)
$20+
+ $1.5
17
$15.5
Details
Capex
New vs Prior(bils)
Electric reliability $ 0.4
Gas infrastructure 0.4
Clean energy 0.7
New $ 1.5
Ops
Replace expiring $ 2.0
PPAs; generation
Reliability & pipes 1.0
Ops $ 3.0+
. . . . regardless of the law update.
22
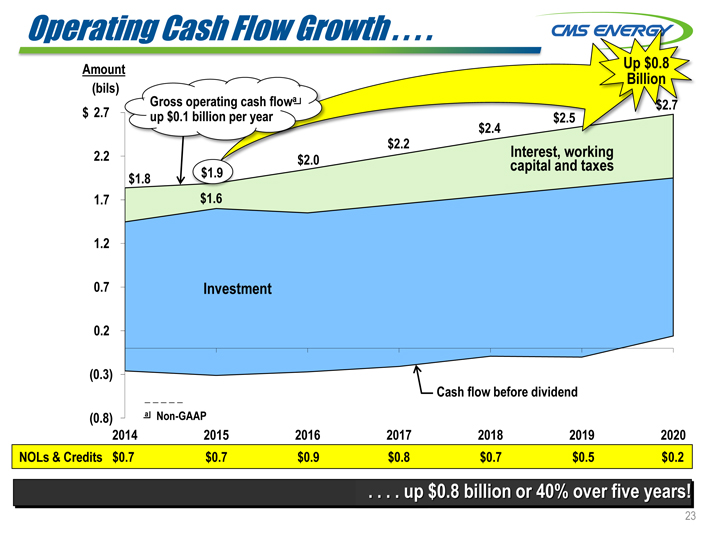
Operating Cash Flow Growth . . . .
Amount Up $0.8
(bils) Billion
Gross operating cash flowa
$ 2.7 up $0.1 billion per year $2.5
2.2
$1.8 $1.9
1.7 $1.6
1.2
0.7 Investment
0.2
(0.3)
Cash flow before dividend
(0.8) a Non-GAAP
2014 2015 2016 2017 2018 2019 2020
NOLs & Credits $0.7 $0.7 $0.9 $0.8 $0.7 $0.5 $0.2
. . . . up $0.8 billion or 40% over five years!
23
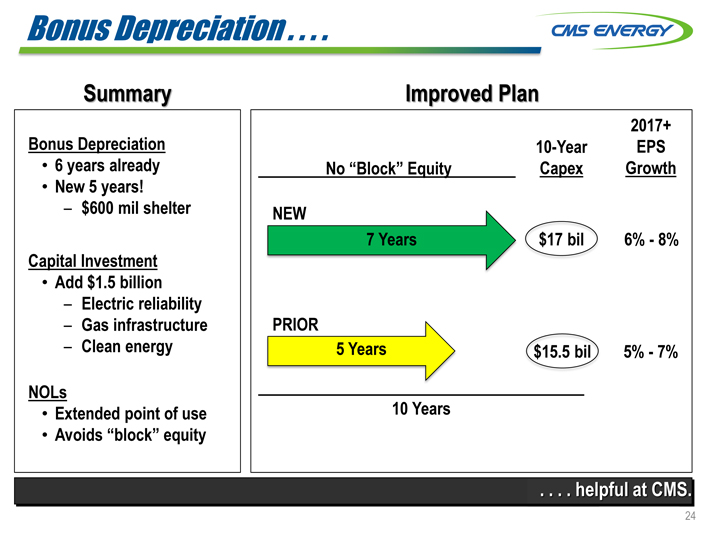
Bonus Depreciation . . . .
Summary
Bonus Depreciation
6 years already
New 5 years!
– $600 mil shelter
Capital Investment
Add $1.5 billion
– Electric reliability
– Gas infrastructure
– Clean energy
NOLs
Extended point of use
Avoids “block” equity
Improved Plan
2017+
10-Year EPS
No “Block” Equity Capex Growth
7 Years 6%—8%
PRIOR
5 Years 5%—7%
10 Years
. . . . helpful at CMS.
24
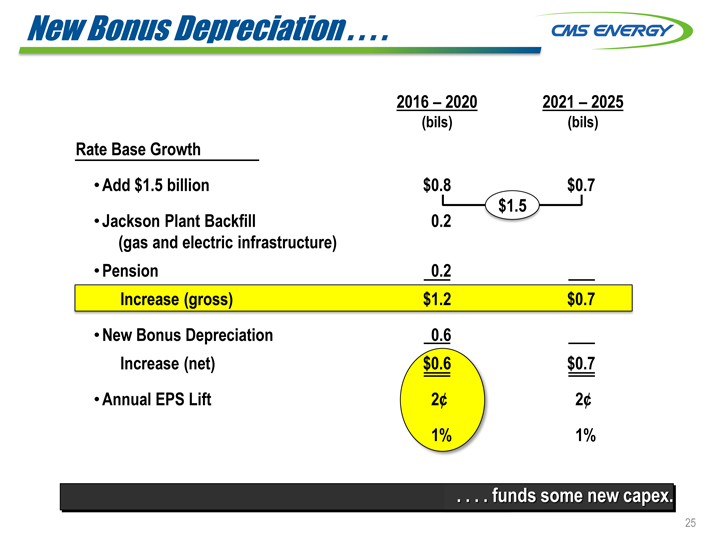
New Bonus Depreciation . . . .
2016 – 2020 2021 – 2025
(bils)(bils)
Rate Base Growth
• Add $1.5 billion $0.8 $0.7
$ 1.5
• Jackson Plant Backfill 0.2
(gas and electric infrastructure)
• Pension 0.2
Increase (gross) $1.2 $0.7
New Bonus Depreciation 0.6
Increase (net) $0.6 $0.7
Annual EPS Lift 2¢ 2¢
1% 1%
. . . . funds some new capex.
25
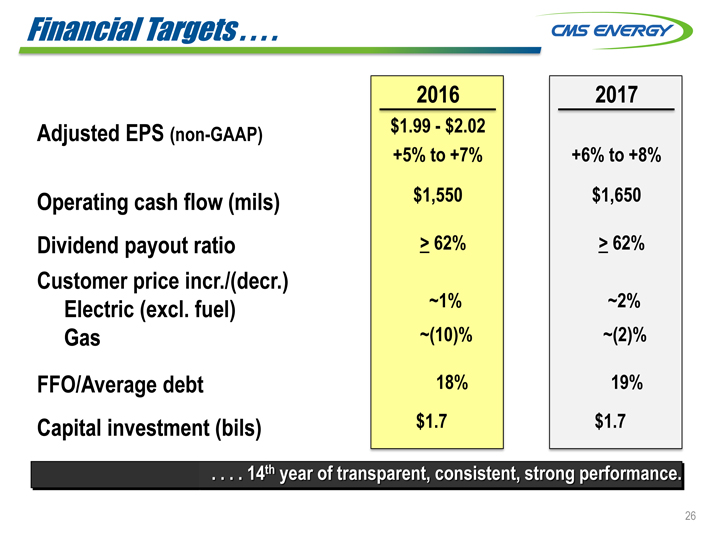
Financial Targets . . . .
2016 2017
Adjusted EPS (non-GAAP) $1.99—$2.02
+5% to +7% +6% to +8%
Operating cash flow (mils) $1,550 $1,650
Dividend payout ratio > 62% > 62%
Customer price incr./(decr.)
Electric (excl. fuel) ~1% ~2%
Gas ~(10)% ~(2)%
FFO/Average debt 18% 19%
Capital investment (bils) $1.7 $1.7
. . . . 14th year of transparent, consistent, strong performance.
26
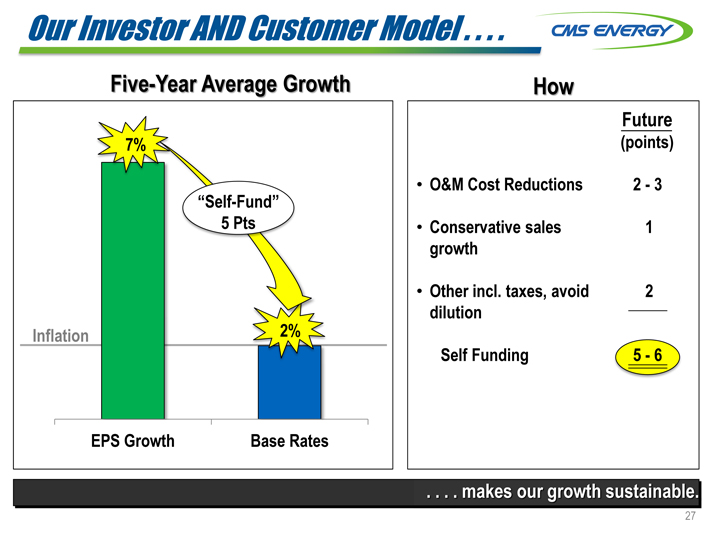
Our Investor AND Customer Model . . . .
Five-Year Average Growth
7%
“Self-Fund”
5 Pts
Inflation 2%
EPS Growth Base Rates
How
Future
(points)
O&M Cost Reductions 2—3
Conservative sales 1
growth
Other incl. taxes, avoid 2
dilution
Self Funding 5—6
. . . . makes our growth sustainable.
27

Q & A
Appendix
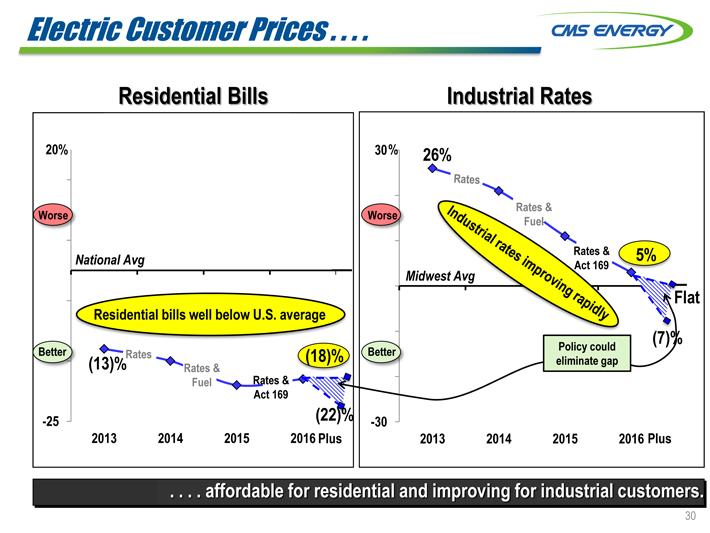
Electric Customer Prices . . . .
Residential Bills Industrial Rates
20% 30 % 26%
Worse Worse
National Avg 5%
Mid
Flat
Residential bills well below U.S. average
(7)%
Better(13)%Rates Rates &(18)% Better eliminate Policy could gap
Fuel Rates &
Act 169
-25(22)% -30
2013 2014 2015 2016 Plus 2013 2014 2015 2016 Plus
. . . . affordable for residential and improving for industrial customers.
30
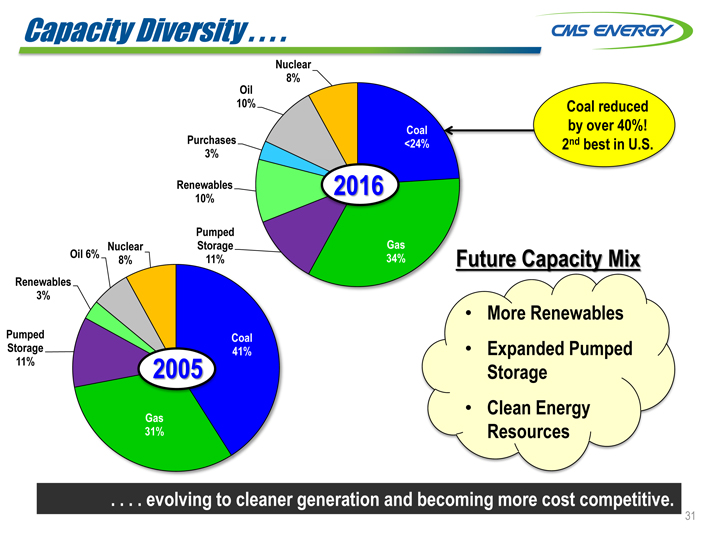
Capacity Diversity . . . .
Nuclear
8%
Oil
10% Coal reduced
Coal by over 40%!
Purchases <24% 2nd best in U.S.
3%
Renewables 2016
10%
Pumped
Nuclear Storage Gas
Oil 6% 8% 11% 34% Future Capacity Mix
Renewables
3%
• More Renewables
Pumped Coal
Storage 41% • Expanded Pumped
11% 2005 Storage
Gas • Clean Energy
31% Resources
. . . . evolving to cleaner generation and becoming more cost competitive.
31
31
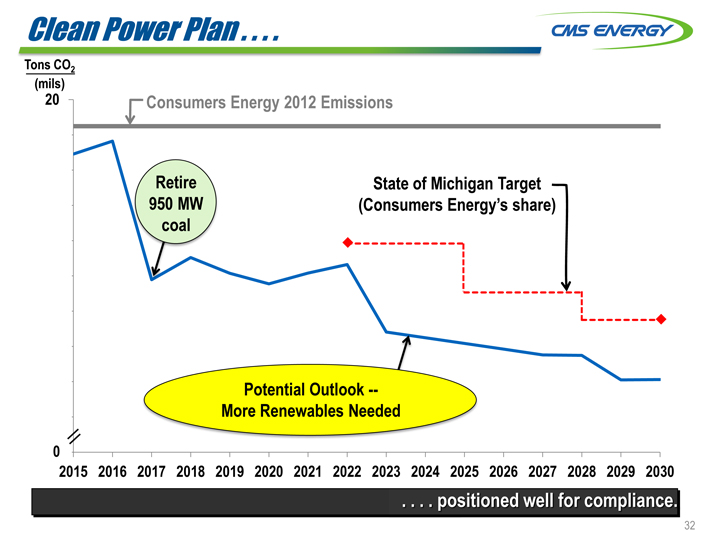
Clean Power Plan . . . .
Tons CO2
(mils)
20 Consumers Energy 2012 Emissions
Retire State of Michigan Target
950 MW(Consumers Energy’s share)
coal
Potential Outlook —
More Renewables Needed
0
2015 2016 2017 2018 2019 2020 2021 2022 2023 2024 2025 2026 2027 2028 2029 2030
. . . . positioned well for compliance.
32
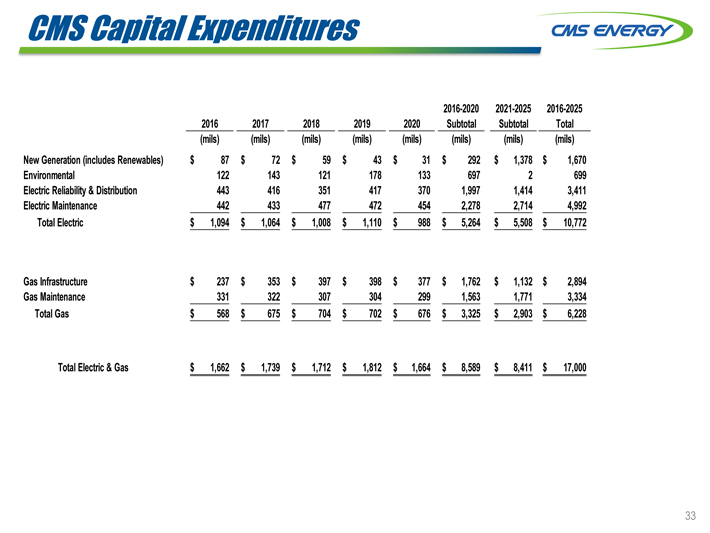
CMS Capital Expenditures
2016-2020 2021-2025 2016-2025
2016 2017 2018 2019 2020 Subtotal Subtotal Total
(mils)(mils)(mils)(mils)(mils)(mils)(mils)(mils)
New Generation (includes Renewables) $ 87 $ 72 $ 59 $ 43 $ 31 $ 292 $ 1,378 $ 1,670
Environmental 122 143 121 178 133 697 2 699
Electric Reliability & Distribution 443 416 351 417 370 1,997 1,414 3,411
Electric Maintenance 442 433 477 472 454 2,278 2,714 4,992
Total Electric $ 1,094 $ 1,064 $ 1,008 $ 1,110 $ 988 $ 5,264 $ 5,508 $ 10,772
Gas Infrastructure $ 237 $ 353 $ 397 $ 398 $ 377 $ 1,762 $ 1,132 $ 2,894
Gas Maintenance 331 322 307 304 299 1,563 1,771 3,334
Total Gas $ 568 $ 675 $ 704 $ 702 $ 676 $ 3,325 $ 2,903 $ 6,228
Total Electric & Gas $ 1,662 $ 1,739 $ 1,712 $ 1,812 $ 1,664 $ 8,589 $ 8,411 $ 17,000
33
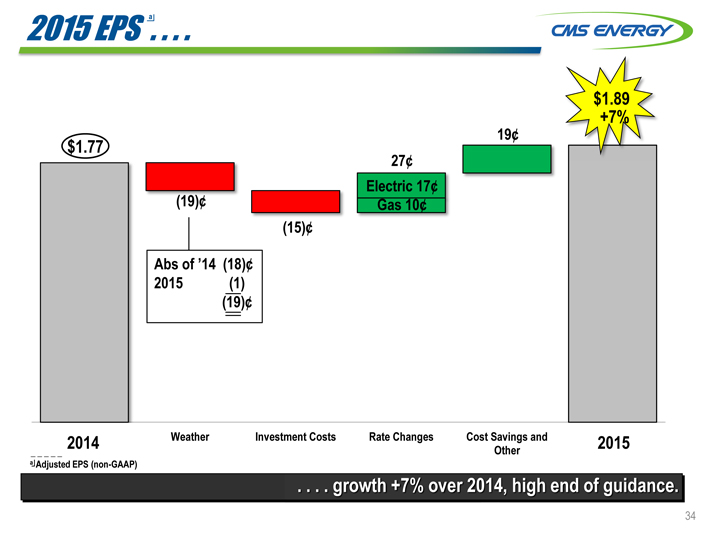
a
2015 EPS . . . .
$1.89
+7%
19¢
$1.77
27¢
Electric 17¢
(19)¢ Gas 10¢
(15)¢
Abs of ’14(18)¢
2015(1)
(19)¢
2014 Weather Investment Costs Rate Changes Cost Savings and 2015
Other
a Adjusted EPS (non-GAAP)
. . . . growth +7% over 2014, high end of guidance.
34
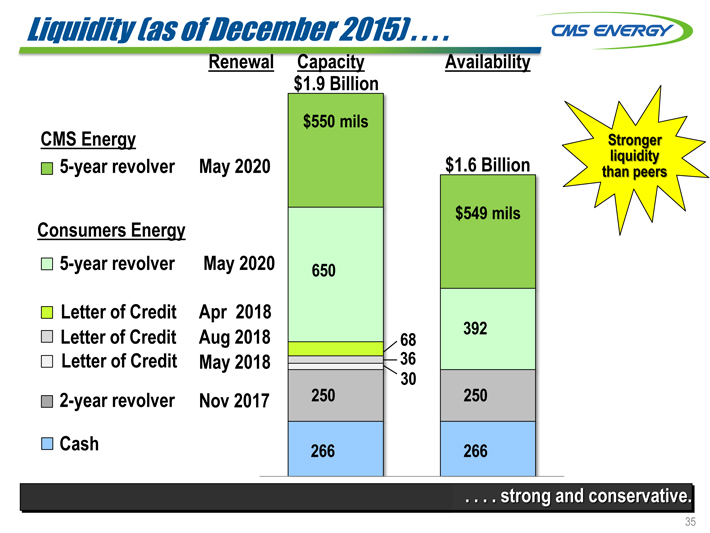
Liquidity (as of December 2015)
Renewal Capacity Availability
$1.9 Billion
$550 mils
CMS Energy Stronger
liquidity
5-year revolver May 2020 $1.6 Billion than peers
$549 mils
Consumers Energy
5-year revolver May 2020 650
Letter of Credit Apr 2018
Letter of Credit Aug 2018 68 392
Letter of Credit May 2018 36
30
2-year revolver Nov 2017 250 250
Cash 266 266
. . . . strong and conservative.
35
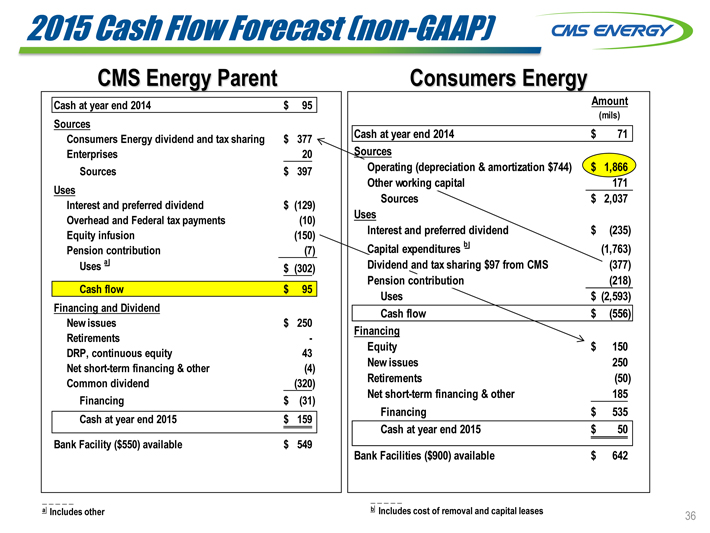
2015 Cash Flow Forecast (non-GAAP)
CMS Energy Parent
Cash at year end 2014 $ 95
Sources
Consumers Energy dividend and tax sharing $ 377
Enterprises 20
Sources $ 397
Uses
Interest and preferred dividend $(129)
Overhead and Federal tax payments(10)
Equity infusion(150)
Pension contribution(7)
Uses a $(302)
Cash flow $ 95
Financing and Dividend
New issues $ 250
Retirements -
DRP, continuous equity 43
Net short-term financing & other(4)
Common dividend(320)
Financing $(31)
Cash at year end 2015 $ 159
Bank Facility ($550) available $ 549
Consumers Energy
Amount
(mils)
Cash at year end 2014 $ 71
Sources
Operating (depreciation & amortization $744) $ 1,866
Other working capital 171
Sources $ 2,037
Uses
Interest and preferred dividend $(235)
Capital expenditures b(1,763)
Dividend and tax sharing $97 from CMS(377)
Pension contribution(218)
Uses $(2,593)
Cash flow $(556)
Financing
Equity $ 150
New issues 250
Retirements(50)
Net short-term financing & other 185
Financing $ 535
Cash at year end 2015 $ 50
Bank Facilities ($900) available $ 642
a Includes other b Includes cost of removal and capital leases
36
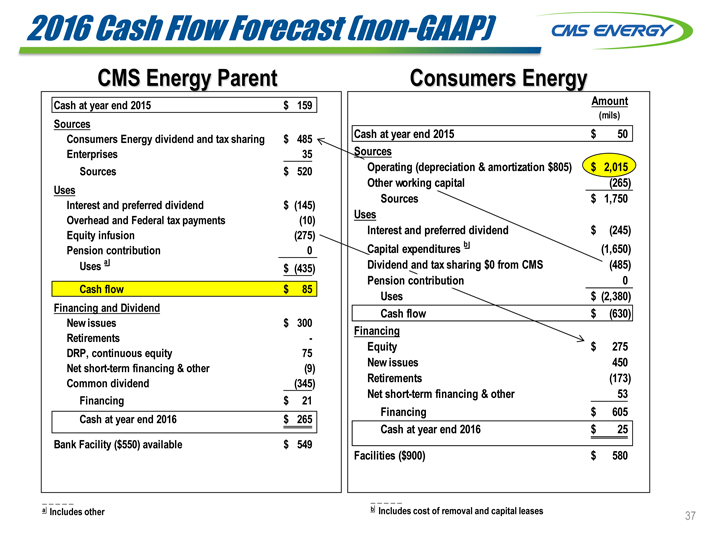
2016 Cash Flow Forecast (non-GAAP)
CMS Energy Parent
Cash at year end 2015 $ 159
Sources
Consumers Energy dividend and tax sharing $ 485
Enterprises 35
Sources $ 520
Uses
Interest and preferred dividend $(145)
Overhead and Federal tax payments(10)
Equity infusion(275)
Pension contribution 0
Uses a $(435)
Cash flow $ 85
Financing and Dividend
New issues $ 300
Retirements -
DRP, continuous equity 75
Net short-term financing & other(9)
Common dividend(345)
Financing $ 21
Cash at year end 2016 $ 265
Bank Facility ($550) available $ 549
Consumers Energy
Amount
(mils)
Cash at year end 2015 $ 50
Sources
Operating (depreciation & amortization $805) $ 2,015
Other working capital(265)
Sources $ 1,750
Uses
Interest and preferred dividend $(245)
Capital expenditures b(1,650)
Dividend and tax sharing $0 from CMS(485)
Pension contribution 0
Uses $(2,380)
Cash flow $(630)
Financing
Equity $ 275
New issues 450
Retirements(173)
Net short-term financing & other 53
Financing $ 605
Cash at year end 2016 $ 25
Facilities ($900) $ 580
a Includes other b Includes cost of removal and capital leases
37

GAAP Reconciliation
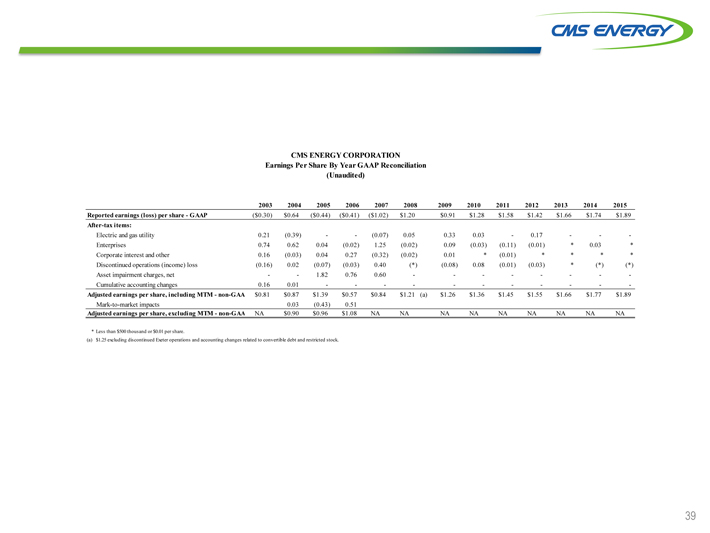
CMS ENERGY CORPORATION
Earnings Per Share By Year GAAP Reconciliation
(Unaudited)
2003 2004 2005 2006 2007 2008 2009 2010 2011 2012 2013 2014 2015
Reported earnings (loss) per share—GAAP($0.30) $0.64($0.44)($0.41)($1.02) $1.20 $0.91 $1.28 $1.58 $1.42 $ 1.66 $ 1.74 $ 1.89
After-tax items:
Electric and gas utility 0.21(0.39) —(0.07) 0.05 0.33 0.03—0.17 — -
Enterprises 0.74 0.62 0.04(0.02) 1.25(0.02) 0.09(0.03)(0.11)(0.01)* 0.03*
Corporate interest and other 0.16(0.03) 0.04 0.27(0.32)(0.02) 0.01*(0.01)****
Discontinued operations (income) loss(0.16) 0.02(0.07)(0.03) 0.40(*)(0.08) 0.08(0.01)(0.03)*(*)(*)
Asset impairment charges, net — 1.82 0.76 0.60 — — — —
Cumulative accounting changes 0.16 0.01 — — — — — -
Adjusted earnings per share, including MTM—non-GAA $0.81 $0.87 $1.39 $0.57 $0.84 $1.21 (a) $1.26 $1.36 $1.45 $1.55 $ 1.66 $ 1.77 $ 1.89
Mark-to-market impacts 0.03(0.43) 0.51
Adjusted earnings per share, excluding MTM—non-GAA NA $0.90 $0.96 $1.08 NA NA NA NA NA NA NA NA NA
* Less than $500 thousand or $0.01 per share.
(a) $1.25 excluding discontinued Exeter operations and accounting changes related to convertible debt and restricted stock.
39
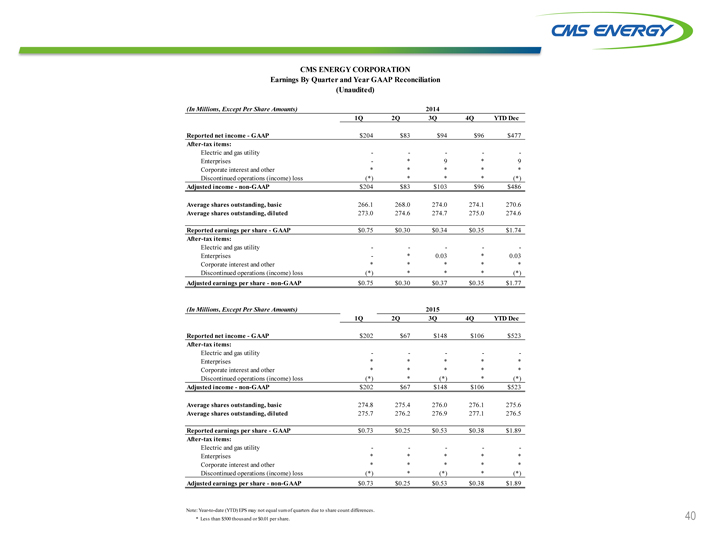
CMS ENERGY CORPORATION
Earnings By Quarter and Year GAAP Reconciliation
(Unaudited)
(In Millions, Except Per Share Amounts) 2014
1Q 2Q 3Q 4Q YTD Dec
Reported net income—GAAP $204 $83 $94 $96 $477
After-tax items:
Electric and gas utility — — -
Enterprises -* 9* 9
Corporate interest and other*****
Discontinued operations (income) loss(*)***(*)
Adjusted income—non-GAAP $204 $83 $103 $96 $486
Average shares outstanding, basic 266.1 268.0 274.0 274.1 270.6
Average shares outstanding, diluted 273.0 274.6 274.7 275.0 274.6
Reported earnings per share—GAAP $0.75 $0.30 $0.34 $0.35 $1.74
After-tax items:
Electric and gas utility — — -
Enterprises -* 0.03* 0.03
Corporate interest and other*****
Discontinued operations (income) loss(*)***(*)
Adjusted earnings per share—non-GAAP $0.75 $0.30 $0.37 $0.35 $1.77
(In Millions, Except Per Share Amounts) 2015
1Q 2Q 3Q 4Q YTD Dec
Reported net income—GAAP $202 $67 $148 $106 $523
After-tax items:
Electric and gas utility — — -
Enterprises*****
Corporate interest and other*****
Discontinued operations (income) loss(*)*(*)*(*)
Adjusted income—non-GAAP $202 $67 $148 $106 $523
Average shares outstanding, basic 274.8 275.4 276.0 276.1 275.6
Average shares outstanding, diluted 275.7 276.2 276.9 277.1 276.5
Reported earnings per share—GAAP $0.73 $0.25 $0.53 $0.38 $1.89
After-tax items:
Electric and gas utility — — -
Enterprises*****
Corporate interest and other*****
Discontinued operations (income) loss(*)*(*)*(*)
Adjusted earnings per share—non-GAAP $0.73 $0.25 $0.53 $0.38 $1.89
Note: Year-to-date (YTD) EPS may not equal sum of quarters due to share count differences.
* Less than $500 thousand or $0.01 per share.
40
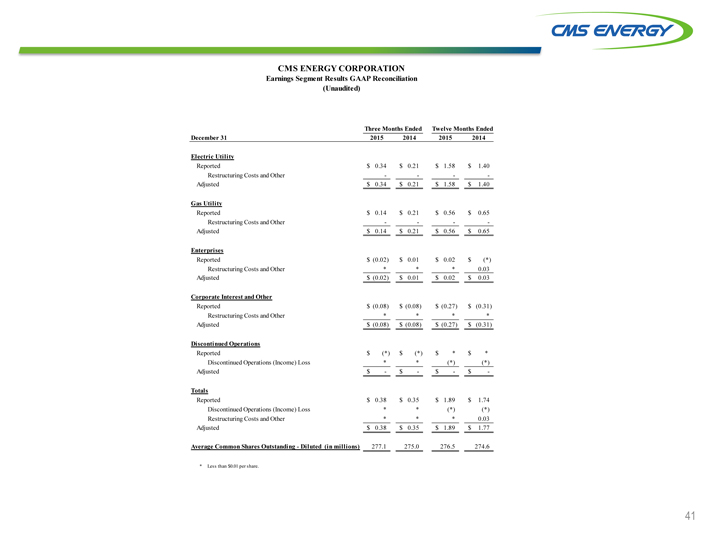
CMS ENERGY CORPORATION
Earnings Segment Results GAAP Reconciliation
(Unaudited)
Three Months Ended Twelve Months Ended
December 31 2015 2014 2015 2014
Electric Utility
Reported $ 0.34 $ 0.21 $ 1.58 $ 1.40
Restructuring Costs and Other — —
Adjusted $ 0.34 $ 0.21 $ 1.58 $ 1.40
Gas Utility
Reported $ 0.14 $ 0.21 $ 0.56 $ 0.65
Restructuring Costs and Other — —
Adjusted $ 0.14 $ 0.21 $ 0.56 $ 0.65
Enterprises
Reported $(0.02) $ 0.01 $ 0.02 $(*)
Restructuring Costs and Other*** 0.03
Adjusted $(0.02) $ 0.01 $ 0.02 $ 0.03
Corporate Interest and Other
Reported $(0.08) $(0.08) $(0.27) $(0.31)
Restructuring Costs and Other****
Adjusted $(0.08) $(0.08) $(0.27) $(0.31)
Discontinued Operations
Reported $(*) $(*) $* $*
Discontinued Operations (Income) Loss**(*)(*)
Adjusted $—$—$—$ -
Totals
Reported $ 0.38 $ 0.35 $ 1.89 $ 1.74
Discontinued Operations (Income) Loss**(*)(*)
Restructuring Costs and Other*** 0.03
Adjusted $ 0.38 $ 0.35 $ 1.89 $ 1.77
Average Common Shares Outstanding—Diluted (in millions) 277.1 275.0 276.5 274.6
* Less than $0.01 per share.
41
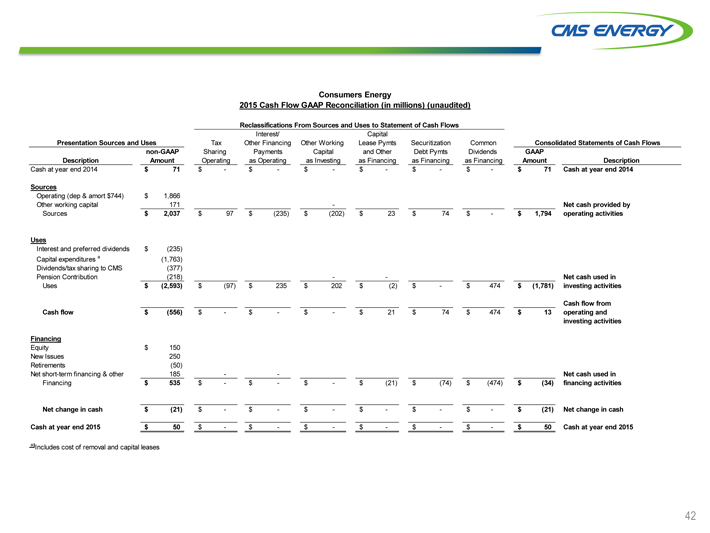
Consumers Energy
2015 Cash Flow GAAP Reconciliation (in millions) (unaudited)
Reclassifications From Sources and Uses to Statement of Cash Flows
Interest/ Capital
Presentation Sources and Uses Tax Other Financing Other Working Lease Pymts Securitization Common Consolidated Statements of Cash Flows
non-GAAP Sharing Payments Capital and Other Debt Pymts Dividends GAAP
Description Amount Operating as Operating as Investing as Financing as Financing as Financing Amount Description
Cash at year end 2014 $ 71 $—$—$—$—$—$—$ 71 Cash at year end 2014
Sources
Operating (dep & amort $744) $ 1,866
Other working capital 171—Net cash provided by
Sources $ 2,037 $ 97 $(235) $(202) $ 23 $ 74 $—$ 1,794 operating activities
Uses
Interest and preferred dividends $(235)
Capital expenditures a(1,763)
Dividends/tax sharing to CMS(377)
Pension Contribution(218) — Net cash used in
Uses $(2,593) $(97) $ 235 $ 202 $(2) $—$ 474 $ (1,781) investing activities
Cash flow from
Cash flow $(556) $—$—$—$ 21 $ 74 $ 474 $ 13 operating and
investing activities
Financing
Equity $ 150
New Issues 250
Retirements(50)
Net short-term financing & other 185 — Net cash used in
Financing $ 535 $—$—$—$(21) $(74) $(474) $ (34) financing activities
Net change in cash $(21) $—$—$—$—$—$—$ (21) Net change in cash
Cash at year end 2015 $ 50 $—$—$—$—$—$—$ 50 Cash at year end 2015
a Includes cost of removal and capital leases
42
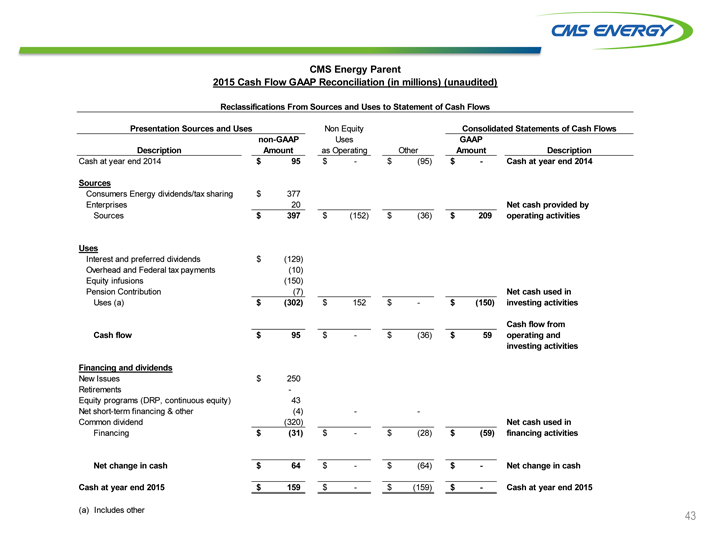
CMS Energy Parent
2015 Cash Flow GAAP Reconciliation (in millions) (unaudited)
Reclassifications From Sources and Uses to Statement of Cash Flows
Presentation Sources and Uses Non Equity Consolidated Statements of Cash Flows
non-GAAP Uses GAAP
Description Amount as Operating Other Amount Description
Cash at year end 2014 $ 95 $—$(95) $—Cash at year end 2014
Sources
Consumers Energy dividends/tax sharing $ 377
Enterprises 20 Net cash provided by
Sources $ 397 $(152) $(36) $ 209 operating activities
Uses
Interest and preferred dividends $ (129)
Overhead and Federal tax payments(10)
Equity infusions(150)
Pension Contribution(7) Net cash used in
Uses (a) $ (302) $ 152 $—$(150) investing activities
Cash flow from
Cash flow $ 95 $—$(36) $ 59 operating and
investing activities
Financing and dividends
New Issues $ 250
Retirements -
Equity programs (DRP, continuous equity) 43
Net short-term financing & other(4) —
Common dividend(320) Net cash used in
Financing $(31) $—$(28) $(59) financing activities
Net change in cash $ 64 $—$(64) $—Net change in cash
Cash at year end 2015 $ 159 $—$(159) $—Cash at year end 2015
(a) Includes other
43
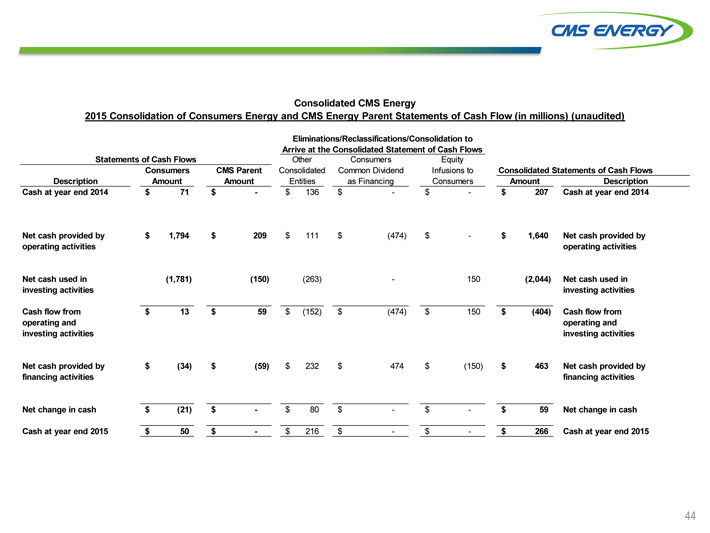
Consolidated CMS Energy
2015 Consolidation of Consumers Energy and CMS Energy Parent Statements of Cash Flow (in millions) (unaudited)
Eliminations/Reclassifications/Consolidation to
Arrive at the Consolidated Statement of Cash Flows
Statements of Cash Flows Other Consumers Equity
Consumers CMS Parent Consolidated Common Dividend Infusions to Consolidated Statements of Cash Flows
Description Amount Amount Entities as Financing Consumers Amount Description
Cash at year end 2014 $ 71 $—$ 136 $—$—$ 207 Cash at year end 2014
Net cash provided by $ 1,794 $ 209 $ 111 $(474) $—$ 1,640 Net cash provided by
operating activities operating activities
Net cash used in(1,781)(150)(263)—150(2,044) Net cash used in
investing activities investing activities
Cash flow from $ 13 $ 59 $(152) $(474) $ 150 $(404) Cash flow from
operating and operating and
investing activities investing activities
Net cash provided by $(34) $(59) $ 232 $ 474 $(150) $ 463 Net cash provided by
financing activities financing activities
Net change in cash $(21) $—$ 80 $—$—$ 59 Net change in cash
Cash at year end 2015 $ 50 $—$ 216 $—$—$ 266 Cash at year end 2015
44
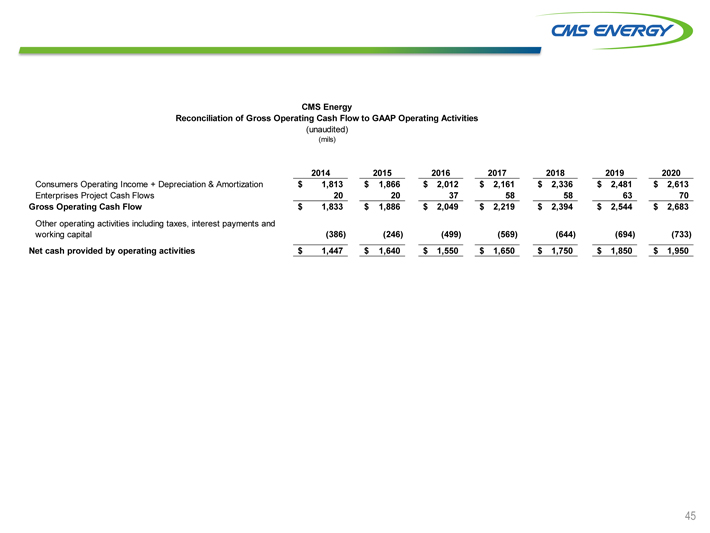
CMS Energy
Reconciliation of Gross Operating Cash Flow to GAAP Operating Activities
(unaudited)
(mils)
2014 2015 2016 2017 2018 2019 2020
Consumers Operating Income + Depreciation & Amortization $ 1,813 $ 1,866 $ 2,012 $ 2,161 $ 2,336 $ 2,481 $ 2,613
Enterprises Project Cash Flows 20 20 37 58 58 63 70
Gross Operating Cash Flow $ 1,833 $ 1,886 $ 2,049 $ 2,219 $ 2,394 $ 2,544 $ 2,683
Other operating activities including taxes, interest payments and
working capital(386)(246)(499)(569)(644)(694)(733)
Net cash provided by operating activities $ 1,447 $ 1,640 $ 1,550 $ 1,650 $ 1,750 $ 1,850 $ 1,950
45
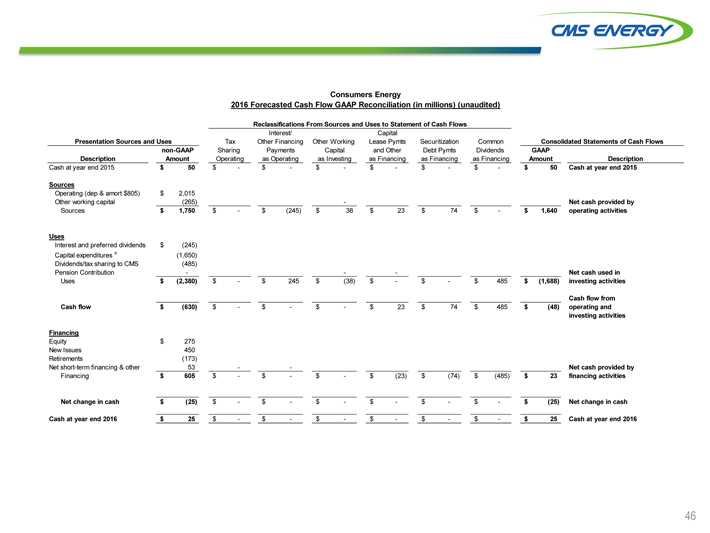
Consumers Energy
2016 Forecasted Cash Flow GAAP Reconciliation (in millions) (unaudited)
Reclassifications From Sources and Uses to Statement of Cash Flows
Interest/ Capital
Presentation Sources and Uses Tax Other Financing Other Working Lease Pymts Securitization Common Consolidated Statements of Cash Flows
non-GAAP Sharing Payments Capital and Other Debt Pymts Dividends GAAP
Description Amount Operating as Operating as Investing as Financing as Financing as Financing Amount Description
Cash at year end 2015 $ 50 $—$—$—$—$—$—$ 50 Cash at year end 2015
Sources
Operating (dep & amort $805) $ 2,015
Other working capital(265)—Net cash provided by
Sources $ 1,750 $—$(245) $ 38 $ 23 $ 74 $—$ 1,640 operating activities
Uses
Interest and preferred dividends $(245)
Capital expenditures a(1,650)
Dividends/tax sharing to CMS(485)
Pension Contribution ——Net cash used in
Uses $(2,380) $—$ 245 $(38) $—$—$ 485 $ (1,688) investing activities
Cash flow from
Cash flow $(630) $—$—$—$ 23 $ 74 $ 485 $ (48) operating and
investing activities
Financing
Equity $ 275
New Issues 450
Retirements(173)
Net short-term financing & other 53 — Net cash provided by
Financing $ 605 $—$—$—$(23) $(74) $(485) $ 23 financing activities
Net change in cash $(25) $—$—$—$—$—$—$ (25) Net change in cash
Cash at year end 2016 $ 25 $—$—$—$—$—$—$ 25 Cash at year end 2016
46
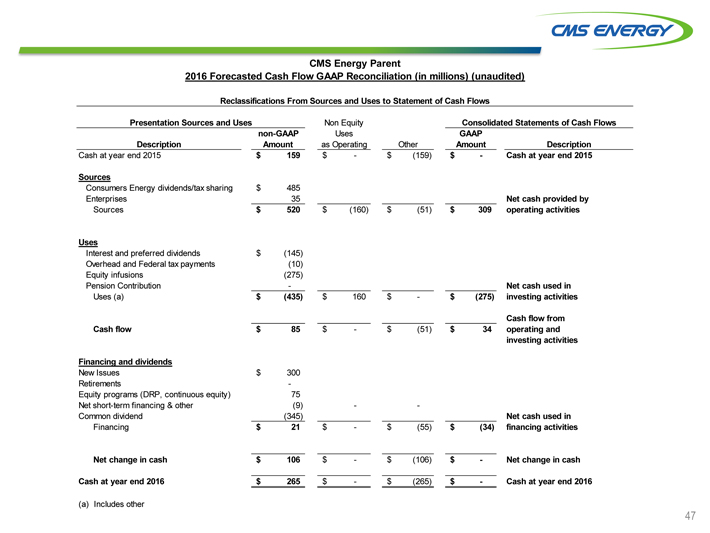
CMS Energy Parent
2016 Forecasted Cash Flow GAAP Reconciliation (in millions) (unaudited)
Reclassifications From Sources and Uses to Statement of Cash Flows
Presentation Sources and Uses Non Equity Consolidated Statements of Cash Flows
non-GAAP Uses GAAP
Description Amount as Operating Other Amount Description
Cash at year end 2015 $ 159 $—$(159) $—Cash at year end 2015
Sources
Consumers Energy dividends/tax sharing $ 485
Enterprises 35 Net cash provided by
Sources $ 520 $(160) $(51) $ 309 operating activities
Uses
Interest and preferred dividends $(145)
Overhead and Federal tax payments(10)
Equity infusions(275)
Pension Contribution—Net cash used in
Uses (a) $(435) $ 160 $—$(275) investing activities
Cash flow from
Cash flow $ 85 $—$(51) $ 34 operating and
investing activities
Financing and dividends
New Issues $ 300
Retirements -
Equity programs (DRP, continuous equity) 75
Net short-term financing & other(9) —
Common dividend(345) Net cash used in
Financing $ 21 $—$(55) $(34) financing activities
Net change in cash $ 106 $—$(106) $—Net change in cash
Cash at year end 2016 $ 265 $—$(265) $—Cash at year end 2016
(a) Includes other
47
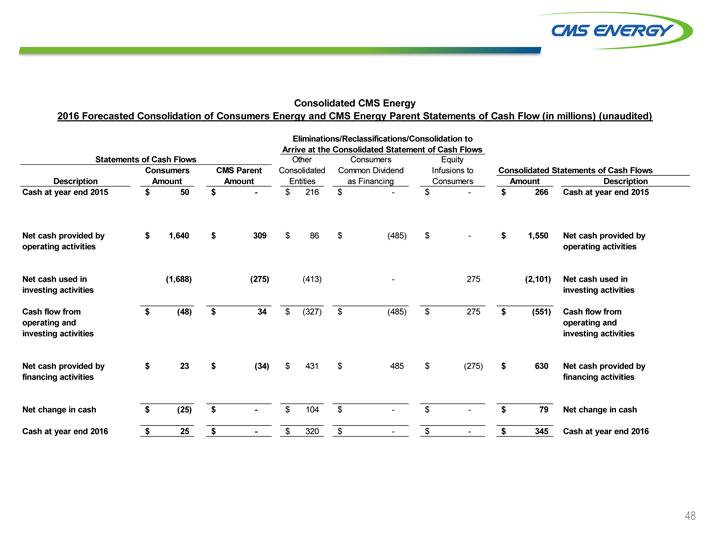
Consolidated CMS Energy
2016 Forecasted Consolidation of Consumers Energy and CMS Energy Parent Statements of Cash Flow (in millions) (unaudited)
Eliminations/Reclassifications/Consolidation to
Arrive at the Consolidated Statement of Cash Flows
Statements of Cash Flows Other Consumers Equity
Consumers CMS Parent Consolidated Common Dividend Infusions to Consolidated Statements of Cash Flows
Description Amount Amount Entities as Financing Consumers Amount Description
Cash at year end 2015 $ 50 $—$ 216 $—$—$ 266 Cash at year end 2015
Net cash provided by $ 1,640 $ 309 $ 86 $(485) $—$ 1,550 Net cash provided by
operating activities operating activities
Net cash used in(1,688)(275)(413)—275(2,101) Net cash used in
investing activities investing activities
Cash flow from $(48) $ 34 $(327) $(485) $ 275 $(551) Cash flow from
operating and operating and
investing activities investing activities
Net cash provided by $ 23 $(34) $ 431 $ 485 $(275) $ 630 Net cash provided by
financing activities financing activities
Net change in cash $(25) $—$ 104 $—$—$ 79 Net change in cash
Cash at year end 2016 $ 25 $—$ 320 $—$—$ 345 Cash at year end 2016
48