Attached files
| file | filename |
|---|---|
| 8-K - 8-K - JONES LANG LASALLE INC | q42015earningrelease-form8k.htm |
| EX-99.1 - EXHIBIT 99.1 - JONES LANG LASALLE INC | exhibit991fourthquarter201.htm |

Supplemental Information Earnings Call Fourth-Quarter 2015

Leasing (in square meters) Americas (U.S. only) 10% 2% 0-5% EMEA (Europe only) 18% 13% Flat Asia Pacific (select markets) 23% 19% 15% Total 14% 8% 5% ForecastActual Capital Markets(1) LC USD LC USD USD Americas -8% -9% 5% 4% 5-10% EMEA(2) 12% -2% 14% -4% Flat Asia Pacific -13% -19% 3% -6% 5% Total -2% -8% 8% -1% 0-5% Investment volumes remain solid; outlook steady Market volume & outlook Actual Forecast Q4 2015 v. Q4 2014 FY 2015 v. FY 2014 FY 2016 v. FY 2015 Leasing volumes improving; momentum continues (1) Market volume data excludes multi-family assets. (2) JLL Research volume projections for full year 2016 are flat in both euro terms and U.S. dollars compared to 2015. Source: JLL Research, February 2016 JLL Research 2 Market Volumes Q4 2015 v. Q4 2014 FY 2015 v. FY 2014 FY 2016 v. FY 2015 Gross Absorption

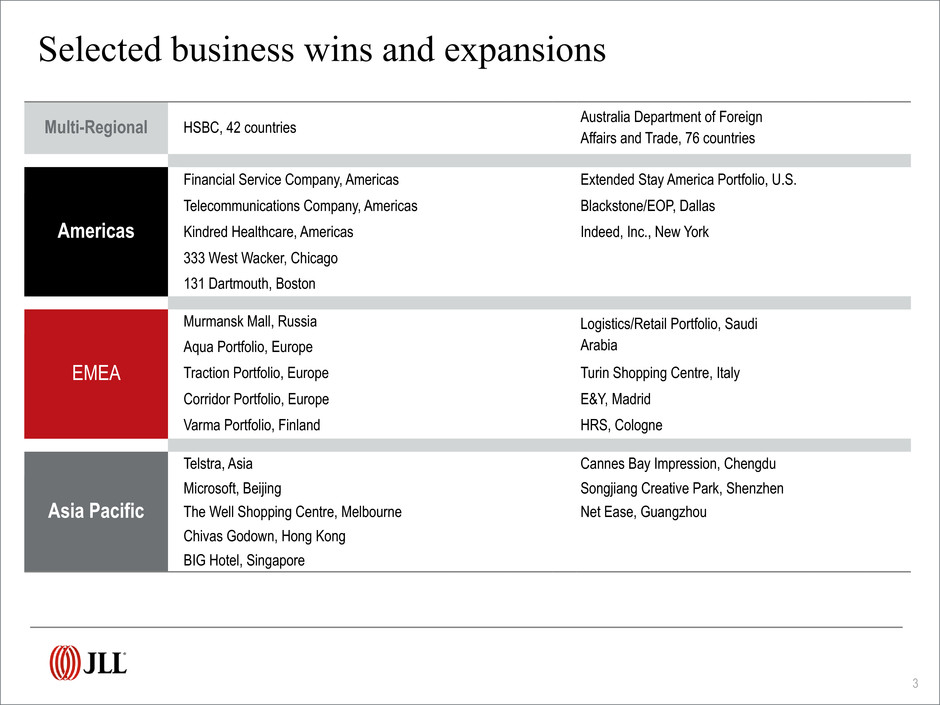
Multi-Regional HSBC, 42 countries Australia Department of ForeignAffairs and Trade, 76 countries Americas Financial Service Company, Americas Extended Stay America Portfolio, U.S. Telecommunications Company, Americas Blackstone/EOP, Dallas Kindred Healthcare, Americas Indeed, Inc., New York 333 West Wacker, Chicago 131 Dartmouth, Boston EMEA Murmansk Mall, Russia Logistics/Retail Portfolio, Saudi ArabiaAqua Portfolio, Europe Traction Portfolio, Europe Turin Shopping Centre, Italy Corridor Portfolio, Europe E&Y, Madrid Varma Portfolio, Finland HRS, Cologne Asia Pacific Telstra, Asia Cannes Bay Impression, Chengdu Microsoft, Beijing Songjiang Creative Park, Shenzhen The Well Shopping Centre, Melbourne Net Ease, Guangzhou Chivas Godown, Hong Kong BIG Hotel, Singapore Selected business wins and expansions 3

Rental Values Capital Values + 10-20% Boston Madrid, Boston, Brussels + 5-10% Tokyo, Dubai*, Chicago, Los Angeles, New York*, Tokyo, Shanghai, Dubai*, Chicago, Los Angeles,San Francisco, Sydney, Shanghai, Hong Kong, Madrid New York*, San Francisco, Moscow, Stockholm + 0-5% London*, Brussels, Seoul, Toronto, Washington DC, Sydney, London*, Milan, Hong Kong, Frankfurt,Beijing, Paris*, Moscow, Milan, Frankfurt, Stockholm Toronto, Washington DC, Beijing, Seoul, Paris* - 0-5% Mumbai, Mexico City Mumbai, Mexico City - 5-10% Sao Paulo Sao Paulo - 10-20% Singapore Singapore Prime offices projected changes in values, 2016 4 NOTES: *New York – Midtown, London – West End, Paris - CBD, Dubai - DIFC. Nominal rates in local currency. Source: JLL Research, February 2016

Note: Equity earnings of $13.6M and $77.5M in Q4 2015 and FY 2015, respectively, are included in segment results, however, excluded from Consolidated totals. Year-over-year increases shown fee-based have been calculated using fee revenue, which excludes gross contract costs. Consolidated Fee - $1,666 Gross - $1,887 LaSalle 6.5% $109 EMEA 29.3% Fee - $493 Gross - $614 Q4 2015 Revenue Revenue performance ($ in millions) Americas 45.3% Fee - $761 Gross - $815 Asia Pac 18.9% Fee - $317 Gross - $363 5 Consolidated Fee - $5,164 Gross - $5,966 LaSalle 8.9% $467 EMEA 26.3% Fee - $1,407 Gross - $1,804 FY 2015 Americas 45.7% Fee - $2,399 Gross - $2,611 Asia Pac 18.5% Fee - $969 Gross - $1,161 Q4 2015 FY 2015 YOY % Growth, Fee Revenue Basis LC USD Segment LC USD 14% 11% Americas 16% 14% 13% 4% EMEA 20% 7% 14% 5% Asia Pacific 17% 7% 15% 11% LaSalle 20% 13% 14% 7% Consolidated 17% 10% 15% 8% Consolidated Gross Revenue 18% 10%

Note: Segment and Consolidated Real Estate Services (“RES”) operating revenue exclude Equity earnings (losses). Fee revenue presentation of Property & Facility Management, Project & Development Services and Total RES Operating Revenue excludes gross contract costs. Q4 2015 Real Estate Services revenue ($ in millions; % change in local currency over Q4 2014) Americas EMEA Asia Pacific Total RES Leasing $374.9 13% $103.4 7% $87.7 11% $566.0 12% Capital Markets & Hotels $105.4 13% $176.1 11% $50.4 (12%) $331.9 7% Property & Facility Management Fee $154.1 15% $68.1 13% $115.3 23% $337.5 17% Gross Revenue $206.7 12% $85.2 1% $149.7 14% $441.6 10% Project & Development Services - Fee $81.5 21% $58.7 57% $21.2 11% $161.4 31% Gross Revenue $83.0 21% $163.0 85% $32.7 8% $278.7 50% Advisory, Consulting & Other $44.5 13% $86.2 6% $41.5 39% $172.2 14% Total RES Operating Fee Revenue $760.4 14% $492.5 13% $316.1 14% $1,569.0 14% Total Gross Revenue $814.5 14% $613.9 21% $362.0 11% $1,790.4 15% 6

Note: Segment and Consolidated Real Estate Services (“RES”) operating revenue exclude Equity earnings (losses). Fee revenue presentation of Property & Facility Management, Project & Development Services and Total RES Operating Revenue excludes gross contract costs. YTD 2015 Real Estate Services revenue ($ in millions; % change in local currency over YTD 2014) Americas EMEA Asia Pacific Total RES Leasing $1,165.6 14% $289.4 11% $214.5 13% $1,669.5 13% Capital Markets & Hotels $331.6 25% $474.8 29% $149.4 15% $955.8 25% Property & Facility Management Fee $499.3 14% $224.4 6% $404.5 17% $1,128.2 13% Gross Revenue $706.1 12% $304.8 1% $546.5 13% $1,557.4 10% Project & Development Services - Fee $258.0 20% $170.1 38% $81.9 25% $510.0 26% Gross Revenue $263.3 21% $487.1 58% $131.7 13% $882.1 38% Advisory, Consulting & Other $138.9 13% $247.0 18% $118.0 21% $503.9 18% Total RES Operating Fee Revenue $2,393.4 16% $1,405.7 20% $968.3 17% $4,767.4 17% Total Gross Revenue $2,605.5 16% $1,803.1 25% $1,160.1 14% $5,568.7 18% 7

• Successful capital raising with $1.2 billion for the quarter, $5.0 billion raised for the year • Assets Under Management reach $56 billion, up from $54 billion a year ago; reflects net foreign currency reduction of $2.5 billion • Record equity earnings from valuation increases and investment dispositions • Notable incentive fees driven by asset sales • 2016 Outlook • Incentive fees expected to continue at magnitude potentially above historical average • Future equity earnings to reflect market value movements after two years of outsized results Separate Accounts $32.4 Commingled Funds $11.2 Public Securities $12.8 Q4 & FY 2015 Highlights Q4 2015 AUM = $56 Billion ($ in billions) Note: AUM data reported on a one-quarter lag. Public Securities $12.8 Continental Europe $3.9 8 U.K. $18.7 North America $14.4Asia Pacific $6.6

Highlights • Investment grade ratings; Baa2 (Positive) / BBB+ (Stable) ◦ Moody's outlook revised up to Positive in December 2015 ◦ Two S&P rating increases to BBB+ since December 2014 • FY 2015 net interest expense $28M, flat to FY 2014 • Ample capacity to invest for the future ◦ Disciplined long-term M&A focus ◦ Technology - expanding services, improving user experience and data analytics to drive productivity Net Debt $ millions Dec 2015 Dec 2014 Dec 2013 Cash and Cash Equivalents $ 216 $ 250 $ 153 Short Term Borrowings 49 20 25 Credit Facility ($2B capacity) 255 — 155 Net Bank Debt $ 88 $ (230) $ 27 Long Term Senior Notes 275 275 275 Deferred Business Acquisition Obligations 98 118 135 Total Net Debt $ 461 $ 163 $ 437 Investment grade balance sheet 9 (1) Includes payments made at close plus deferred acquisition and earn outs paid during the period for transactions closed in prior periods (2) Includes capital contributions of $48M offset by distributions of $48M, excluding amounts attributable to a consolidated investment in which we have no equity interest. (3) Excludes investments in joint venture entities, capitalized leases and tenant improvement allowances that are required to be consolidated under U.S. GAAP Cash Spend 2015 2014 2013$ in millions M&A(1) $446 $78 $130 (Including Deferred) Co-investment(2) 0 -6 9 Dividends 26 22 20 Capital Expenditures(3) 149 130 97 Total Spend $621 $224 $256

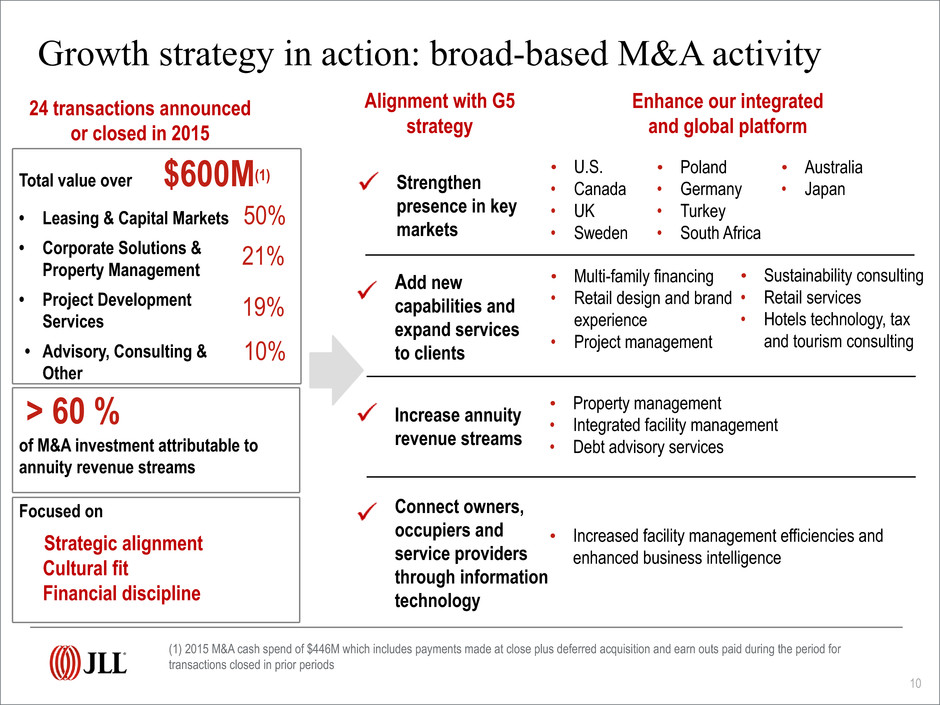
Growth strategy in action: broad-based M&A activity 10 (1) 2015 M&A cash spend of $446M which includes payments made at close plus deferred acquisition and earn outs paid during the period for transactions closed in prior periods 24 transactions announced or closed in 2015 Total value over • Leasing & Capital Markets • Corporate Solutions & Property Management • Project Development Services • Advisory, Consulting & Other Focused on Strategic alignment Cultural fit Financial discipline Alignment with G5 strategy Enhance our integrated and global platform Strengthen presence in key markets • U.S. • Canada • UK • Sweden • Poland • Germany • Turkey • South Africa • Australia • Japan Add new capabilities and expand services to clients • Multi-family financing • Retail design and brand experience • Project management • Sustainability consulting • Retail services • Hotels technology, tax and tourism consulting Increase annuity revenue streams • Property management • Integrated facility management • Debt advisory services Connect owners, occupiers and service providers through information technology • Increased facility management efficiencies and enhanced business intelligence $600M(1) 50% 21% 19% of M&A investment attributable to annuity revenue streams > 60 % 10%

Appendix 11

Prime Offices Capital Value Clock, Q4 2014 v Q4 2015 Based on notional capital values for Grade A space in CBD or equivalent. US positions relate to the overall market Source: JLL Research, February 2016 Americas EMEA Asia Pacific The Jones Lang LaSalle Property Clocks SM 12

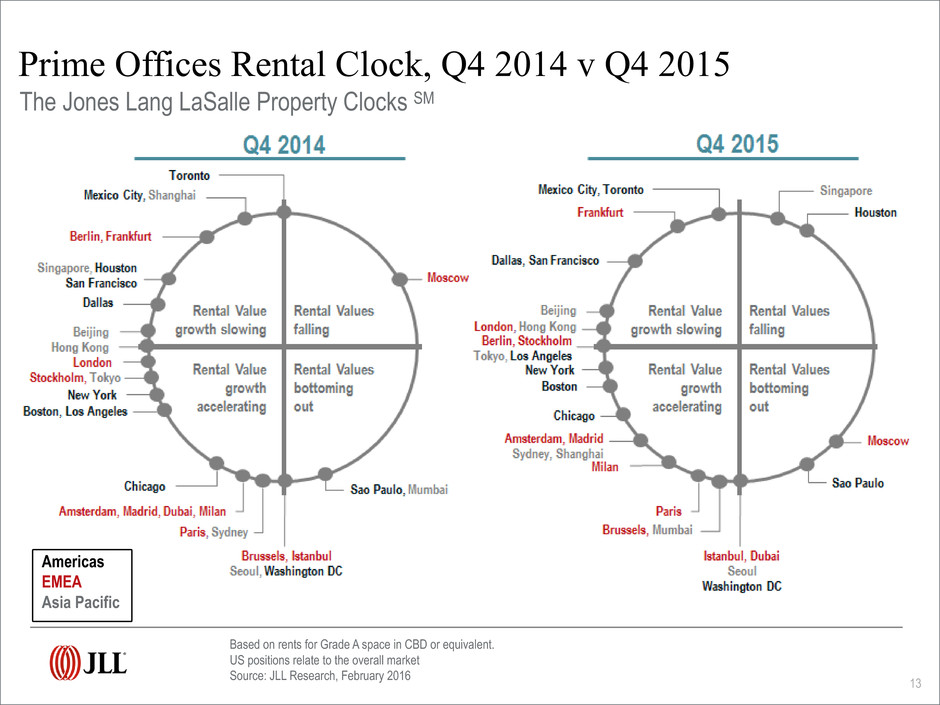
Prime Offices Rental Clock, Q4 2014 v Q4 2015 Based on rents for Grade A space in CBD or equivalent. US positions relate to the overall market Source: JLL Research, February 2016 Americas EMEA Asia Pacific The Jones Lang LaSalle Property Clocks SM 13

Refer to page 19 for Reconciliation of GAAP Net Income to Adjusted EBITDA for the three and twelve months ended December 31, 2015, for details relative to these Adjusted EBITDA calculations. Segment Adjusted EBITDA is calculated by adding the segment’s depreciation and amortization to its reported operating income, which includes equity earnings and excludes restructuring and acquisition charges. Consolidated Adjusted EBITDA is the sum of the Adjusted EBITDA of the four segments. Consolidated $312 Q4 2015 Adjusted EBITDA Adjusted EBITDA performance ($ in millions) Asia Pac 18.8% $58 EMEA 30.7% $99 LaSalle 9.7% $30 14 Consolidated $749 FY 2015 Asia Pac 13.7% $103 EMEA 22.7% $173 LaSalle 21.5% $159 Q4 Adj. EBITDA Margin, Fee Revenue FY 2015 2015 atconstant rates 2014 Segment 2015 2015 at constant rates 2014 16.4% 17.3% 18.1% Americas 13.1% 13.3% 13.0% 20.1% 20.4% 19.2% EMEA 12.3% 12.4% 11.0% 18.4% 18.4% 19.1% Asia Pacific 10.6% 11.0% 10.7% 27.2% 26.1% 26.8% LaSalle 34.2% 34.0% 32.3% 18.7% 19.2% 19.2% Consolidated 14.5% 14.6% 13.8% Americas 40.8% $125 Americas 42.1% $314

Americas EMEA Asia Pacific Total RES Leasing $374.9 9% $103.4 -3% $87.7 4% $566.0 5% Capital Markets & Hotels $105.4 12% $176.1 2% $50.4 -20% $331.9 1% Property & Facility Management Fee $154.1 11% $68.1 4% $115.3 14% $337.5 10% Gross Revenue $206.7 6% $85.2 -7% $149.7 6% $441.6 3% Project & Development Services - Fee $81.5 17% $58.7 42% $21.2 1% $161.4 23% Gross Revenue $83.0 17% $163.0 68% $32.7 -1% $278.7 39% Advisory, Consulting & Other $44.5 11% $86.2 -2% $41.5 27% $172.2 7% Total RES Operating Fee Revenue $760.4 11% $492.5 4% $316.1 5% $1,569.0 7% Total Gross Revenue $814.5 9% $613.9 10% $362.0 2% $1,790.4 8% Note: Segment and Consolidated Real Estate Services (“RES”) operating revenue exclude Equity earnings (losses). Fee revenue presentation of Property & Facility Management, Project & Development Services and Total RES Operating Revenue excludes gross contract costs. Q4 2015 Real Estate Services revenue ($ in millions; % change in USD over Q4 2014) 15

Note: Segment and Consolidated Real Estate Services (“RES”) operating revenue exclude Equity earnings (losses). Fee revenue presentation of Property & Facility Management, Project & Development Services and Total RES Operating Revenue excludes gross contract costs. FY 2015 Real Estate Services revenue ($ in millions; % change in USD over FY 2014) Americas EMEA Asia Pacific Total RES Leasing $1,165.6 12% $289.4 -2% $214.5 4% $1,669.5 8% Capital Markets & Hotels $331.6 24% $474.8 15% $149.4 3% $955.8 16% Property & Facility Management Fee $499.3 10% $224.4 -5% $404.5 7% $1,128.2 5% Gross Revenue $706.1 7% $304.8 -10% $546.5 4% $1,557.4 2% Project & Development Services - Fee $258.0 16% $170.1 22% $81.9 13% $510.0 17% Gross Revenue $263.3 17% $487.1 37% $131.7 2% $882.1 24% Advisory, Consulting & Other $138.9 11% $247.0 6% $118.0 10% $503.9 8% Total RES Operating Fee Revenue $2,393.4 14% $1,405.7 7% $968.3 7% $4,767.4 10% Total Gross Revenue $2,605.5 13% $1,803.1 10% $1,160.1 5% $5,568.7 10% 16

• Reimbursable vendor, subcontractor and out-of-pocket costs reported as revenue and expense in JLL financial statements have been increasing steadily • Gross accounting requirements increase revenue and costs without corresponding increase to profit • Business managed on a fee revenue basis to focus on margin expansion in the base business Revenue Gross contract costs Fee revenue Operating expenses Gross contract costs Fee-based operating expenses Operating income Restructuring and acquisition charges Adjusted operating income Adjusted operating income margin Fee revenue / expense reconciliation ($ in millions) Note: Consolidated revenue and fee revenue exclude equity earnings (losses). Restructuring and acquisition charges are excluded from adjusted operating income margin. Three Months Ended December 31 Twelve Months Ended December 31 2015 2014 2015 2014 $ 1,887.4 $ 1,749.0 $ 5,965.7 $ 5,429.6 (221.3) (191.6) (801.3) (727.9) $ 1,666.1 $ 1,557.4 $ 5,164.4 $ 4,701.7 $ 1,633.6 $ 1,487.2 $ 5,435.9 $ 4,963.9 (221.3) (191.6) (801.3) (727.9) $ 1,412.3 $ 1,295.6 $ 4,634.6 $ 4,236.0 $ 253.8 $ 261.8 $ 529.8 $ 465.7 13.4 3.3 34.1 42.5 $ 267.2 $ 265.1 $ 563.9 $ 508.2 16.0% 17.0% 10.9% 10.8% 17

Reconciliation of GAAP Net Income to Adjusted Net Income and Earnings Per Share ($ in millions) GAAP net income attributable to common shareholders Shares (in 000s) GAAP diluted earnings per share GAAP net income attributable to common shareholders Restructuring and acquisition charges, net Adjusted net income Shares (in 000s) Adjusted diluted earnings per share Currency impact on adjusted diluted earnings per share Adjusted diluted earnings per share - local currency Three Months Ended December 31 Twelve Months Ended December 31 2015 2014 2015 2014 $ 195.9 $ 193.8 $ 438.4 $ 385.7 45,492 45,332 45,415 45,261 $ 4.31 $ 4.28 $ 9.65 $ 8.52 $ 195.9 $ 193.8 $ 438.4 $ 385.7 10.1 2.5 16.1 6.0 $ 206.0 $ 196.3 $ 454.5 $ 391.7 45,492 45,332 45,415 45,261 $ 4.53 $ 4.33 $ 10.01 $ 8.65 0.42 0.87 $ 4.95 $ 10.88 18

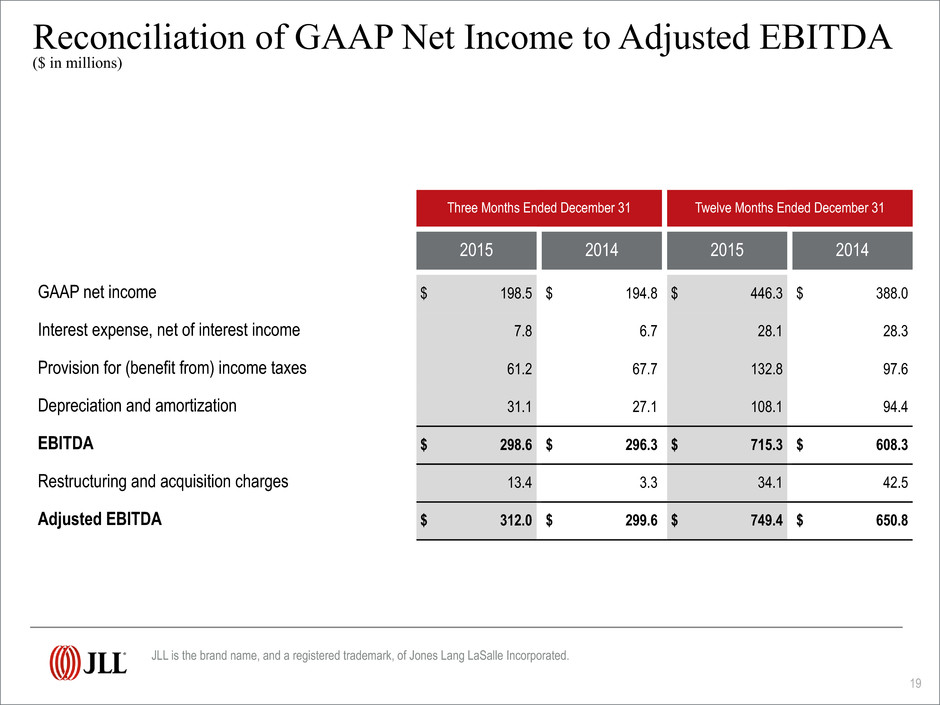
Reconciliation of GAAP Net Income to Adjusted EBITDA ($ in millions) GAAP net income Interest expense, net of interest income Provision for (benefit from) income taxes Depreciation and amortization EBITDA Restructuring and acquisition charges Adjusted EBITDA JLL is the brand name, and a registered trademark, of Jones Lang LaSalle Incorporated. Three Months Ended December 31 Twelve Months Ended December 31 2015 2014 2015 2014 $ 198.5 $ 194.8 $ 446.3 $ 388.0 7.8 6.7 28.1 28.3 61.2 67.7 132.8 97.6 31.1 27.1 108.1 94.4 $ 298.6 $ 296.3 $ 715.3 $ 608.3 13.4 3.3 34.1 42.5 $ 312.0 $ 299.6 $ 749.4 $ 650.8 19
