Attached files
| file | filename |
|---|---|
| 8-K - INTRAWEST RESORTS HOLDINGS, INC 8-K 2-3-2016 - Intrawest Resorts Holdings, Inc. | form8k.htm |
| EX-99.1 - EXHIBIT 99.1 - Intrawest Resorts Holdings, Inc. | ex99_1.htm |

Intrawest Resorts Holdings, Inc.Fiscal 2016 Second Quarter Earnings Call PresentationFebruary 3, 2016

Important Information 1 This document contains forward-looking statements. These forward-looking statements are based on current expectations, estimates and projections about the industry and markets in which Intrawest operates as well as the Company’s beliefs and assumptions regarding our operations and financial performance, all of which are subject to known and unknown risks, uncertainties and other factors that may cause our actual results, performance or achievements, industry results or market trends to differ materially from those expressed or implied by such forward-looking statements. Therefore any statements contained herein that are not statements of historical fact may be forward-looking statements and should be evaluated as such. Without limiting the foregoing, words such as “Expects”, “Anticipates”, “Should”, “Intends”, “Plans”, “Believes”, “Seeks”, “Estimates”, “Projects”, and variations of such words and similar expressions are intended to identify such forward-looking statements. These statements are not guarantees of future performance and involve certain risks, uncertainties and assumptions which are difficult to predict, including those described in Part I - Item 1A, ‘‘Risk Factors’’ in our Annual Report on Form 10-K for the fiscal year ended June 30, 2015 filed with the Securities and Exchange Commission (“SEC”) on September 9, 2015, as may be revised in subsequent SEC filings. Therefore, actual outcomes and results may differ materially from what is expressed or forecasted in such forward-looking statements. The actual performance of Intrawest may differ from the budget, projections and returns set forth herein and may differ materially.Certain information contained herein has been obtained from published and non-published sources. Such information has not been independently verified by Intrawest. Except where otherwise indicated, the information provided herein is based on matters as they exist as of the date of preparation and not as of any future date, and will not be updated or otherwise revised to reflect information that subsequently becomes available, or circumstances existing or changes occurring after the date hereof.This presentation is part of the fiscal 2016 second quarter earnings call dated February 3, 2016, and includes certain non-GAAP financial measures, including Adjusted EBITDA (“Adj. EBITDA”). Non-GAAP financial measures such as Adj. EBITDA should be considered only as supplemental to, and not as superior to, financial measures prepared in accordance with GAAP. Please refer to our Current Report on Form 10-Q filed February 3, 2016, with the SEC for a reconciliation of the non-GAAP financial measures included in this presentation to the most directly comparable financial measures prepared in accordance with GAAP.We use Adj. EBITDA as a measure of our operating performance. Adj. EBITDA is a supplemental non-GAAP financial measure.Our board of directors and management team focus on Adj. EBITDA as a key performance and compensation measure. Adj. EBITDA assists us in comparing our performance over various reporting periods because it removes from our operating results the impact of items that our management believes do not reflect our core operating performance. The compensation committee of our board of directors will determine the annual variable compensation for certain members of our management team, based in part, on Adj. EBITDA. Adj. EBITDA is not a substitute for net income (loss), income (loss) from continuing operations, cash flows from operating activities or any other measure prescribed by GAAP. There are limitations to using non-GAAP measures such as Adj. EBITDA. Although we believe that Adj. EBITDA can make an evaluation of our operating performance more consistent because it removes items that do not reflect our core operations, other companies in our industry may define Adj. EBITDA differently than we do. As a result, it may be difficult to use Adj. EBITDA to compare the performance of those companies to our performance. Adj. EBITDA should not be considered as a measure of the income generated by our business or discretionary cash available to us to invest in the growth of our business. Our management compensates for these limitations by reference to our GAAP results and using Adj. EBITDA as a supplemental measure.
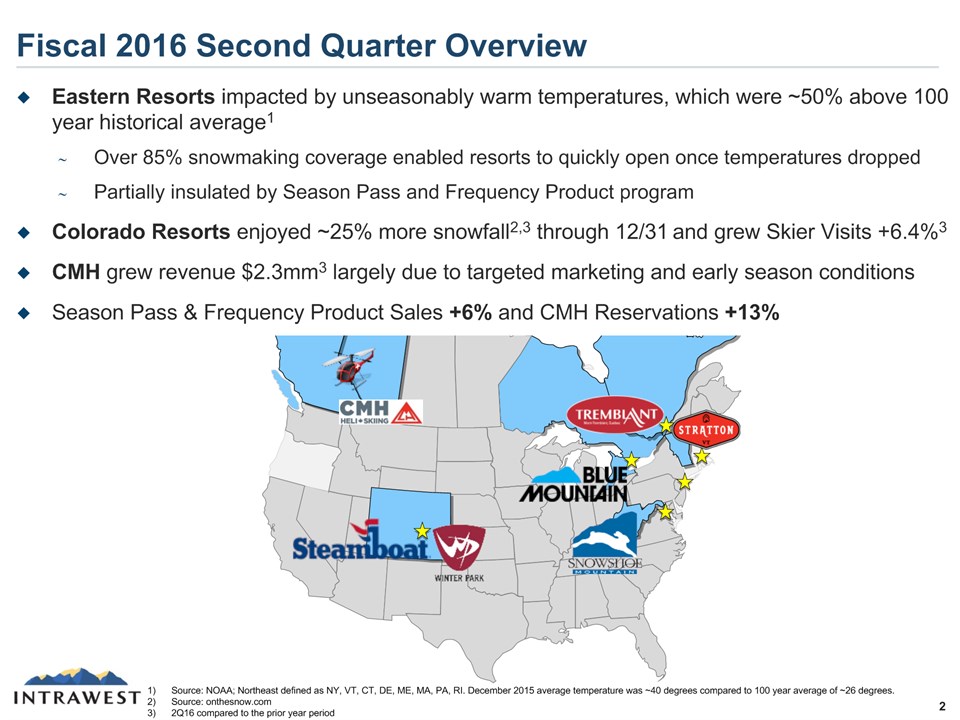
Fiscal 2016 Second Quarter Overview 2 Source: NOAA; Northeast defined as NY, VT, CT, DE, ME, MA, PA, RI. December 2015 average temperature was ~40 degrees compared to 100 year average of ~26 degrees.Source: onthesnow.com2Q16 compared to the prior year period Eastern Resorts impacted by unseasonably warm temperatures, which were ~50% above 100 year historical average1Over 85% snowmaking coverage enabled resorts to quickly open once temperatures droppedPartially insulated by Season Pass and Frequency Product programColorado Resorts enjoyed ~25% more snowfall2,3 through 12/31 and grew Skier Visits +6.4%3CMH grew revenue $2.3mm3 largely due to targeted marketing and early season conditionsSeason Pass & Frequency Product Sales +6% and CMH Reservations +13%

Tender Offer in Progress and Completed Sale of IRCG 3 Announced Tender Offer to repurchase up to $50 million of stockWe believe the $9 to $10 tender range is well below the intrinsic value of the businessSold Intrawest Resort Club Group on January 29th for $80.8 million of net proceedsStrong balance sheet and well positioned for continued growth Includes capital lease obligationsPro Forma for IRCG Sale, includes $2.6mm of estimated transaction fees and $80.8mm of proceeds, net of anticipated post-closing adjustments,.Trading multiple assuming land is valued at book value; Implied trading multiple of EBITDA generating assets.

Calendar Year 2016 Capital Plan 4 Plan to invest $43 million to $48 million$32 million to $34 million of Maintenance Capital$11 million to $14 million of Growth and Discretionary CapitalFocus on Colorado Resorts and TechnologyMountain coaster and mini-golf at Steamboat to capitalize on significant existing summer visitationReplace Elkhead chairlift at Steamboat with new high-speed quadImprove and expand food and beverage offerings at Winter ParkTechnology and data analytics investment to leverage RFID capabilities at Colorado resorts

Fiscal 2016 Second Quarter Results 5 (US$mm) Note: Totals may not add due to rounding.

Revised Fiscal Year 2016 Guidance 6 Assumes normal weather and USD/CAD exchange rate of 1.421Removes $2.3 million of Adjusted EBITDA related to IRCG for February – June of FY16Net Income includes an estimated $39 million gain on the sale of IRCG2 Original guidance provided assumed USD/CAD of 1.33.Subject to post-closing adjustments

Conclusion 7 Growth at Colorado Resorts and CMH CO Skier Visits +6.4% & CMH Revenue +$2.3mm Positive Indicators for Remainder of Ski SeasonSeason Pass & Frequency Product Sales +6% & CMH Reservations +13% Improved Liquidity Supports Growth and Potential DeleveragingCompleted sale of IRCG and received $80.8mm in proceeds2 Source: NOAA; Northeast defined as NY, VT, CT, DE, ME, MA, PA, RI. December 2015 average temperature was ~40 degrees compared to 100 year average of ~26 degrees.Net of anticipated post-closing adjustments East Impacted by Warmest December on Record1Now over 90% of trails open due to extensive snowmaking capabilities