Attached files
| file | filename |
|---|---|
| 8-K - GLU MOBILE INC. 8-K - GLU MOBILE INC | a51272156.htm |
| EX-99.01 - EXHIBIT 99.01 - GLU MOBILE INC | a51272156ex99_01.htm |
Exhibit 99.02

Mobile Q4 2015 Earnings © Glu Mobile Inc. – Proprietary Glu Mobile Inc. Q4 2015 Earnings Call February 3, 2016 Page 1
Glu Mobile Q4 2015 Earnings © Glu Mobile Inc. – Proprietary Safe Harbor Statement This presentation contains "forward-looking" statements including: that we intend to focus on “winner takes all” “blue ocean genres, and the four categories in which we are currently leaders are ones where we believe we can be the best in the world in 2016/2017; that we are minimally exposed to increases in CPI; that strong social features in a game will lead to long tail revenues; Glu’s expected approach to integrating social features in its games; Glu has multiple growth opportunities through wearables, the quad screen future, mobile ad spending and international expansion; the planned evolution of Glu’s business, including our intention to have our games function as platforms, our catalog cover fixed operating expenses and for new launches to account for less than 25% of revenues in a given year; the expected launch dates of Frontline Commando Rivals in various territories; that certain features in this game will be implemented in future updates; that the usage of chat and discussion boards in QuizUp drives much better retention; that there is an opportunity to create a primetime TV show featuring QuizUp; our expected title release slate for 2016, including that additional games may be launched if they pass our new central milestone process; the expected contribution margin flow through of our gross revenue; our Q1-2016 and full year 2016 guidance; our five year goals of annual revenue growth of 20% to 30%, $1 billion of non-GAAP revenue by 2020 and all quarters being Adjusted EBITDA profitable; and our long-term margin targets. These forward-looking statements are subject to material risks and uncertainties that could cause actual results to differ materially from those in the forward-looking statements. Investors should consider important risk factors, which include: consumer demand for smartphones, tablets and next-generation platforms does not grow as significantly as we anticipate or that we will be unable to capitalize on any such growth; the risk that we do not realize a sufficient return on our investment with respect to our efforts to develop free-to-play games for smartphones and tablets; the risk that we do not maintain our good relationships with Apple and Google; the risk that Glu does not realize the anticipated strategic benefits from its celebrity partnerships; the risk that our development expenses are greater than we anticipate or that we experience product delays; the risk that our recently and newly launched games are less popular than anticipated; the risk that our newly released games will be of a quality less than desired by reviewers and consumers; the risk that the mobile games market, particularly with respect to social, free-to-play gaming, is smaller than anticipated; risks related to the restatement of certain of our historical financial statements and other risks detailed under the caption "Risk Factors" in our Form 10-Q filed with the Securities and Exchange Commission on November 9, 2015 and our other SEC filings. You can locate these reports through our website at http://www.glu.com/investors. These "forward-looking" statements are based on estimates and information available to us on February 3, 2016 and we are under no obligation, and expressly disclaim any obligation, to update or alter our forward-looking statements whether as a result of new information, future events or otherwise.Page 2
Glu Mobile Q4 2015 Earnings © Glu Mobile Inc. – Proprietary Use of Non-GAAP Financial Measures Glu uses in this presentation certain non-GAAP measures of financial performance. The presentation of these non-GAAP financial measures is not intended to be considered in isolation from, as a substitute for, or superior to, the financial information prepared and presented in accordance with GAAP, and may be different from non-GAAP financial measures used by other companies. In addition, these non-GAAP measures have limitations in that they do not reflect all of the amounts associated with Glu's results of operations as determined in accordance with GAAP. The non-GAAP financial measures used by Glu include non-GAAP revenue, non-GAAP smartphone revenue, non-GAAP cost of revenue, non-GAAP gross profit, non-GAAP gross margin, non-GAAP operating expenses, non-GAAP operating margin, non-GAAP net income/(loss), non-GAAP net income/(loss) per share, Adjusted EBITDA and Adjusted EBITDA margin. These non-GAAP financial measures exclude the following items from Glu's unaudited consolidated statements of operations: Change in deferred revenue and deferred cost of revenue; Amortization of intangible assets; Non-cash warrant expense; Stock-based compensation expense; Restructuring charges; Change in fair value of Blammo earnout; Transitional costs; Litigation proceeds and costs; Release of tax liabilities and valuation allowance; and Foreign currency exchange gains and losses primarily related to the revaluation of assets and liabilities. In addition, Glu has included in this presentation “Adjusted EBITDA” figures which are used to evaluate Glu’s operating performance and is defined as non-GAAP operating income/(loss) excluding depreciation. Adjusted EBITDA margin is defined as Adjusted EBITDA divided by non-GAAP revenue. Glu believes that these non-GAAP financial measures, when taken together with the corresponding GAAP financial measures, provide meaningful supplemental information regarding Glu's performance by excluding certain items that may not be indicative of Glu's core business, operating results or future outlook. Glu's management uses, and believes that investors benefit from referring to, these non-GAAP financial measures in assessing Glu's operating results, as well as when planning, forecasting and analyzing future periods. These non-GAAP financial measures also facilitate comparisons of Glu's performance to prior periods. For a reconciliation of these non-GAAP financial measures to their most directly comparable GAAP financial measures, please refer to the tables at the end of this presentation. Page 3
Glu Mobile Q4 2015 Earnings © Glu Mobile Inc. – Proprietary Executive Summary Page 4

Executive SummaryGlu Mobile Q4 2015 Earnings © Glu Mobile Inc. – Proprietary Page 5

Glu Mobile Q4 2015 Earnings © Glu Mobile Inc. – Proprietary Strengthened Management Team Chris Akhavan Pres. of Publishing Eric R. Ludwig COO & CFO Niccolo de Masi Chairman & CEO Tim Wilson CTO Nick Earl Pres. of Studios Page 6
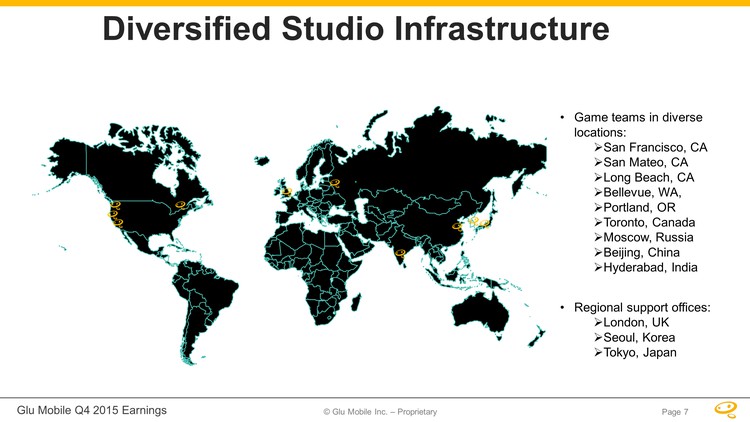
© Glu Mobile Inc. – Proprietary Glu Mobile Q4 2015 Earnings Diversified Studio Infrastructure Game teams in diverse locations: San Francisco, CA San Mateo, CA Long Beach, CA Bellevue, WA, Portland, OR Toronto, Canada Moscow, Russia Beijing, China Hyderabad, India Regional support offices: London, UK Seoul, Korea Tokyo, Japan Page 7
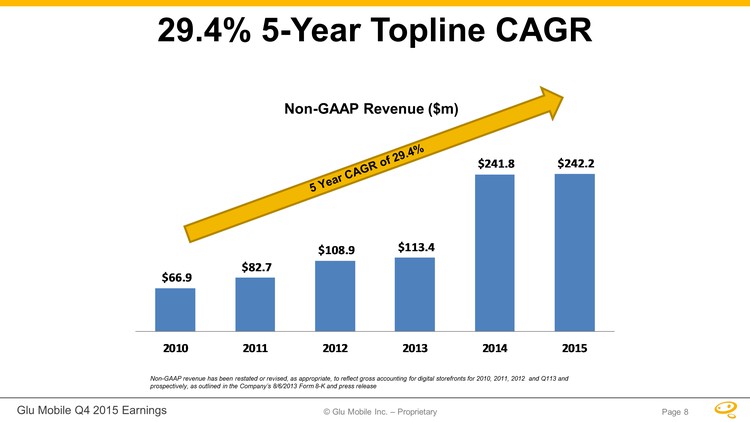
Glu Mobile Q4 2015 Earnings © Glu Mobile Inc. – Proprietary 29.4% 5-Year Topline CAGR $66.9 $82.7 $108.9 $113.4 $241.8 $242.2 201020112012201320142015 Non-GAAP revenue has been restated or revised, as appropriate, to reflect gross accounting for digital storefronts for 2010, 2011, 2012 and Q113 and prospectively, as outlined in the Company’s 8/6/2013 Form 8-K and press release Page 8
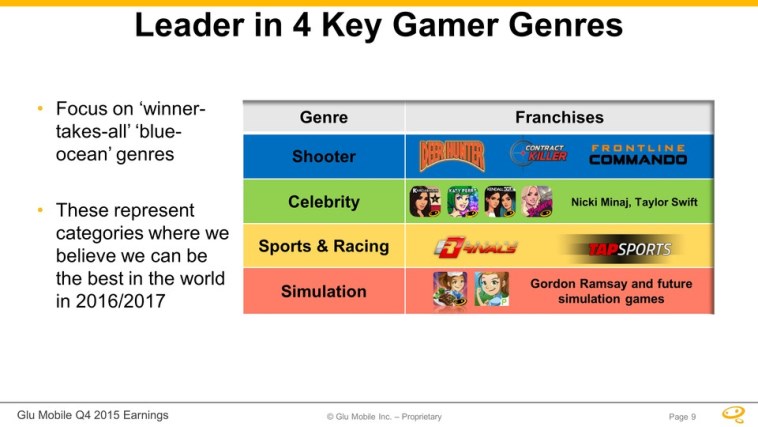
Focus on ‘winner-takes-all’ ‘blue-ocean’ genres Leader in 4 Key Gamer Genres These represent categories where we believe we can be the best in the world in 2016/2017 Glu Mobile Q4 2015 Earnings © Glu Mobile Inc. – Proprietary Page 9
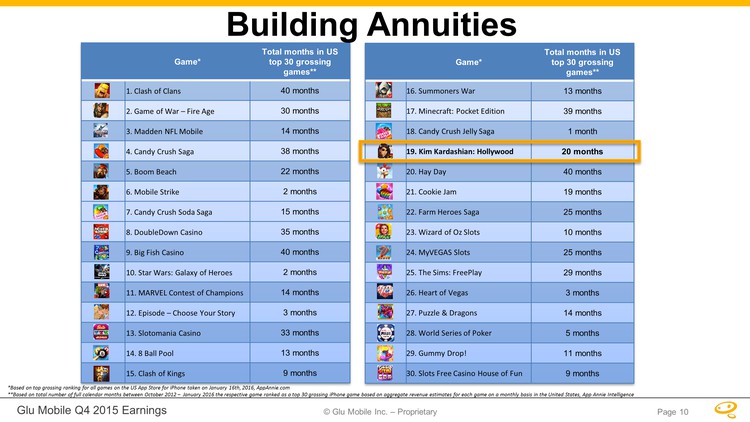
Building Annuities *Based on top grossing ranking for all games on the US App Store for iPhone taken on January 16th, 2016, AppAnnie.com **Based on total number of full calendar months between October 2012 – January 2016 the respective game ranked as a top 30 grossing iPhone game based on aggregate revenue estimates for each game on a monthly basis in the United States, App Annie Intelligence Page 10
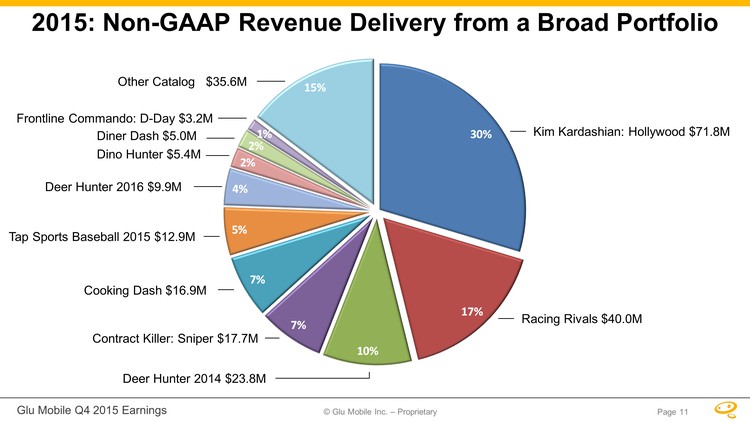
© Glu Mobile Inc. – Proprietary Glu Mobile Q4 2015 Earnings Deer Hunter 2016 $9.9M Kim Kardashian: Hollywood $71.8M Deer Hunter 2014 $23.8M Contract Killer: Sniper $17.7M Cooking Dash $16.9M Tap Sports Baseball 2015 $12.9M Dino Hunter $5.4M Diner Dash $5.0M Other Catalog $35.6M Frontline Commando: D-Day $3.2M 2015: Non-GAAP Revenue Delivery from a Broad Portfolio Racing Rivals $40.0M Page 11
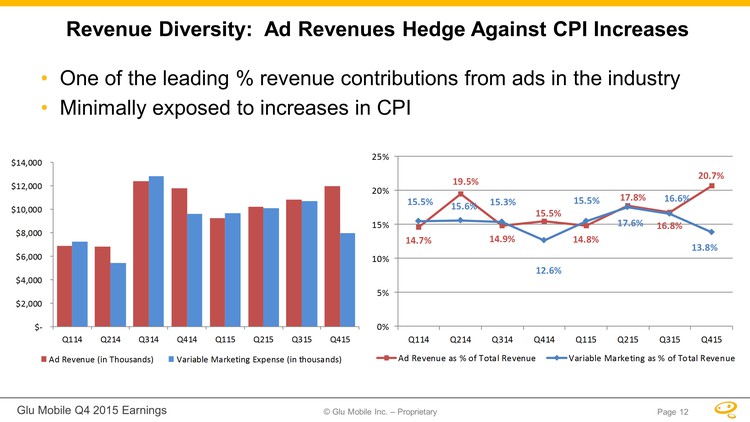
Glu Mobile Q4 2015 Earnings © Glu Mobile Inc. – Proprietary Revenue Diversity: Ad Revenues Hedge Against CPI Increases One of the leading % revenue contributions from ads in the industry Minimally exposed to increases in CPI $- $2,000 $4,000 $6,000 $8,000 $10,000 $12,000 $14,000Q114Q214Q314Q414Q115Q215Q315Q415Ad Revenue (in Thousands)Variable Marketing Expense (in thousands) 14.7 %19.5%14.9%15.5%14.8%17.8 %16.8%20.7%15.5%15. 6%15.3%12.6%15.5%17.6%16.6%13 .8%0%5%10%15 %20%25%Q 114Q214Q 314Q414Q115Q215Q315Q415 Ad Revenue as % of Total RevenueVariable Marketing as % of Total RevenuePage 12
Glu Mobile Q4 2015 Earnings © Glu Mobile Inc. – Proprietary Growth Landscape Page 13
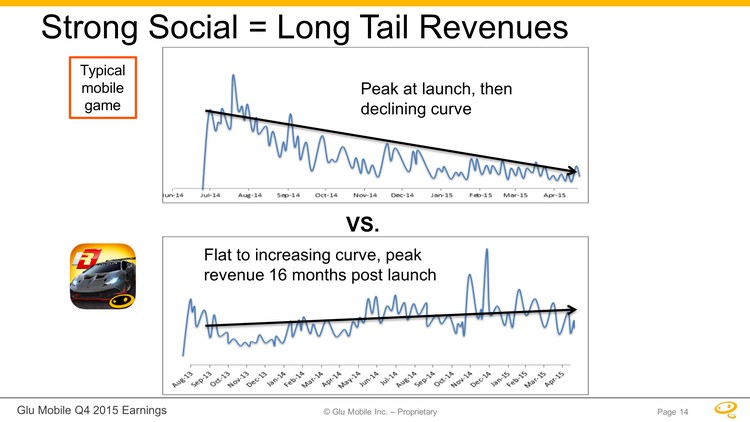
Glu Mobile Q4 2015 Earnings © Glu Mobile Inc. – Proprietary Strong Social = Long Tail Revenues Typical mobile game Peak at launch, then declining curve VS. Flat to increasing curve, peak revenue 16 months post launch Glu Mobile Q4 2015 Earnings © Glu Mobile Inc. – Proprietary Page 14
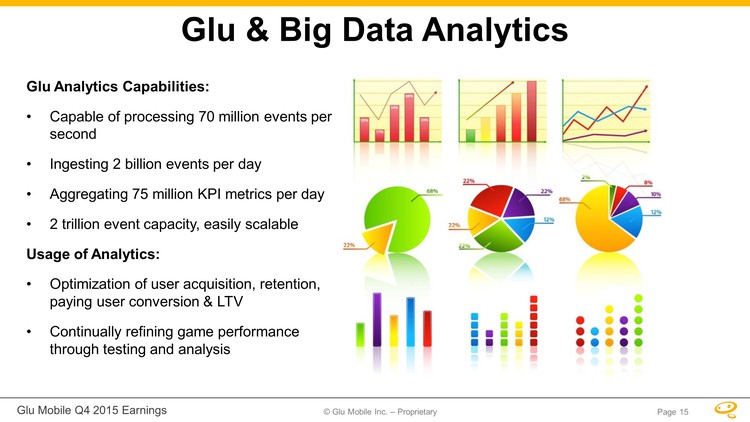
Glu Analytics Capabilities: Capable of processing 70 million events per second Ingesting 2 billion events per day Aggregating 75 million KPI metrics per day 2 trillion event capacity, easily scalable Usage of Analytics: Optimization of user acquisition, retention, paying user conversion & LTV Continually refining game performance through testing and analysis Glu & Big Data AnalyticsGlu Mobile Q4 2015 Earnings © Glu Mobile Inc. – Proprietary Page 15
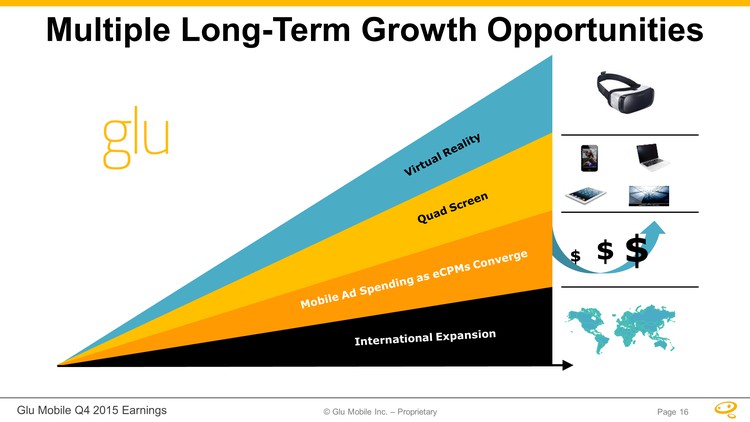
Multiple Long-Term Growth Opportunities $ $ $Glu Mobile Q4 2015 Earnings © Glu Mobile Inc. – Proprietary Page 16
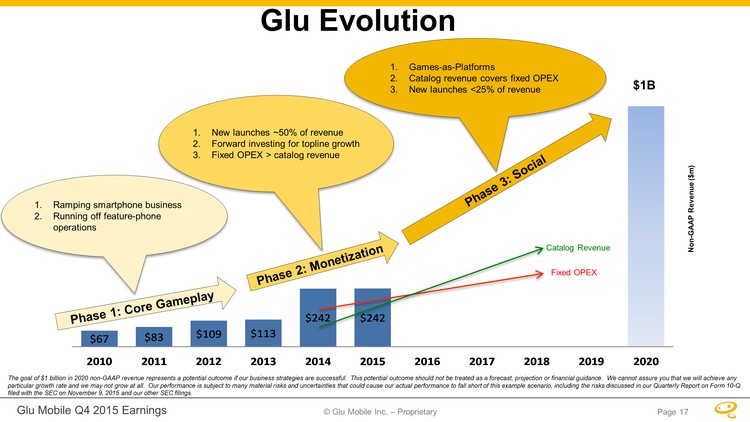
Glu Evolution 1. Ramping smartphone business 2. Running off feature-phone operations 1. New launches ~50% of revenue 2. Forward investing for topline growth 3. Fixed OPEX > catalog revenue 1. Games-as-Platforms 2. Catalog revenue covers fixed OPEX 3. New launches <25% of revenue $1BNon-GAAP Revenue ($m) The goal of $1 billion in 2020 non-GAAP revenue represents a potential outcome if our business strategies are successful. This potential outcome should not be treated as a forecast, projection or financial guidance. We cannot assure you that we will achieve any particular growth rate and we may not grow at all. Our performance is subject to many material risks and uncertainties that could cause our actual performance to fall short of this example scenario, including the risks discussed in our Quarterly Report on Form 10-Q filed with the SEC on November 9, 2015 and our other SEC filings. Fixed OPEX Catalog Revenue Page 17

Glu Mobile Q4 2015 Earnings © Glu Mobile Inc. – Proprietary Tencent ‘WeFire West’ Publishing Partnership Page 18

Glu Mobile Q4 2015 Earnings © Glu Mobile Inc. – Proprietary Publishing Partnership •Glu partnering with Tencent to westernize WeFire with Glu’s proven shooter IP Frontline Commando •We believe WeFire to be the biggest revenue mobile shooter ever •Sustained Top 10 grossing ranking in China and other territories in Asia •Highly social game with PvP and scaled backend •Expected to be live late Q2 2016 in North America, Australia and New Zealand with additional countries in South America and EMEA live in Q3 2016 Page 19
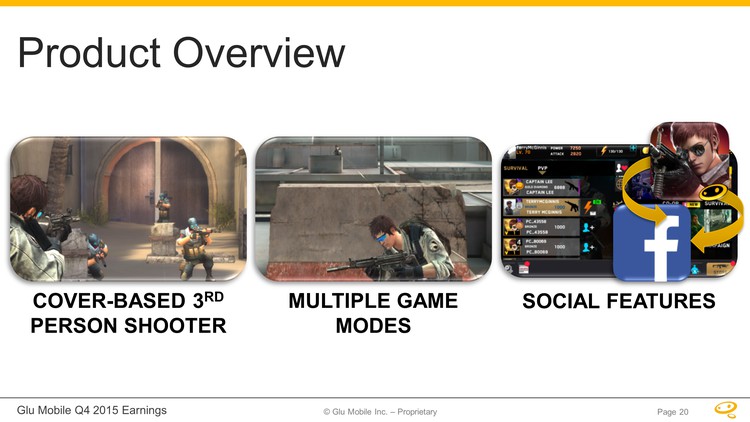
Glu Mobile Q4 2015 Earnings © Glu Mobile Inc. – Proprietary Product Overview COVER-BASED 3RD PERSON SHOOTER MULTIPLE GAME MODES SOCIAL FEATURES Page 20
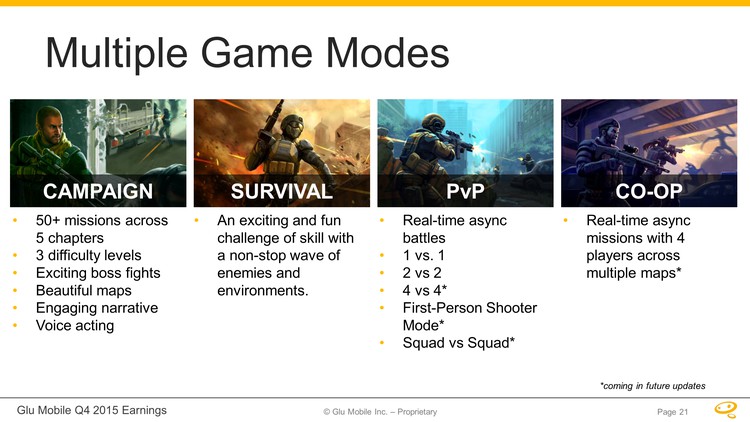
Glu Mobile Q4 2015 Earnings © Glu Mobile Inc. – Proprietary Multiple Game Modes . 50+ missions across 5 chapters . 3 difficulty levels . Exciting boss fights . Beautiful maps. Engaging narrative . Voice acting . An exciting and fun challenge of skill with a non-stop wave of enemies and environments. . Real-time async battles . 1 vs. 1 . 2 vs 2 . 4 vs 4*. First-Person Shooter Mode* . Squad vs Squad* . Real-time async missions with 4 players across multiple maps* *coming in future updates Page 21

QuizUP Investment + Option to Buy 100%
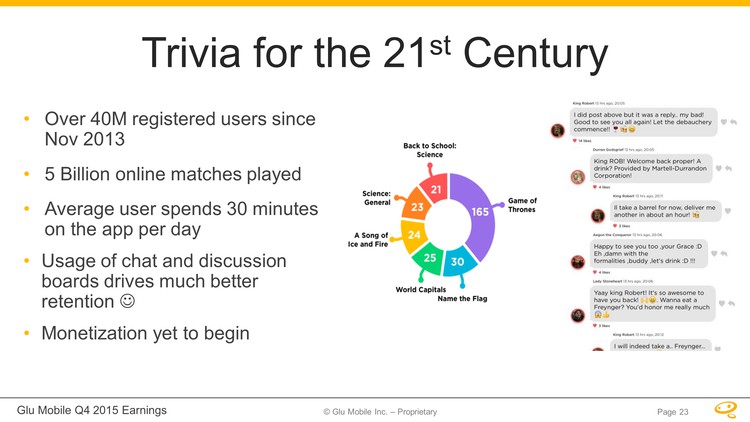
Glu Mobile Q4 2015 Earnings © Glu Mobile Inc. – Proprietary Trivia for the 21st Century . Over 40M registered users since Nov 2013 . 5 Billion online matches played . Average user spends 30 minutes on the app per day . Usage of chat and discussion boards drives much better retention . Monetization yet to begin Page 23
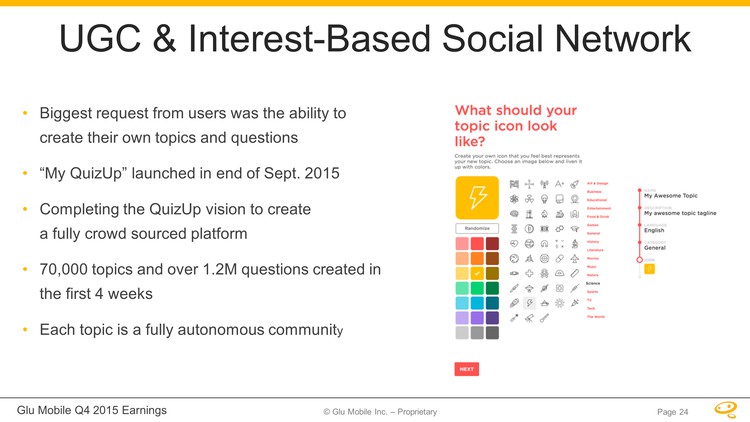
Glu Mobile Q4 2015 Earnings © Glu Mobile Inc. – Proprietary UGC & Interest-Based Social Network . Biggest request from users was the ability to create their own topics and questions . “My QuizUp” launched in end of Sept. 2015 . Completing the QuizUp vision to create a fully crowd sourced platform . 70,000 topics and over 1.2M questions created in the first 4 weeks . Each topic is a fully autonomous community Page 24

Glu Mobile Q4 2015 Earnings © Glu Mobile Inc. – Proprietary Opportunity for Primetime TV Page 25

Glu Mobile Q4 2015 Earnings © Glu Mobile Inc. – Proprietary Dairy Free Games Page 26

Glu Mobile Q4 2015 Earnings © Glu Mobile Inc. – Proprietary Investment & Publishing Partnership •Glu led the Series A Financing for Dairy Free Games, acquiring a minority stake in the company •Dairy Free is based in San Francisco, with development efforts taking place in Eastern Europe •The parties also entered into a commercial agreement pursuant to which Glu provided funding for a Dairy Free game under development, and received the exclusive right to publish the game and any sequels Page 27
Glu Mobile Q4 2015 Earnings © Glu Mobile Inc. – Proprietary User Engagement Page 28
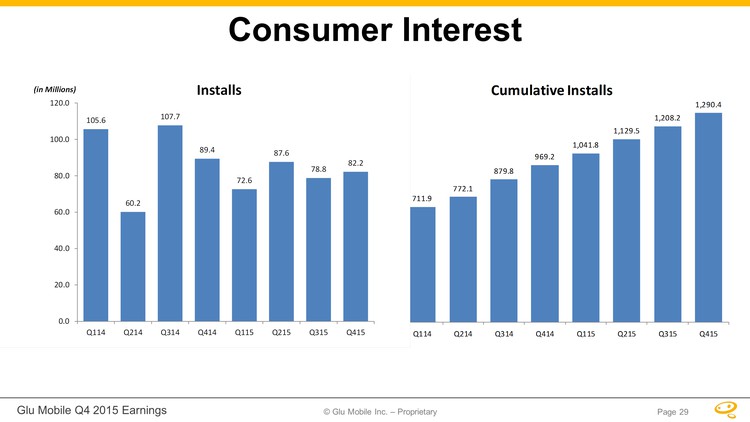
Glu Mobile Q4 2015 Earnings © Glu Mobile Inc. – Proprietary Consumer Interest 711.9772.1879.8969.21,041.81,129.5 1,208.21,290.40.0200.0400.0600.0800.0 1,000. 01, 200.01, 400.0Q11 4Q21 4Q314Q414Q115Q215Q315Q415(in Millions) Cumulative Installs105.660.2107.789.472.687.678.882.20.020. 040.060.080.0100.0120 .0Q11 4Q214Q31 4Q414Q115Q215Q3 15Q415(in Millions)In stalls Page 29
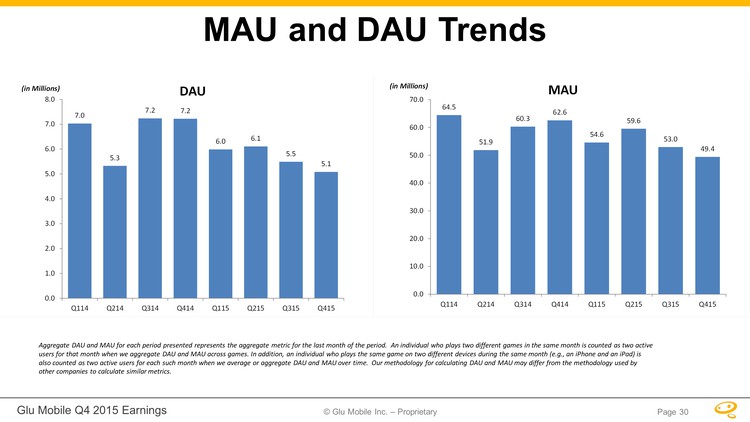
Glu Mobile Q4 2015 Earnings © Glu Mobile Inc. – Proprietary MAU and DAU Trends Aggregate DAU and MAU for each period presented represents the aggregate metric for the last month of the period. An individual who plays two different games in the same month is counted as two active users for that month when we aggregate DAU and MAU across games. In addition, an individual who plays the same game on two different devices during the same month (e.g., an iPhone and an iPad) is also counted as two active users for each such month when we average or aggregate DAU and MAU over time. Our methodology for calculating DAU and MAU may differ from the methodology used by other companies to calculate similar metrics. 7.05.37.27.26.06.15.55.10.01.02.03.04.05.0 6.07.08.0 Q11 4Q214 Q314Q414Q115Q215Q315Q415(in Milli ons)DAU6 4.551.960.362.654.659.653.0 49.40.01 0. 020.03 0.040 .050.060.070.0Q114 Q214Q314Q414 Q115Q215Q315Q415(in Millions)MAU Page 30
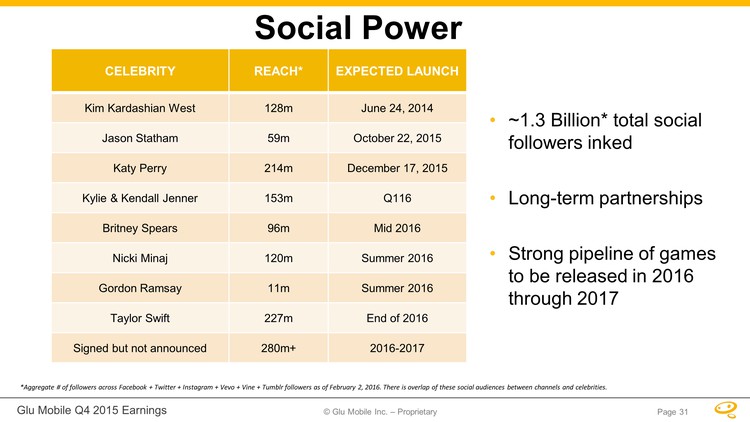
Glu Mobile Q4 2015 Earnings © Glu Mobile Inc. – Proprietary Social Power •~1.3 Billion* total social followers inked •Long-term partnerships •Strong pipeline of games to be released in 2016 through 2017 Page 31
Financial Overview Page 32
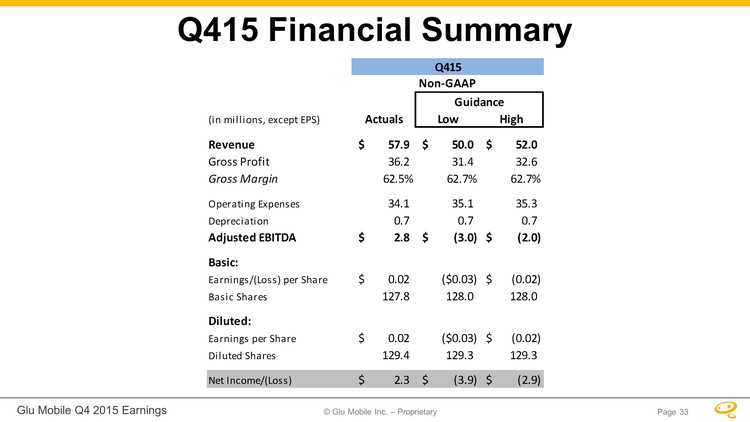
Glu Mobile Q4 2015 Earnings © Glu Mobile Inc. – Proprietary Page 33 Q415 Financial Summary Q415Non-GAAPGuidance(in millions, except EPS)ActualsLowHighRevenue57.9$ 50.0$ 52.0$ Gross Profit36.2 31.4 32.6 Gross Margin62.5%62.7%62.7%Operating Expenses34.1 35.1 35.3 Depreciation0.7 0.7 0.7 Adjusted EBITDA2.8$ (3.0)$ (2.0)$ Basic:Earnings/(Loss) per Share0.02$ ($0.03)(0.02)$ Basic Shares127.8 128.0 128.0 Diluted:Earnings per Share0.02$ ($0.03)(0.02)$ Diluted Shares129.4 129.3 129.3 Net Income/(Loss)2.3$ (3.9)$ (2.9)$
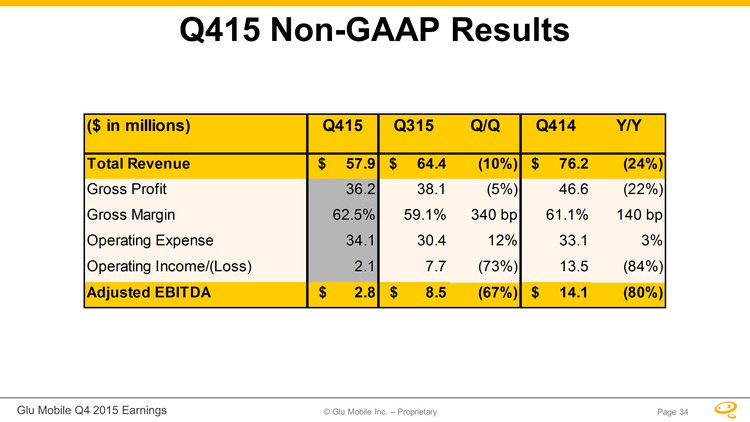
Glu Mobile Q4 2015 Earnings © Glu Mobile Inc. – Proprietary Page 34 Q415 Non-GAAP Results ($ in millions) Q415Q315Q/Q Q414Y/Y Total Revenue $ 57.9 $ 64.4 (10%) $ 76.2 (24%)Gross Profit36.238.1(5%)46.6(22%)Gross Margin62.5%59.1%340 bp61.1%140 bpOperating Expense 34.130.412%33.13%Operating Income/(Loss) 2.1 7.7 (73%) 13.5 (84%)Adjusted EBITDA $ 2.8 $ 8.5 (67%) $ 14.1 (80%)

Glu Mobile Q4 2015 Earnings © Glu Mobile Inc. – Proprietary Page 35 Non-GAAP Revenue and Adjusted EBITDA Non-GAAP revenue has been restated to reflect gross accounting for digital storefronts Q113 and prospectively, as outlined in the Company’s 8/6/2013 Form 8-K and press release. $24.7$23.2$22.6$42.8$47.0$35.0$83.6$76.2$62.4$57.5$64.4$57.9 $- $10.0 $20.0 $30.0 $40.0 $50.0 $60.0 $70.0 $80.0 $90.0Q113Q213Q313Q413Q114Q214Q314Q414Q115Q215Q315Q415Non-GAAP Revenue(In millions)($1.4)($2.9)($4.1)$6.2 $6.5 ($0.9)$15.4 $14.1 $3.9 $1.7 $8.5 $2.8 $(10.0) $(5.0) $- $5.0 $10.0 $15.0 $20.0Q113Q213Q313Q413Q114Q214Q314Q414Q115Q215Q315Q415Adjusted EBITDA(In millions)
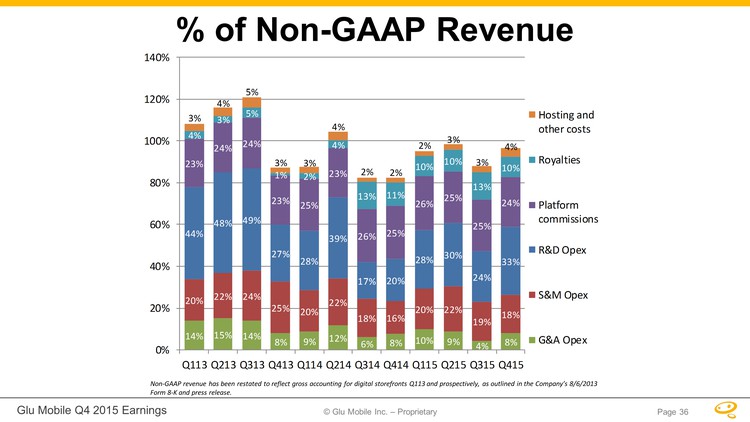
Glu Mobile Q4 2015 Earnings © Glu Mobile Inc. – Proprietary Page 36 % of Non-GAAP Revenue Non-GAAP revenue has been restated to reflect gross accounting for digital storefronts Q113 and prospectively, as outlined in the Company’s 8/6/2013 Form 8-K and press release. 3% 4% 5% 3% 3% 4% 2% 2% 2% 3% 3% 4% 0% 20 %4 0% 60 %8 0% 100 %1 20 % Q1 13Q 213 Q3 13Q 413 Q1 14Q 214 Q3 14Q414Q115Q215Q315Q415Hosting andother costsRoyaltiesPlatformcommissionsR&D OpexS&M OpexG&A Opex
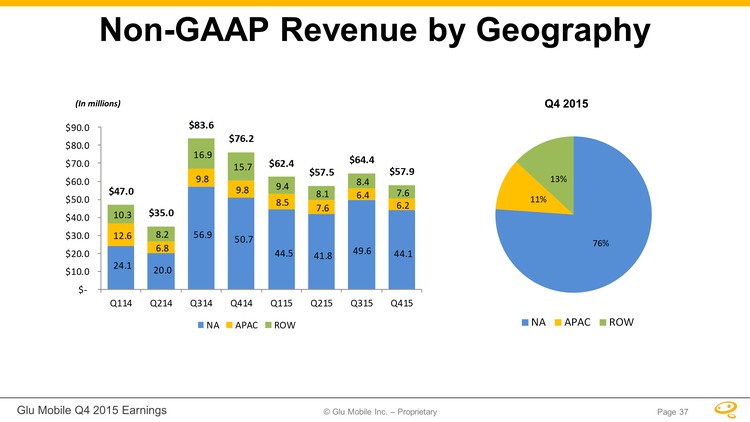
Glu Mobile Q4 2015 Earnings © Glu Mobile Inc. – Proprietary Page 37 Non-GAAP Revenue by Geography NAAPACROWQ4 2015 (In millions) 24.1 20.0 56.9 50.7 44.5 41.8 49.6 44.1 12.6 6.8 9.8 9.8 8.5 7.6 6.4 6.2 10.3 8.2 16.9 15.7 9.4 8.1 8.4 7.6 $47.0$35.0$83.6$76.2$62.4$57.5$64.4$57.9 $- $10.0 $20.0 $30.0 $40.0 $50.0 $60.0 $70.0 $80.0 $90.0 Q114 Q214 Q314 Q414 Q115 Q215 Q315 Q415 NAAP ACROW76%11%13%
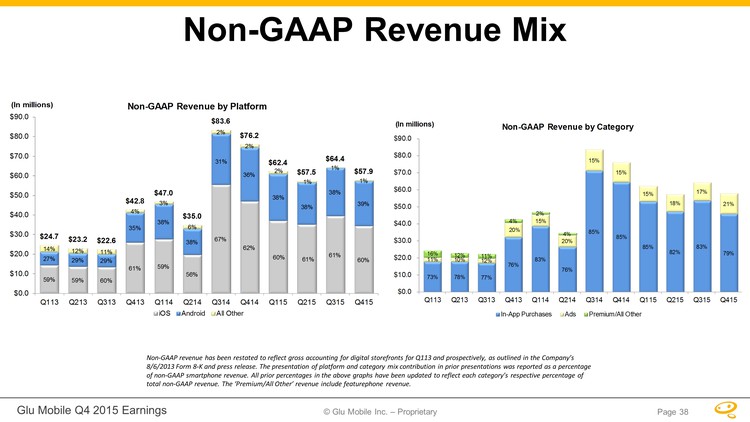
Glu Mobile Q4 2015 Earnings © Glu Mobile Inc. – Proprietary Page 38 Non-GAAP Revenue Mix Non-GAAP revenue has been restated to reflect gross accounting for digital storefronts for Q113 and prospectively, as outlined in the Company’s 8/6/2013 Form 8-K and press release. The presentation of platform and category mix contribution in prior presentations was reported as a percentage of non-GAAP smartphone revenue. All prior percentages in the above graphs have been updated to reflect each category’s respective percentage of total non-GAAP revenue. The ‘Premium/All Other’ revenue include featurephone revenue. 59% 59% 60% 61% 59% 56% 67% 62%60%61%61%60%27%29%29%35%38%38%31%36%38%38%38%39%14%12%11%4%3%6%2%2%2%1%1%1%$24.7 $23.2 $22.6 $42.8 $47.0 $35.0 $83.6 $76.2 $62.4 $57.5 $64.4 $57.9 $0.0 $10.0 $20.0 $30.0 $40.0 $50.0 $60.0 $70.0 $80.0 $90.0 Q113 Q213 Q313 Q413 Q114 Q214 Q314 Q414Q115Q215Q315Q415(In millions)Non-GAAP Revenue by PlatformiOSAndroidAll Other 73% 78% 77% 76% 83% 76% 85% 85% 85% 82% 83% 79% 11% 10% 12% 20% 15% 20% 15% 15% 15% 18% 17% 21% 16% 12% 11% 4% 2% 4% $0.0 $10.0$20.0$30.0$40.0$50.0$60.0$70.0$80.0$90.0Q113Q213Q313Q413Q114Q214Q314Q414Q115Q215Q315Q415(In millions)Non-GAAP Revenue by CategoryIn-App PurchasesAdsPremium/All Other
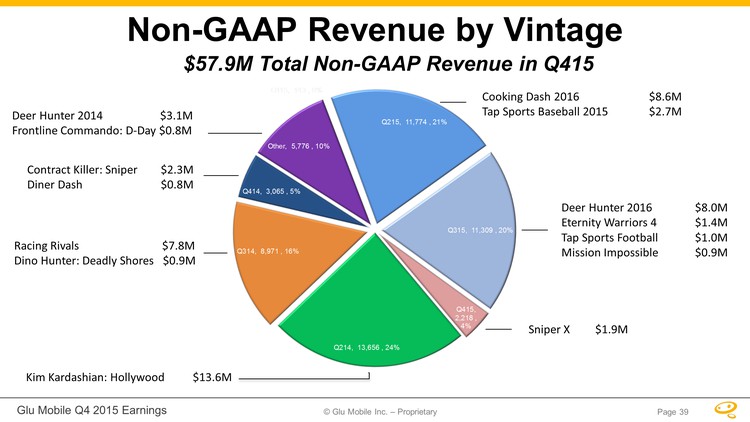
Glu Mobile Q4 2015 Earnings © Glu Mobile Inc. – Proprietary Non-GAAP Revenue by Vintage $57.9M Total Non-GAAP Revenue in Q415 Kim Kardashian: Hollywood $13.6M Racing Rivals $7.8M Dino Hunter: Deadly Shores $0.9M Contract Killer: Sniper $2.3M Diner Dash $0.8M Cooking Dash 2016 $8.6M Tap Sports Baseball 2015 $2.7M Deer Hunter 2016 $8.0M Eternity Warriors 4 $1.4M Tap Sports Football $1.0M Mission Impossible $0.9M Deer Hunter 2014 $3.1M Frontline Commando: D-Day $0.8M Sniper X $1.9M Page 39
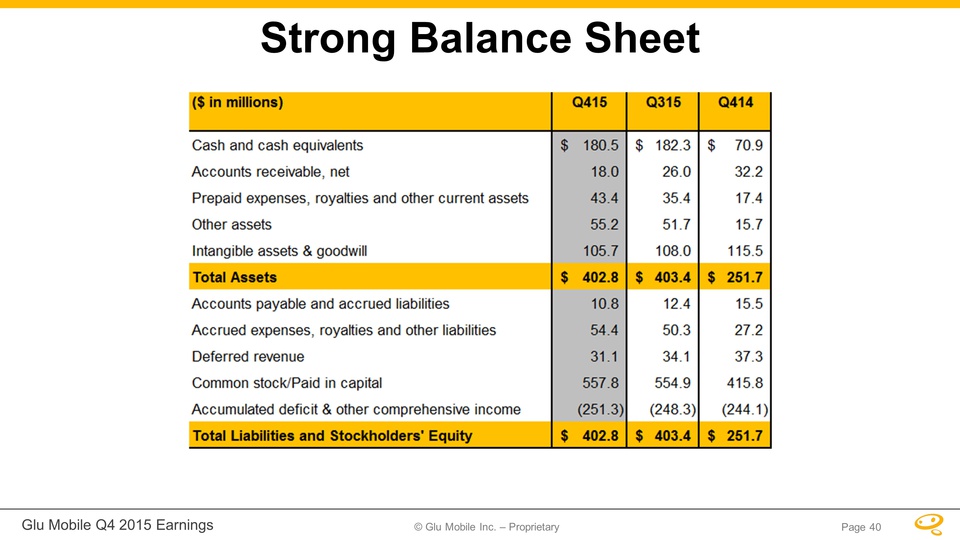
Glu Mobile Q4 2015 Earnings © Glu Mobile Inc. – Proprietary Page 40 Strong Balance Sheet ($ in millions)Q415Q315Q414Cash and cash equivalents180.5$ 182.3$ 70.9$ Accounts receivable, net18.0 26.0 32.2 Prepaid expenses, royalties and other current assets43.4 35.4 17.4 Other assets55.2 51.7 15.7 Intangible assets & goodwill105.7 108.0 115.5 Total Assets402.8$ 403.4$ 251.7$ Accounts payable and accrued liabilities10.8 12.4 15.5 Accrued expenses, royalties and other liabilities54.4 50.3 27.2 Deferred revenue31.1 34.1 37.3 Common stock/Paid in capital557.8 554.9 415.8 Accumulated deficit & other comprehensive income(251.3) (248.3) (244.1) Total Liabilities and Stockholders' Equity402.8$ 403.4$ 251.7$
© Glu Mobile Inc. – Proprietary Glu Mobile Q4 2015 Earnings Page 41 Guidance
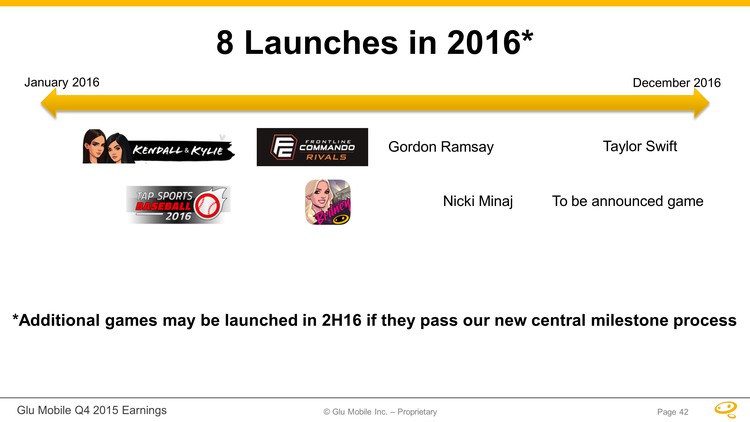
Glu Mobile Inc. – Proprietary Glu Mobile Q4 2015 Earnings 8 Launches in 2016* *Additional games may be launched in 2H16 if they pass our new central milestone process January 2016 December 2016 Gordon Ramsay Nicki Minaj Taylor Swift To be announced game Page 42
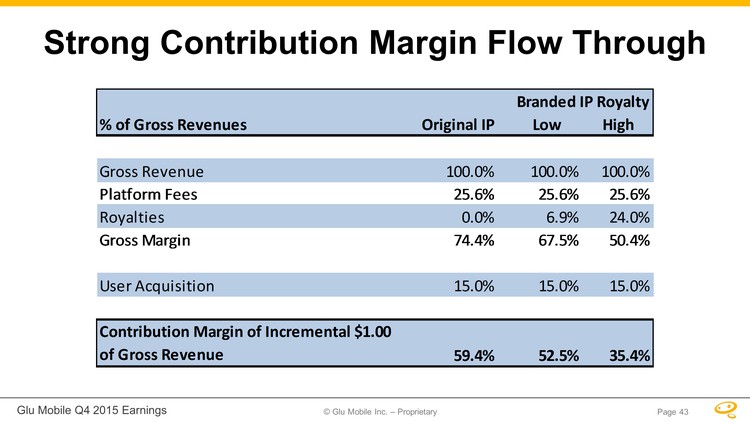
© Glu Mobile Inc. – Proprietary Glu Mobile Q4 2015 Earnings Strong Contribution Margin Flow Through % of Gross RevenuesOriginal IPLowHighGross Revenue100.0%100.0%100.0%Platform Fees25.6%25.6%25.6%Royalties0.0%6.9%24.0%Gross Margin74.4%67.5%50.4%User Acquisition15.0%15.0%15.0%Contribution Margin of Incremental $1.00 of Gross Revenue59.4%52.5%35.4%Branded IP Royalty Page 43
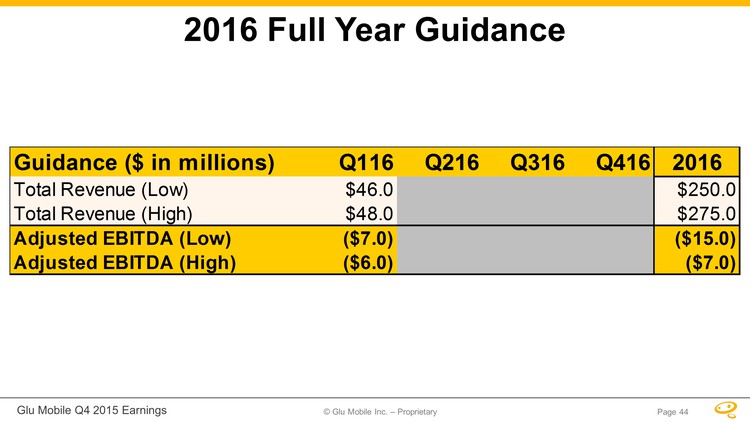
© Glu Mobile Inc. – Proprietary Glu Mobile Q4 2015 Earnings Page 44 2016 Full Year Guidance Guidance ($ in millions)Q116Q216Q316Q4162016Total Revenue (Low)$46.0 $250.0 Total Revenue (High)$48.0 $275.0 Adjusted EBITDA (Low)($7.0)($15.0)Adjusted EBITDA (High)($6.0)($7.0)
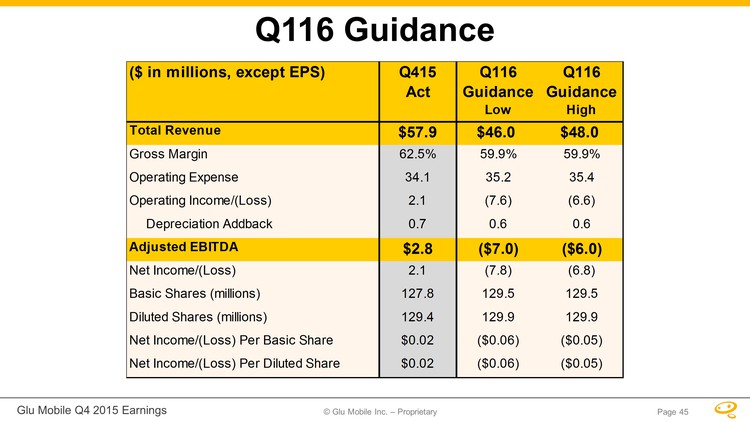
© Glu Mobile Inc. – Proprietary Glu Mobile Q4 2015 Earnings Page 45 Q116 Guidance ($ in millions, except EPS)Q415 ActQ116 GuidanceQ116 GuidanceLow HighTotal Revenue$57.9 $46.0$48.0Gross Margin 62.5%59.9%59.9%Operating Expense34.1 35.235.4Operating Income/(Loss) 2.1 (7.6)(6.6) Depreciation Addback 0.7 0.60.6Adjusted EBITDA$2.8 ($7.0)($6.0)Net Income/(Loss)2.1 (7.8)(6.8)Basic Shares (millions)127.8 129.5129.5Diluted Shares (millions)129.4 129.9129.9Net Income/(Loss) Per Basic Share $0.02 ($0.06)($0.05)Net Income/(Loss) Per Diluted Share $0.02 ($0.06)($0.05)
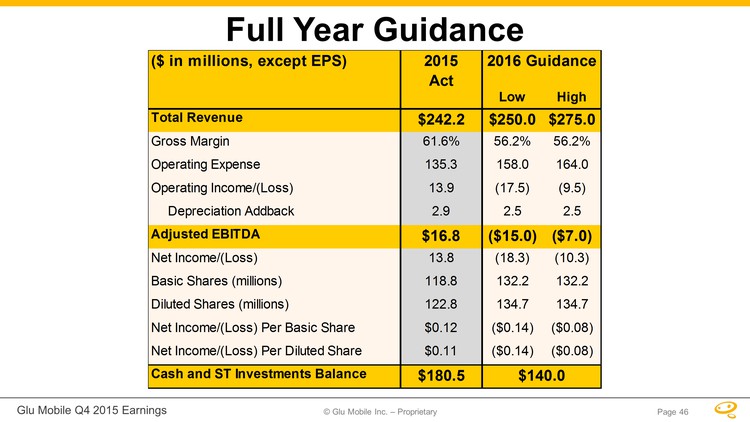
© Glu Mobile Inc. – Proprietary Glu Mobile Q4 2015 Earnings Page 46 Full Year Guidance ($ in millions, except EPS)2015ActLow HighTotal Revenue$242.2 $250.0 $275.0 Gross Margin 61.6%56.2%56.2% Operating Expense135.3 158.0164.0Operating Income/(Loss) 13.9 (17.5)(9.5) Depreciation Addback 2.9 2.52.5Adjusted EBITDA$16.8 ($15.0)($7.0)Net Income/(Loss)13.8 (18.3)(10.3) Basic Shares (millions) 118.8 132.2132.2Diluted Shares (millions)122.8 134.7134.7Net Income/(Loss) Per Basic Share $0.12 ($0.14)($0.08)Net Income/(Loss) Per Diluted Share $0.11 ($0.14)($0.08) Cash and ST Investments Balance$180.5 $140.0 2016 Guidance
© Glu Mobile Inc. – Proprietary Glu Mobile Q4 2015 Earnings Page 47 Long-Term Model
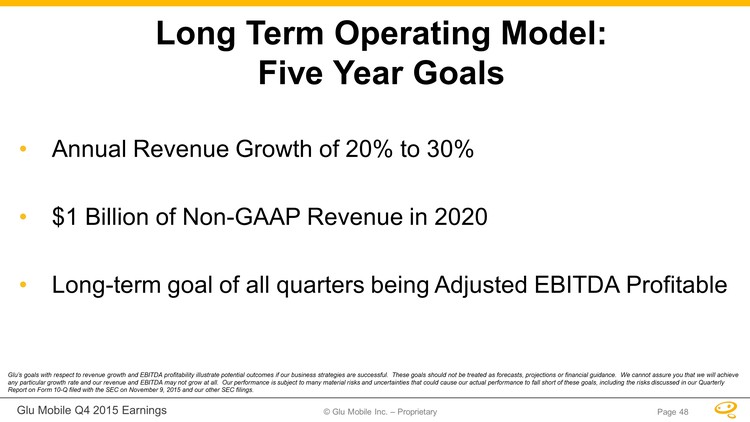
© Glu Mobile Inc. – Proprietary Glu Mobile Q4 2015 Earnings •Annual Revenue Growth of 20% to 30% •$1 Billion of Non-GAAP Revenue in 2020 •Long-term goal of all quarters being Adjusted EBITDA Profitable Long Term Operating Model: Five Year Goals Glu’s goals with respect to revenue growth and EBITDA profitability illustrate potential outcomes if our business strategies are successful. These goals should not be treated as forecasts, projections or financial guidance. We cannot assure you that we will achieve any particular growth rate and our revenue and EBITDA may not grow at all. Our performance is subject to many material risks and uncertainties that could cause our actual performance to fall short of these goals, including the risks discussed in our Quarterly Report on Form 10-Q filed with the SEC on November 9, 2015 and our other SEC filings. Page 48
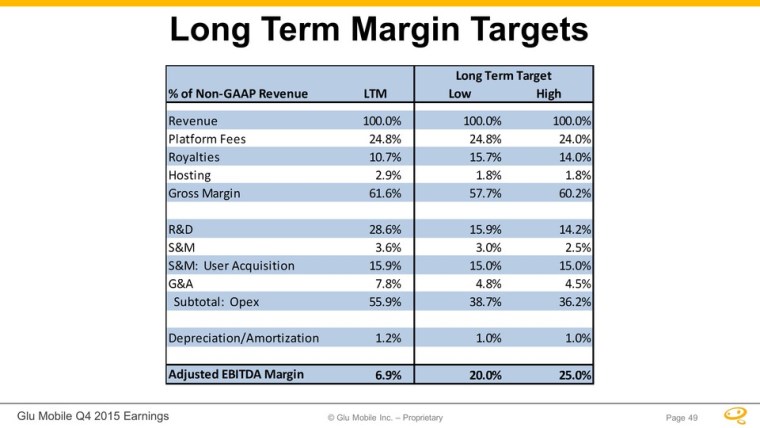
© Glu Mobile Inc. – Proprietary Glu Mobile Q4 2015 Earnings Long Term Margin Targets % of Non-GAAP RevenueLTMLowHighRevenue100.0%100.0%100.0%Platform Fees24.8%24.8%24.0% Royalties 10.7%15.7% 14.0%Hosting2.9%1.8%1.8%Gross Margin61.6%57.7%60.2%R&D28.6%15.9%14.2%S&M6.9%3.0%2.5%S&M: User Acquisition 15.9%15.0%15.0% G&A7.8%4.8%4.5% Subtotal: Opex 59.2%38.7%36.2% Depreciation/Amortization1.2%1.0%1.0%Adjusted EBITDA Margin3.6%20.0%25.0%Long Term Target Page 49
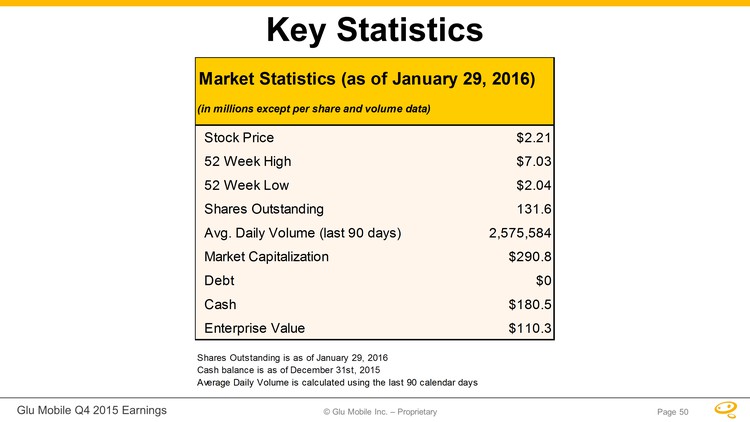
© Glu Mobile Inc. – Proprietary Glu Mobile Q4 2015 Earnings Page 50 Key Statistics Stock Price$2.21 52 Week High$7.03 52 Week Low$2.04 Shares Outstanding 131.6 Avg. Daily Volume (last 90 days)2,575,584 Market Capitalization$290.8 Debt$0 Cash$180.5 Enterprise Value$110.3 Shares Outstanding is as of January 29, 2016Cash balance is as of December 31st, 2015Average Daily Volume is calculated using the last 90 calendar daysMarket Statistics (as of January 29, 2016) (in millions except per share and volume data)Glu Mobile Q4 2015 Earnings
© Glu Mobile Inc. – Proprietary Page 51 Investment Highlights Diversified portfolio of franchises Cost-effective customer acquisition Long-tail social games provide significant visibility Added new studio and technology leadership Strong balance sheet with no debt
© Glu Mobile Inc. – Proprietary Glu Mobile Q4 2015 Earnings Page 52 Non-GAAP ReconciliationsGlu Mobile Q4 2015 Earnings
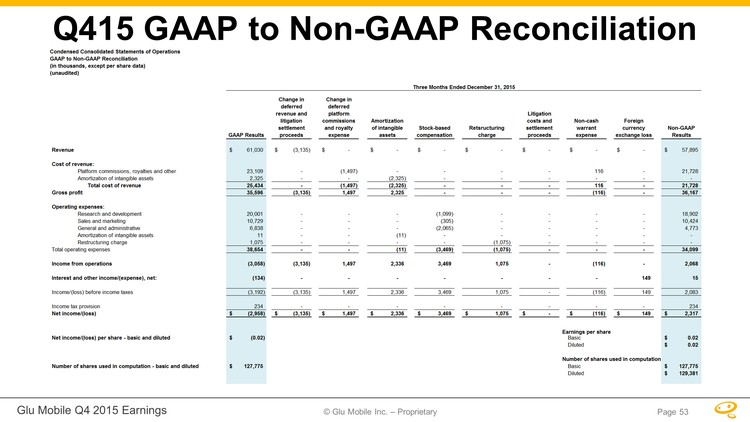
© Glu Mobile Inc. – Proprietary Page 53 Q415 GAAP to Non-GAAP ReconciliationGlu Mobile Q4 2015 Earnings
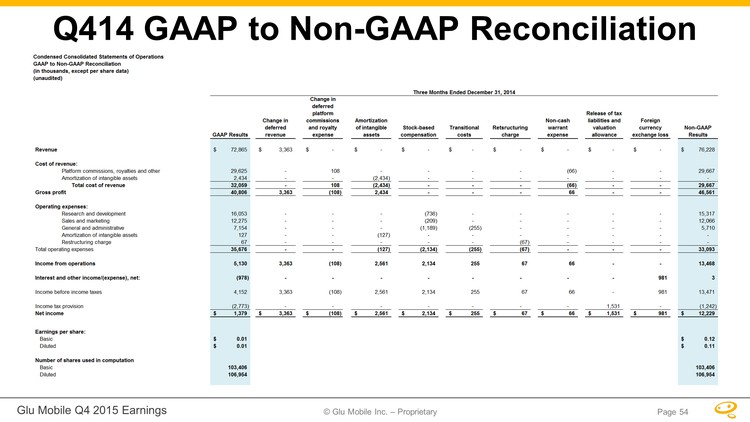
© Glu Mobile Inc. – Proprietary Page 54 Q414 GAAP to Non-GAAP ReconciliationGlu Mobile Q4 2015 Earnings
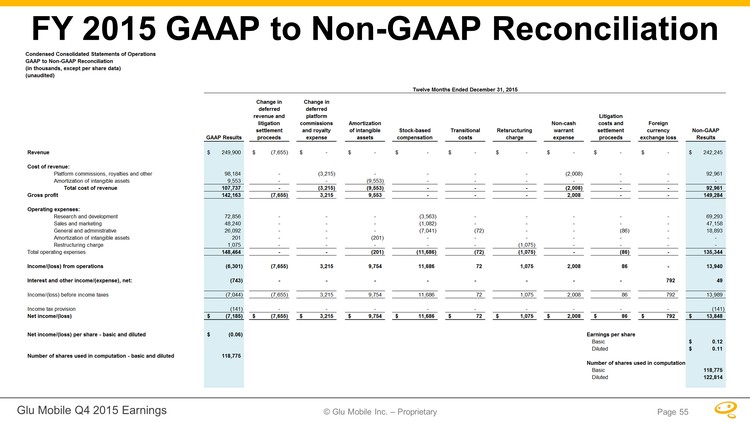
© Glu Mobile Inc. – Proprietary Page 55 FY 2015 GAAP to Non-GAAP ReconciliationGlu Mobile Q4 2015 Earnings
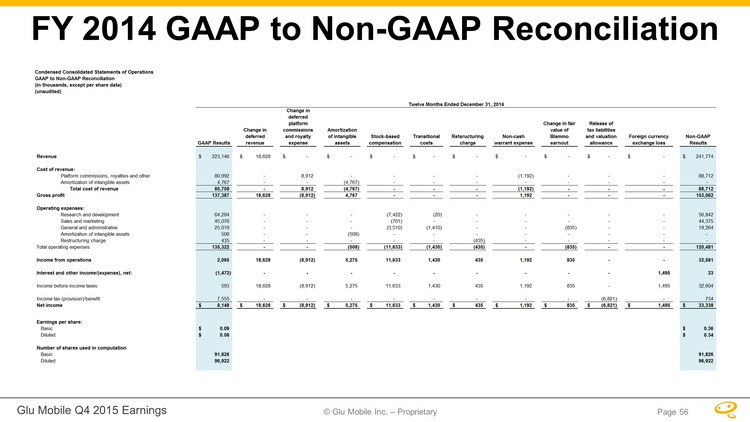
© Glu Mobile Inc. – Proprietary Page 56 FY 2014 GAAP to Non-GAAP ReconciliationGlu Mobile Q4 2015 Earnings
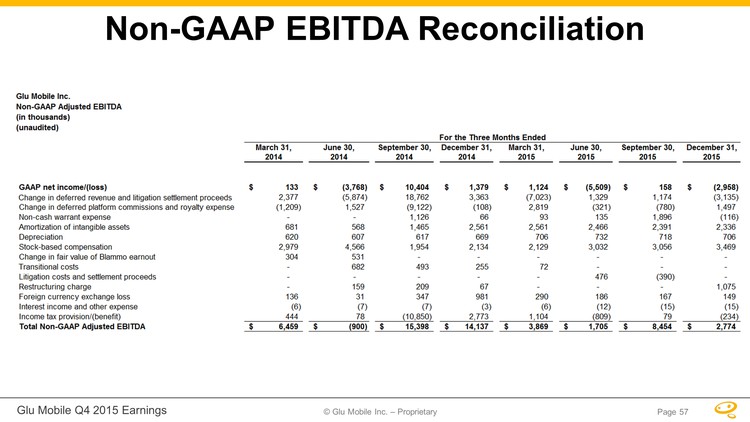
© Glu Mobile Inc. – Proprietary Page 57 Non-GAAP EBITDA Reconciliation
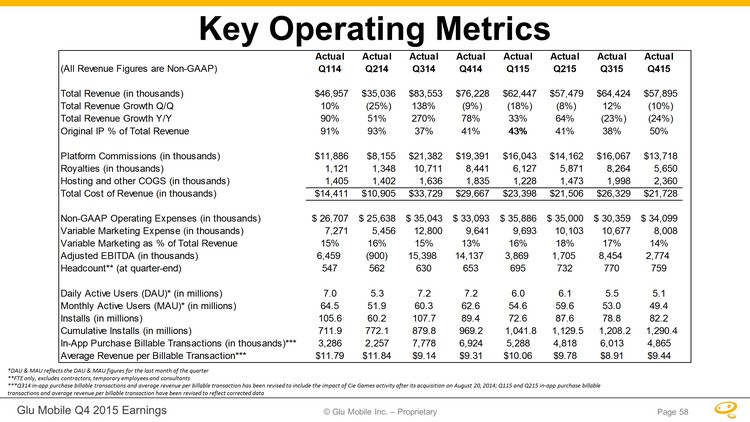
Glu Mobile Q4 2015 Earnings © Glu Mobile Inc. – Proprietary Key Operating Metrics Page 58