Attached files
| file | filename |
|---|---|
| 8-K - 8-K - Horsehead Holding Corp | d62839d8k.htm |
| EX-99.2 - EX-99.2 - Horsehead Holding Corp | d62839dex992.htm |
| EX-99.3 - EX-99.3 - Horsehead Holding Corp | d62839dex993.htm |
Exhibit 99.1
|
|
Exhibit 99.1
C O N F I D E N T I A L F E B R U A R Y 2 0 16
M A T E R I A L S F O R R E S T R I C T E D A D H O C S E C U R E D C R E D I T O R S
|
|
C O N F I D E N T I A L H OR S E H E A D H O L D I N G C O R P .
Disclaimer
Cautionary Note Regarding Forward-Looking Statements
Many of the statements included in this presentation constitute “forward-looking statements” intended to qualify for the safe harbor from liability established by the Private Securities Litigation Reform Act of 1995. In particular, they include statements relating to expected disbursements, projections and forecasts, future actions, future operating and financial performance, and the Company’s future financial results. These forward-looking statements are based on current expectations and projections about future events. Readers are cautioned that forward-looking statements are not guarantees of future operating and financial performance or results and involve substantial risks and uncertainties that cannot be predicted or quantified, and, consequently, the actual receipts, disbursements and performance of the Company may differ materially from those expressed or implied by such forward-looking statements. Such risks and uncertainties include, but are not limited to, factors described from time to time in the Company’s reports filed with the SEC (including the sections entitled “Risk Factors” and “Management’s Discussion and Analysis of Financial Condition and Results of Operations” contained therein).
|
|
H O R S E H E A D H O L D I N G C O R P .
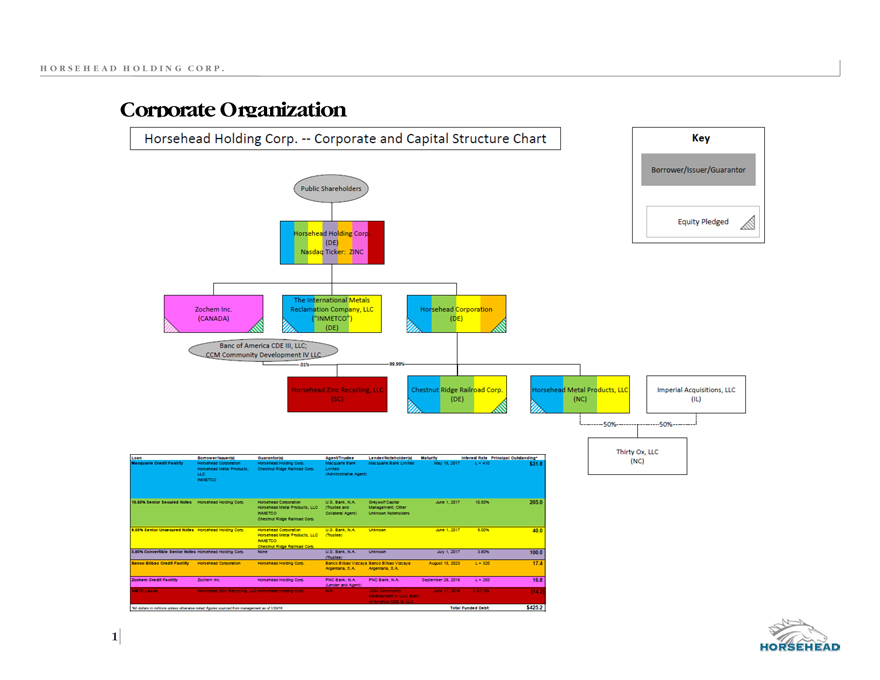
Corporate Organization
| 1 |
|
Horsehead Holding Corp. -- Corporate and Capital Structure Chart
|
|
H O R S E H E A D H O L D I N G C O R P .
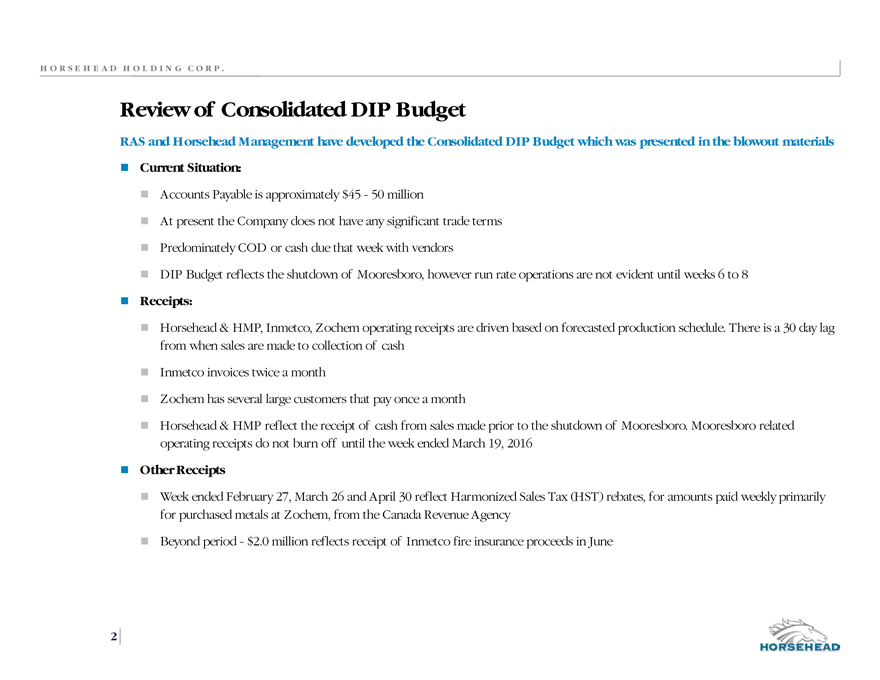
Review of Consolidated DIP Budget
RAS and Horsehead Management have developed the Consolidated DIP Budget which was presented in the blowout materials
Current Situation:
Accounts Payable is approximately $45—50 million
At present the Company does not have any significant trade terms
Predominately COD or cash due that week with vendors
DIP Budget reflects the shutdown of Mooresboro, however run rate operations are not evident until weeks 6 to 8
Receipts:
Horsehead & HMP, Inmetco, Zochem operating receipts are driven based on forecasted production schedule. There is a 30 day lag
from when sales are made to collection of cash
Inmetco invoices twice a month
Zochem has several large customers that pay once a month
Horsehead & HMP reflect the receipt of cash from sales made prior to the shutdown of Mooresboro. Mooresboro related
operating receipts do not burn off until the week ended March 19, 2016
Other Receipts
Week ended February 27, March 26 and April 30 reflect Harmonized Sales Tax (HST) rebates, for amounts paid weekly primarily
for purchased metals at Zochem, from the Canada Revenue Agency
Beyond period—$2.0 million reflects receipt of Inmetco fire insurance proceeds in June
| 2 |
|
|
|
H O R S E H E A D H O L D I N G C O R P .
Review of Consolidated DIP Budget (cont’d)
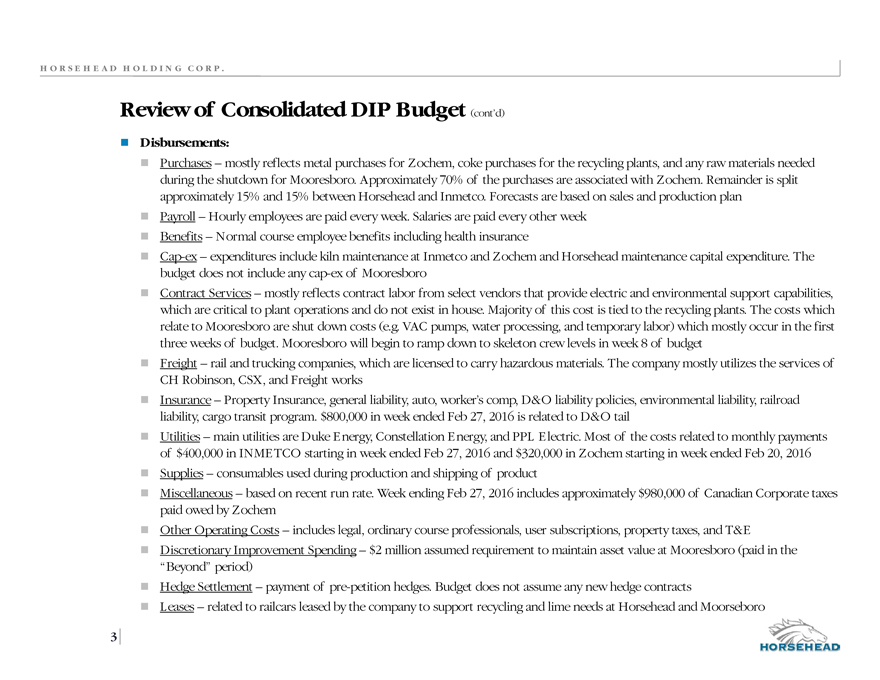
Disbursements:
Purchases – mostly reflects metal purchases for Zochem, coke purchases for the recycling plants, and any raw materials needed
during the shutdown for Mooresboro. Approximately 70% of the purchases are associated with Zochem. Remainder is split
approximately 15% and 15% between Horsehead and Inmetco. Forecasts are based on sales and production plan
Payroll – Hourly employees are paid every week. Salaries are paid every other week
Benefits – Normal course employee benefits including health insurance
Cap-ex – expenditures include kiln maintenance at Inmetco and Zochem and Horsehead maintenance capital expenditure. The
budget does not include any cap-ex of Mooresboro
Contract Services – mostly reflects contract labor from select vendors that provide electric and environmental support capabilities,
which are critical to plant operations and do not exist in house. Majority of this cost is tied to the recycling plants. The costs which
relate to Mooresboro are shut down costs (e.g. VAC pumps, water processing, and temporary labor) which mostly occur in the first
three weeks of budget. Mooresboro will begin to ramp down to skeleton crew levels in week 8 of budget
Freight – rail and trucking companies, which are licensed to carry hazardous materials. The company mostly utilizes the services of
CH Robinson, CSX, and Freight works
Insurance – Property Insurance, general liability, auto, worker’s comp, D&O liability policies, environmental liability, railroad
liability, cargo transit program. $800,000 in week ended Feb 27, 2016 is related to D&O tail
Utilities – main utilities are Duke Energy, Constellation Energy, and PPL Electric. Most of the costs related to monthly payments
of $400,000 in INMETCO starting in week ended Feb 27, 2016 and $320,000 in Zochem starting in week ended Feb 20, 2016
Supplies – consumables used during production and shipping of product
Miscellaneous – based on recent run rate. Week ending Feb 27, 2016 includes approximately $980,000 of Canadian Corporate taxes
paid owed by Zochem
Other Operating Costs – includes legal, ordinary course professionals, user subscriptions, property taxes, and T&E
Discretionary Improvement Spending – $2 million assumed requirement to maintain asset value at Mooresboro (paid in the
“Beyond” period)
Hedge Settlement – payment of pre-petition hedges. Budget does not assume any new hedge contracts
Leases – related to railcars leased by the company to support recycling and lime needs at Horsehead and Moorseboro
| 3 |
|
|
|
H O R S E H E A D H O L D I N G C O R P .
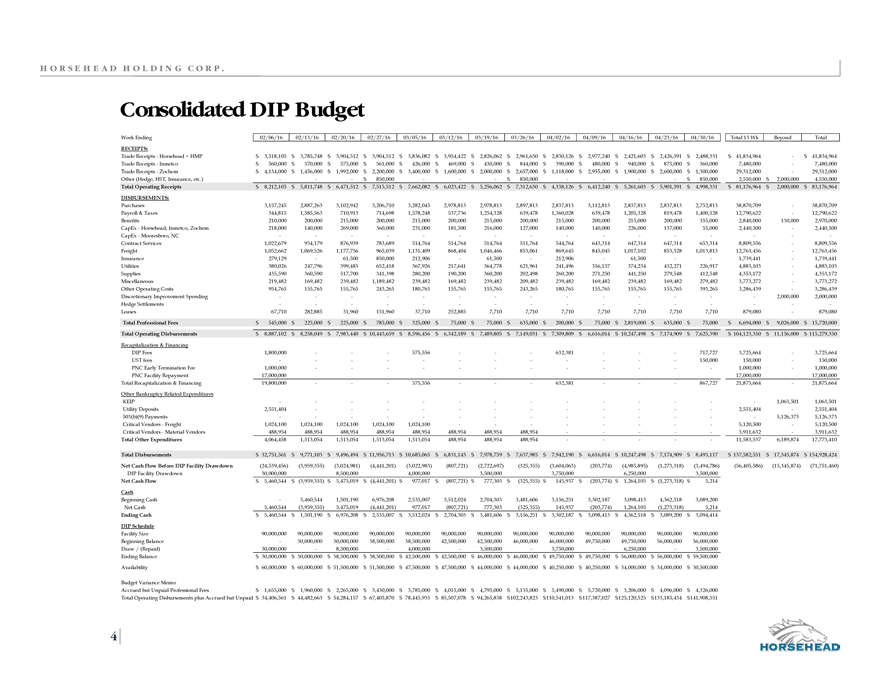
Consolidated DIP Budget
Week Ending 02/06/16 02/13/16 02/20/16 02/27/16 03/05/16 03/12/16 03/19/16 03/26/16 04/02/16 04/09/16 04/16/16 04/23/16 04/30/16 Total 13 Wk Beyond Total
RECEIPTS:
Trade Receipts—Horsehead + HMP $ 3,518,105 $ 3,785,748 $ 3,904,512 $ 3,904,512 $ 3,836,082 $ 3,954,422 $ 2,826,062 $ 2,961,630 $ 2,830,126 $ 2,977,240 $ 2,421,603 $ 2,426,591 $ 2,488,331 $ 41,834,964 —$ 41,834,964
Trade Receipts—Inmetco $ 560,000 $ 570,000 $ 575,000 $ 561,000 $ 426,000 $ 469,000 $ 430,000 $ 844,000 $ 390,000 $ 480,000 $ 940,000 $ 875,000 $ 360,000 7,480,000 — 7,480,000
Trade Receipts—Zochem $ 4,134,000 $ 1,456,000 $ 1,992,000 $ 2,200,000 $ 3,400,000 $ 1,600,000 $ 2,000,000 $ 2,657,000 $ 1,118,000 $ 2,955,000 $ 1,900,000 $ 2,600,000 $ 1,300,000 29,312,000 — 29,312,000
Other (Hedge, HST, Insurance, etc.) ———$ 850,000 ———$ 850,000 ————$ 850,000 2,550,000 $ 2,000,000 4,550,000
Total Operating Receipts $ 8,212,105 $ 5,811,748 $ 6,471,512 $ 7,515,512 $ 7,662,082 $ 6,023,422 $ 5,256,062 $ 7,312,630 $ 4,338,126 $ 6,412,240 $ 5,261,603 $ 5,901,591 $ 4,998,331 $ 81,176,964 $ 2,000,000 $ 83,176,964
DISBURSEMENTS:
Purchases 3,157,245 2,887,263 3,102,942 3,206,710 3,282,045 2,978,813 2,978,813 2,897,813 2,837,813 3,112,813 2,837,813 2,837,813 2,752,813 38,870,709 — 38,870,709
Payroll & Taxes 344,815 1,585,563 710,913 714,698 1,578,248 537,736 1,254,328 639,478 1,360,028 639,478 1,205,328 819,478 1,400,528 12,790,622 — 12,790,622
Benefits 210,000 200,000 215,000 200,000 215,000 200,000 215,000 200,000 215,000 200,000 215,000 200,000 355,000 2,840,000 130,000 2,970,000
CapEx—Horsehead, Inmetco, Zochem 218,000 140,000 269,000 360,000 231,000 181,500 216,000 127,000 140,000 140,000 226,000 137,000 55,000 2,440,500 — 2,440,500
CapEx—Mooresboro, NC ———————————— — — -
Contract Services 1,022,679 934,179 876,939 783,689 514,764 514,764 514,764 511,764 544,764 643,314 647,314 647,314 653,314 8,809,556 — 8,809,556
Freight 1,052,662 1,069,526 1,177,756 965,039 1,131,409 868,404 1,046,466 853,061 869,645 845,045 1,017,102 853,528 1,013,813 12,763,456 — 12,763,456
Insurance 279,129 — 61,500 850,000 212,906 — 61,500 — 212,906 — 61,500 ——1,739,441 — 1,739,441
Utilities 380,026 247,796 399,483 652,418 367,926 217,641 364,778 621,961 241,496 356,157 374,234 432,271 226,917 4,883,103 — 4,883,103
Supplies 435,590 360,590 517,700 341,398 280,200 190,200 360,200 202,498 260,200 271,250 441,250 279,548 412,548 4,353,172 — 4,353,172
Miscellaneous 219,482 169,482 239,482 1,189,482 239,482 169,482 239,482 209,482 239,482 169,482 239,482 169,482 279,482 3,773,272 — 3,773,272
Other Operating Costs 954,765 155,765 155,765 243,265 180,765 155,765 155,765 243,265 180,765 155,765 155,765 155,765 393,265 3,286,439 — 3,286,439
Discretionary Improvement Spending ———————————— — 2,000,000 2,000,000
Hedge Settlements ———————————— — — -
Leases 67,710 282,885 31,960 151,960 37,710 252,885 7,710 7,710 7,710 7,710 7,710 7,710 7,710 879,080 — 879,080
Total Professional Fees $ 545,000 $ 225,000 $ 225,000 $ 785,000 $ 325,000 $ 75,000 $ 75,000 $ 635,000 $ 200,000 $ 75,000 $ 2,819,000 $ 635,000 $ 75,000 $ 6,694,000 $ 9,026,000 $ 15,720,000
Total Operating Disbursements $ 8,887,102 $ 8,258,049 $ 7,983,440 $ 10,443,659 $ 8,596,456 $ 6,342,189 $ 7,489,805 $ 7,149,031 $ 7,309,809 $ 6,616,014 $ 10,247,498 $ 7,174,909 $ 7,625,390 $ 104,123,350 $ 11,156,000 $ 115,279,350
Recapitalization & Financing
DIP Fees 1,800,000 ——— 575,556 ——— 632,381 ——— 717,727 3,725,664 — 3,725,664
UST fees ———————————— 150,000 150,000 — 150,000
PNC Early Termination Fee 1,000,000 ————————————1,000,000 — 1,000,000
PNC Facility Repayment 17,000,000 17,000,000 17,000,000
Total Recapitalization & Financing 19,800,000 ——— 575,556 ——— 632,381 ——— 867,727 21,875,664 — 21,875,664
Other Bankruptcy Related Expenditures
KEIP ———————————— — 1,063,501 1,063,501
Utility Deposits 2,551,404 ————————————2,551,404 — 2,551,404
503(b)(9) Payments ———————————— — 5,126,373 5,126,373
Critical Vendors—Freight 1,024,100 1,024,100 1,024,100 1,024,100 1,024,100 ————————5,120,500 — 5,120,500
Critical Vendors—Material Vendors 488,954 488,954 488,954 488,954 488,954 488,954 488,954 488,954 —————3,911,632 — 3,911,632
Total Other Expenditures 4,064,458 1,513,054 1,513,054 1,513,054 1,513,054 488,954 488,954 488,954 —————11,583,537 6,189,874 17,773,410
Total Disbursements $ 32,751,561 $ 9,771,103 $ 9,496,494 $ 11,956,713 $ 10,685,065 $ 6,831,143 $ 7,978,759 $ 7,637,985 $ 7,942,190 $ 6,616,014 $ 10,247,498 $ 7,174,909 $ 8,493,117 $ 137,582,551 $ 17,345,874 $ 154,928,424
Net Cash Flow Before DIP Facility Drawdown (24,539,456) (3,959,355) (3,024,981) (4,441,201) (3,022,983) (807,721) (2,722,697) (325,355) (3,604,063) (203,774) (4,985,895) (1,273,318) (3,494,786) (56,405,586) (15,345,874) (71,751,460)
DIP Facility Drawdown 30,000,000 8,500,000 4,000,000 3,500,000 3,750,000 6,250,000 3,500,000
Net Cash Flow $ 5,460,544 $ (3,959,355) $ 5,475,019 $ (4,441,201) $ 977,017 $ (807,721) $ 777,303 $ (325,355) $ 145,937 $ (203,774) $ 1,264,105 $ (1,273,318) $ 5,214
Cash
Beginning Cash — 5,460,544 1,501,190 6,976,208 2,535,007 3,512,024 2,704,303 3,481,606 3,156,251 3,302,187 3,098,413 4,362,518 3,089,200
Net Cash 5,460,544 (3,959,355) 5,475,019 (4,441,201) 977,017 (807,721) 777,303 (325,355) 145,937 (203,774) 1,264,105 (1,273,318) 5,214
Ending Cash $ 5,460,544 $ 1,501,190 $ 6,976,208 $ 2,535,007 $ 3,512,024 $ 2,704,303 $ 3,481,606 $ 3,156,251 $ 3,302,187 $ 3,098,413 $ 4,362,518 $ 3,089,200 $ 3,094,414
DIP Schedule
Facility Size 90,000,000 90,000,000 90,000,000 90,000,000 90,000,000 90,000,000 90,000,000 90,000,000 90,000,000 90,000,000 90,000,000 90,000,000 90,000,000
Beginning Balance — 30,000,000 30,000,000 38,500,000 38,500,000 42,500,000 42,500,000 46,000,000 46,000,000 49,750,000 49,750,000 56,000,000 56,000,000
Draw / (Repaid) 30,000,000 — 8,500,000 — 4,000,000 — 3,500,000 — 3,750,000 — 6,250,000 — 3,500,000
Ending Balance $ 30,000,000 $ 30,000,000 $ 38,500,000 $ 38,500,000 $ 42,500,000 $ 42,500,000 $ 46,000,000 $ 46,000,000 $ 49,750,000 $ 49,750,000 $ 56,000,000 $ 56,000,000 $ 59,500,000
Availability $ 60,000,000 $ 60,000,000 $ 51,500,000 $ 51,500,000 $ 47,500,000 $ 47,500,000 $ 44,000,000 $ 44,000,000 $ 40,250,000 $ 40,250,000 $ 34,000,000 $ 34,000,000 $ 30,500,000
Budget Variance Memo:
Accrued but Unpaid Professional Fees $ 1,655,000 $ 1,960,000 $ 2,265,000 $ 3,430,000 $ 3,785,000 $ 4,015,000 $ 4,795,000 $ 5,135,000 $ 5,490,000 $ 5,720,000 $ 3,206,000 $ 4,096,000 $ 4,326,000
Total Operating Disbursements plus Accrued but Unpaid $ 34,406,561 $ 44,482,663 $ 54,284,157 $ 67,405,870 $ 78,445,935 $ 85,507,078 $ 94,265,838 $ 102,243,823 $ 110,541,013 $ 117,387,027 $ 125,120,525 $ 133,185,434 $ 141,908,551
| 4 |
|
|
|
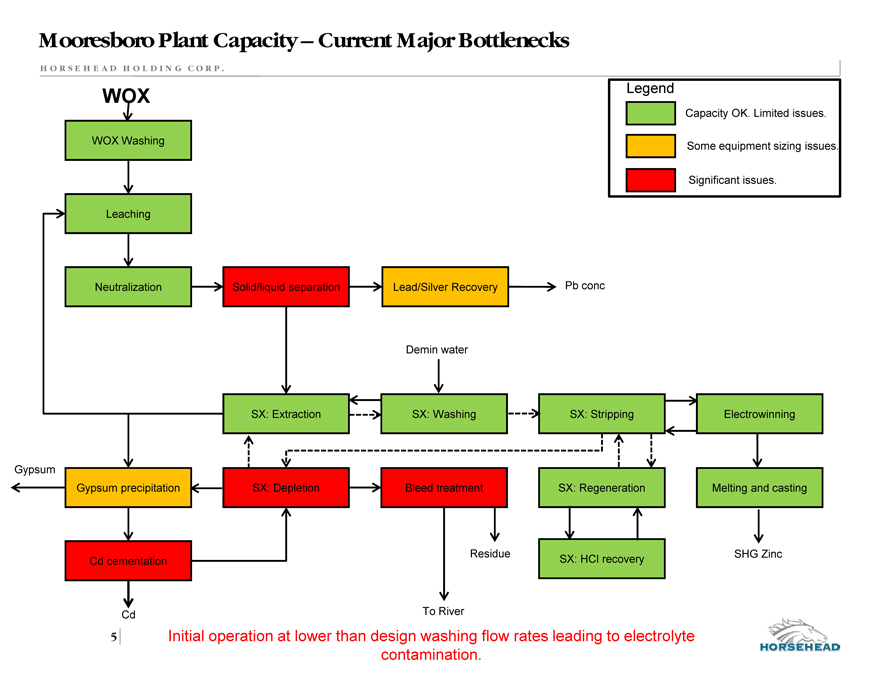
Mooresboro Plant Capacity – Current Major Bottlenecks
H OR S E H E A D H O L D I N G C O R P .
WOX Legend
Capacity OK. Limited issues.
WOX Washing Some equipment sizing issues.
Significant issues.
Leaching
Neutralization Solid/liquid separation Lead/Silver Recovery Pb conc
Demin water
SX: Extraction SX: Washing SX: Stripping Electrowinning
Gypsum
Gypsum precipitation SX: Depletion Bleed treatment SX: Regeneration Melting and casting
Cd cementation Residue SX: HCl recovery SHG Zinc
Cd To River
5 Initial operation at lower than design washing flow rates leading to electrolyte
contamination.
|
|
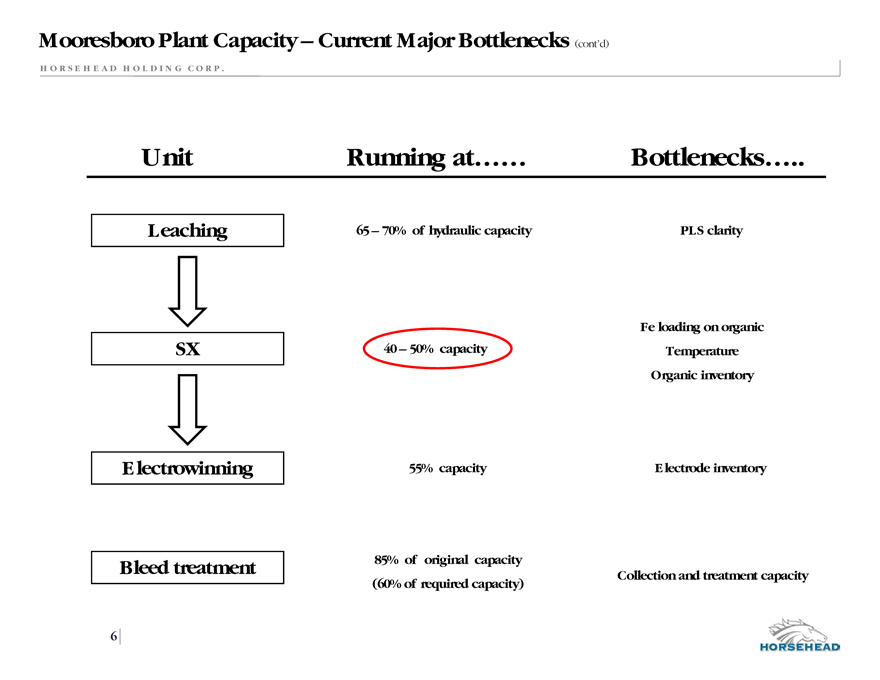
Mooresboro Plant Capacity – Current Major Bottlenecks (cont’d)
H OR S E H E A D H O L D I N G C O R P .
Unit Running at…… Bottlenecks…
Leaching 65 – 70% of hydraulic capacity PLS clarity
Fe loading on organic
SX 40 – 50% capacity Temperature
Organic inventory
Electrowinning 55% capacity Electrode inventory
Bleed treatment 85% of original capacity
(60% of required capacity) Collection and treatment capacity
| 6 |
|
|
|
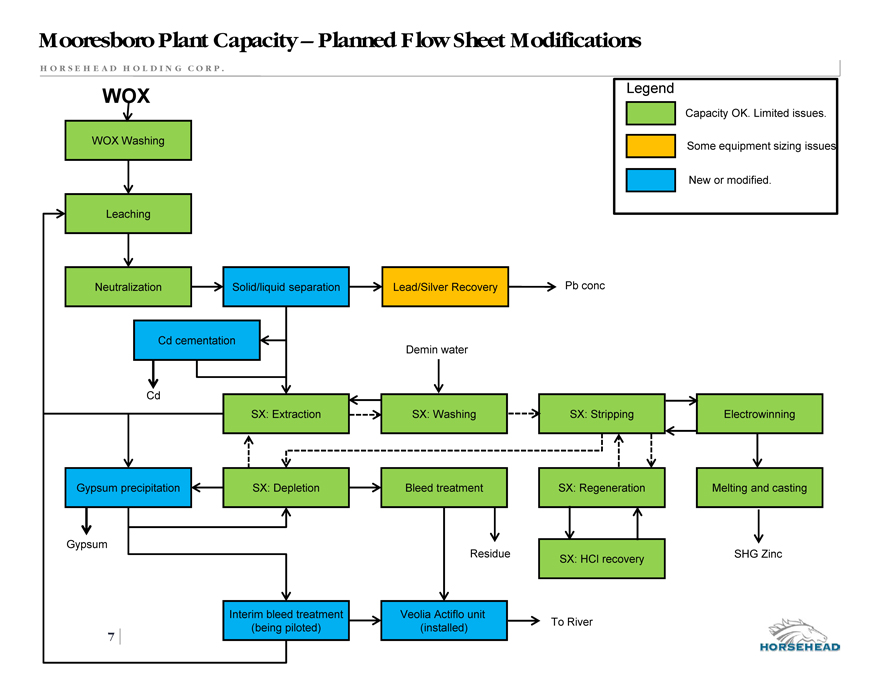
Mooresboro Plant Capacity – Planned Flow Sheet Modifications
H OR S E H E A D H O L D I N G C O R P .
WOX Legend
Capacity OK. Limited issues.
WOX Washing Some equipment sizing issues.
New or modified.
Leaching
Neutralization Solid/liquid separation Lead/Silver Recovery Pb conc
Cd cementation
Demin water
Cd
SX: Extraction SX: Washing SX: Stripping Electrowinning
Gypsum precipitation SX: Depletion Bleed treatment SX: Regeneration Melting and casting
Gypsum
Residue SX: HCl recovery SHG Zinc
Interim bleed treatment Veolia Actiflo unit
(being piloted) (installed) To River
7
|
|
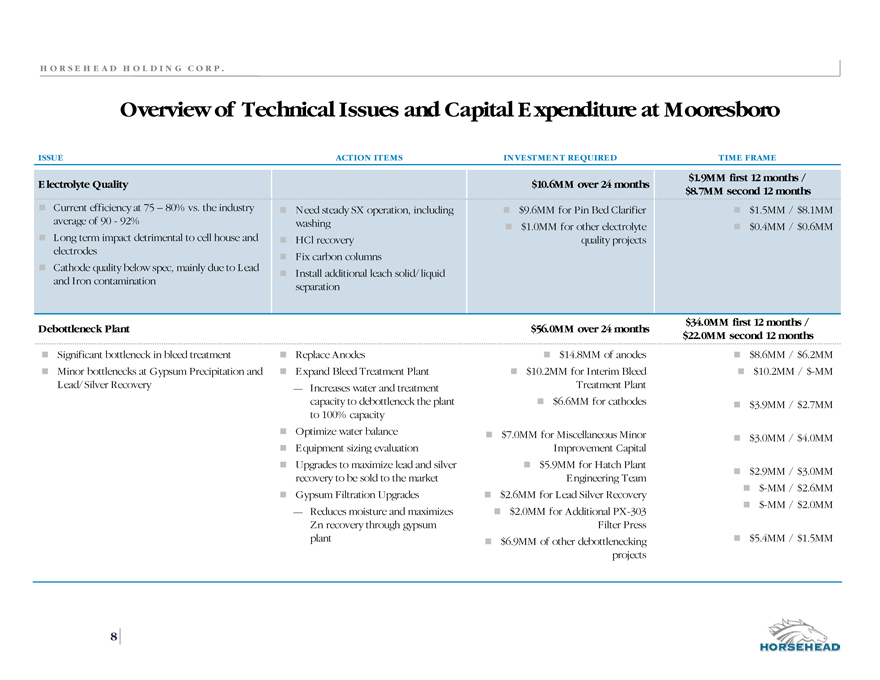
H O R S E H E A D H O L D I N G C O R P .
Overview of Technical Issues and Capital Expenditure at Mooresboro
ISSUE
Electrolyte Quality
Current efficiency at 75 – 80% vs. the industry average of 90—92% Long term impact detrimental to cell house and electrodes Cathode quality below spec, mainly due to Lead and Iron contamination
ACTION ITEMS
Need steady SX operation, including washing HCl recovery Fix carbon columns Install additional leach solid/liquid separation
INVESTMENT REQUIRED
$10.6MM over 24 months
$9.6MM for Pin Bed Clarifier $1.0MM for other electrolyte quality projects
TIME FRAME
$1.9MM first 12 months / $8.7MM second 12 months
$1.5MM / $8.1MM $0.4MM / $0.6MM
Debottleneck Plant
Significant bottleneck in bleed treatment Minor bottlenecks at Gypsum Precipitation and Lead/Silver Recovery
Replace Anodes
Expand Bleed Treatment Plant
- Increases water and treatment
capacity to debottleneck the plant
to 100% capacity
Optimize water balance
Equipment sizing evaluation
Upgrades to maximize lead and silver
recovery to be sold to the market
Gypsum Filtration Upgrades
- Reduces moisture and maximizes
Zn recovery through gypsum
plant
$56.0MM over 24 months
$14.8MM of anodes
$10.2MM for Interim Bleed
Treatment Plant
$6.6MM for cathodes
$7.0MM for Miscellaneous Minor
Improvement Capital
$5.9MM for Hatch Plant
Engineering Team
$2.6MM for Lead Silver Recovery
$2.0MM for Additional PX-303
Filter Press
$6.9MM of other debottlenecking
projects
$34.0MM first 12 months /
$22.0MM second 12 months
$8.6MM / $6.2MM
$10.2MM / $-MM
$3.9MM / $2.7MM
$3.0MM / $4.0MM
$2.9MM / $3.0MM
$-MM / $2.6MM
$-MM / $2.0MM
$5.4MM / $1.5MM
| 8 |
|
|
|
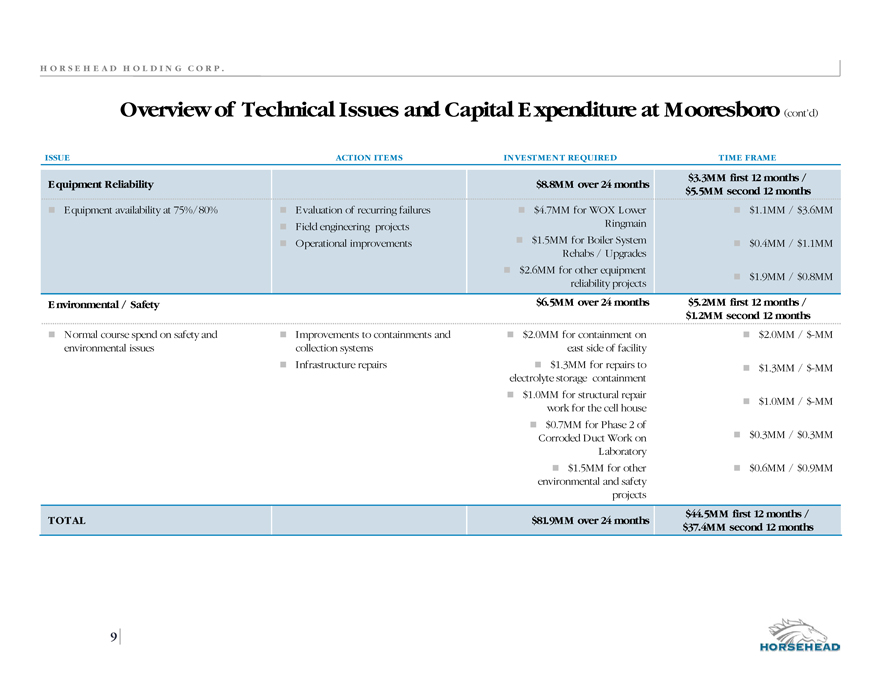
H OR S E H E A D H O L D I N G C O R P .
Overview of Technical Issues and Capital Expenditure at Mooresboro (cont’d)
ISSUE ACTION ITEMS INVESTMENT REQUIRED TIME FRAME
Equipment Reliability
Equipment availability at 75%/80%
Evaluation of recurring failures Field engineering projects Operational improvements
$8.8MM over 24 months
$4.7MM for WOX Lower
Ringmain
$1.5MM for Boiler System
Rehabs / Upgrades
$2.6MM for other equipment
reliability projects
$3.3MM first 12 months /
$5.5MM second 12 months
$1.1MM / $3.6MM
$0.4MM / $1.1MM
$1.9MM / $0.8MM
Environmental / Safety
Normal course spend on safety and environmental issues
Improvements to containments and collection systems Infrastructure repairs
$6.5MM over 24 months
$2.0MM for containment on
east side of facility
$1.3MM for repairs to
electrolyte storage containment
$1.0MM for structural repair
work for the cell house
$0.7MM for Phase 2 of
Corroded Duct Work on
Laboratory
$1.5MM for other
environmental and safety
projects
$5.2MM first 12 months /
$1.2MM second 12 months
$2.0MM / $-MM
$1.3MM / $-MM
$1.0MM / $-MM
$0.3MM / $0.3MM
$0.6MM / $0.9MM
TOTAL $81.9MM over 24 months $44.5MM first 12 months /
$37.4MM second 12 months
9
|
|
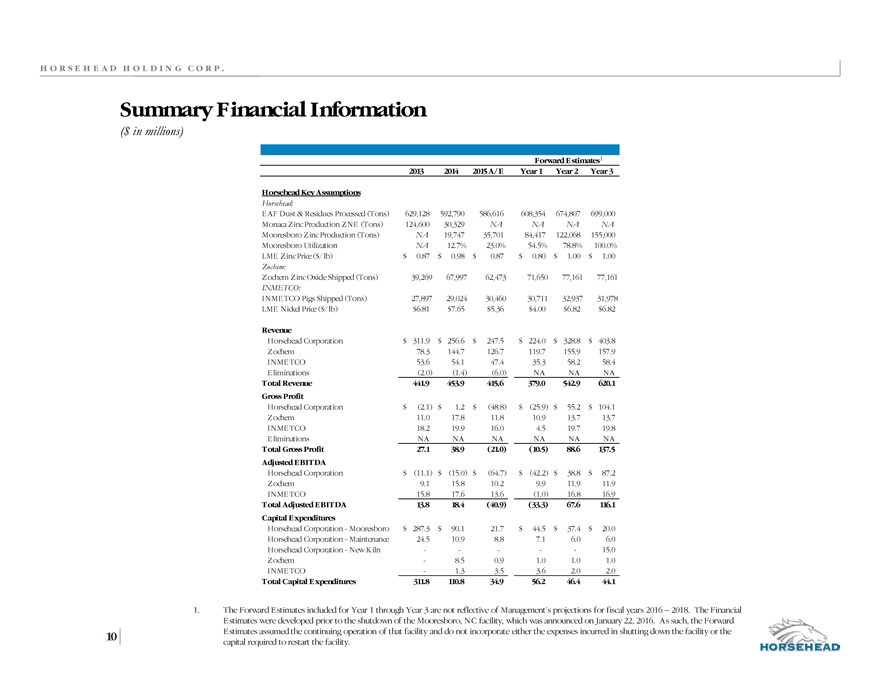
H O R S E H E A D H O L D I N G C O R P .
Summary Financial Information
($ in millions)
Forward Estimates1
2013 2014 2015 A/E Year 1 Year 2 Year 3
Horsehead Key Assumptions
Horsehead:
E AF Dust & Residues Processed (Tons) 629,128 592,790 586,616 608,354 674,807 699,000
Monaca Zinc Production ZNE (Tons) 124,600 30,329 NA NA NA NA
Mooresboro Zinc Production (Tons) NA 19,747 35,701 84,417 122,068 155,000
Mooresboro Utilization NA 12.7% 23.0% 54.5% 78.8% 100.0%
LME Zinc Price ($/ lb) $ 0.87 $ 0.98 $ 0.87 $ 0.80 $ 1.00 $ 1.00
Zochem:
Zochem Zinc Oxide Shipped (Tons) 39,269 67,997 62,473 71,650 77,161 77,161
INMETCO:
INME TCO Pigs Shipped (Tons) 27,897 29,024 30,460 30,711 32,937 31,978
LME Nickel Price ($/ lb) $6.81 $7.65 $5.36 $4.00 $6.82 $6.82
Revenue
Horsehead Corporation $ 311.9 $ 256.6 $ 247.5 $ 224.0 $ 328.8 $ 403.8
Zochem 78.3 144.7 126.7 119.7 155.9 157.9
INME TCO 53.6 54.1 47.4 35.3 58.2 58.4
E liminations (2.0) (1.4) (6.0) NA NA NA
Total Revenue 441.9 453.9 415.6 379.0 542.9 620.1
Gross Profit
Horsehead Corporation $ (2.1) $ 1.2 $ (48.8) $ (25.9) $ 55.2 $ 104.1
Zochem 11.0 17.8 11.8 10.9 13.7 13.7
INME TCO 18.2 19.9 16.0 4.5 19.7 19.8
E liminations NA NA NA NA NA NA
Total Gross Profit 27.1 38.9 (21.0) (10.5) 88.6 137.5
Adjusted EBITDA
Horsehead Corporation $ (11.1) $ (15.0) $ (64.7) $ (42.2) $ 38.8 $ 87.2
Zochem 9.1 15.8 10.2 9.9 11.9 11.9
INME TCO 15.8 17.6 13.6 (1.0) 16.8 16.9
Total Adjusted EBITDA 13.8 18.4 (40.9) (33.3) 67.6 116.1
Capital Expenditures
Horsehead Corporation—Mooresboro $ 287.3 $ 90.1 21.7 $ 44.5 $ 37.4 $ 20.0
Horsehead Corporation—Maintenance 24.5 10.9 8.8 7.1 6.0 6.0
Horsehead Corporation—New Kiln—————15.0
Zochem— 8.5 0.9 1.0 1.0 1.0
INME TCO— 1.3 3.5 3.6 2.0 2.0
Total Capital Expenditures 311.8 110.8 34.9 56.2 46.4 44.1
1. The Forward Estimates included for Year 1 through Year 3 are not reflective of Management’s projections for fiscal years 2016 – 2018. The Financial
Estimates were developed prior to the shutdown of the Mooresboro, NC facility, which was announced on January 22, 2016. As such, the Forward
10 Estimates assumed the continuing operation of that facility and do not incorporate either the expenses incurred in shutting down the facility or the
capital required to restart the facility.
|
|
H OR S E H E A D H O L D I N G C O R P .
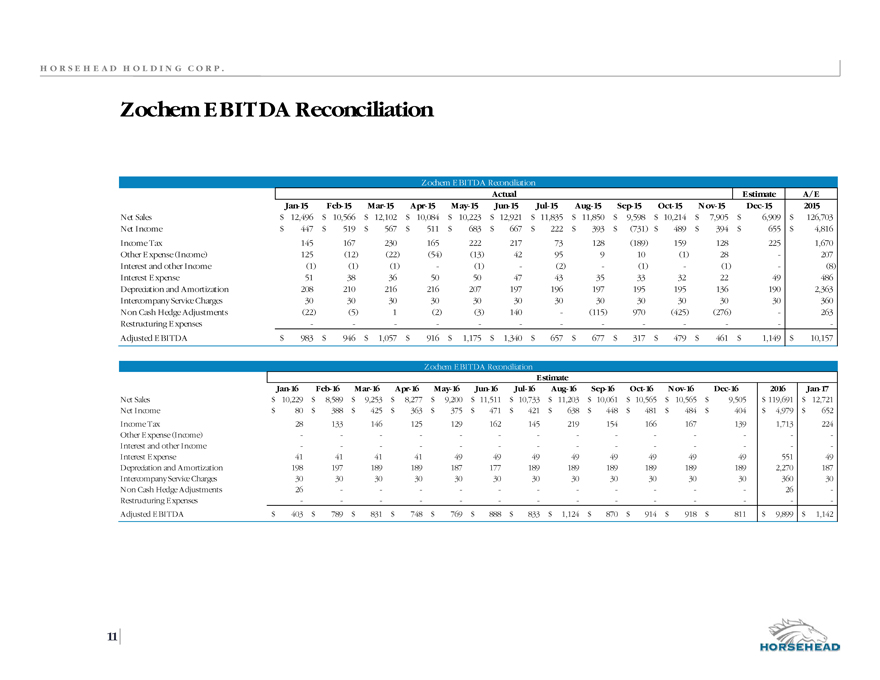
Zochem EBITDA Reconciliation
Zochem E BITDA Reconciliation
Actual Estimate A/E
Jan-15 Feb-15 Mar-15 Apr-15 May-15 Jun-15 Jul-15 Aug-15 Sep-15 Oct-15 Nov-15 Dec-15 2015
Net Sales $ 12,496 $ 10,566 $ 12,102 $ 10,084 $ 10,223 $ 12,921 $ 11,835 $ 11,850 $ 9,598 $ 10,214 $ 7,905 $ 6,909 $ 126,703
Net Income $ 447 $ 519 $ 567 $ 511 $ 683 $ 667 $ 222 $ 393 $ (731) $ 489 $ 394 $ 655 $ 4,816
Income Tax 145 167 230 165 222 217 73 128 (189) 159 128 225 1,670
Other E xpense (Income) 125 (12) (22) (54) (13) 42 95 9 10 (1) 28 — 207
Interest and other Income (1) (1) (1) — (1) — (2) — (1)— (1) — (8)
Interest E xpense 51 38 36 50 50 47 43 35 33 32 22 49 486
Depreciation and Amortization 208 210 216 216 207 197 196 197 195 195 136 190 2,363
Intercompany Service Charges 30 30 30 30 30 30 30 30 30 30 30 30 360
Non Cash Hedge Adjustments (22) (5) 1 (2) (3) 140 — (115) 970 (425) (276) — 263
Restructuring E xpenses ——— — — ——— — — — -
Adjusted E BITDA $ 983 $ 946 $ 1,057 $ 916 $ 1,175 $ 1,340 $ 657 $ 677 $ 317 $ 479 $ 461 $ 1,149 $ 10,157
Zochem E BITDA Reconciliation
Estimate
Jan-16 Feb-16 Mar-16 Apr-16 May-16 Jun-16 Jul-16 Aug-16 Sep-16 Oct-16 Nov-16 Dec-16 2016 Jan-17
Net Sales $ 10,229 $ 8,589 $ 9,253 $ 8,277 $ 9,200 $ 11,511 $ 10,733 $ 11,203 $ 10,061 $ 10,565 $ 10,565 $ 9,505 $ 119,691 $ 12,721
Net Income $ 80 $ 388 $ 425 $ 363 $ 375 $ 471 $ 421 $ 638 $ 448 $ 481 $ 484 $ 404 $ 4,979 $ 652
Income Tax 28 133 146 125 129 162 145 219 154 166 167 139 1,713 224
Other E xpense (Income) ———— — — —————— — -
Interest and other Income ———— — — —————— — -
Interest E xpense 41 41 41 41 49 49 49 49 49 49 49 49 551 49
Depreciation and Amortization 198 197 189 189 187 177 189 189 189 189 189 189 2,270 187
Intercompany Service Charges 30 30 30 30 30 30 30 30 30 30 30 30 360 30
Non Cash Hedge Adjustments 26 ——— — — —————— 26 -
Restructuring E xpenses ———— — — —————— — -
Adjusted E BITDA $ 403 $ 789 $ 831 $ 748 $ 769 $ 888 $ 833 $ 1,124 $ 870 $ 914 $ 918 $ 811 $ 9,899 $ 1,142
11
|
|
H OR S E H E A D H O L D I N G C O R P .
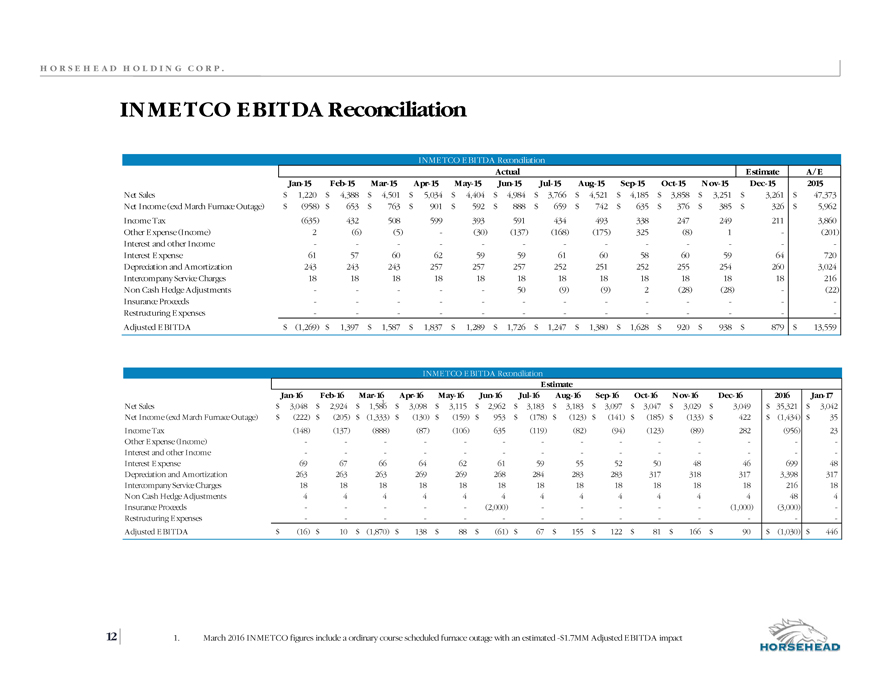
INMETCO EBITDA Reconciliation
INME TCO E BITDA Reconciliation
Actual Estimate A/E
Jan-15 Feb-15 Mar-15 Apr-15 May-15 Jun-15 Jul-15 Aug-15 Sep-15 Oct-15 Nov-15 Dec-15 2015
Net Sales $ 1,220 $ 4,388 $ 4,501 $ 5,034 $ 4,404 $ 4,984 $ 3,766 $ 4,521 $ 4,185 $ 3,858 $ 3,251 $ 3,261 $ 47,373
Net Income (excl March Furnace Outage) $ (958) $ 653 $ 763 $ 901 $ 592 $ 888 $ 659 $ 742 $ 635 $ 376 $ 385 $ 326 $ 5,962
Income Tax (635) 432 508 599 393 591 434 493 338 247 249 211 3,860
Other E xpense (Income) 2 (6) (5) — (30) (137) (168) (175) 325 (8) 1 — (201)
Interest and other Income ———— —— ——— — — — -
Interest E xpense 61 57 60 62 59 59 61 60 58 60 59 64 720
Depreciation and Amortization 243 243 243 257 257 257 252 251 252 255 254 260 3,024
Intercompany Service Charges 18 18 18 18 18 18 18 18 18 18 18 18 216
Non Cash Hedge Adjustments ———— — 50 (9) (9) 2 (28) (28) — (22)
Insurance Proceeds ———— —— ——— — — — -
Restructuring E xpenses ———— —— ——— — — — -
Adjusted E BITDA $ (1,269) $ 1,397 $ 1,587 $ 1,837 $ 1,289 $ 1,726 $ 1,247 $ 1,380 $ 1,628 $ 920 $ 938 $ 879 $ 13,559
INME TCO E BITDA Reconciliation
Estimate
Jan-16 Feb-16 Mar-16 Apr-16 May-16 Jun-16 Jul-16 Aug-16 Sep-16 Oct-16 Nov-16 Dec-16 2016 Jan-17
Net Sales $ 3,048 $ 2,924 $ 1,5861 $ 3,098 $ 3,115 $ 2,962 $ 3,183 $ 3,183 $ 3,097 $ 3,047 $ 3,029 $ 3,049 $ 35,321 $ 3,042
Net Income (excl March Furnace Outage) $ (222) $ (205) $ (1,333) $ (130) $ (159) $ 953 $ (178) $ (123) $ (141) $ (185) $ (133) $ 422 $ (1,434) $ 35
Income Tax (148) (137) (888) (87) (106) 635 (119) (82) (94) (123) (89) 282 (956) 23
Other E xpense (Income) ——————— ——— — — — -
Interest and other Income ——————— ——— — — — -
Interest E xpense 69 67 66 64 62 61 59 55 52 50 48 46 699 48
Depreciation and Amortization 263 263 263 269 269 268 284 283 283 317 318 317 3,398 317
Intercompany Service Charges 18 18 18 18 18 18 18 18 18 18 18 18 216 18
Non Cash Hedge Adjustments 4 4 4 4 4 4 4 4 4 4 4 4 48 4
Insurance Proceeds —————(2,000)— ——— — (1,000) (3,000) -
Restructuring E xpenses ——————— ——— — — — -
Adjusted E BITDA $ (16) $ 10 $ (1,870) $ 138 $ 88 $ (61) $ 67 $ 155 $ 122 $ 81 $ 166 $ 90 $ (1,030) $ 446
12 1. March 2016 INMETCO figures include a ordinary course scheduled furnace outage with an estimated -$1.7MM Adjusted EBITDA impact
|
|
H OR S E H E A D H O L D I N G C O R P .
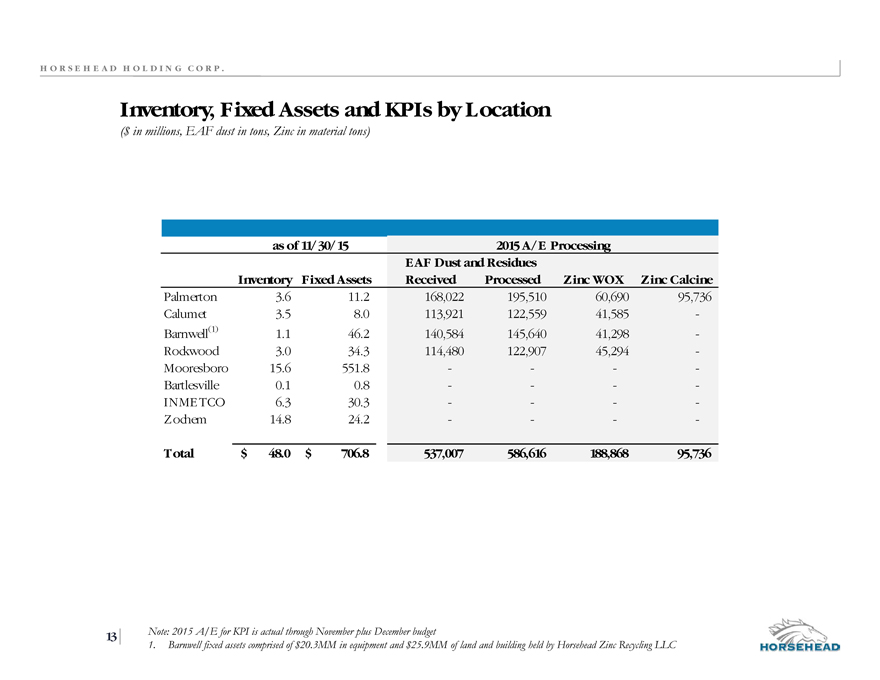
Inventory, Fixed Assets and KPIs by Location
($ in millions, EAF dust in tons, Zinc in material tons)
as of 11/30/15 2015 A/E Processing
EAF Dust and Residues
Inventory Fixed Assets Received Processed Zinc WOX Zinc Calcine
Palmerton 3.6 11.2 168,022 195,510 60,690 95,736
Calumet 3.5 8.0 113,921 122,559 41,585 -
Barnwell(1) 1.1 46.2 140,584 145,640 41,298 -
Rockwood 3.0 34.3 114,480 122,907 45,294 -
Mooresboro 15.6 551.8 — —
Bartlesville 0.1 0.8 — —
INME TCO 6.3 30.3 — —
Zochem 14.8 24.2 — —
Total $ 48.0 $ 706.8 537,007 586,616 188,868 95,736
13 Note: 2015 A/E for KPI is actual through November plus December budget
1. Barnwell fixed assets comprised of $20.3MM in equipment and $25.9MM of land and building held by Horsehead Zinc Recycling LLC