Attached files
| file | filename |
|---|---|
| 8-K - FORM 8-K - CIT GROUP INC | e68054_8k.htm |
| EX-99.1 - PRESS RELEASE - CIT GROUP INC | e68054ex99-1.htm |
Exhibit 99.2

Fourth Quarter 2015 Financial Results February 2 , 2016

1 Important Notices This presentation contains forward - looking statements within the meaning of applicable federal securities laws that are based upon our current expectations and assumptions concerning future events, which are subject to a number of risks and uncertainties that could cause actual results to differ materially from those anticipated . The words “expect,” “anticipate,” “estimate,” “forecast,” “initiative,” “objective,” “plan,” “goal,” “project,” “outlook,” “priorities,” “target,” “intend,” “evaluate,” “pursue,” “commence,” “seek,” “may,” “would,” “could,” “should,” “believe,” “potential,” and “continue,” or the negative of any of those words or similar expressions are intended to identify forward - looking statements . All statements contained in this presentation, other than statements of historical fact, including without limitation, statements about our plans, strategies, prospects and expectations regarding future events and our financial performance, are forward - looking statements that involve certain risks and uncertainties . While these statements represent our current judgment on what the future may hold, and we believe these judgments are reasonable, these statements are not guarantees of any events or financial results, and our actual results may differ materially . Important factors that could cause our actual results to be materially different from our expectations include, among others, the risk that CIT is unsuccessful in implementing its strategy and business plan, the risk that CIT is unable to react to and address key business and regulatory issues, the risk that CIT is unable to achieve the projected revenue growth from its new business initiatives or the projected expense reductions from efficiency improvements, and the risk that CIT becomes subject to liquidity constraints and higher funding costs . We describe these and other risks that could affect our results in Item 1 A, “Risk Factors,” of our latest Annual Report on Form 10 - K for the year ended December 31 , 2014 , which was filed with the Securities and Exchange Commission . Accordingly, you should not place undue reliance on the forward - looking statements contained in this presentation . These forward - looking statements speak only as of the date on which the statements were made . CIT undertakes no obligation to update publicly or otherwise revise any forward - looking statements, except where expressly required by law . This presentation is to be used solely as part of CIT management’s continuing investor communications program . This presentation shall not constitute an offer or solicitation in connection with any securities . | 4Q15 Earnings

2 Executing on O ur 2015 Priorities ▪ Returned nearly $650 million of capital to shareholders through dividends and the repurchase of 11.6 million shares Expand Commercial Banking Franchise Maintain Strong Risk Management Practices Grow Business Franchises Realize Embedded Value Return Excess Capital (1) Commercial allowance for loan losses plus principal loss discount as % of commercial finance receivables (before the princi pal loss discount). ▪ OneWest Bank acquisition closed August 3, 2015 ▪ 65% of financing and leasing assets in CIT Bank ▪ Deposits exceed 60% of total funding; cost of funds decreased ~ 100 bps from prior year ▪ Commercial credit reserve (1) 1.8% of finance receivables ▪ Consistently strong liquidity ▪ Common Equity Tier 1 ratio 12.9% ▪ Portfolio assets grew 27% from a year ago, reflecting acquired OneWest financing and leasing assets (5% ex. acquired assets) ▪ C ompleted Mexico and Brazil exits, U.K. EF closed January 2016 ▪ S ales of Canada and China businesses underway ▪ Accelerate the utilization of U.S. NOL ▪ Cash and investment portfolio positioned to benefit from rising interest rates ▪ Exploring strategic alternatives for Commercial Air business | 4Q15 Earnings

3 Restructuring: $53 Adjusted pre - tax income: ~$210 Pre - tax ROAEA: ~1.6% Pre - Tax Income Return on Average Earning Assets (ROAEA) (1) Totals may not sum due to rounding . NM denotes not meaningful amounts ($ Millions) NAB+TIF + Corporate Non - Strategic Portfolios Total CIT 4 Q15 Pre - tax income: ~$157 Pre - tax ROAEA: ~1.2% Pre - tax loss: ~($57) Pre - tax ROAEA: NM Pre - tax income: ~$141 Pre - tax ROAEA: ~1.0% | 4Q15 Earnings Legacy Consumer Mortgages Pre - tax income: ~$41 Pre - tax ROAEA: ~2.7% Adjusted for noteworthy items Brazil CTA: $51 Adjusted pre - tax loss: ~($6) Pre - tax ROAEA: NM No adjustments Adjusted pre - tax income: ~$41 Pre - tax ROAEA: ~2.7% Adjusted pre - tax income: ~$245 Pre - tax ROAEA: ~1.7% (1) Continuing operations

4 (1) Includes U.S . VA reversal impact of $647 million, $3.37 diluted EPS in 3Q15 and International VA reversal impact of $4 4 million, $0.24 diluted EPS in 4Q14. (2) Average earning assets (AEA) components include interest earning cash, investments, securities and indemnification assets, loans and operating lease equip men t. (3) Excluding transaction costs, 3Q15 net efficiency ratio of 57.6%. Total o perating e xpenses exclusive of r estructuring charges and amortization of intangibles divided by total revenue (Net finance margin and other i ncome). (4) Average finance receivables (AFR) is computed using month - end balances and is the average of finance receivables which includes loans, direct finance lease and leverage lease receivables and factoring receivables. It excludes operating lease equipment. (5 ) Beginning in 3Q15 , the ratio is calculated to include the impact of the principal loss discount associated with acquired OneWest receivables and is ALL plus principal loss discount on Commercial loans divided by Commercial Finance Receivables before the impact of the principal loss discount. (6) Capital ratios are preliminary as of 12/31/15 and based on fully phased - in Basel III estimates. The previous quarters of 2015 risk weighted assets were increased to conform to the current quarters presentation. Due to the increase in risk weighted assets, the CET ratio and total capital ratio in each of the 2015 qu arters declined by 10 basis points. At or For the Period Ended 4Q15 3Q15 2Q15 1Q15 4Q14 EPS (Diluted) – Total (1) $0.72 $3.61 $0.66 $0.59 $1.37 EPS (Diluted) – Continuing Ops. (1) $0.75 $3.63 $0.66 $0.59 $1.37 EPS (Diluted) impact from VA Reversal - $3.37 - - $0.24 Book Value Per Share $54.61 $53.74 $50.91 $50.26 $50.13 Tangible Book Value Per Share (TVBPS) $47.73 $47.09 $47.51 $46.89 $46.83 Pre - tax r eturn on Average Earning Assets (ROAEA) (2) 0.95% 1.04% 1.49% 1.41% 2.13% Net Finance Margin 3.57% 3.67% 3.34% 3.23% 3.56% Net Efficiency Ratio (3) 53.3% 62.2% 57.4% 57.1% 49.6% Net Charge - offs (% of AFR (4) ) 0.40% 0.86% 0.48% 0.43% 0.47% A llowance for loan losses as % of Finance Receivables for Commercial assets (5) 1.80% 1.82% 1.79% 1.83% 1.78% Tier 1 Capital Ratio/Tier 1 Common (6) 12.7% 12.4% 14.3% 14.0% 14.5% Total Capital Ratio (6) 13.3% 12.9% 15.0% 14.7% 15.2% Performance Highlights & Trends | 4Q15 Earnings

5 ($ Millions, except per share data) Noteworthy Items in 4Q15 Items in 4Q15 Results Reported Diluted EPS (Continuing) $0.75 Impact Segment Item Line Item Total Pre - tax After tax Per share NSP CTA (1) on Brazil platform sale Other Income ($51) ($58) ($0.29) Corporate Restructuring Operating Expenses ($53) ($33) ($0.16) Corporate Discrete tax item Tax Provision - $15 $0.07 EPS based on 201.4 million average diluted shares outstanding, $ impacts are rounded | 4Q15 Earnings (1) Currency translation adjustment

6 ▪ Net Finance Revenue reflects increase in earning assets from OneWest acquisition ▪ Other items include purchase accounting accretion based on unpaid principal balance of the loans (vs. OneWest’s carrying value) ▪ Decrease in Net Finance Margin from prior quarter reflects: + ~20 bps benefit from lower funding costs - ~20 bps reduction from higher operating lease expense and depreciation in air - ~10 bps reduction from lower operating equipment utilization and lease maintenance costs in rail 347 329 335 421 447 3.56% 3.23% 3.33% 3.67% 3.57% 4Q14 1Q15 2Q15 3Q15 4Q15 Net Finance Revenue less other items Other Items NFM Net Finance Margin ($ Millions) Yield Analysis (2) 4Q15 3Q15 4Q14 bps 3Q15 bps 4Q14 Interest bearing deposits and investments 1.21% 1.06% 0.53% 15bps 68bps Loans 5.90 5.95 6.24 (5) (34) Operating leases (net) 7.58 8.40 8.91 (82) (133) Indemnification assets (0.72) 0.39 - (111) - Earning assets 5.51 5.81 6.20 (30) (69) Deposits 1.25 1.41 1.69 (16) (44) Borrowings 3.97 4.10 4.56 (13) (59) Interest - bearing liabilities 2.27 2.51 3.27 (24) (100) | 4Q15 Earnings Net Finance Revenue & Net Finance Margin 373 337 343 482 528 (1) Other items include suspended depreciation, interest recoveries/ prepayments and other loan and debt FSA. 4Q15 and 3Q15 other it ems also includes purchase accounting accretion. (2) More detail is available in the average balance sheet within the fourth quarter 2015 press release. (1) Fourth Quarter Highlights
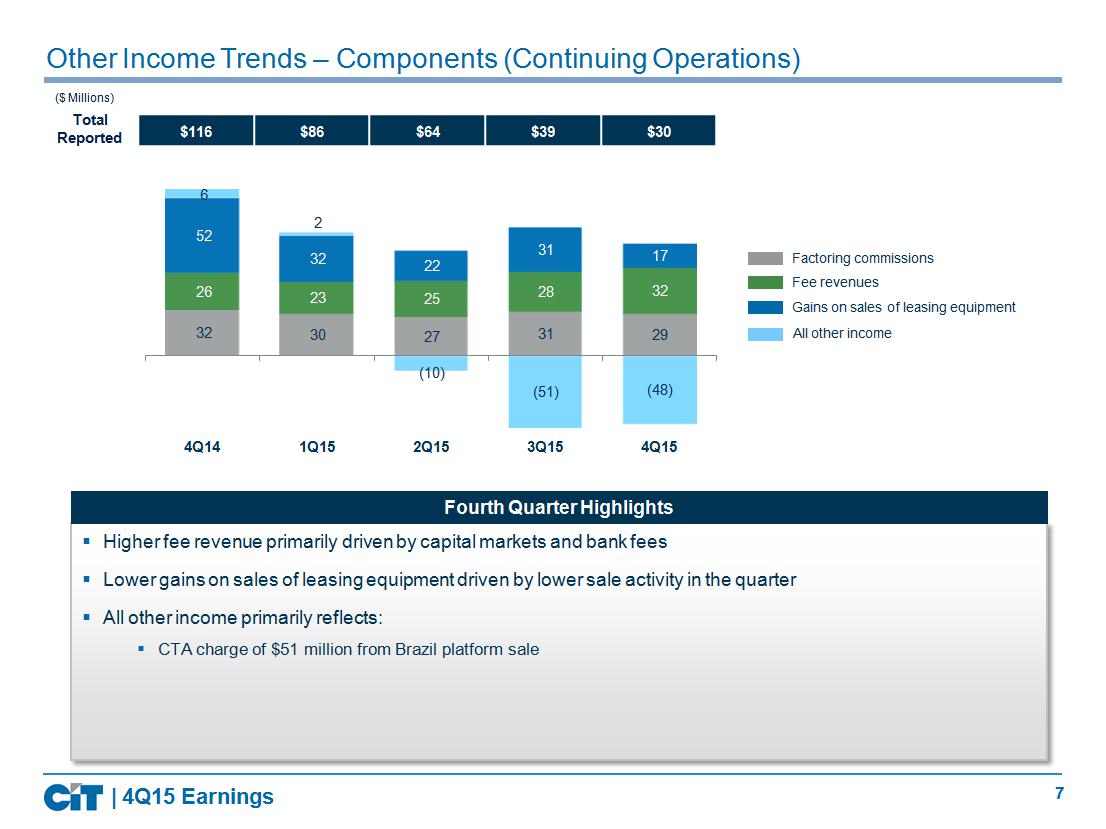
7 32 30 27 31 29 26 23 25 28 32 52 32 22 31 17 6 2 (10) (51) (48) - 55 - 30 - 5 20 45 70 95 120 145 Other Income Trends – Components (Continuing Operations) Factoring commissions Fee revenues Gains on sales of leasing equipment All other income ($ Millions) 4 Q14 2 Q15 3 Q 15 4Q15 1 Q15 Total Reported | 4Q15 Earnings ▪ Higher fee revenue primarily driven by capital markets and bank fees ▪ Lower gains on sales of leasing equipment driven by lower sale activity in the quarter ▪ All other income primarily reflects: ▪ CTA charge of $51 million from Brazil platform sale Fourth Quarter Highlights $116 $86 $64 $39 $30

8 Asset Quality Trends – (Continuing Operations) ($ Millions) 161 184 198 215 268 0.5% 0.4% 0.5% 0.9% 0.4% 0.0% 0.3% 0.6% 0.9% 1.2% 1.5% 0 50 100 150 200 250 300 4Q14 1Q15 2Q15 3Q15 4Q15 Non - accrual Loans Net Charge - offs % to AFR 346 357 351 334 353 1.8% 1.8% 1.8% 1.3% 1.4% 1.8% 1.8% 0.0% 0.5% 1.0% 1.5% 2.0% 0 100 200 300 400 500 4Q14 1Q15 2Q15 3Q15 4Q15 Allowance for Loan Losses (ALL) Princ. Loss Disc ALL % to FR ALL + Princ Loss Disc. % to FR before discount (1) (1) 4Q15, 3Q15, 2Q15, 1Q15, and 4Q14 included approximately $19 million, $40 million, $ 2 million, $11 million and $7 million respectively, of charge - offs related to the transfer of loans to held for sale; exclusive of these charge - offs, net charge - offs as a % to AFR would have been 16 bps, 17bps, 44 bps, 20 bps and 34 bps respectively. | 4Q15 Earnings Non - accrual Loans & Net Charge - offs Allowance for Loan Losses - Commercial ▪ N on - accrual balances increased primarily in the energy portfolio ▪ Allowance for loan losses increased due to reserve build primarily in energy and, to a lesser extent, maritime ▪ ALL as a % of finance receivables on commercial loans increased to 1.4% ▪ Including the principal loss discount, ALL as a % of finance receivables is 1.8% Fourth Quarter Highlights

9 Restructuring Charges All Other Operating Expenses Costs Related to OneWest Acquisition Amortization of Intangibles 237 237 226 292 283 249 242 235 334 358 0 50 100 150 200 250 300 350 400 4Q14 1Q15 2Q15 3Q15 4Q15 Operating Expenses Trends – (Continuing Operations) ($ Millions) (1) 4Q15, 3Q15, 2Q15, 1Q15 and 4Q14 include approximately $15 million, $32 million, $7 million, $ 5 million , and $4 million, respectively, of costs related to OneWest acquisition. (2) Total operating e xpenses exclusive of restructuring charges and amortization of intangibles divided by t otal r evenue (Net finance margin and other i ncome). Excluding transaction costs, net efficiency ratio of 57.6% in 3Q15. (1) | 4Q15 Earnings ▪ Restructuring charges of $53 million primarily related to the streamlining of the senior management team ▪ Adjustment to the annual incentive compensation accrual and changes to benefit plans reduced compensation and benefits costs for the quarter Fourth Quarter Highlights 49.3% 57.1% 57.4% 62.2% 53.3% Net Efficiency Ratio (2)

10 233 215 218 232 208 4.5% 4.3% 4.3% 4.6% 4.0% 4Q14 1Q15 2Q15 3Q15 4Q15 Net Finance Revenue NFM 185 157 157 185 156 3.6% 3.1% 3.1% 3.7% 3.0% 4Q14 1Q15 2Q15 3Q15 4Q15 Pre - tax Income PTI - ROAEA Transportation & International Finance Trends 20.5 20.2 20.2 20.1 20.7 4Q14 1Q15 2Q15 3Q15 4Q15 ($ Millions) ($ Billions) | 4Q15 Earnings Pre - tax Income & ROAEA Average Earning Assets Net Finance Revenue & Net Finance Margin ($ Millions) ▪ Net Finance Margin reflects lower rail utilization and higher maintenance and operating lease expenses ▪ Average Earning Assets increased driven by financing and leasing assets growth across all divisions except International Finance Fourth Quarter Highlights

11 122 36 48 36 87 3.1% 0.9% 1.2% 0.7% 1.5% 4Q14 1Q15 2Q15 3Q15 4Q15 Pre - tax Income PTI - ROAEA 145 129 133 210 263 3.7% 3.4% 3.4% 4.0% 4.4% 4Q14 1Q15 2Q15 3Q15 4Q15 Net Finance Revenue NFM North America Banking Trends 15.6 15.3 15.4 20.8 23.6 4Q14 1Q15 2Q15 3Q15 4Q15 ($ Millions) ($ Billions) | 4Q15 Earnings Pre - tax Income & ROAEA Average Earning Assets Net Finance Revenue & Net Finance Margin ($ Millions) ▪ Net Finance Margin benefited from purchase accounting accretion on acquired loans and lower funding costs ▪ Average Earning Asset growth driven by full quarter of One West Bank partially offset by loan sales Fourth Quarter Highlights
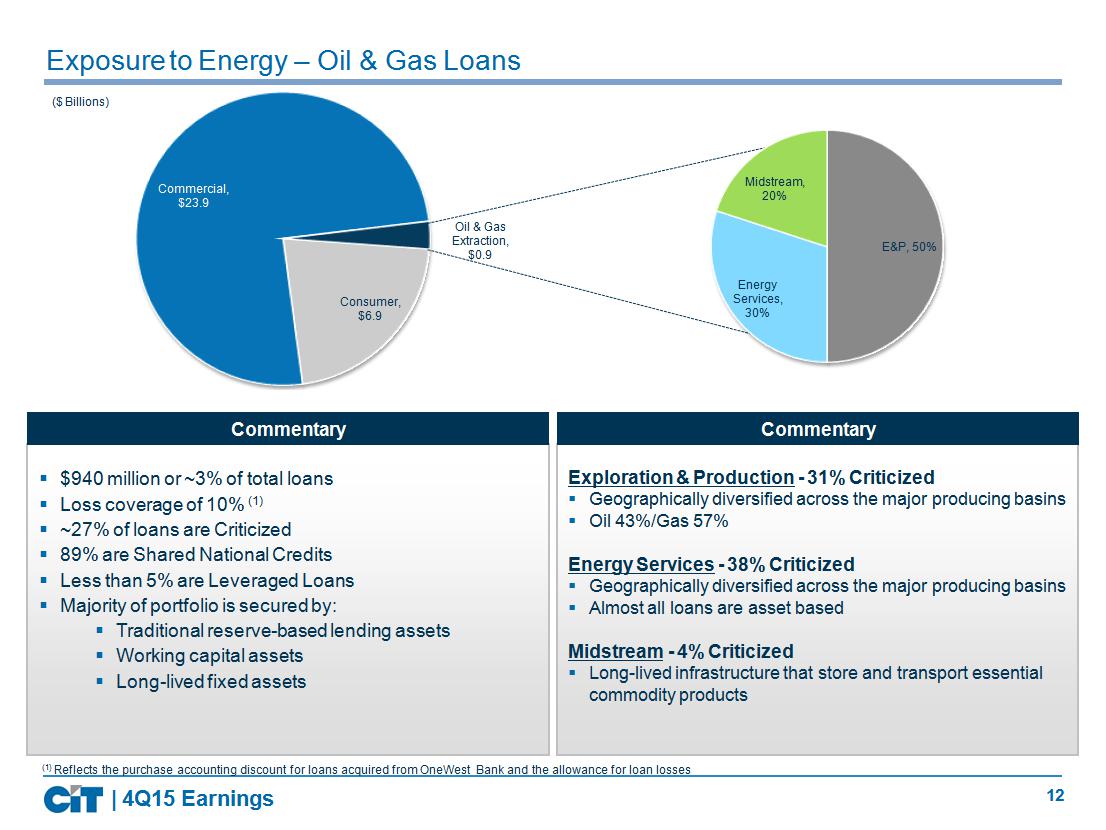
12 Exposure to Energy – Oil & Gas Loans | 4Q15 Earnings ($ Billions) (1) Reflects the purchase accounting discount for loans acquired from OneWest Bank and the allowance for loan losses Exploration & Production - 31% Criticized ▪ Geographically diversified across the major producing basins ▪ Oil 43 %/Gas 57% Energy Services - 38% Criticized ▪ Geographically diversified across the major producing basins ▪ Almost all loans are asset based Midstream - 4% Criticized ▪ Long - lived infrastructure that store and transport essential commodity products Commentary ▪ $940 million or ~3% of total loans ▪ Loss coverage of 10% (1) ▪ ~27 % of loans are Criticized ▪ 89% are Shared National Credits ▪ Less than 5% are Leveraged Loans ▪ Majority of portfolio is secured by: ▪ T raditional reserve - based lending assets ▪ W orking capital assets ▪ L ong - lived fixed assets Commentary Consumer, $6.9 Commercial , $ 23.9 Oil & Gas Extraction, $0.9 E&P, 50% Energy Services, 30% Midstream, 20%

13 Covered Hopper - Other, 31% Covered Hopper - O&G Related, 9% Tank Cars - Other, 12% Tank Cars - O&G Related, 13% Mill/Coil Gondolas, 11% Coal, 11% Boxcars, 7% Flatcars, 4% Locomotives, 0% Other, 3% Total Cars: ~116,000 Diversified North American Rail Fleet Fleet by Lessee Industry | 4Q15 Earnings Fleet by Type ▪ Diversified fleet serving a broad range of customers and industries ▪ Approximately 500 clients ▪ ~75% shippers and ~25% railroads ▪ Strong credit profile ( ~50 % investment grade) ▪ Young, well maintained equipment ( avg. age: 12 yrs.) ▪ Utilization and lease rate trends coming off peak levels primarily driven by weakening demand for cars in the oil and gas sector ▪ Tank cars: ~15,000 leased directly to customers for the transportation of crude ▪ Sand c ars: ~10,000 supporting crude and natural gas drilling ▪ ~3,500 cars (~$200 million net investment) supporting the oil & gas industry are up for renewal in 2016 ▪ Portfolio management strategies ▪ Divert cars to alternative services (e.g. sand to cement, tank cars to ethanol and other refined products, etc.) ▪ Work with manufacturers to manage orderbook commitments ▪ Shorten lease terms while lease rates are weaker Total Net Investment:~$ 5.8B Commentary Petroleum and gas (drilling, marketing, refining, and transport) 37% Railroads 23% Agriculture, Food, and Ethanol 12% Chemicals (non petrochemical) 9% Cement and Building Products 6% Mining 3% Coal and Utilities 3% Aircraft Equipment 3% Steel and Metals 2% Petrochemicals 2%

14 APPENDIX | 4Q15 Earnings
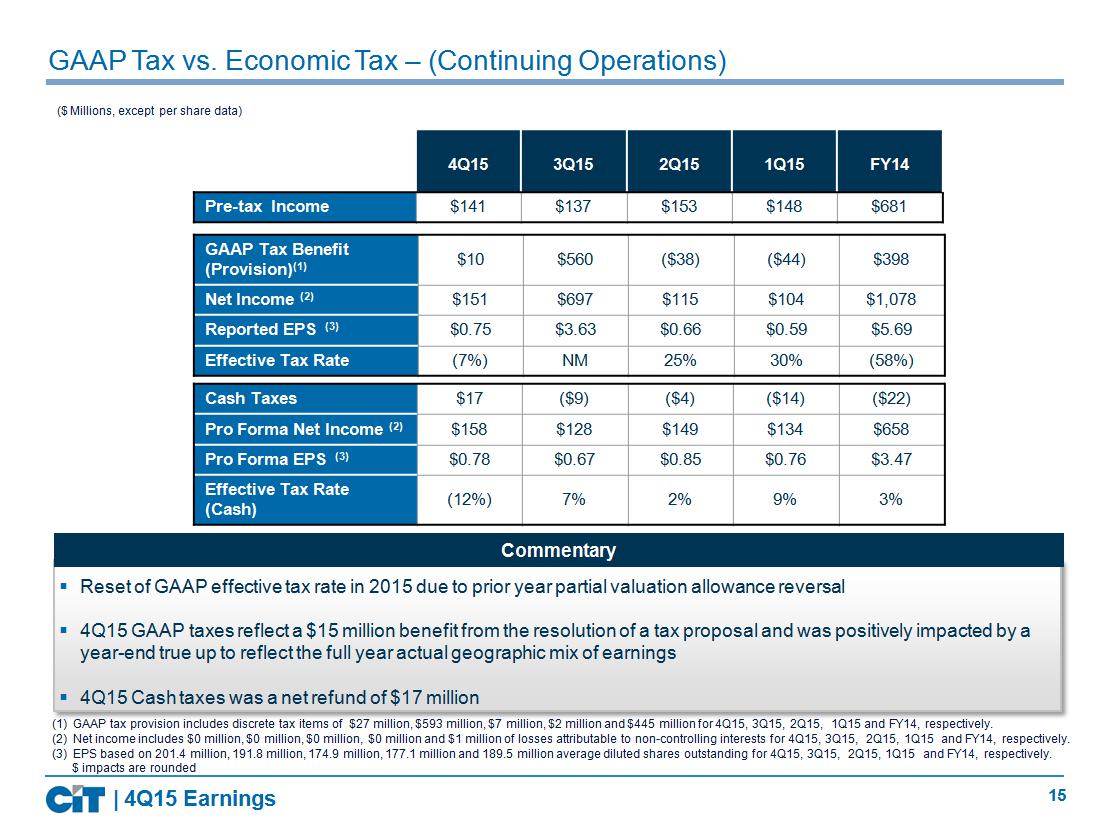
15 GAAP Tax vs. Economic Tax – (Continuing Operations ) 4Q15 3Q15 2Q15 1Q15 FY14 Pre - tax Income $141 $137 $153 $148 $681 (1) GAAP tax provision includes discrete tax items of $27 million, $593 million, $7 million, $2 million and $445 million for 4Q15, 3Q15, 2Q15, 1Q15 and FY14 , respectively. (2) Net income includes $0 million, $0 million, $0 million, $0 million and $1 million of losses attributable to non - controlling int erests for 4Q15, 3Q15, 2Q15, 1Q15 and FY14 , respectively. (3) EPS based on 201.4 million, 191.8 million, 174.9 million, 177.1 million and 189.5 million average diluted shares outstanding for 4Q15, 3Q15, 2Q15, 1Q15 and FY14 , respectively. $ impacts are rounded ($ Millions, except per share data) GAAP Tax Benefit (Provision) (1) $10 $560 ($38) ($44) $398 Net Income (2) $151 $697 $115 $104 $1,078 Reported EPS (3) $0.75 $3.63 $0.66 $0.59 $5.69 Effective Tax Rate (7%) NM 25% 30% (58%) Cash Taxes $17 ($9) ($4) ($14) ($22) Pro Forma Net Income (2) $158 $128 $149 $134 $658 Pro Forma EPS (3) $0.78 $0.67 $0.85 $0.76 $3.47 Effective Tax Rate (Cash) (12%) 7% 2% 9% 3% ▪ Reset of GAAP effective tax rate in 2015 due to prior year partial valuation allowance reversal ▪ 4Q15 GAAP taxes reflect a $15 million benefit from the resolution of a tax proposal and was positively impacted by a year - end true up to reflect the full year actual geographic mix of earnings ▪ 4Q15 C ash taxes was a net refund of $17 million | 4Q15 Earnings Commentary

16 Platform Exits Estimated CTA (1) Expected Timing Portfolio Size ($ Millions) Other international platforms; $350 million of UK CF and $180 million of NSP assets already sold but will have trailing CTA c ha rges of ~$5 million. | 4Q15 Earnings Canada ~$800 ~$0 - 5 2016 China ~$500 ~$0 - 5 2016 (1) Currency translation adjustment U.K. Equipment Finance ~$380 ~$5 Closed 1/1/16

17 | 4Q15 Earnings