Attached files
| file | filename |
|---|---|
| 8-K - FORM 8-K - C. H. ROBINSON WORLDWIDE, INC. | d125036d8k.htm |
| EX-99.1 - EX-99.1 - C. H. ROBINSON WORLDWIDE, INC. | d125036dex991.htm |
 Earnings Conference Call –
Fourth Quarter 2015 February 3, 2016 John Wiehoff, Chairman & CEO Andrew Clarke, CFO Tim Gagnon, Director, Investor Relations Exhibit 99.2 |
 2 Safe Harbor Statement Except for the historical information contained herein, the matters set forth in this
presentation and the accompanying earnings release are forward-looking statements
that represent our expectations, beliefs, intentions or strategies
concerning future events. These forward-looking statements are
subject to certain risks and uncertainties that could cause actual
results to differ materially from our historical experience or our
present expectations, including, but not limited to such factors as
changes in economic conditions, including uncertain consumer demand; changes in
market demand and pressures on the pricing for our services; competition
and growth rates within the fourth party logistics industry; freight
levels and increasing costs and availability of truck capacity or
alternative means of transporting freight, and changes in relationships
with existing truck, rail, ocean and air carriers; changes in our
customer base due to possible consolidation among our customers; our ability to integrate the operations of acquired companies with our historic operations successfully; risks associated with litigation and insurance coverage; risks associated
with operations outside of the U.S.; risks associated with the potential impacts of
changes in government regulations; risks associated with the produce
industry, including food safety and contamination issues; fuel prices and
availability; changes to our share repurchase activity; the impact of war
on the economy; and other risks and uncertainties detailed in our Annual
and Quarterly Reports. |
 3 Results Q4 2015 Three months ended December 31 in thousands, except per share amounts • Organic net revenue increased 7.3 percent with Freightquote adding 6.4 percentage points to
our net revenue growth in the fourth quarter of 2015 when compared to the fourth
quarter of 2014.
• During the fourth quarter, we had an indemnification asset write off related to the acquisition of
Phoenix International Freight Services, Ltd. The impact of this write off was
partially offset within the tax provision by related tax liabilities
that expired under applicable statute of limitations. The write off
decreased earnings per share by $0.02 in the fourth quarter.
• Freightquote represents approximately 9 percent of the average headcount growth in the
fourth quarter of 2015.
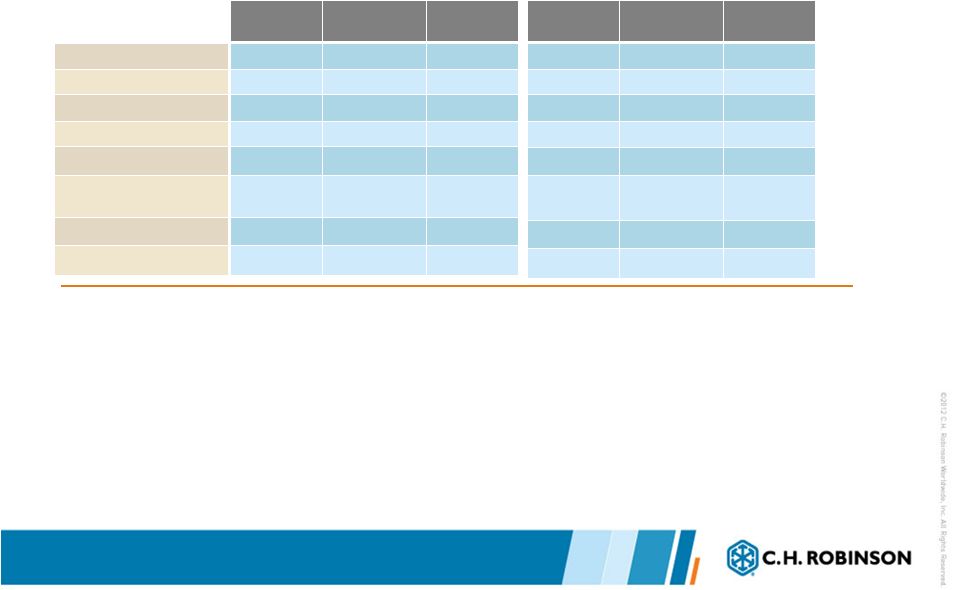
2015 2014 % Change Total revenues $3,210,853 $3,357,202 -4.4% Total net revenues $570,777 $501,816 13.7% Income from operations $214,579 $187,728 14.3% Net income $126,583 $112,947 12.1% Earnings per share (diluted) $0.88 $0.77 14.3% Weighted average shares outstanding (diluted) 144,144 146,650 -1.7% Average headcount 13,158 11,532 14.1% Ending headcount 13,159 11,521 14.2% 2015 2014 % Change $13,476,084 $13,470,067 0.0% $2,268,480 $2,007,652 13.0% $858,310 $748,418 14.7% $509,699 $449,711 13.3% $3.51 $3.05 15.1% 145,349 147,452 -1.5% 12,902 11,617 11.1% 13,159 11,521 14.2% Twelve months ended December 31 |
 4 Transportation Results Q4 2015 • 2015 full year transportation shipments of approximately 17 million, a 14 percent
increase over full year 2014 shipments.
•
Net revenue margin expansion was the result of the following factors:
•
Lower transportation costs, including fuel.
•
Change in mix of business due to faster growth in shorter length of haul freight
and the addition of Freightquote.
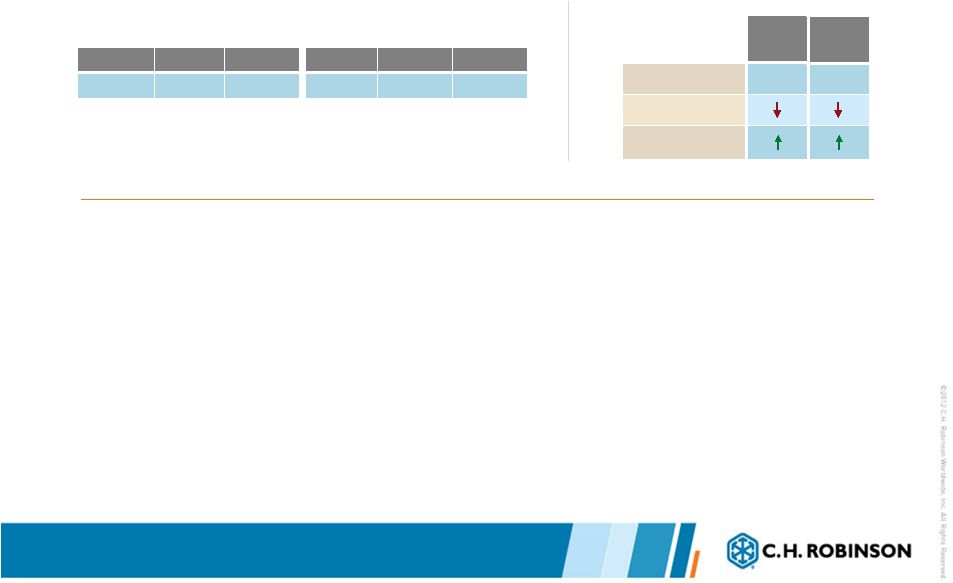
2015 2014 % Change Total revenues $2,867,301 $3,014,251 -4.9% Total net revenues $543,925 $477,811 13.8% Net revenue margin 19.0% 15.9% 19.7% Three months ended December 31 TRANSPORTATION in thousands TRANSPORTATION NET REVENUE MARGIN PERCENTAGE 2006 2007 2008 2009 2010 2011 2012 2013 2014 2015 Q1 18.3% 20.2% 18.2% 22.6% 17.4% 17.2% 16.9% 16.3% 15.3% 16.8% Q2 17.1% 17.9% 15.4% 20.6% 15.8% 16.2% 14.9% 15.4% 16.0% 17.5% Q4 17.5% 18.0% 15.9% 19.8% 16.6% 16.4% 15.6% 15.0% 16.2% 18.4% Q4 18.3% 17.7% 19.0% 18.3% 17.6% 16.3% 15.8% 15.1% 15.9% 19.0% Year 17.8% 18.4% 17.0% 20.2% 16.8% 16.5% 15.8% 15.4% 15.9% 17.9% 2015 2014 % Change $11,989,780 $11,936,512 0.4% $2,147,509 $1,892,106 13.5% 17.9% 15.9% 13.0% Twelve months ended December 31 |
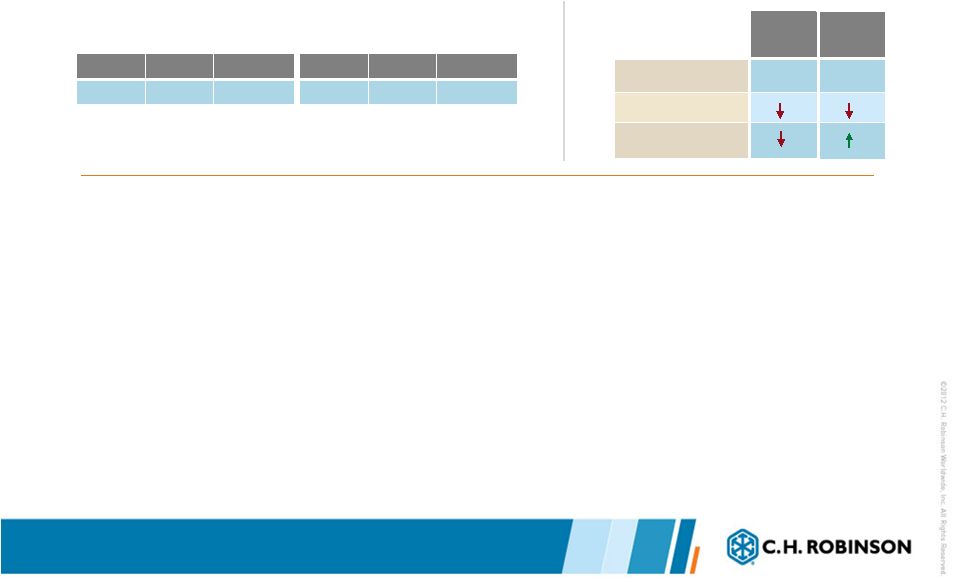
 5 Truckload Results Q4 2015 2015 2014 % Change $338,892 $298,721 13.4% Three months ended Dec 31 TRUCKLOAD NET REVENUES in thousands North America Truckload Year over year change *Pricing and cost measures are a rate per mile and exclude the estimated impact of the change in fuel prices • Organic net revenue increased approximately 10 percent with Freightquote adding approximately 3.5 percent to the increase in net revenues in the fourth quarter of 2015 when compared to the fourth quarter of 2014. • North America Truckload volume, excluding Freightquote, increased approximately 2 percent in the fourth quarter of 2015 when compared to the fourth quarter of 2014. Quarter Volume 5% Approximate pricing* -3% Approximate cost* -5% Net revenue margin 2015 2014 % Change $1,316,533 $1,190,372 10.6% Twelve months ended Dec 31 YTD 6% 1% 0% |
 6 LTL Results Q4 2015 2015 2014 % Change $89,622 $63,402 41.4% Three months ended Dec 31 LTL NET REVENUES in thousands LTL Year over year change • Organic net revenues increased approximately 9 percent with Freightquote contributing approximately 32 percent to the increase in LTL net revenues in the fourth quarter of 2015. • Organic LTL volume increased approximately 17 percent in the fourth quarter of 2015 when compared to the fourth quarter of 2014. Quarter Volume 36% Pricing Net revenue margin 2015 2014 % Change $360,706 $258,884 39.3% Twelve months ended Dec 31 YTD 32% |
 7 Intermodal Results Q4 2015 • North America Intermodal net revenue, excluding Freightquote, decreased approximately 22 percent in the fourth quarter of 2015 when compared to the fourth quarter of 2014. • Intermodal realized a significant decrease in transactional volume in the fourth quarter of 2015 when compared to the fourth quarter of 2014. • Conversion to truckload from intermodal negatively impacted intermodal volumes and net revenues in the fourth quarter of 2015. 2015 2014 % Change $8,835 $10,235 -13.7% Three months ended Dec 31 INTERMODAL NET REVENUES in thousands Year over year change INTERMODAL Quarter Volume -7% Pricing Net revenue margin 2015 2014 % Change $41,054 $40,631 1.0% Twelve months ended Dec 31 YTD 2% |
 Global
Forwarding Results Q4 2015 Ocean, Air and Customs
2015 2014 % Change Ocean $56,065 $56,944 -1.5% Air $18,613 $19,404 -4.1% Customs $10,681 $10,824 -1.3% Three months ended Dec 31 NET REVENUES in thousands Quarter Volume Pricing Net revenue margin OCEAN Quarter Volume Pricing Net revenue margin AIR Year over year change Year over year change • Combined Global Forwarding services net revenues decreased 2.1 percent in the fourth quarter when compared to the fourth quarter of 2014. • Cross selling initiatives continue to yield positive results for both global forwarding and surface transportation services. 2015 2014 % Change Ocean $223,643 $208,422 7.3% Air $79,096 $79,125 0.0% Customs $43,929 $41,575 5.7% Twelve months ended Dec 31 YTD YTD 8 |
 Other
Logistics Services Results Q4 2015 •
Other Logistics Services net revenues include transportation
managed services, warehousing and small parcel.
•
Net revenues increased in the fourth quarter when compared to
the fourth quarter of 2014, primarily due to volume growth in
managed services. • Freightquote contributed approximately 2 percentage points to our Other Logistics Services net revenue growth in the fourth quarter of 2015. 2015 2014 % Change $21,217 $18,281 16.1% Three months ended Dec 31 NET REVENUES in thousands 2015 2014 % Change $82,548 $73,097 12.9% Twelve months ended Dec 31 9 |
 Sourcing Results Q4 2015
•
Net revenue increased as a result of an increase in net revenue per
case. • Case volume increased 4.5 percent in the fourth quarter of 2015 when compared to the fourth quarter of 2014. 2015 2014 % Change Total revenues $343,552 $342,951 0.2% Total net revenues 26,852 $24,005 11.9% Net revenue margin 7.8% 7.0% 11.7% Three months ended Dec 31 SOURCING NET REVENUES in thousands 2015 2014 % Change $1,486,304 $1,533,555 -3.1% $120,971 $115,546 4.7% 8.1% 7.5% 8.0% Twelve months ended Dec 31 10 |
 11 in thousands Summarized Income Statement • Personnel expense growth was primarily the result of the increased headcount. • Average headcount increased 14.1 percent in the fourth quarter of 2015 as compared to the fourth quarter of 2014 and Freightquote contributed approximately 9 percentage points of the increase. • Other SG&A expenses increased primarily due to our acquisition of Freightquote, including amortization expenses of approximately $1.9 million, and an increase in travel expenses. Three months ended Dec 31 2015 2014 % Change Total revenues $3,210,853 $3,357,202 -4.4% Total net revenues 570,777 501,816 13.7% Personnel expenses 268,190 235,117 14.1% Selling, general & admin 88,008 78,971 11.4% Total operating expenses 356,198 314,088 13.4% Income from operations $214,579 $187,728 14.3% Percent of net revenue 37.6% 37.4% 0.5% 2015 2014 % Change $13,476,084 $13,470,067 0.0% 2,268,480 2,007,652 13.0% 1,051,410 939,021 12.0% 358,760 320,213 12.0% 1,410,170 1,259,234 12.0% $858,310 $748,418 14.7% 37.8% 37.3% 1.5% Twelve months ended Dec 31 |
 12 Three months ended Dec 31 December 31, 2015 Cash & investments $168,229 Current assets $1,730,698 Total assets $3,184,358 Debt $950,000 Stockholders investment $1,137,805 CASH FLOW DATA BALANCE SHEET DATA Other Financial Information in thousands • Strong cash flow quarter • Total debt balance $950 million • $500 million, 4.28% average coupon • $450 million drawn on revolver, 1.55% current rate as of Dec. 31, 2015 2015 2014 % Change 2015 2014 % Change Net cash provided by operating activities $253,893 $208,104 22.0% $718,336 $513,426 39.9% Capital expenditures, net $11,831 $4,366 171.0% $44,642 $29,502 51.3% Twelve months ended Dec 31 |
 13 in thousands Capital Distribution • Capital returned to shareholders during the quarter • $64.2 million cash dividend • $66.5 million in cash for repurchase activity • 978,271 shares • Average price $67.97 for shares repurchased • Target is to return approximately 90% of net income to shareholders annually. 2010 2011 2012 (a) 2013 2014 Q4 2015 Net income $387,026 $431,612 $447,007 $415,904 $449,711 $126,583 Capital distribution Cash dividends paid $168,902 $194,697 $219,313 $220,257 $215,008 $64,167 Share repurchases 157,381 250,274 255,849 807,449 (b) 176,645 66,498 Subtotal $326,283 $444,971 $475,162 $1,027,706 $391,653 $130,665 Percent of net income Cash dividends paid 44% 45% 49% 53% 48% 51% Open market share repurchases 41% 58% 57% 194% 39% 53% Subtotal 84% 103% 106% 247% 87% 103% (a) 2012 Net Income is adjusted to excluded transaction related gains and expenses. A
reconciliation of adjusted results appears in Appendix A. 2012 Dividends
exclude the fifth dividend payment made during the
year. (b) Includes a $500 million accelerated share
repurchase. YTD 2015
$509,699 $235,615 232,113 $467,728 46% 46% 92% |
 14 A look ahead • January total company net revenue growth rate is consistent with the organic (CHRW without Freightquote) fourth quarter 2015 growth rate. • We are focused on taking share, profitably • Global Forwarding Success • Demand for integrated, global services is growing • Leading with talent, technology and innovation |
 15 Appendix A: 2012 Summarized Adjusted Income Statement In thousands, except per share amounts Twelve months ended December 31, 2012 1) The adjustment to personnel consists of $33 million of incremental vesting expense of our equity awards triggered by the gain on the divestiture of T-Chek. The balance consists of transaction related bonuses. 2) The adjustments to other operating expenses reflect fees paid to fourth parties for:
a) Investment banking fees related to the acquisition of Phoenix b) External legal and accounting fees related to the acquisitions of Apreo and Phoenix and the divestiture of T-Chek. 3) The adjustment to investment and other income reflects the gain from the divestiture of T-Chek.
4) The adjustment to diluted weighted average shares outstanding relates to the shares of C.H. Robinson stock issued as consideration paid to the
sellers in the acquisition of Phoenix.
5) The adjustment to diluted weighted average shares outstanding relates to the additional vesting of performance-based restricted stock as a
result of the gain on sale recognized from the divestiture of
T-Chek. 2012 Actual
Non-recurring Acquisition Impacts Non-recurring Divestiture Impacts Adjusted Total net revenues $1,717,571 $1,717,571 Personnel expenses (1) 766,006 -385 -34,207 731,414 Other operating expenses (2) 276,245 -10,225 -379 265,641 Total operating expenses 1,042,251 -10,610 -34,586 997,055 Income from operations 675,320 10,610 34,586 720,516 Investment & other income (3) 283,142 -281,551 1,591 Income before taxes 958,462 10,610 -246,965 722,107 Provision for income taxes 364,658 2,745 -92,303 275,100 Net income $593,804 7,865 -$154,662 $447,007 Net income per share (diluted) 3.67 2.76 Weighted average shares (diluted) 161,946 185 (4) 92 (5) 161,669 To assist investors in understanding our financial performance, we supplement the financial results that are generated in accordance with the
accounting principles generally accepted in the United States, or GAAP,
with non-GAAP financial measures, including non-GAAP operating expenses, non-GAAP income from operations, non-GAAP net income and non-GAAP diluted net income per share. We believe that these non-GAAP
measures provide meaningful insight into our operating performance
excluding certain event-specific charges, and provide an alternative perspective of our results of operations. We use non-GAAP measures to assess our operating performance for the quarter. Management believes that these non-GAAP
financial measures reflect an additional way of analyzing aspects of our
ongoing operations that, when viewed with our GAAP results, provides a more complete understanding of the factors and trends affecting our business. |
 |