Attached files
| file | filename |
|---|---|
| 8-K - FIRST BANCORP. 8-K - FIRST BANCORP /PR/ | a51269231.htm |
| EX-99.1 - EXHIBIT 99.1 - FIRST BANCORP /PR/ | a51269231ex99_1.htm |
|
Exhibit 99.2 |

Financial Results FYE 2015
& 4Q 2015
2 Forward-Looking
Statements This presentation contains “forward-looking statements”
concerning First BanCorp’s (the “Corporation”) future economic
performance. The words or phrases “would be,” “will allow,” “intends
to,” “will likely result,” “are expected to,” “expect,” “anticipate,”
“look forward,” “should,” “believes” and similar expressions are meant
to identify “forward-looking statements” within the meaning of Section
27A of the Private Securities Litigation Reform Act of 1995, and are
subject to the safe harbor created by such section. The Corporation
wishes to caution readers not to place undue reliance on any such
“forward-looking statements,” which speak only as of the date made, and
to advise readers that various factors, including, but not limited to,
uncertainty about whether the Corporation and FirstBank Puerto Rico
(“FirstBank” or “the Bank”) will be able to fully comply with the
written agreement dated June 3, 2010 that the Corporation entered into
with the Federal Reserve Bank of New York (the “FED”) and the order
dated June 2, 2010 (the “Order”)that FirstBank entered into with the
FDIC and the Office of the Commissioner of Financial Institutions of
Puerto Rico that, among other things, require FirstBank to maintain
certain capital levels and reduce its special mention, classified,
delinquent and non-performing assets; the risk of being subject to
possible additional regulatory actions; uncertainty as to the
availability of certain funding sources, such as retail brokered CDs;
the Corporation’s reliance on brokered CDs and its ability to obtain, on
a periodic basis, approval from the FDIC to issue brokered CDs to fund
operations and provide liquidity in accordance with the terms of the
Order; the risk of not being able to fulfill the Corporation’s cash
obligations or resume paying dividends to the Corporation’s stockholders
in the future due to the Corporation’s inability to receive approval
from the FED to receive dividends from FirstBank or FirstBank’s failure
to generate sufficient cash flow to make a dividend payment to the
Corporation; the strength or weakness of the real estate markets and of
the consumer and commercial credit sectors and their impact on the
credit quality of the Corporation’s loans and other assets, including
the Corporation’s construction and commercial real estate loan
portfolios, which have contributed and may continue to contribute to,
among other things, the high levels of non-performing assets,
charge-offs and the provision expense and may subject the Corporation to
further risk from loan defaults and foreclosures; adverse changes in
general economic conditions in the United States and in Puerto Rico,
including the interest rate scenario, market liquidity, housing
absorption rates, real estate prices and disruptions in the U.S. capital
markets, which may reduce interest margins, impact funding sources and
affect demand for all of the Corporation’s products and services and the
value of the Corporation’s assets; an adverse change in the
Corporation’s ability to attract new clients and retain existing ones; a
decrease in demand for the Corporation’s products and services and lower
revenues and earnings because of the continued recession in Puerto Rico
and the current fiscal problems and budget deficit of the Puerto Rico
government; uncertainty about regulatory and legislative changes for
financial services companies in Puerto Rico, the United States and the
U.S. and British Virgin Islands, which could affect the Corporation’s
financial performance and could cause the Corporation’s actual results
for future periods to differ materially from prior results and
anticipated or projected results; uncertainty about the effectiveness of
the various actions undertaken to stimulate the United States economy
and stabilize the United States’ financial markets, and the impact such
actions may have on the Corporation’s business, financial condition and
results of operations; changes in the fiscal and monetary policies and
regulations of the federal government, including those determined by the
Federal Reserve System, the FDIC, government-sponsored housing agencies
and regulators in Puerto Rico and the U.S. and British Virgin Islands;
the risk of possible failure or circumvention of controls and procedures
and the risk that the Corporation’s risk management policies may not be
adequate; the risk that the FDIC may further increase the deposit
insurance premium and/or require special assessments to replenish its
insurance fund, causing an additional increase in the Corporation’s
non-interest expense; risks of not being able to recover the assets
pledged to Lehman Brothers Special Financing, Inc.; the impact on the
Corporation’s results of operations and financial condition associated
with acquisitions and dispositions; a need to recognize additional
impairments on financial instruments or goodwill relating to
acquisitions; risks that downgrades in the credit ratings of the
Corporation’s long-term senior debt will adversely affect the
Corporation’s ability to access necessary external funds; the impact of
the Dodd-Frank Wall Street Reform and Consumer Protection Act on the
Corporation’s businesses, business practices and cost of operations; and
general competitive factors and industry consolidation. The Corporation
does not undertake, and specifically disclaims any obligation, to update
any “forward-looking statements” to reflect occurrences or unanticipated
events or circumstances after the date of such statements except as
required by the federal securities laws. Investors should refer to the
Corporation’s Annual Report on Form 10-K for the year ended December 31,
2013 for a discussion of such factors and certain risks and
uncertainties to which the Corporation is subject.

Agenda Fiscal Year & Fourth
Quarter 2015 Highlights Aurelio Alemán, President & Chief Executive
Officer Fiscal Year & Fourth Quarter 2015 Results of Operations Orlando
Berges, Executive Vice President & Chief Financial Officer Questions &
Answers 3

Fiscal Year 2015 & Fourth
Quarter Results Key Highlights 4
Fiscal Year 2015 Highlights
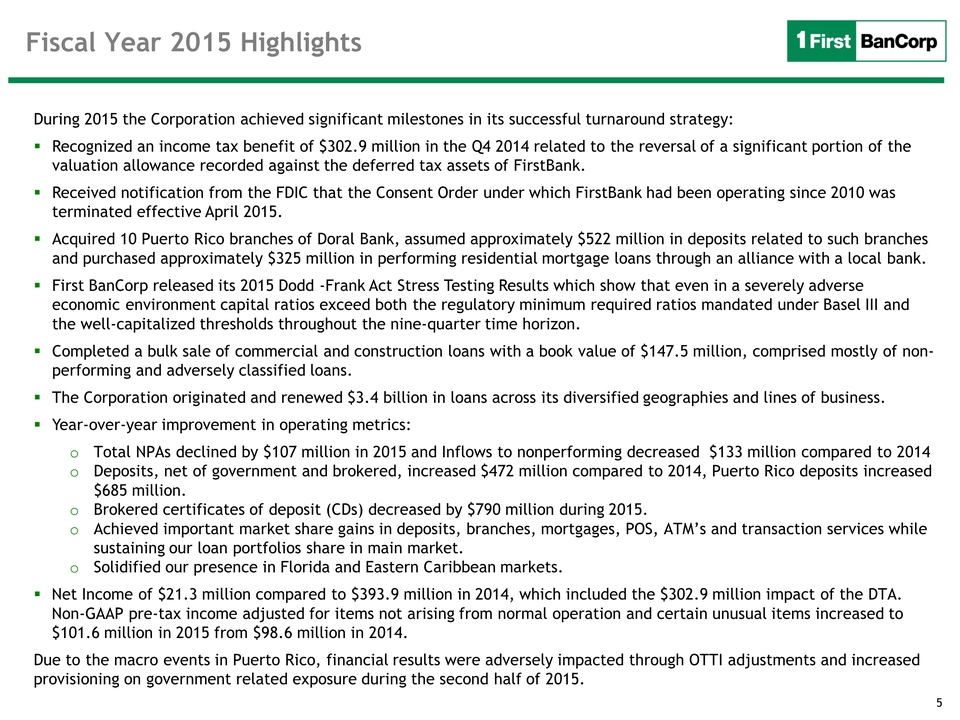
During 2015 the Corporation achieved significant milestones in its
successful turnaround strategy: Recognized an income tax benefit of
$302.9 million in the Q4 2014 related to the reversal of a significant
portion of the valuation allowance recorded against the deferred tax
assets of FirstBank. Received notification from the FDIC that the
Consent Order under which FirstBank had been operating since 2010 was
terminated effective April 2015. Acquired 10 Puerto Rico branches of
Doral Bank, assumed approximately $522 million in deposits related to
such branches and purchased approximately $325 million in performing
residential mortgage loans through an alliance with a local bank. First
BanCorp released its 2015 Dodd -Frank Act Stress Testing Results which
show that even in a severely adverse economic environment capital ratios
exceed both the regulatory minimum required ratios mandated under Basel
III and the well-capitalized thresholds throughout the nine-quarter time
horizon. Completed a bulk sale of commercial and construction loans with
a book value of $147.5 million, comprised mostly of non-performing and
adversely classified loans. The Corporation originated and renewed $3.4
billion in loans across its diversified geographies and lines of
business. Year-over-year improvement in operating metrics: Total NPAs
declined by $107 million in 2015 and Inflows to nonperforming decreased
$133 million compared to 2014 Deposits, net of government and brokered,
increased $472 million compared to 2014, Puerto Rico deposits increased
$685 million. Brokered certificates of deposit (CDs) decreased by $790
million during 2015. Achieved important market share gains in deposits,
branches, mortgages, POS, ATM’s and transaction services while
sustaining our loan portfolios share in main market. Solidified our
presence in Florida and Eastern Caribbean markets. Net Income of $21.3
million compared to $393.9 million in 2014, which included the $302.9
million impact of the DTA. Non-GAAP pre-tax income adjusted for items
not arising from normal operation and certain unusual items increased to
$101.6 million in 2015 from $98.6 million in 2014. Due to the macro
events in Puerto Rico, financial results were adversely impacted through
OTTI adjustments and increased provisioning on government related
exposure during the second half of 2015. 5
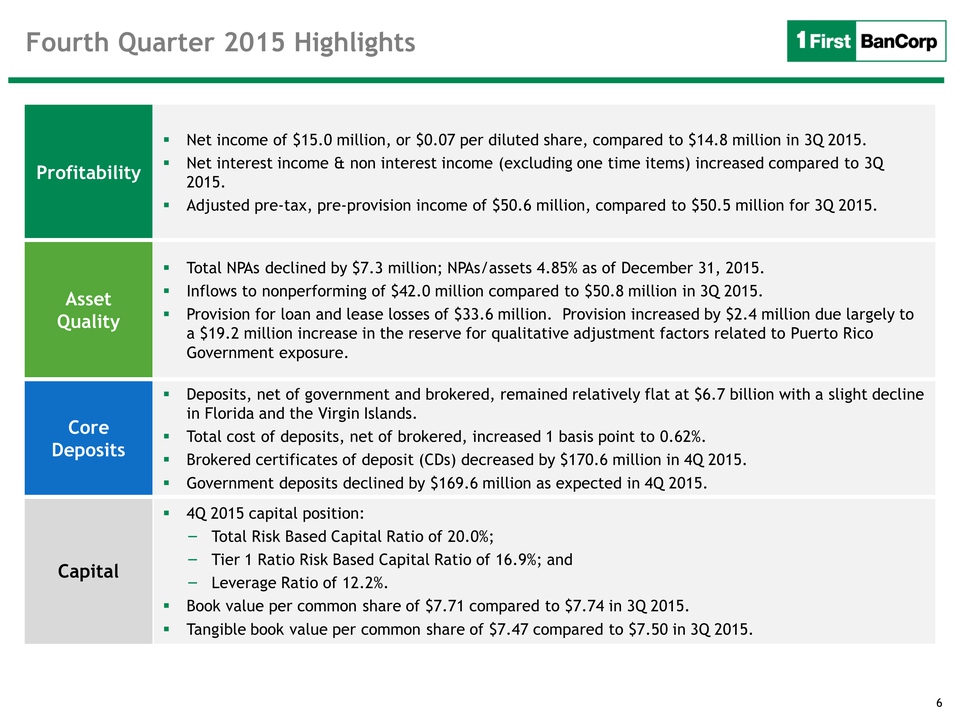
6 Profitability RNet income
of $15.0 million, or $0.07 per diluted share, compared to $14.8 million
in 3Q 2015. Net interest income & non interest income (excluding one
time items) increased compared to 3Q 2015. Adjusted pre-tax,
pre-provision income of $50.6 million, compared to $50.5 million for 3Q
2015. Asset Quality Total NPAs declined by $7.3 million; NPAs/assets
4.85% as of December 31, 2015. Inflows to nonperforming of $42.0 million
compared to $50.8 million in 3Q 2015. Provision for loan and lease
losses of $33.6 million. Provision increased by $2.4 million due largely
to a $19.2 million increase in the reserve for qualitative adjustment
factors related to Puerto Rico Government exposure. Core Deposits
Deposits, net of government and brokered, remained relatively flat at
$6.7 billion with a slight decline in Florida and the Virgin Islands.
Total cost of deposits, net of brokered, increased 1 basis point to
0.62%. Brokered certificates of deposit (CDs) decreased by $170.6
million in 4Q 2015. Government deposits declined by $169.6 million as
expected in 4Q 2015. Capital 4Q 2015 capital position: Total Risk Based
Capital Ratio of 20.0%; Tier 1 Ratio Risk Based Capital Ratio of 16.9%;
and Leverage Ratio of 12.2%. Book value per common share of $7.71
compared to $7.74 in 3Q 2015. Tangible book value per common share of
$7.47 compared to $7.50 in 3Q 2015.
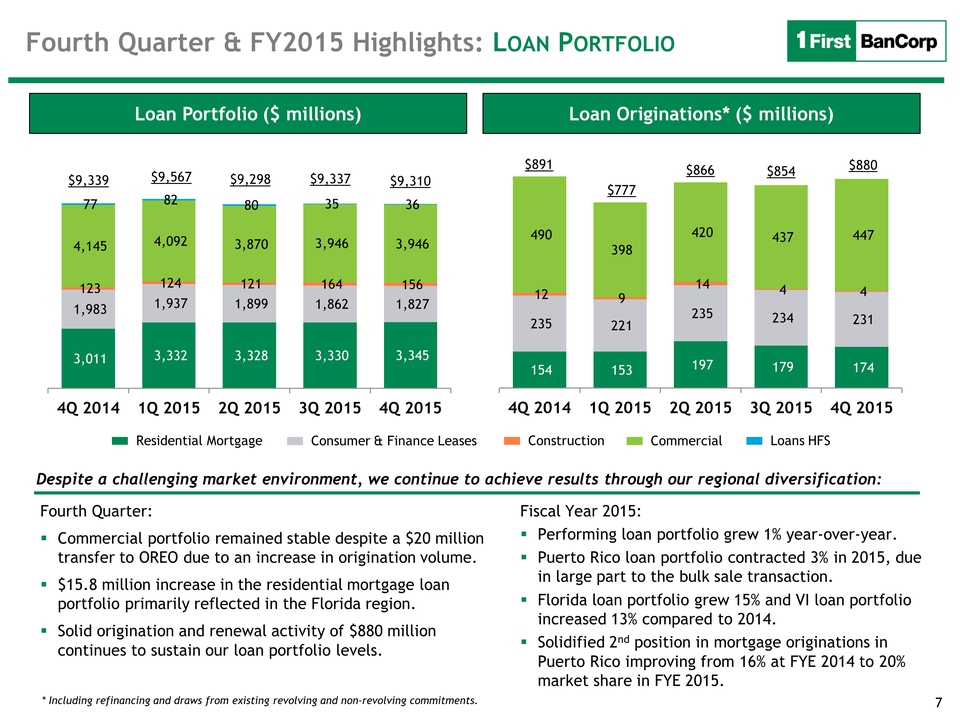
7 Loan Originations* ($
millions) Loan Portfolio ($ millions) 3,011 3,332 3,328 3,330 3,345
1,983 1,937 1,899 1,862 1,827 123 124 121 164 156 4,145 4,092 3,870
3,946 3,946 77 82 80 35 36 4Q 2014 1Q 2015 2Q 2015 3Q 2015 4Q 2015$9,339
$9,567 154 153 197 179 174 235 221 235 234 231 12 9 14 4 4 490 398 420
437 447 4Q 2014 1Q 2015 2Q 2015 3Q 2015 4Q 2015 $880 $891 $777
Residential Mortgage Consumer & Finance Leases Construction Commercial
Loans HFS Fourth Quarter: Commercial portfolio remained stable despite a
$20 million transfer to OREO due to an increase in origination volume.
$15.8 million increase in the residential mortgage loan portfolio
primarily reflected in the Florida region. Solid origination and renewal
activity of $880 million continues to sustain our loan portfolio levels.
Fiscal Year 2015: Performing loan portfolio grew 1% year-over-year.
Puerto Rico loan portfolio contracted 3% in 2015, due in large part to
the bulk sale transaction. Florida loan portfolio grew 15% and VI loan
portfolio increased 13% compared to 2014. Solidified 2nd position in
mortgage originations in Puerto Rico improving from 16% at FYE 2014 to
20% market share in FYE 2015. Despite a challenging market environment,
we continue to achieve results through our regional diversification: *
Including refinancing and draws from existing revolving and
non-revolving commitments. Fourth Quarter & FY2015 Highlights: LOAN
PORTFOLIO $9,298 $866 $9,337 $854 $9,310
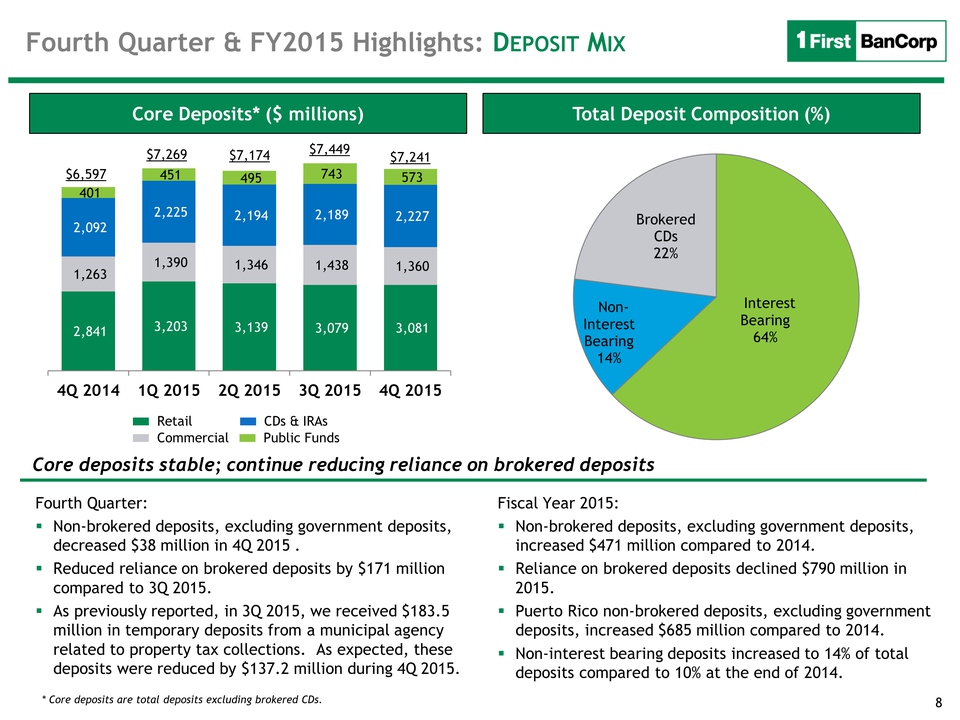
8 Total Deposit Composition
(%) Core Deposits* ($ millions) 2,841 3,203 3,139 3,079 3,081 1,263
1,390 1,346 1,438 1,360 2,092 2,225 2,194 2,189 2,227 401 451 495 743
573 4Q 2014 1Q 2015 2Q 2015 3Q 2015 4Q 2015 * Core deposits are total
deposits excluding brokered CDs. $6,597 $7,269 Interest Bearing 64%
Non-Interest Bearing 14% Brokered CDs 22% Fourth Quarter: Non-brokered
deposits, excluding government deposits, decreased $38 million in 4Q
2015 . Reduced reliance on brokered deposits by $171 million compared to
3Q 2015. As previously reported, in 3Q 2015, we received $183.5 million
in temporary deposits from a municipal agency related to property tax
collections. As expected, these deposits were reduced by $137.2 million
during 4Q 2015. Core deposits stable; continue reducing reliance on
brokered deposits Fourth Quarter & FY2015 Highlights: DEPOSIT MIX Retail
Commercial CDs & IRAs Public Funds $7,174 $7,449 $7,241 Fiscal Year
2015: Non-brokered deposits, excluding government deposits, increased
$471 million compared to 2014. Reliance on brokered deposits declined
$790 million in 2015. Puerto Rico non-brokered deposits, excluding
government deposits, increased $685 million compared to 2014.
Non-interest bearing deposits increased to 14% of total deposits
compared to 10% at the end of 2014.
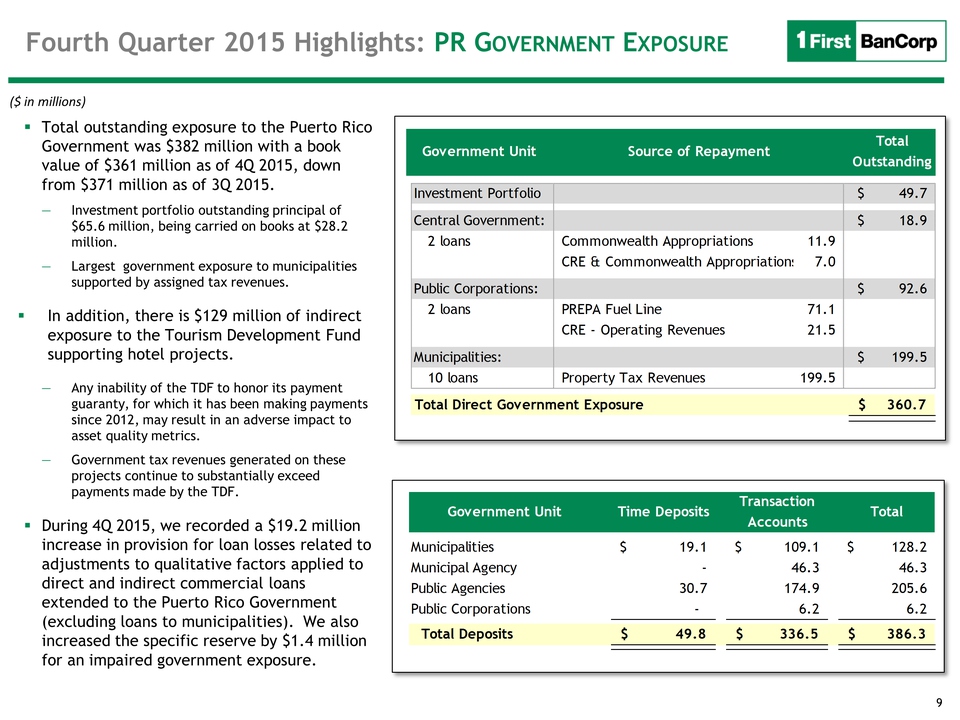
9 Fourth Quarter 2015
Highlights: PR GOVERNMENT EXPOSURE Total outstanding exposure to the
Puerto Rico Government was $382 million with a book value of $361
million as of 4Q 2015, down from $371 million as of 3Q 2015. Investment
portfolio outstanding principal of $65.6 million, being carried on books
at $28.2 million. Largest government exposure to municipalities
supported by assigned tax revenues. In addition, there is $129 million
of indirect exposure to the Tourism Development Fund supporting hotel
projects. Any inability of the TDF to honor its payment guaranty, for
which it has been making payments since 2012, may result in an adverse
impact to asset quality metrics. Government tax revenues generated on
these projects continue to substantially exceed payments made by the
TDF. During 4Q 2015, we recorded a $19.2 million increase in provision
for loan losses related to adjustments to qualitative factors applied to
direct and indirect commercial loans extended to the Puerto Rico
Government (excluding loans to municipalities). We also increased the
specific reserve by $1.4 million for an impaired government exposure. ($
in millions) Investment Portfolio49.7$ Central Government:18.9$ 2
loans11.97.0Public Corporations:92.6$ 2 loans71.1CRE - Operating
Revenues21.5Municipalities:199.5$ 10 loans199.5Total Direct Government
Exposure360.7$ Government UnitSource of RepaymentTotal
OutstandingProperty Tax RevenuesCommonwealth AppropriationsCRE &
Commonwealth AppropriationsPREPA Fuel LineGovernment UnitTime
DepositsTransaction AccountsTotalMunicipalities19.1$ 109.1$ 128.2$
Municipal Agency- 46.3 46.3 Public Agencies30.7 174.9 205.6 Public
Corporations- 6.2 6.2 Total Deposits49.8$ 336.5$ 386.3

10 Fourth Quarter
ResultsResults of Operations
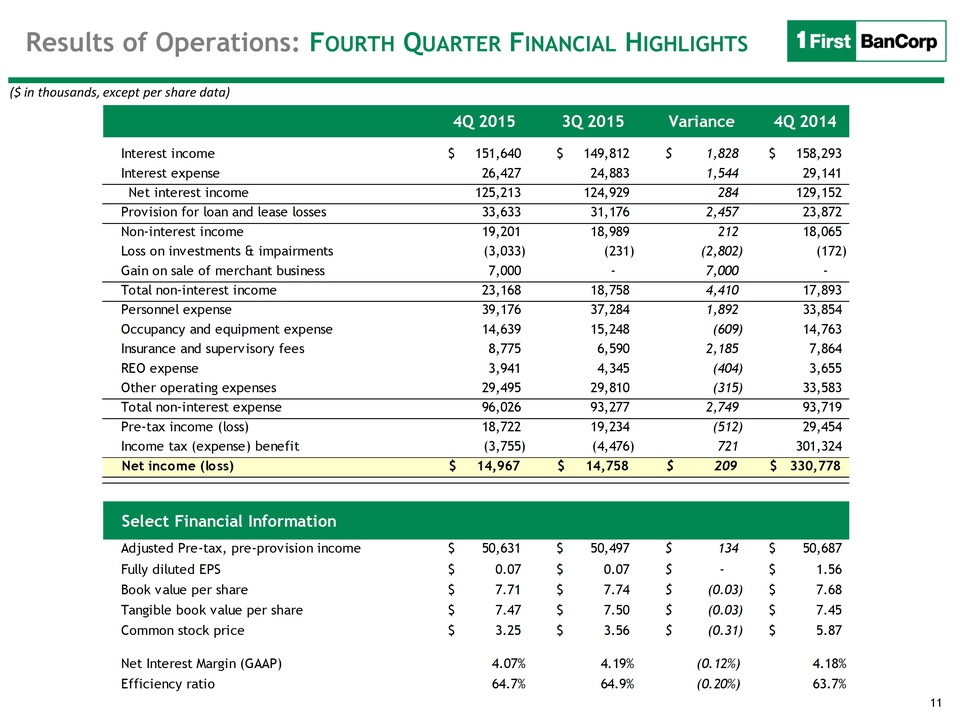
11 Results of Operations:
FOURTH QUARTER FINANCIAL HIGHLIGHTS ($ in thousands, except per share
data) Select Financial Information 4Q 20153Q 2015Variance4Q 2014Interest
income151,640$ 149,812$ 1,828$ 158,293$ Interest expense26,427 24,883
1,544 29,141 Net interest income125,213 124,929 284 129,152 Provision
for loan and lease losses33,633 31,176 2,457 23,872 Non-interest
income19,201 18,989 212 18,065 Loss on investments & impairments(3,033)
(231) (2,802) (172) Gain on sale of merchant business7,000 - 7,000 -
Total non-interest income23,168 18,758 4,410 17,893 Personnel
expense39,176 37,284 1,892 33,854 Occupancy and equipment expense14,639
15,248 (609) 14,763 Insurance and supervisory fees8,775 6,590 2,185
7,864 REO expense3,941 4,345 (404) 3,655 Other operating expenses29,495
29,810 (315) 33,583 Total non-interest expense96,026 93,277 2,749 93,719
Pre-tax income (loss)18,722 19,234 (512) 29,454 Income tax (expense)
benefit(3,755) (4,476) 721 301,324 Net income (loss)14,967$ 14,758$ 209$
330,778$ Select Financial InformationAdjusted Pre-tax, pre-provision
income50,631$ 50,497$ 134$ 50,687$ Fully diluted EPS0.07$ 0.07$ -$ 1.56$
Book value per share7.71$ 7.74$ (0.03)$ 7.68$ Tangible book value per
share7.47$ 7.50$ (0.03)$ 7.45$ Common stock price3.25$ 3.56$ (0.31)$
5.87$ Net Interest Margin (GAAP)4.07%4.19%(0.12%)4.18%Efficiency
ratio64.7%64.9%(0.20%)63.7%
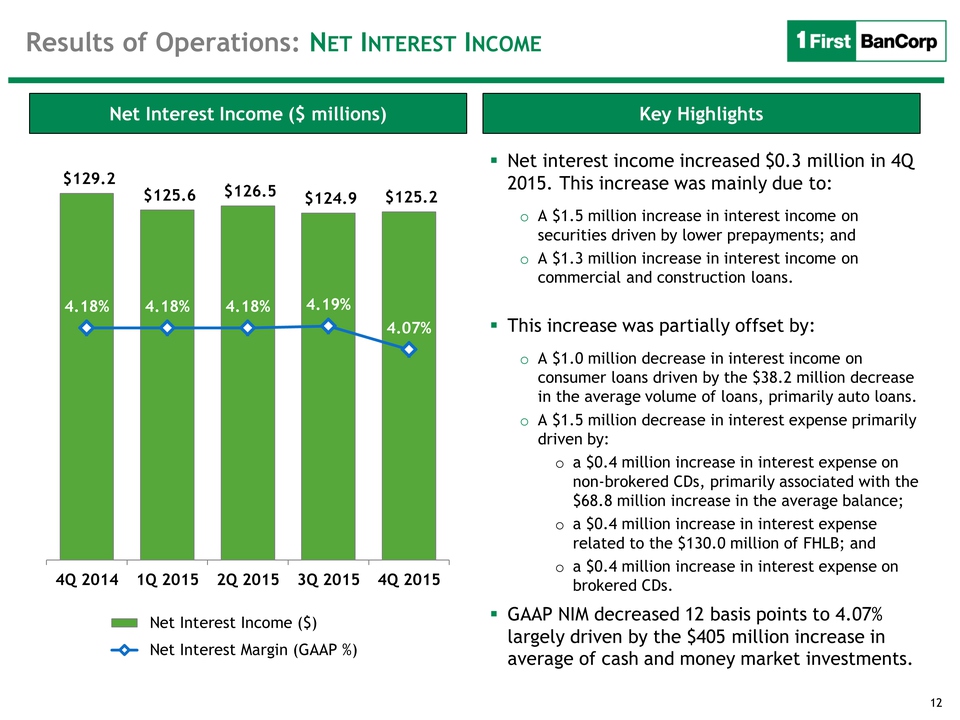
12 Key Highlights Net
Interest Income ($ millions) $129.2 $125.6 $126.5 $124.9 $125.2 4.18%
4.18% 4.18% 4.19% 4.07% 4Q 2014 1Q 2015 2Q 2015 3Q 2015 4Q 2015 Net
Interest Income ($) Net Interest Margin (GAAP %) Net interest income
increased $0.3 million in 4Q 2015. This increase was mainly due to: oA
$1.5 million increase in interest income on securities driven by lower
prepayments; and oA $1.3 million increase in interest income on
commercial and construction loans. This increase was partially offset
by: oA $1.0 million decrease in interest income on consumer loans driven
by the $38.2 million decrease in the average volume of loans, primarily
auto loans. oA $1.5 million decrease in interest expense primarily
driven by: oa $0.4 million increase in interest expense on non-brokered
CDs, primarily associated with the $68.8 million increase in the average
balance; oa $0.4 million increase in interest expense related to the
$130.0 million of FHLB; and oa $0.4 million increase in interest expense
on brokered CDs. GAAP NIM decreased 12 basis points to 4.07% largely
driven by the $405 million increase in average of cash and money market
investments. Results of Operations: NET INTEREST INCOME
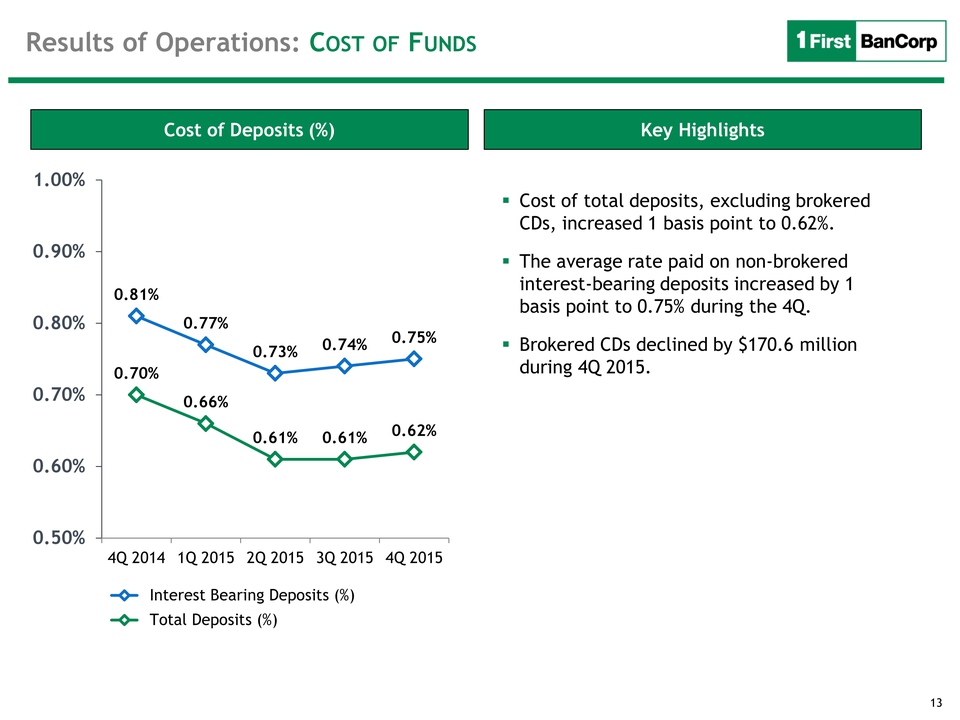
13 Key Highlights Cost of
Deposits (%) 0.81% 0.77% 0.73% 0.74% 0.75% 0.70% 0.66% 0.61% 0.61% 0.62%
0.50% 0.60% 0.70% 0.80% 0.90% 1.00% 4Q 2014 1Q 2015 2Q 2015 3Q 2015 4Q
2015 Interest Bearing Deposits (%) Total Deposits (%) Cost of total
deposits, excluding brokered CDs, increased 1 basis point to 0.62%. The
average rate paid on non-brokered interest-bearing deposits increased by
1 basis point to 0.75% during the 4Q. Brokered CDs declined by $170.6
million during 4Q 2015. Results of Operations: COST OF FUNDS
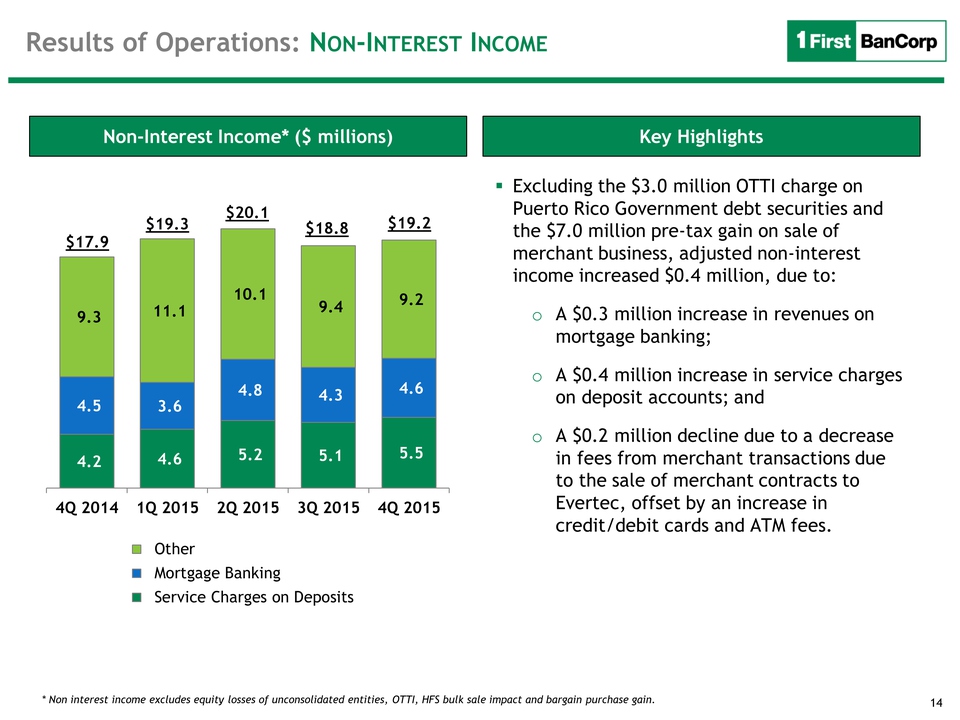
14 Key Highlights
Non-Interest Income* ($ millions) 4.2 4.6 5.2 5.1 5.5 4.5 3.6 4.8 4.3
4.6 9.3 11.1 10.1 9.4 9.2 4Q 2014 1Q 2015 2Q 2015 3Q 2015 4Q 2015 Other
Mortgage Banking Service Charges on Deposits* Non interest income
excludes equity losses of unconsolidated entities, OTTI, HFS bulk sale
impact and bargain purchase gain. Excluding the $3.0 million OTTI charge
on Puerto Rico Government debt securities and the $7.0 million pre-tax
gain on sale of merchant business, adjusted non-interest income
increased $0.4 million, due to: oA $0.3 million increase in revenues on
mortgage banking; oA $0.4 million increase in service charges on deposit
accounts; and oA $0.2 million decline due to a decrease in fees from
merchant transactions due to the sale of merchant contracts to Evertec,
offset by an increase in credit/debit cards and ATM fees. $19.2 $17.9
$19.3 Results of Operations: NON-INTEREST INCOME $20.1 $18.8
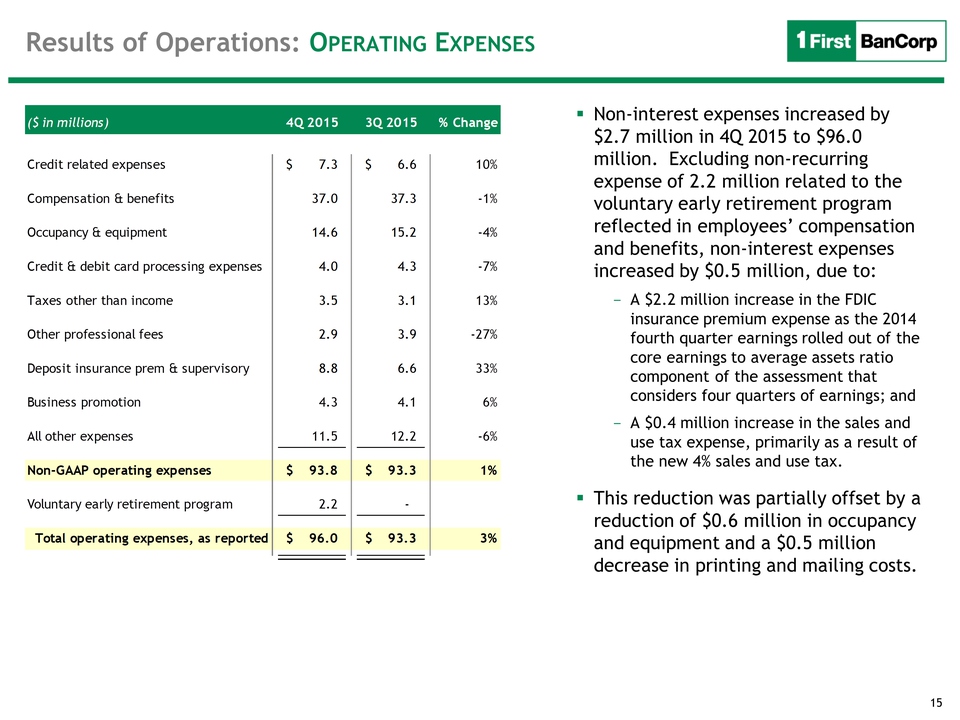
15 Results of Operations:
OPERATING EXPENSES Non-interest expenses increased by $2.7 million in 4Q
2015 to $96.0 million. Excluding non-recurring expense of 2.2 million
related to the voluntary early retirement program reflected in
employees’ compensation and benefits, non-interest expenses increased by
$0.5 million, due to: A $2.2 million increase in the FDIC insurance
premium expense as the 2014 fourth quarter earnings rolled out of the
core earnings to average assets ratio component of the assessment that
considers four quarters of earnings; and A $0.4 million increase in the
sales and use tax expense, primarily as a result of the new 4% sales and
use tax. This reduction was partially offset by a reduction of $0.6
million in occupancy and equipment and a $0.5 million decrease in
printing and mailing costs. ($ in millions)4Q 20153Q 2015% ChangeCredit
related expenses7.3$ 6.6$ 10%Compensation & benefits37.0 37.3
-1%Occupancy & equipment14.6 15.2 -4%Credit & debit card processing
expenses4.0 4.3 -7%Taxes other than income3.5 3.1 13%Other professional
fees2.9 3.9 -27%Deposit insurance prem & supervisory8.8 6.6 33%Business
promotion4.3 4.1 6%All other expenses11.5 12.2 -6%Non-GAAP operating
expenses93.8$ 93.3$ 1%Voluntary early retirement program 2.2 - Total
operating expenses, as reported96.0$ 93.3$ 3%
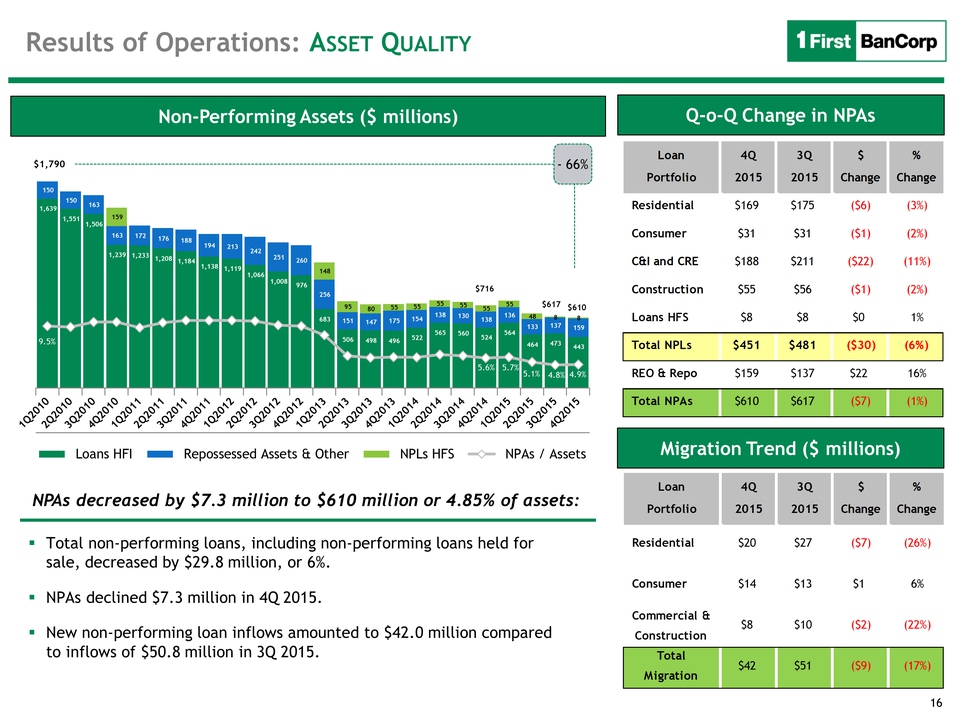
16 Non-Performing Assets ($
millions) Total non-performing loans, including non-performing loans
held for sale, decreased by $29.8 million, or 6%. NPAs declined $7.3
million in 4Q 2015. New non-performing loan inflows amounted to $42.0
million compared to inflows of $50.8 million in 3Q 2015. NPAs decreased
by $7.3 million to $610 million or 4.85% of assets: Results of
Operations: ASSET QUALITY Q-o-Q Change in NPAs Migration Trend ($
millions) 1,639 1,551 1,506 1,239 1,233 1,208 1,184 1,138 1,119 1,066
1,008 976 683 506 498 496 522 565 560 524 564 464 473 443 150 150 163
163 172 176 188 194 213 242 251 260 256 151 147 175 154 138 130 138 136
133 137 159 159 148 95 80 55 55 55 55 55 55 48 8 8 9.5% 5.6% 5.7% 5.1%
4.8% 4.9% Loans HFI Repossessed Assets & Other NPLs HFS NPAs /
Assets$1,790 $610 $716 $617 - 66% Loan4 Q3Q$% Portfolio 20152015Change
ChangeResidential $169$175($6)(3%) Consumer $31 $31($1)(2%)C&I and
CRE$188 $211 ($22)(11%) Construction $55$56($1)(2%) Loans
HFS$8$8$01%Total NPLs$451$481($30)(6%)REO & Repo$159$137$2216%Total
NPAs$610$617($7)(1%)Loan4Q3Q$%Portfolio20152015ChangeChangeResidential$20$27($7)(26%)Consumer$14$13$16%$8$10($2)(22%)$42$51($9)(17%)
Commercial & Construction Total Migration
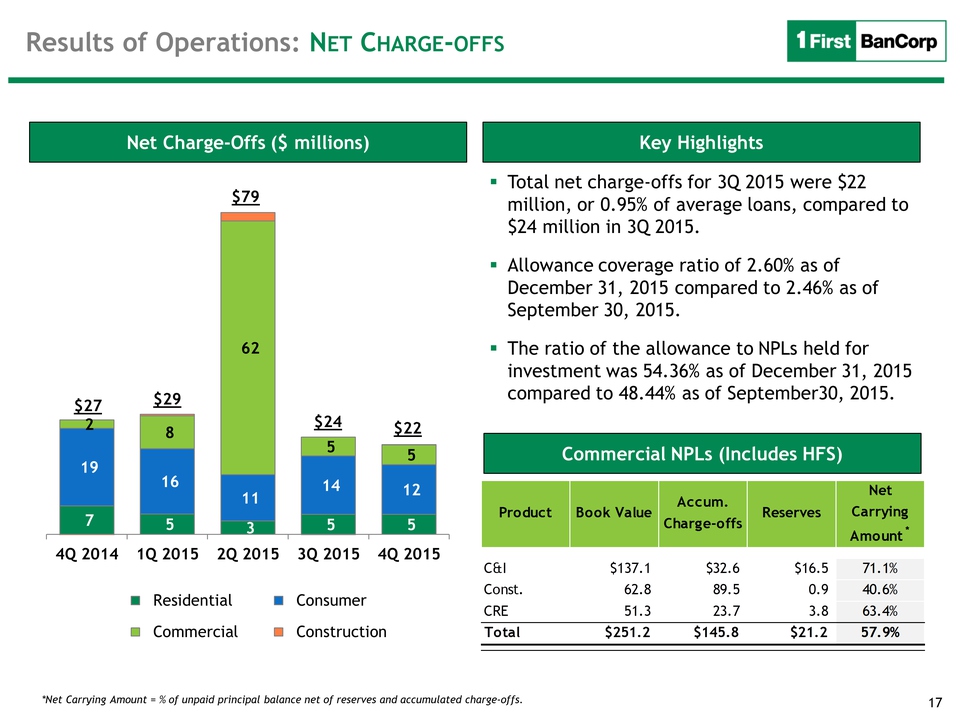
17 Key Highlights Net
Charge-Offs ($ millions) 7 5 3 5 5 19 16 11 14 12 2 8 62 5 5 4Q 2014 1Q
2015 2Q 2015 3Q 2015 4Q 2015 Residential Consumer Commercial
Construction$22 Total net charge-offs for 3Q 2015 were $22 million, or
0.95% of average loans, compared to $24 million in 3Q 2015. Allowance
coverage ratio of 2.60% as of December 31, 2015 compared to 2.46% as of
September 30, 2015. The ratio of the allowance to NPLs held for
investment was 54.36% as of December 31, 2015 compared to 48.44% as of
September30, 2015. $27 $29 Commercial NPLs (Includes HFS) *Net Carrying
Amount = % of unpaid principal balance net of reserves and accumulated
charge-offs. Results of Operations: NET CHARGE-OFFS $79 $24 ProductBook
ValueAccum. Charge-offsReservesNet Carrying Amount
*C&I$137.1$32.6$16.571.1%Const.62.8 89.5 0.9 40.6%CRE51.3 23.7 3.8
63.4%Total$251.2$145.8$21.257.9%
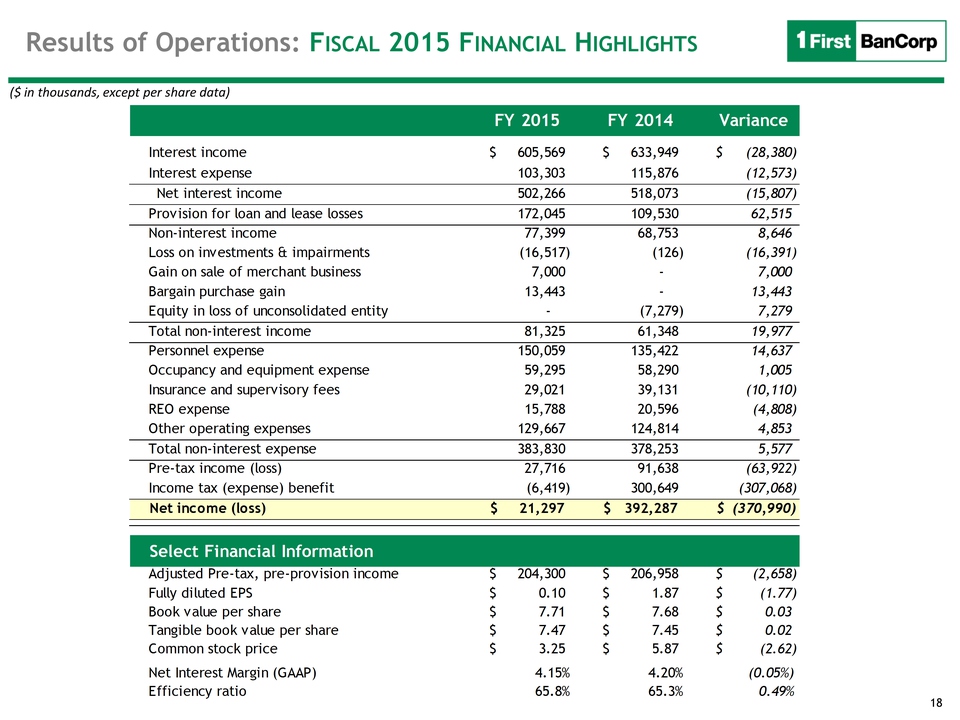
18 Results of Operations:
FISCAL 2015 FINANCIAL HIGHLIGHTS ($ in thousands, except per share data)
Select Financial Information FY 2015FY 2014VarianceInterest
income605,569$ 633,949$ (28,380)$ Interest expense103,303 115,876
(12,573) Net interest income502,266 518,073 (15,807) Provision for loan
and lease losses172,045 109,530 62,515 Non-interest income77,399 68,753
8,646 Loss on investments & impairments(16,517) (126) (16,391) Gain on
sale of merchant business7,000 - 7,000 Bargain purchase gain13,443 -
13,443 Equity in loss of unconsolidated entity- (7,279) 7,279 Total
non-interest income81,325 61,348 19,977 Personnel expense150,059 135,422
14,637 Occupancy and equipment expense59,295 58,290 1,005 Insurance and
supervisory fees29,021 39,131 (10,110) REO expense15,788 20,596 (4,808)
Other operating expenses129,667 124,814 4,853 Total non-interest
expense383,830 378,253 5,577 Pre-tax income (loss)27,716 91,638 (63,922)
Income tax (expense) benefit(6,419) 300,649 (307,068) Net income
(loss)21,297$ 392,287$ (370,990)$ Select Financial InformationAdjusted
Pre-tax, pre-provision income204,300$ 206,958$ (2,658)$ Fully diluted
EPS0.10$ 1.87$ (1.77)$ Book value per share7.71$ 7.68$ 0.03$ Tangible
book value per share7.47$ 7.45$ 0.02$ Common stock price3.25$ 5.87$
(2.62)$ Net Interest Margin (GAAP)4.15%4.20%(0.05%)Efficiency
ratio65.8%65.3%0.49%
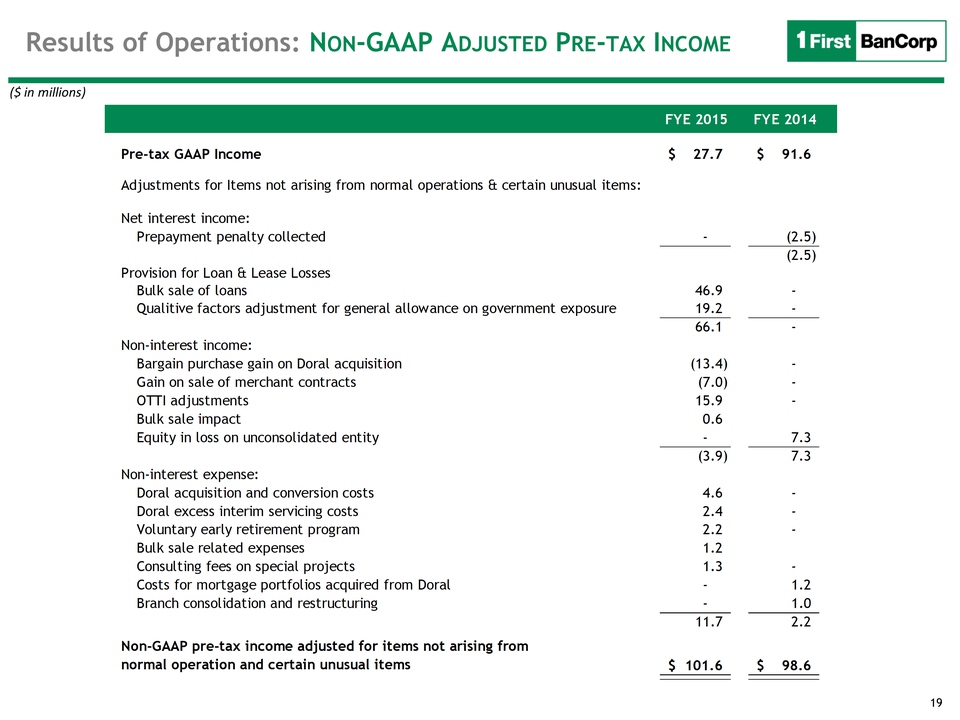
19 ($ in millions) Select
Financial Information Results of Operations: NON-GAAP ADJUSTED PRE-TAX
INCOME FYE 2015FYE 2014Pre-tax GAAP Income27.7$ 91.6$ Adjustments for
Items not arising from normal operations & certain unusual items:Net
interest income: Prepayment penalty collected- (2.5) (2.5) Provision for
Loan & Lease Losses Bulk sale of loans46.9 - Qualitive factors
adjustment for general allowance on government exposure19.2 - 66.1 -
Non-interest income: Bargain purchase gain on Doral acquisition(13.4) -
Gain on sale of merchant contracts(7.0) - OTTI adjustments15.9 - Bulk
sale impact0.6 Equity in loss on unconsolidated entity- 7.3 (3.9) 7.3
Non-interest expense: Doral acquisition and conversion costs4.6 - Doral
excess interim servicing costs2.4 - Voluntary early retirement
program2.2 - Bulk sale related expenses1.2 Consulting fees on special
projects1.3 - Costs for mortgage portfolios acquired from Doral- 1.2
Branch consolidation and restructuring- 1.0 11.7 2.2 Non-GAAP pre-tax
income adjusted for items not arising from normal operation and certain
unusual items101.6$ 98.6$
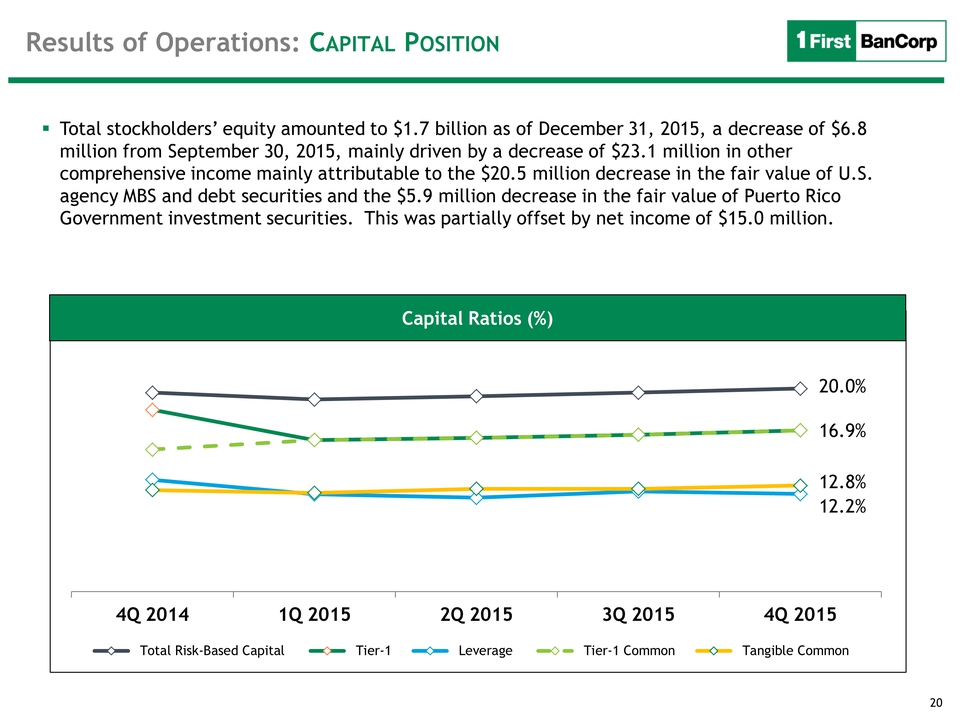
20 Results of Operations:
CAPITAL POSITION Capital Ratios (%) Total stockholders’ equity amounted
to $1.7 billion as of December 31, 2015, a decrease of $6.8 million from
September 30, 2015, mainly driven by a decrease of $23.1 million in
other comprehensive income mainly attributable to the $20.5 million
decrease in the fair value of U.S. agency MBS and debt securities and
the $5.9 million decrease in the fair value of Puerto Rico Government
investment securities. This was partially offset by net income of $15.0
million. Capital Ratios (%) 20.0% 12.2% 16.9% 12.8% 4Q 2014 1Q 2015 2Q
2015 3Q 2015 4Q 2015 Total Risk-Based Capital Tier-1 Leverage Tier-1
Common Tangible Common
21 Fiscal Year 2015 &
Fourth Quarter Results Q & A

22 Fourth Quarter Results
exhibits
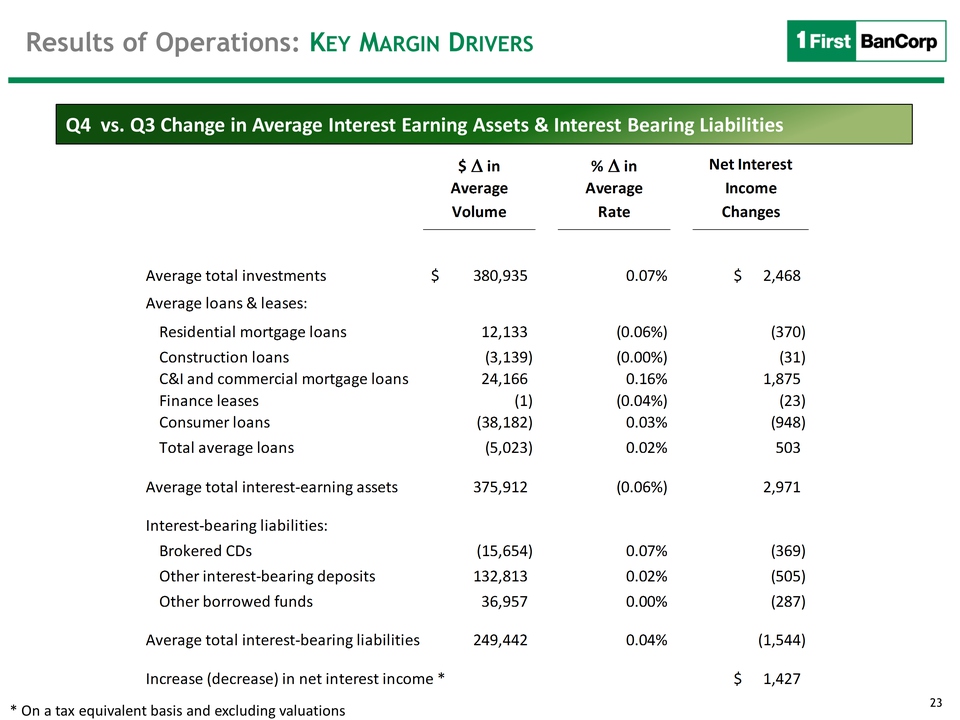
23 Results of Operations:
KEY MARGIN DRIVERS Q4 vs. Q3 Change in Average Interest Earning Assets &
Interest Bearing Liabilities * On a tax equivalent basis and excluding
valuations $ Δ in % Δ in AverageAverageVolumeRateAverage total
investments380,935$ 0.07%2,468$ Average loans & leases:Residential
mortgage loans12,133 (0.06%)(370) Construction loans(3,139) (0.00%)(31)
C&I and commercial mortgage loans24,166 0.16%1,875 Finance leases(1)
(0.04%)(23) Consumer loans(38,182) 0.03%(948) Total average loans(5,023)
0.02%503 Average total interest-earning assets375,912 (0.06%)2,971
Interest-bearing liabilities:Brokered CDs(15,654) 0.07%(369) Other
interest-bearing deposits132,813 0.02%(505) Other borrowed funds36,957
0.00%(287) Average total interest-bearing liabilities249,442
0.04%(1,544) Increase (decrease) in net interest income *1,427$ Net
InterestIncomeChangesExhibits
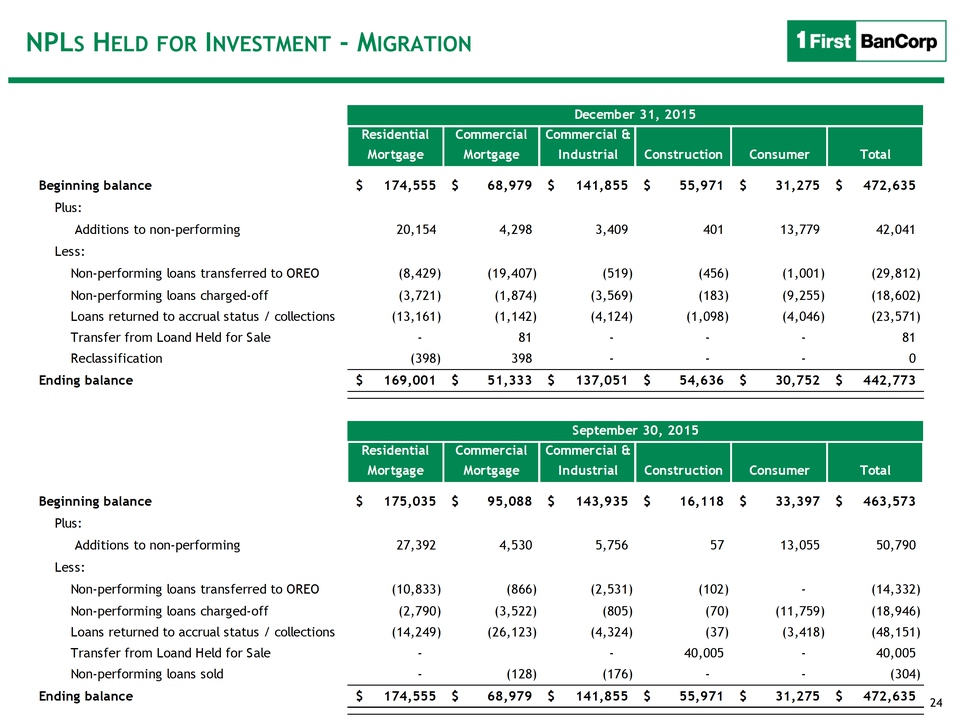
24 NPLS HELD FOR INVESTMENT
- MIGRATION Residential MortgageCommercial MortgageCommercial &
IndustrialConstructionConsumerTotalBeginning balance174,555$ 68,979$
141,855$ 55,971$ 31,275$ 472,635$ Plus: Additions to
non-performing20,154 4,298 3,409 401 13,779 42,041 Less: Non-performing
loans transferred to OREO(8,429) (19,407) (519) (456) (1,001) (29,812)
Non-performing loans charged-off(3,721) (1,874) (3,569) (183) (9,255)
(18,602) Loans returned to accrual status / collections(13,161) (1,142)
(4,124) (1,098) (4,046) (23,571) Transfer from Loand Held for Sale- 81 -
- - 81 Reclassification(398) 398 - - - 0 Ending balance169,001$ 51,333$
137,051$ 54,636$ 30,752$ 442,773$ Residential MortgageCommercial
MortgageCommercial & IndustrialConstructionConsumerTotalBeginning
balance175,035$ 95,088$ 143,935$ 16,118$ 33,397$ 463,573$ Plus:
Additions to non-performing27,392 4,530 5,756 57 13,055 50,790 Less:
Non-performing loans transferred to OREO(10,833) (866) (2,531) (102) -
(14,332) Non-performing loans charged-off(2,790) (3,522) (805) (70)
(11,759) (18,946) Loans returned to accrual status / collections(14,249)
(26,123) (4,324) (37) (3,418) (48,151) Transfer from Loand Held for
Sale- - 40,005 - 40,005 Non-performing loans sold- (128) (176) - - (304)
Ending balance174,555$ 68,979$ 141,855$ 55,971$ 31,275$ 472,635$
December 31, 2015September 30, 2015
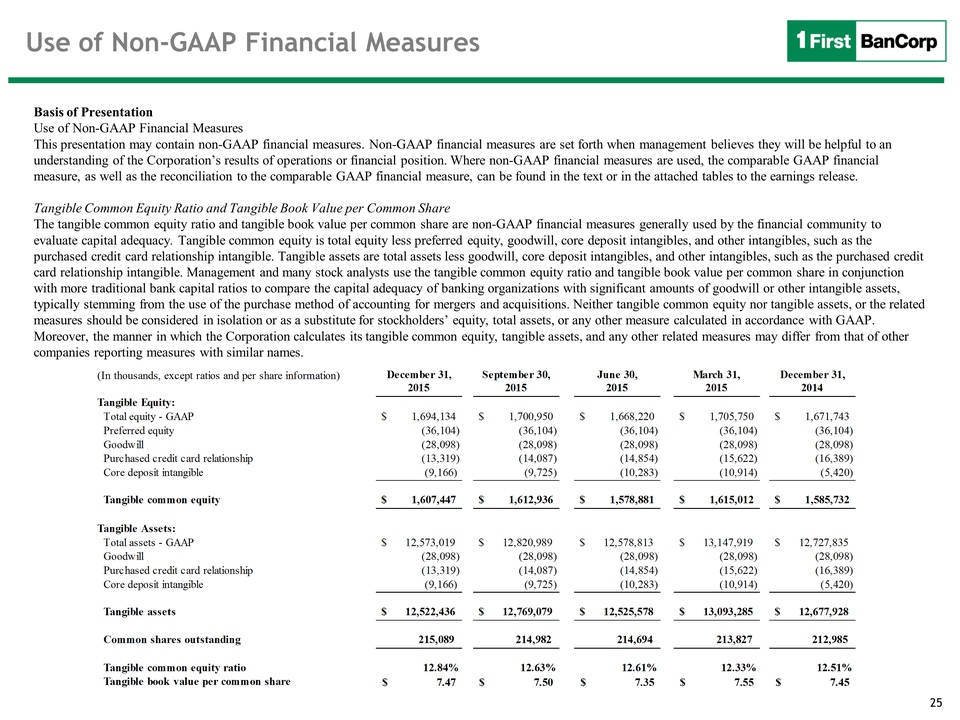
25 Use of Non-GAAP
Financial Measures Basis of Presentation Use of Non-GAAP Financial
Measures This presentation may contain non-GAAP financial measures.
Non-GAAP financial measures are set forth when management believes they
will be helpful to an understanding of the Corporation’s results of
operations or financial position. Where non-GAAP financial measures are
used, the comparable GAAP financial measure, as well as the
reconciliation to the comparable GAAP financial measure, can be found in
the text or in the attached tables to the earnings release. Tangible
Common Equity Ratio and Tangible Book Value per Common Share The
tangible common equity ratio and tangible book value per common share
are non-GAAP financial measures generally used by the financial
community to evaluate capital adequacy. Tangible common equity is total
equity less preferred equity, goodwill, core deposit intangibles, and
other intangibles, such as the purchased credit card relationship
intangible. Tangible assets are total assets less goodwill, core deposit
intangibles, and other intangibles, such as the purchased credit card
relationship intangible. Management and many stock analysts use the
tangible common equity ratio and tangible book value per common share in
conjunction with more traditional bank capital ratios to compare the
capital adequacy of banking organizations with significant amounts of
goodwill or other intangible assets, typically stemming from the use of
the purchase method of accounting for mergers and acquisitions. Neither
tangible common equity nor tangible assets, or the related measures
should be considered in isolation or as a substitute for stockholders’
equity, total assets, or any other measure calculated in accordance with
GAAP. Moreover, the manner in which the Corporation calculates its
tangible common equity, tangible assets, and any other related measures
may differ from that of other companies reporting measures with similar
names. (In thousands, except ratios and per share information)December
31,September 30,June 30,March 31,December 31,20152015201520152014Total
equity - GAAP $ 1,694,134 $ 1,700,950 $ 1,668,220 $ 1,705,750 $
1,671,743 Preferred equity (36,104)(36,104)(36,104)(36,104)
(36,104)Goodwill (28,098)(28,098)(28,098)(28,098)(28,098) Purchased
credit card relationship (13,319) (14,087) (14,854) (15,622)
(16,389)Core deposit intangible (9,166) (9,725)(10,283)(10,914)
(5,420)Tangible common equity $ 1,607,447 $ 1,612,936 $ 1,578,881 $
1,615,012 $ 1,585,732 Total assets - GAAP $ 12,573,019 $ 12,820,989 $
12,578,813 $ 13,147,919 $ 12,727,835
Goodwill(28,098)(28,098)(28,098)(28,098)(28,098)Purchased credit card
relationship (13,319) (14,087) (14,854) (15,622) (16,389)Core deposit
intangible (9,166) (9,725)(10,283) (10,914)(5,420)Tangible assets $
12,522,436 $ 12,769,079 $ 12,525,578 $ 13,093,285 $ 12,677,928 Common
shares outstanding 215,089 214,982 214,694 213,827 212,985 Tangible
common equity ratio12.84%12.63%12.61%12.33%12.51%Tangible book value per
common share7.47$ 7.50$ 7.35$ 7.55$ 7.45$ Tangible Equity:Tangible
Assets:
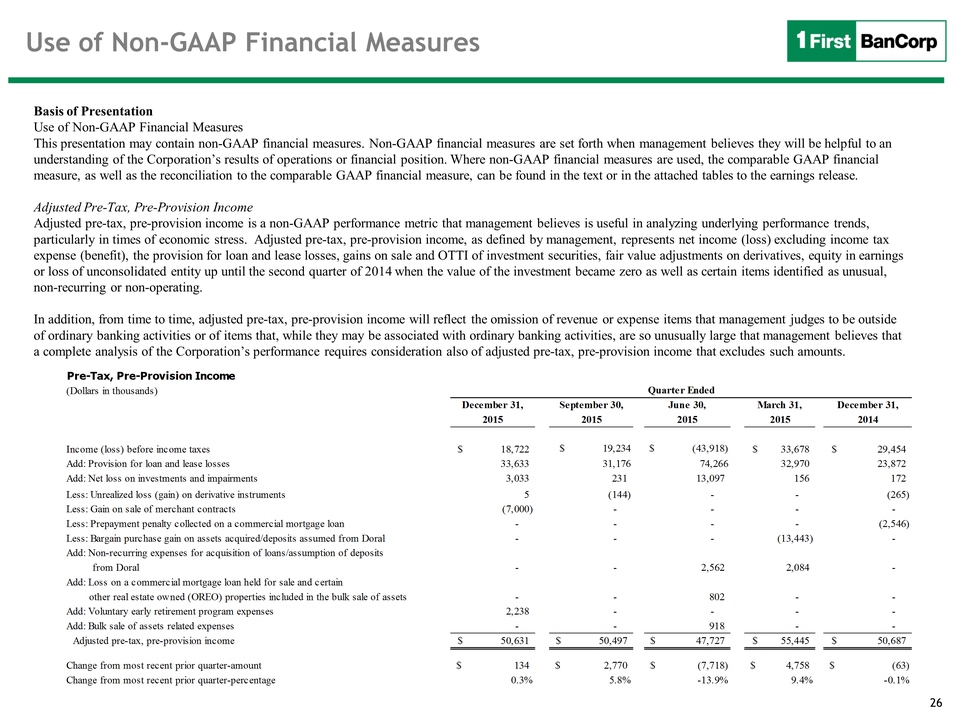
26 Use of Non-GAAP
Financial Measures Basis of Presentation Use of Non-GAAP Financial
Measures This presentation may contain non-GAAP financial measures.
Non-GAAP financial measures are set forth when management believes they
will be helpful to an understanding of the Corporation’s results of
operations or financial position. Where non-GAAP financial measures are
used, the comparable GAAP financial measure, as well as the
reconciliation to the comparable GAAP financial measure, can be found in
the text or in the attached tables to the earnings release. Adjusted
Pre-Tax, Pre-Provision Income Adjusted pre-tax, pre-provision income is
a non-GAAP performance metric that management believes is useful in
analyzing underlying performance trends, particularly in times of
economic stress. Adjusted pre-tax, pre-provision income, as defined by
management, represents net income (loss) excluding income tax expense
(benefit), the provision for loan and lease losses, gains on sale and
OTTI of investment securities, fair value adjustments on derivatives,
equity in earnings or loss of unconsolidated entity up until the second
quarter of 2014 when the value of the investment became zero as well as
certain items identified as unusual, non-recurring or non-operating. In
addition, from time to time, adjusted pre-tax, pre-provision income will
reflect the omission of revenue or expense items that management judges
to be outside of ordinary banking activities or of items that, while
they may be associated with ordinary banking activities, are so
unusually large that management believes that a complete analysis of the
Corporation’s performance requires consideration also of adjusted
pre-tax, pre-provision income that excludes such amounts. Pre-Tax,
Pre-Provision Income(Dollars in thousands)December 31,September 30,June
30,March 31,December 31,20152015201520152014Income (loss) before income
taxes 18,722$ $ 19,234 $ (43,918)33,678$ 29,454$ Add: Provision for loan
and lease losses33,633 31,17674,26632,970 23,872 Add: Net loss on
investments and impairments3,033 231 13,097 156 172 Less: Unrealized
loss (gain) on derivative instruments 5 (144) - - (265) Less: Gain on
sale of merchant contracts(7,000) - - - - Less: Prepayment penalty
collected on a commercial mortgage loan - - - - (2,546) Less: Bargain
purchase gain on assets acquired/deposits assumed from Doral - - -
(13,443) - Add: Non-recurring expenses for acquisition of
loans/assumption of deposits from Doral- - 2,562 2,084 - Add: Loss on a
commercial mortgage loan held for sale and certain other real estate
owned (OREO) properties included in the bulk sale of assets - - 802 - -
Add: Voluntary early retirement program expenses2,238 - - - - Add: Bulk
sale of assets related expenses- - 918 - - Adjusted pre-tax,
pre-provision income50,631$ 50,497$ 47,727$ 55,445$ 50,687$ Change from
most recent prior quarter-amount134$ 2,770$ (7,718)$ 4,758$ (63)$ Change
from most recent prior quarter-percentage0.3%5.8%-13.9%9.4%-0.1%Quarter
Ended