Attached files
UNITED STATES SECURITIES AND EXCHANGE COMMISSION
Washington, D.C. 20549
________________________________________________________________________________________________________________________
FORM 10-K
þ ANNUAL REPORT PURSUANT TO SECTION 13 or 15(d) OF THE SECURITIES EXCHANGE ACT OF 1934
FOR THE FISCAL YEAR ENDED DECEMBER 31, 2015
OR
o TRANSITION REPORT PURSUANT TO SECTION 13 or 15(d)
OF THE SECURITIES EXCHANGE ACT OF 1934
________________________________________________________________________________________________________________________
Commission File Number 1-13884
CAMERON INTERNATIONAL CORPORATION
(Exact name of Registrant as specified in its charter)
Delaware | 76-0451843 | |
(State or other jurisdiction of incorporation or organization) | (I.R.S. Employer Identification No.) | |
1333 West Loop South | ||
Suite 1700 | ||
Houston, Texas | 77027 | |
(Address of principal executive offices) | (Zip Code) | |
Registrant’s telephone number, including area code (713) 513-3300
SECURITIES REGISTERED PURSUANT TO SECTION 12(b) OF THE ACT:
Title of Each Class | Name of Each Exchange on Which Registered | |
Common Stock, Par Value $0.01 Per Share | New York Stock Exchange | |
Indicate by check mark if the registrant is a well-known seasoned issuer, as defined in Rule 405 of the Securities Act.
Yes þ No o
Indicate by check mark if the registrant is not required to file reports pursuant to Section 13 or Section 15(d) of the Act.
Yes o No þ
Indicate by check mark whether the registrant (1) has filed all reports required to be filed by Section 13 or 15(d) of the Securities Exchange Act of 1934 during the preceding 12 months (or for such shorter period that the registrant was required to file such reports), and (2) has been subject to such filing requirements for the past 90 days.
Yes þ No o
Indicate by check mark whether the registrant has submitted electronically and posted on its corporate Web site, if any, every Interactive Data File required to be submitted and posted pursuant to Rule 405 of Regulation S-T (§232.405 of this chapter) during the preceding 12 months (or for such shorter period that the registrant was required to submit and post such files).
Yes þ No o
Indicate by check mark if disclosure of delinquent filers pursuant to Item 405 of Regulation S-K (§229.405 of this chapter) is not contained herein, and will not be contained, to the best of registrant’s knowledge, in definitive proxy or information statements incorporated by reference in Part III of this Form 10-K or any amendment to this Form 10-K. o
Indicate by check mark whether the registrant is a large accelerated filer, an accelerated filer, a non-accelerated filer, or a smaller reporting company. See definitions of “large accelerated filer”, “accelerated filer” and “smaller reporting company” in Rule 12b-2 of the Exchange Act. (Check one):
Large accelerated filer þ | Accelerated filer o |
Non-accelerated filer o (Do not check if a smaller reporting company) | Smaller reporting company o |
Indicate by check mark whether the registrant is a shell company (as defined in Rule 12b-2 of the Exchange Act). Yes o No þ
The aggregate market value of the Common Stock, par value $0.01 per share, held by non-affiliates of the registrant as of June 30, 2015, our most recently completed second fiscal quarter, was approximately $8,048,562,581. For purposes of the determination of the above statement amount only, all the directors and executive officers of the registrant are presumed to be affiliates. The number of shares of Common Stock, par value $.01 per share, outstanding as of January 15, 2016 was 191,599,032.
________________________________________________________________________________________________________________________
DOCUMENTS INCORPORATED BY REFERENCE
Portions of the registrant’s 2016 Proxy Statement for the Annual Meeting of Stockholders are incorporated by reference into Part III.
TABLE OF CONTENTS
ITEM | PAGE | |
PART I | ||
1. | ||
1A. | ||
1B. | ||
2. | ||
3. | ||
4. | ||
PART II | ||
5. | ||
6. | ||
7. | ||
7A. | ||
8. | ||
9. | ||
9A. | ||
9B. | ||
PART III | ||
10. | ||
11. | ||
12. | ||
13. | ||
14. | ||
PART IV | ||
15. | ||
2
PART I
GLOSSARY OF TERMS
Actuator. A hydraulic or electric motor used to open or close valves.
Blowout Preventer or BOP. A hydraulically operated system of safety valves installed at the wellhead during drilling and completion operations for the purpose of preventing an increase of high-pressure formation fluids — oil, gas or water — in the wellbore from turning into a “blowout” of the well.
BOP stack. A set of two or more BOPs used to ensure pressure control of a well. A typical stack configuration has the ram BOPs on the bottom and the annular BOPs at the top. Ram BOPs consist of two halves of a cover known as ram blocks that are forced together by hydraulic cylinders to seal the wellbore, in some cases by shearing through the drillpipe. Annular BOPs contain a sealing element which resembles a large rubber doughnut that is mechanically squeezed inward to seal on either the drillpipe, casing or the open hole.
Casing. Large-diameter pipe lowered into an open hole and cemented in place.
Choke. A type of valve used to control the rate and pressure of the flow of production from a well or through flowlines.
Christmas tree. An assembly of valves, pipes and fittings used to control the flow of oil and gas from a well.
Controls. A device which allows the remote triggering of an actuator to open or close a valve.
Drawworks. The machine on the rig consisting of a large-diameter steel spool, brakes, a power source and assorted auxiliary devices. The primary function of the drawworks is to reel out and reel in the drilling line, a large diameter wire rope, in a controlled fashion.
Drilling stack. A vertical arrangement of blowout prevention equipment installed at the top of the casing at a wellhead to provide maximum pressure integrity in the event of a well control incident for drilling and completion operations.
Elastomer. A rubberized pressure control sealing element used in drilling and wellhead applications.
Manifold. An arrangement of piping or valves designed to control, distribute and often monitor fluid flow.
Reservoir. A subsurface body of rock having sufficient porosity and permeability to store and transmit fluids.
Riser. Pipe used to connect the wellbore of offshore wells to drilling or production equipment on the surface, and through which drilling fluids or hydrocarbons travel.
Semisubmersible. A particular type of floating vessel that is supported primarily on large pontoon-like structures submerged below the sea surface.
Subsea tree. An assembly of valves, actuators and ancillary equipment connected to the top of the casing of a well located on the sea floor to direct and control the flow of oil and gas from the well.
Topdrive. A device that turns the drillstring.
Valve. A device used to control the rate of flow in a line, to open or shut off a line completely, or to serve as an automatic or semi-automatic safety device.
Wellhead. The equipment installed at the surface of a wellbore to maintain control of a well and including equipment such as the casing head, tubing head and Christmas tree.
3
ITEM 1. BUSINESS
Cameron International Corporation (Cameron or the Company) provides flow equipment products, systems and services to worldwide oil and gas industries through four reporting segments – Subsea, Surface, Drilling and Valves & Measurement (V&M). For additional business segment information for each of the three years in the period ended December 31, 2015, see Note 16 of the Notes to Consolidated Financial Statements, which Notes are included in Part II, Item 8 of this Annual Report on Form 10-K.
In 1920, Jim Abercrombie, Ed Lorehn, Harry Cameron and several other partners incorporated an oilfield repair shop in Houston, Texas under the name Cameron Iron Works (CIW). Abercrombie subsequently invented and CIW manufactured the industry’s first blowout preventer for use in oil and gas well drilling. CIW grew rapidly due to sales of blowout preventers and other oilfield equipment. In the early 1940’s, CIW entered the market for defense-related equipment becoming a major supplier of anti-submarine and other naval armaments to the U.S. Navy. CIW also became a leading supplier of forged metal products for both defense and oilfield applications replacing less durable cast metal components of the day. CIW subsequently expanded into various other flow control, valve and pressure control equipment businesses acquiring Joy Petroleum Equipment and McEvoy-Willis wellhead equipment prior to its acquisition by Cooper Industries, Inc. in 1989.
Cameron was incorporated in its current form as a Delaware corporation on November 10, 1994, when Cooper Industries transferred all of the assets and liabilities of its Petroleum and Industrial Equipment segment into this new entity. Following this, the Company operated as a wholly-owned subsidiary of Cooper Industries from 1994 until June 30, 1995, when it was spun-off as a separate stand-alone company and renamed Cooper Cameron Corporation. The Company subsequently changed its name to Cameron International Corporation in May 2006. Since becoming a stand-alone company, Cameron has made numerous acquisitions, including the 1996 acquisition of Ingram Cactus Company, the 1998 acquisition of Orbit Valve International, Inc., 2004’s acquisition of Petreco International, Inc., the purchase of substantially all of the businesses within the Flow Control segment of Dresser, Inc. in 2005, the acquisition of NATCO Group Inc. (NATCO) in 2009 and the acquisition of the TTS Energy Division from TTS Group, ASA in 2012. In 2013, Cameron and Schlumberger Limited joined together to form OneSubsea, a venture established to manufacture and develop products, systems and services for the subsea oil and gas market. Cameron is a 60% owner and manager of OneSubsea. Cameron has also sold various operations during the time it has been a stand-alone company, including its Reciprocating Compression business in June 2014 and its Centrifugal Compression business, which closed effective January 1, 2015.
On August 26, 2015, Cameron and Schlumberger Limited ("Schlumberger") announced that the companies had entered into an Agreement and Plan of Merger (the “Merger Agreement”) whereby a U.S. subsidiary of Schlumberger would acquire all of the issued and outstanding stock of Cameron. Under the terms of the agreement, Cameron shareholders will receive 0.716 shares of Schlumberger common stock and a cash payment of $14.44 in exchange for each Cameron common share. The Merger Agreement was unanimously approved by the board of directors of both companies and has been approved by Cameron's stockholders. The Merger will be consummated upon receipt of required regulatory consents and approvals, expected to occur during the first quarter of 2016. Schlumberger stockholders are not required to vote on the Merger Agreement. Should Cameron terminate the Merger Agreement in specified circumstances, the Company would be required to pay Schlumberger a termination fee equal to $321 million.
In advance of the anticipated closing of the merger with Schlumberger, the Company has continued to operate as a separate publicly traded company bound by all of the obligations, practices and requirements associated therewith. Specifically, the common stock of Cameron has continued to trade on the New York Stock Exchange under the symbol “CAM”. The Company’s Internet address is www.c-a-m.com. General information about Cameron, including its Corporate Governance Principles, charters for the committees of the Company’s board of directors, Code of Conduct, and Codes of Ethics for Management Personnel, including Senior Financial Officers, and Directors, has been maintained in the Governance and Compliance sections of the Company’s website. The Company has made available on its website its annual reports on Form 10-K, quarterly reports on Form 10-Q, current reports on Form 8-K and amendments to those reports filed or furnished pursuant to Section 13(a) or 15(d) of the Securities and Exchange Act of 1934, as amended (the Exchange Act) as soon as reasonably practicable after the Company electronically files or furnishes them to the United States Securities and Exchange Commission (the SEC). Information filed by the Company with the SEC is also available at www.sec.gov or may be read and copied at the SEC’s Public Reference Room at 100 F Street, NE, Washington, DC 20549. Information regarding operations of the Public Reference Room may be obtained by calling the SEC at 1-800-SEC-0330.
Any reference to Cameron, its segments or other businesses within this Form 10-K as being a leader, leading provider, leading manufacturer, or having a leading position is based on the amount of equipment installed worldwide and available industry data.
4
Markets and Products
Subsea Segment
The Subsea segment delivers integrated solutions, technologies, products, systems and services to the subsea oil and gas market, including petrotechnical services, flow assurance consulting, subsea production systems wellheads, subsea trees, manifolds and flowline connectors, subsea processing systems for the enhanced recovery of hydrocarbons, swivel and marine systems, metering systems, control systems, connectors and subsea services designed to maximize reservoir recovery and extend the life of each field. The Subsea segment includes the operations of OneSubsea, a business jointly owned by Cameron (60%) and Schlumberger (40%). Products and services are marketed under the Cameron®, OneSubsea®, FasTrac™, HyFleX, FRIEND™, and MARS™ brand names, among others, through a worldwide network of sales and marketing employees, supported by agents in some international locations. The Company’s custom process systems products are marketed under the Cameron®, Consept™, Cynara®, Hydromation®, KCC™, Metrol™, Mozley®, NATCO®, Petreco®, Porta-test®, Unicel™, and Vortoil® brand names, among others. Due to the technical nature of many of the products offered and the complexity of the subsea field layouts and designs, the marketing effort is further supported by a staff of engineering employees.
On January 6, 2015, the Company announced the execution of definitive agreements between OneSubsea, Helix Energy Solutions Group, Inc. and Schlumberger for a non-incorporated alliance formed to develop technologies and to deliver equipment and services designed to provide customers with more cost effective and more efficient subsea well intervention solutions, particularly for deep and ultra-deepwater basins and high well pressure environments.
Surface Segment
Cameron’s Surface segment designs and manufactures complete wellhead and Christmas tree systems for onshore and offshore topside applications – from conventional to high-pressure, high temperature systems, to specialized systems for dry completions and heavy oil. The Surface segment, with its extensive global installed base of equipment, is the industry’s largest provider of surface completion and production equipment and has a large services footprint in each of its served markets. A complete portfolio of API 6A valves, chokes and actuators is marketed primarily to oil and gas operators under the Cameron®, Camrod™, IC™, McEvoy®, Tundra™, Willis® and WKM® brand names, among others.
One of the major services provided by the Surface segment is CAMSHALE™ production solutions, which specializes in shale oil and natural gas production. CAMSHALE products and services offered in multi-stage fracturing operations include time savings wellhead systems, reliable frac trees and manifolds, an innovative frac fluid delivery system called Monoline™, equipment for flowback and well testing, and production.
New technology developments and increased market penetration, along with robust customer spending in recent years for exploration and production, particularly within unconventional resource regions of North America, contributed to an increase in demand for the Company’s equipment and services during 2013 and 2014.
Drilling Segment
The Drilling segment of Cameron is one of the leading global suppliers of integrated drilling systems for onshore and offshore applications to shipyards, drilling contractors, exploration and production companies and rental tool companies. Drilling equipment that is designed and manufactured includes ram and annular BOPs, control systems, drilling risers, drilling valves, choke and kill manifolds, diverter systems, top drives, drawworks, mud pumps, pipe handling equipment, other rig products and parts and services. The products are marketed by a staff of sales and marketing employees and agents supported by an engineering group under the Cameron®, EVO®, H&H CUSTOM™, H&H Melco™, LeTourneau®, Sense™ and Townsend™ brand names, among others.
The Drilling segment significantly enhanced its product offerings to its customers with the mid-2012 acquisition of TTS Energy Division from TTS Group ASA, a Norwegian company (TTS). TTS provides high performance drilling equipment in the form of drilling equipment packages or capital equipment sales for both onshore and offshore rigs internationally.
Cameron’s Drilling segment continues to be a primary supplier of BOPs and related equipment to the drilling industry. The level of major project awards for new drilling equipment is often influenced by construction cycles for new build deepwater drillships and semi-submersibles, as well as shallow water jack-up rigs. In recent years, the level of such awards was strong during the 2006 – 2008 and 2011 – 2013 time periods. Currently, there is virtually no market for new jackup or deepwater drillships and semi-submersibles due to a significant oversupply of such rigs.
5
Valves & Measurement Segment
The V&M segment provides valves and measurement systems primarily used to control, direct and measure the flow of oil and gas as they are moved from individual wellheads through flow lines, gathering lines and transmission systems to refineries, petrochemical plants and industrial centers for processing. Equipment used in these environments is generally required to meet demanding standards set by the American Petroleum Institute and the American Society of Mechanical Engineers.
Products include gate valves, ball valves, butterfly valves, Orbit® rising stem ball valves, double block & bleed valves, plug valves, globe valves, check valves, actuators, chokes and parts and services, as well as measurement products such as totalizers, turbine meters, flow computers, chart recorders, ultrasonic flow meters and sampling systems.
This equipment and the related services are marketed through a worldwide network of combined sales and marketing employees, as well as distributors and agents in selected international locations. Due to the technical nature of many of the products, the marketing effort is further supported by a staff of engineering employees. Customers include oil and gas majors, independent producers, engineering and construction companies, pipeline operators, drilling contractors and major chemical, petrochemical and refining companies.
The product lines included in this segment are as follows:
Valves & Automation
Valves and Automation products are sold into the exploration, production, subsea, transmission and storage and liquefied natural gas (LNG) markets, primarily in North America and to upstream markets in Asia-Pacific, Africa and the Middle East. In order to expand the Company’s downstream industrial valve offerings, Douglas Chero, a forged gate, globe and check valve manufacturer located in Italy, was acquired during 2013.
Valves and Automation products are marketed under the brand names AOP™, Demco®, Douglas Chero™, Dynatorque™, Maxtorque™, Navco®, Newco®, Nutron®, OIC®, Techno™, Texstream™, Thornhill Craver®, Wheatley®, WKM®, Cameron®, Entech™, Grove®, Ledeen™, Ring-O®, TK®, General Valve®, Orbit® and TBV™, among others.
Measurement Systems -
The V&M segment also designs, manufactures and distributes measurement products, systems and solutions to the global oil and gas, process and power industries. Brand names for these products include Barton®, Caldon®, Clif Mock™, Jiskoot™, Linco™ and Nuflo™.
Services -
In addition to the above, V&M provides preventative maintenance, OEM spare parts, repair, field service, asset management and remanufactured products for valves and actuators through service centers situated in strategic locations around the world.
Market Issues
The success of hydraulic fracturing activities in recent years has led to increased supplies of oil and natural gas in North America. This, combined with various other factors such as, (i) strong production levels from the Organization of Petroleum Exporting Countries (OPEC) and certain other resource-rich countries, (ii) weakness in world demand for petroleum due to slowing economic growth in certain regions, and (iii) the strong U.S. dollar, in which a significant portion of world trade in petroleum products occurs, has contributed to a dramatic decline in commodity prices which began during the latter half of 2014, and has continued through early 2016. The Company cannot predict the timing of improvement in market conditions.
The weakness in commodity prices had an unfavorable impact on demand across all of our major product and service offerings, with resulting significant declines in the Company's orders, revenues, earnings, and backlog. Based on the Company’s long history in the energy sector, we believe such declines in commodity prices and demand are cyclical in nature. During such cyclical downturns, we take steps to adjust our commercial, manufacturing and support operations as appropriate to ensure that the Company remains competitive and financially sound.
During 2015, and despite adverse market conditions, Cameron continued to maintain a leadership position in the global market for the supply of oilfield equipment and service due in part to it broad array of technologically-advanced pressure-control products and its international network of plant and service center facilities that provide broad market coverage of the world’s major oil and gas producing regions. Cameron believes that it is well-positioned to serve these markets, even during downturns. Plant and service center facilities around the world in major oil and gas producing regions provide broad market coverage. Information relating to revenues generated from shipments to various geographic regions of the world is set forth on page 23
6
of “Management’s Discussion and Analysis of Financial Condition and Results of Operations of Cameron International Corporation” included in Part II, Item 7 of this Annual Report on Form 10-K and incorporated herein by reference. The markets beyond North America were important to Cameron in 2015, accounting for nearly 62% of the Company's revenues, down from 64% in 2014 and up from 61% in 2013.
The Company provides its products and services for both onshore and offshore applications. In 2015, approximately 49% of the Company's revenue was derived from the offshore market, as compared to 62% in 2014.
Also, see Part I, Item 1A for a discussion of other risk factors, some of which are market related, that could affect the Company’s financial condition and future results.
New Product Development
For the years ended December 31, 2015, 2014 and 2013, research and product development expenditures, including amounts incurred on projects designed to enhance or add to its existing product offerings, totaled approximately $140 million, $128 million and $83 million, respectively. The Subsea segment accounted for 52%, 58% and 44% of each respective year’s total costs.
On January 6, 2015, the Company announced the execution of definitive agreements between OneSubsea, Helix Energy Solutions Group, Inc. and Schlumberger for a non-incorporated alliance formed to develop technologies and to deliver equipment and services designed to provide customers with more cost effective and more efficient subsea well intervention solutions, particularly for deep and ultra-deepwater basins and high well pressure environments.
Cameron has also provided funding for university research in both the United States and Brazil for the development of advanced materials that dampen vibration that could be caused by ocean currents in subsea environments. Cameron's researchers have also worked with a variety of technical partners around the world in developing elastomer seals that perform better in low temperature, high pressure environments.
OneSubsea continues to focus on new technology development in areas such as life of field services, processing, controls, optimization and high pressure and high temperature applications and in the integration of subsea and subsurface technologies to increase recovery and lower intervention costs. For example, in the summer of 2015 OneSubsea delivered the world's first successful subsea compressor for deployment in the Gullfaks field in Norway. The system consisted of a 420-ton protective structure, a compressor station with two 5-megawatt compressors totaling 650 tonnes, and all necessary topsides equipment for power supply and control of the system. This system is expected by our customer to increase the recovery rate from Gullfaks South Brent from 63% to 73%.
Monoethylene glycol (MEG) reclamation technology is a continued focus for product improvement and enhancement in the Subsea segment. The latest generation of Cameron’s brine displacement solution was launched in 2013 as PureMEG®. The latest developments include divalent salt removal systems and improved salt management processes. These enhancements are targeted to provide better reliability and OPEX.
The CDX Compact Deaeration technology was launched by the Subsea segment during 2015. This packed bed reactor solution is designed to provide substantial space and weight savings as compared to traditional vacuum deaeration solutions utilized offshore for seawater flooding. This is the result of a 3 year development that is in the final stage of field demonstration testing.
Over the last three years, Cameron’s Surface segment has developed a number of products to serve the hydraulic fracturing (frac) market. The F-T90 horizontal frac tree is ultra-compact in design to reduce frac stack height. In 2014, Cameron expanded the F-T90™ fleet to include 5” 15,000-psi trees in both Canada and the U.S. The Monoline™ Frac Fluid Delivery System (FFDS) eliminates a significant number of frac iron connections, eliminates the need for expensive safety strapping, reduces footprint and reduces wellsite clutter for added safety benefits. Cameron’s rotating casing hanger facilitates running the casing string in highly deviate wells, reducing both rig time and the risk of stuck pipe. The tension hanger designed by Cameron allows for the tubing string to be pulled straighter on completion to allow for artificial lift solutions that are required later for almost all shale wells. Throughout the life of the frac wells, the new CAM20-MT™ Interchanger Multi-Trim choke provides a cost-effective solution that allows fast actuated adjustments to keep up with changing well conditions and is designed for fast and easy replacement of internals if they get damaged by sand or proppant.
During 2011, the Company’s Drilling segment delivered the industry’s first and only 13⅝” 25,000-psi BOP stack for use in a high-pressure application in the Gulf of Mexico. In 2009, the Drilling segment introduced, in another first, an 18¾” 20,000-psi BOP stack, which had the characteristics of reduced height and weight found in the EVO® BOP that was introduced in 2007 as a compact, lighter version of Cameron’s traditional subsea BOP. Also during 2008, the Company introduced the Sea Pressure Accumulator™ (SPA™), a complement to the EVO BOP, which uses seawater pressure instead of traditional nitrogen-charged
7
accumulator bottles to power the BOP rams. In 2012, Cameron developed a derivative system of SPA called Sea Pressure Reduction Assembly (SPRA™), which reduces hydrostatic seawater effects on the EVO BOP operating system. This, in turn, makes more efficient use of existing accumulator capacity. Another highlight of 2012 was the development of the stab-in connection system (STiCS™). The STiCS system provides an automated means of safely and quickly connecting heavy choke and kill hoses to the riser slip joint which saves hours of rig time.
In addition, the Company's Drilling segment introduced the Mark IV™ HA control systems and Mark IV control POD. The Mark IV system – featuring an industry-first three-POD design option – improves operational reliability of the drilling system through redundancy and simplified POD design. Each control POD within the system has also been improved to include 33% more available functions to accommodate eighty-cavity stacks, a 50% reduction in internal tubing to reduce leak paths, and a 26% smaller footprint than its predecessor.
The Company's V&M segment continues to develop products focused on serving its upstream, midstream, and downstream customers. Cameron engineers have worked with its technology partners to develop solutions for the most challenging of environments and applications. For example, in 2014 Cameron extended the capability of its Grove B4 and B5 product lines to accommodate low temperature critical service applications down to -120°C. Additionally, there is continued focus on subsea 15k HPHT applications. In 2015, a suite of sealing technologies were developed capable of withstanding temperatures up to 400°F.
In 2015, V&M continued to add to its leading quarter turn product portfolio when it launched the WKM Triple Offset Butterfly valve to service its downstream market segments. The true triple offset geometry of this valve allows for bubble-tight sealing to create a fully bi-directional, zero-leakage shut-off valve to API 598 requirements for the power and steam, petrochemical, tank and terminal, upstream production, refining, and gas processing markets, in addition to other industrial applications. The reliable performance of this valve aims to reduce customers’ OPEX spend in critical applications.
Competition
Cameron competes in all areas of its operations with a number of other companies, some of which have financial and other resources comparable to or greater than those of Cameron.
Cameron has a leading position in the petroleum oil field equipment markets. In these markets, Cameron competes principally with Balon Corporation, Circor International, Inc., Dover Corporation, Dril-Quip, Inc., Emerson Process Management, FlowServ Corp., FMC Technologies, Inc., GE Oil & Gas Group, Master Flo (a Stream-Flo Industries Ltd. company), National Oilwell Varco Inc., PBV-USA, Inc. (a Zy-Tech Global Industries company), Petrovalve (a Flotek Industries, Inc. company), Pibiviese, Robbins & Myers Fluid Management Group, SPX Corporation’s Flow Technology Segment, and Tyco International Ltd.
The principal competitive factors in the oil field equipment markets are technology, quality, service and price. Cameron believes several factors give it a strong competitive position in these markets. Most significant are Cameron’s broad product offering, its worldwide presence and reputation, its service and repair capabilities, its expertise in high-pressure technology and its experience in alliance and partnership arrangements with customers and other suppliers.
Manufacturing
Cameron has manufacturing facilities worldwide that conduct a broad variety of processes, including machining, fabrication, assembly and testing, using a variety of forged and cast alloyed steels and stainless steel as the primary raw materials. Cameron has, at various times, rationalized plants and products, closed various manufacturing facilities, moved product lines to achieve economies of scale, and upgraded other facilities. Cameron maintains advanced manufacturing, quality assurance and testing equipment geared to the specific products that it manufactures and uses process automation in its manufacturing operations.
Cameron’s test capabilities are critical to its overall processes. The Company has the capability to test most equipment at rated operating conditions, measuring all operating parameters, efficiency and emissions.
All of Cameron’s Asian, European and Latin American manufacturing plants are ISO certified and API licensed, and most of the U.S. plants are ISO certified. ISO is an internationally recognized verification system for quality management.
Backlog
Cameron’s backlog was approximately $6.6 billion at December 31, 2015 (approximately 51% of which is expected to be shipped during 2016), as compared to $9.5 billion at December 31, 2014, and $11.1 billion at December 31, 2013. Backlog consists of customer orders for which a purchase order or contract has been received, satisfactory credit or financing arrangements exist and delivery is scheduled.
8
Patents, Trademarks and Other Intellectual Property
As part of its ongoing research, development and manufacturing activities, Cameron seeks patents, when appropriate, to protect its inventions. Cameron owns 620 active United States patents and 1,135 active non-U.S. patents. During 2015, Cameron filed 221 U.S. and 281 non-U.S. patent applications.
Although, in the aggregate, these patents are of considerable importance to the provision of many of Cameron's products and services, Cameron does not consider any single patent or group of patents to be material to its business as a whole.
Trademarks are also of considerable importance to the marketing of Cameron’s products. Cameron considers the CAMERON® trademark to be important to its business as a whole. Other important trademarks used by Cameron are included under “Markets and Products” above. Cameron has registered trademarks in countries where such registration is deemed important.
Cameron also relies on trade secret protection for its confidential and proprietary information. To protect its information, Cameron routinely enters into confidentiality agreements with its employees, partners and suppliers, for example. There can be no assurance, however, that others will not independently obtain similar information or otherwise gain access to Cameron’s trade secrets.
Employees
As of December 31, 2015, Cameron had approximately 23,000 employees, of which nearly 21% were represented by labor unions.
Over 2,200 employees are covered by union contracts which are slated to expire during 2016, the majority of which are in Brazil and Romania.
9
Executive Officers of the Registrant
Name and Age | Present Principal Position and Other Material Positions Held During Last Five Years |
R. Scott Rowe (44) | President and Chief Executive Officer since October 2015. President and Chief Operating Officer from October 2014 to October 2015. Vice President from August 2012 to October 2014. Chief Executive Officer of OneSubsea from March 2014 to October 2014. President of the Subsea Systems division of Cameron from August 2012 to March 2014 and President of the Production Systems division of OneSubsea from June 2013 to March 2014. President of the Engineered and Process Valves division from April 2010 to August 2012. President Process Valves division and Aftermarket from May 2008 to April 2010. Vice President and General Manager of the Distributed Valves division from January 2007 to May 2008. Vice President of Operations of the Valves and Measurement divisions from August 2005 to January 2007. |
William C. Lemmer (71) | Senior Vice President and General Counsel since May 2008, Senior Vice President, General Counsel and Secretary from July 2007 to May 2008. Vice President, General Counsel and Secretary from July 1999 to July 2007. Vice President, General Counsel and Secretary of Oryx Energy Company from 1994 to March 1999. |
Charles M. Sledge (50) | Senior Vice President and Chief Financial Officer since November 2008. Vice President and Chief Financial Officer from April 2008 to November 2008. Vice President and Corporate Controller from July 2001 to March 2008. Senior Vice President, Finance and Treasurer from 1999 to June 2001, and Vice President, Controller from 1996 to 1999, of Stage Stores, Inc., a chain of family apparel stores. |
Dennis S. Baldwin (55) | Vice President, Controller and Chief Accounting Officer since March 2014. Senior Vice President and Chief Accounting Officer of KBR, Inc. from August 2010 to March 2014. Vice President and Chief Accounting Officer of McDermott International from October 2007 to August 2010. |
Steven P. Geiger (62) | Vice President and Chief Administrative Officer since October 2014. Vice President, Human Resources from January 2014 to September 2014. Vice President of Human Resources and Operational Excellence from June 2013 to December 2013. Vice President of Operational Excellence from February 2013 to June 2013. Senior Vice President at Senn-Delaney Leadership Consulting Group from July 2008 to February 2013. Also served as Interim Chief Operating Officer of James Cancer Hospital, Ohio State University, from January 2010 to June 2010. |
Hunter W. Jones (56) | Vice President since May 2015 and President, Drilling Systems since June 2015. Vice President and General Manager, Drilling Systems from October 2013 to June 2015. Vice President, Enterprise Services and Chief Information Officer from October 2012 to October 2013. Vice President and Chief Information Officer August 2009 to October 2012. Vice President, Supply Chain Management and Six Sigma from June 2002 to October 2005. Vice President, Quality and Global Procurement from May 2000 to June 2002. |
Douglas E. Meikle (52) | Vice President since May 2015 and President of Valves and Measurement since October 2014. Vice President Operational Excellence from February 2014 to October 2014. Vice President Enterprise Services from October 2013 to February 2014. Chief Executive Officer of Stork Technical Services from January 2009 to October 2013. Vice President of Halliburton from May 1998 to December 2008. |
Stefan Radwanski (59) | Vice President since June 2015 and Vice President and Division GM, Surface Systems since November 2013 Vice President, Sales and Marketing from July 2005 to November 2013. Director of Sales & Marketing from February 2004 to June 2005. Senior Vice President, Business Development of Sodexho France from April 2003 to February 2004. Senior Vice President of ABB Vetco Gray from April 1999 to April 2002. |
Steven W. Roll (56) | Vice President since May 2015 and President of Process Systems since January 2014. Vice President, Atlantic Region of McDermott International Inc. from December 2011 to September 2013. Vice President, Sales, Marketing, Business Development and Operational Strategy of McDermott from June 2008 to November 2011. |
10
ITEM 1A. RISK FACTORS
Factors That May Affect Financial Condition and Future Results
The current downturn and past downturns in the oil and gas industry have had a negative effect on the Company’s sales, the Company's customers' ability to pay and the Company's profitability.
Demand for most of the Company’s products and services, and therefore its revenue, depends to a large extent upon the level of capital expenditures related to oil and gas exploration, development, production, processing and transmission. Declines, as well as anticipated declines, in oil and gas prices could negatively affect the level of these activities, and could result in the cancellation, modification or rescheduling of existing orders and the ability of our customers to pay. For example, oil prices began declining during the third quarter of 2014 and continued to decline through early 2016. Average daily prices for West Texas Intermediate and Brent crude during 2015 were each down more than 42% from 2014. Similarly, natural gas prices declined from an average of $4.35 per MMBtu during 2014 to $2.61 per MMBtu for 2015. These declines in commodity prices began to impact the average number of working rigs which began declining in late 2014 and continued to decline during 2015. Globally, the average rig count for 2015 was down 35% from 2014, with even steeper declines occurring in the United States and Canada. These market conditions negatively affected 2015 results and are expected to continue to significantly affect future results as exploration and production activity levels and, therefore, demand for the Company’s products and services, as well as our customers' ability to pay continue to decline. During 2015, numerous deepwater projects were deferred and deepwater rigs idled. Efforts are also being made by drilling contractors to defer deliveries of new deepwater rigs currently under construction. In addition to a decline in future orders and revenues, the Company expects to incur additional costs as it continues to adjust, as necessary, its commercial, manufacturing and support operations levels to meet expected future customer demand. See also the discussion in “Market Conditions” above for 2015 as compared to 2014.
Cancellation, downsizing or delays of orders in backlog are possible.
As described above, commodity prices have declined significantly since mid-2014 which has resulted in various oil and gas exploration and production companies implementing spending cuts or deferrals in their 2015 capital spending plans, as well as headcount reductions, with continued cuts and deferrals expected for 2016. At current price levels, certain projects, particularly those in deepwater environments and unconventional resource regions, may become uneconomical for the risk involved. Certain customers that are more highly leveraged may also experience concerns regarding future projected cash flows based on current price levels. These factors could result in existing orders in backlog being cancelled, downsized or future shipment dates may be delayed, all of which could further negatively impact the Company’s future profitability.
Cameron will be subject to business uncertainties and certain operating restrictions until completion of the merger with Schlumberger.
In connection with the pending merger with Schlumberger, some of the suppliers and customers of Cameron may delay or defer sales and purchasing decisions, which could negatively impact revenues, earnings and cash flows regardless of whether the merger is completed. Additionally, Cameron has agreed in the merger agreement to refrain from taking certain actions with respect to our business and financial affairs during the pendency of the merger, which restrictions could be in place for an extended period of time if completion of the merger is delayed and could adversely impact Cameron’s ability to execute certain of our business strategies and their financial condition, results of operations or cash flows.
Cameron may be unable to attract and retain key employees during the pendency of the merger.
In connection with the pending merger with Schlumberger, current and prospective employees of Cameron may experience uncertainty about their future roles with the combined company following the merger, which may materially adversely affect the ability of Cameron to attract and retain key personnel while the merger is pending. Key employees may depart because of issues relating to the uncertainty and difficulty of integration or a desire not to remain with the combined company following the merger. Accordingly, no assurance can be given that Cameron will be able to attract and retain key employees to the same extent that Cameron has been able to in the past.
Failure to complete the merger with Schlumberger could negatively impact Cameron.
If the pending merger with Schlumberger is not completed, Cameron's ongoing businesses and the market price of its common stock may be adversely affected and Cameron will be subject to several risks; including Cameron being required, under certain circumstances, to pay a termination fee of $321 million to Schlumberger; Cameron having to pay certain costs relating to the merger; and diverting the focus of Cameron management from pursuing other opportunities that could be beneficial to Cameron; in each case, without realizing any of the benefits that might have resulted if the pending merger had been completed.
11
Portions of the backlog for our Subsea and Drilling segments are subject to heightened execution risk.
Cameron is involved in projects to provide customers with deepwater stacks and complete drilling packages for jackup rigs and, through our Subsea segment, is a significant participant in the subsea systems projects market. Some of the projects for these markets carry heightened execution risk because of their scope and complexity, in terms of both technical and logistical requirements. Such projects (i) may often involve long lead times, (ii) are larger in financial scope, (iii) require substantial engineering resources to meet the technical requirements of the project and (iv) often involve the application of existing technology to new environments and, in some cases, may require the development of new technology. As a subset of its total backlog at December 31, 2015, the Company had projects fitting this risk profile that amounted to approximately $914 million in its Drilling segment and approximately $1.8 billion in its Subsea segment. To the extent the Company experiences unplanned difficulties in meeting the technical and/or delivery requirements of the projects, the Company’s earnings or liquidity could be negatively impacted. The Company accounts for its drilling and subsea projects, as it does its separation projects, using accounting rules for construction-type and production-type contracts. Factors that may affect future project costs and margins include the ability to properly execute the engineering and design phases consistent with our customers’ expectations, production efficiencies obtained, and the availability and costs of labor, materials and subcomponents. These factors can impact the accuracy of the Company’s estimates and materially impact the Company’s future period earnings. If the Company experiences cost overruns, the expected margin could decline. If this were to occur, in accordance with the accounting guidance, the Company would record a cumulative adjustment to reduce the margin previously recorded on the related project in the period a change in the estimate is needed. Deepwater stack and jackup complete drilling packages, and subsea systems projects, accounted for approximately 8% and 14%, respectively, of total revenues for 2015.
As a designer, manufacturer, installer and servicer of oil and gas pressure control equipment, the Company may be subject to liability, personal injury, property damage and environmental contamination should such equipment fail to perform to specifications.
Cameron provides products and systems to customers involved in oil and gas exploration, development and production, as well as in certain other industrial markets. Some of the Company’s equipment is designed to operate in high-temperature and/or high-pressure environments on land, on offshore platforms and on the seabed, and some equipment is designed for use in hydraulic fracturing operations. Cameron also provides parts and repair services at numerous facilities located around the world, as well as at customer sites for this type of equipment. Because of applications to which the Company’s products and services are put, particularly those involving the high temperature and/or pressure environments, a failure of such equipment, or a failure of our customer to maintain or operate the equipment properly, could cause damage to the equipment, damage to the property of customers and others, personal injury and environmental contamination, onshore or offshore, leading to claims against Cameron.
Certain of the Company’s risk mitigation strategies may not be fully effective.
The Company relies on customer indemnifications and third-party insurance as part of its risk mitigation strategy. There is, however, an increasing reluctance of customers to provide what had been typical oilfield indemnifications for pollution, consequential losses, property damage, and personal injury and death, and a reluctance, even refusal, of counterparties to honor their contractual indemnity obligations when given. In addition, insurance companies may refuse to honor their policies.
An example of both is the Company’s experience in the Deepwater Horizon matter. The Company’s customer denied that it owed any indemnification under its contract with us, and when called on to participate in the Company’s settlement with BP Exploration and Production Inc., one of the seven insurers refused to provide coverage. The Company subsequently sued its insurer and won a judgment for the full policy amount plus interest and costs, but the insurer continues to litigate the matter.
The implementation of an upgraded business information system may disrupt the Company’s operations or its system of internal controls.
The Company has a project underway to upgrade its SAP business information systems worldwide. The first stage of this multi-year effort was completed at the beginning of the third quarter of 2011 with the deployment of the upgraded system to the Company’s process systems and compression businesses. Since then, other businesses and business functions have been migrated in stages. As of December 31, 2015, nearly all businesses within the V&M segment, the Surface segment, the Drilling segment, the Company’s worldwide engineering and human resource functions, as well as other corporate office activities are now operating on the upgraded system. The OneSubsea business is scheduled to begin using the upgraded system in 2016. The Drilling segment and the OneSubsea business are major contributors to the Company’s consolidated revenues and income before income taxes.
12
As this system continues to be deployed throughout the Company, delays or difficulties may be encountered in effectively and efficiently processing transactions and conducting business operations, including project management, until such time as personnel are familiar with all appropriate aspects and capabilities of the upgraded systems.
The Company’s operations and information systems are subject to cybersecurity risks.
Cameron continues to increase its dependence on digital technologies to conduct its operations. Many of the Company’s files are digitized and more employees are working in almost paperless environments. Additionally, the hardware, network and software environments to operate SAP, the Company’s main enterprise-wide operating system, have been outsourced to third parties. Other key software products used by the Company to conduct its operations either reside on servers in remote locations or are operated by the software vendors or other third parties for the Company’s use as “cloud-based” or “web-based” applications. The Company has also outsourced certain information technology development, maintenance and support functions. As a result, the Company is exposed to potentially severe cyber incidents at both its internal locations and outside vendor locations that could result in a theft of intellectual property and/or disruption of its operations for an extended period of time resulting in the loss of critical data and in higher costs to correct and remedy the effects of such incidents.
Fluctuations in currency markets can impact the Company’s profitability.
The Company has established multiple “Centers of Excellence” facilities for manufacturing such products as subsea trees, subsea chokes, subsea production controls and blowout preventers. These production facilities are located in the United Kingdom, Brazil, Romania, Italy, Norway and other European and Asian countries. To the extent the Company sells these products in U.S. dollars, the Company’s profitability is eroded when the U.S. dollar weakens against the British pound, the euro, the Brazilian real and certain Asian currencies, including the Singapore dollar. Alternatively, profitability is enhanced when the U.S. dollar strengthens against these same currencies. For further information on the use of derivatives to mitigate certain currency exposures, see Part II, Item 7A, “Quantitative and Qualitative Disclosures about Market Risk” below and Note 19 of the Notes to Consolidated Condensed Financial Statements.
The Company’s operations expose it to risks of non-compliance with numerous countries’ import and export laws and regulations, and with various nations’ trade laws and regulations including U.S. sanctions.
The Company’s operations expose it to anti-boycott, economic sanctions, export, import, and other trade regulations in multiple jurisdictions. In addition to using “Centers of Excellence” for manufacturing products to be delivered around the world, the Company imports raw materials, semi-finished goods and finished products into many countries for use in country or for manufacturing and/or finishing for re-export and import into another country for use or further integration into equipment or systems. This movement of raw materials, semi-finished or finished products involves exports and imports that can be subject to regulation by multiple jurisdiction. In addition, the Company conducts business, organizes and owns legal entities and engages employees, vendors and customers in and from various countries, and these activities and parties are subject to various, and sometimes divergent, economic sanctions, anti-boycott and other trade regulations. The Company has undergone and will likely continue to undergo governmental audits to determine compliance with export and customs laws and regulations. As a result, compliance with multiple trade sanctions and embargoes and import and export laws and regulations poses a constant challenge and risk to the Company.
From time to time, the Company has received inquiries from U.S. governmental agencies, including the U.S. Securities and Exchange Commission ("SEC") and the U.S. Department of the Treasury's Office of Foreign Assets Control, regarding compliance with certain of these laws and regulations. Currently, the Company is responding to an inquiry from the Department of Justice regarding the compliance with U.S. economic sanctions against Iran. See the discussion in Part II, Item 9B.
The Company’s operations require it to deal with a variety of cultures and countries, as well as agents and other intermediaries, exposing it to anti-corruption compliance risks.
Doing business on a worldwide basis necessarily involves exposing the Company and its operations to risks inherent in complying with the laws and regulations of a number of different nations. These laws and regulations include various anti-bribery and anti-corruption laws. Investigations of non-compliance, even when no wrongdoing is found, as well as penalties and other costs associated with violations of these laws could have an adverse impact on the Company's financial statements and results.
In addition to bribery and corruption risks which exist around the world, the Company does business and has operations in a number of countries that are generally perceived as presenting a higher than normal risk of corruption. Maintaining and administering an effective anti-bribery compliance program under the U.S. Foreign Corrupt Practices Act (FCPA), the United Kingdom’s Bribery Act of 2010, and similar statutes of other nations in these environments present greater challenges to the Company than is the case in other countries. Additionally, the Company’s business involves the use of agents and other intermediaries, such as customs brokers. As a result, the risk to the Company of compliance violations is increased because
13
actions taken by any of them when attempting to conduct business on our behalf could be imputed to us by law enforcement authorities.
From time to time, the Company has received inquiries from U.S. government agencies, including the SEC and the U.S. Department of Justice regarding compliance with certain of these laws and regulations. The Company is currently responding to an inquiry from the SEC and Department of Justice regarding anti-bribery matters. See the discussion in Part II, Item 9B.
Additionally, these risks can negatively effect our customers and, therefore, the Company itself. As an example, various employees and former employees of the Company’s primary customer in Brazil are being investigated currently over allegations of bribery and other acts of corruption. This investigation, along with the current recessionary economic conditions in Brazil, is, at present, having a negative impact on future orders and growth prospects for the Company’s operations in Brazil. Sales to customers in Brazil accounted for approximately 4% of the Company’s consolidated revenues during 2015 and 6% in 2014.
Our Compliance Programs May Not Prevent Violations of Applicable Laws and Regulations
We have an ethics and compliance program that is designed to deter or detect violations of applicable laws and regulations through the application of our policies and procedures, Code of Conduct, Ethics Helpline, training, internal controls, investigation and remediation activities, and other activities. However, our ethics and compliance program may not be fully effective in preventing all employees, contractors or intermediaries from violating or circumventing our compliance requirements or applicable laws and regulations. Violations of applicable laws and regulations can result in fines and penalties, criminal sanctions, administrative remedies, and restrictions on our business conduct, and could have an adverse effect on our reputation and our business, our operating results, and financial condition.
The Company’s operations expose it to political and economic risks and instability due to changes in economic conditions, civil unrest, foreign currency fluctuations, and other risks, such as local content requirements, inherent to international businesses.
The political and economic risks of doing business on a worldwide basis include the following:
• | volatility in general economic, social and political conditions; |
• | the effects of civil unrest and, in some cases, military action on the Company’s business operations, customers and employees, such as that recently occurring in several countries in the Middle East and in Venezuela; |
• | exchange controls or other similar measures which result in restrictions on repatriation of capital and/or income, such as those involving the currencies of, and the Company’s operations in, Angola and Nigeria; and |
• | reductions in the number or capacity of qualified personnel. |
Cameron also has manufacturing and service operations that are essential parts of its business in other developing countries and volatile areas in Africa, Latin America and other countries that were part of the Former Soviet Union, the Middle East, and Central and South East Asia. Operating in certain of these regions has increased the Company’s risk of identifying and hiring sufficient numbers of qualified personnel to meet customer demand in selected locations. The Company also purchases a large portion of its raw materials and components from a relatively small number of foreign suppliers in China, India and other developing countries. The ability of these suppliers to meet the Company’s demand could be adversely affected by the factors described above.
In addition, customers in countries such as Angola and Nigeria increasingly are requiring the Company to accept payments in the local currencies of these countries. These currencies do not currently trade actively in the world’s foreign exchange markets. The government of Angola devalued its currency during 2015, resulting in a loss of $9 million being recorded by the Company on its kwanza-denominated net assets. Angola further devalued its currency an additional 15%, effective January 1, 2016.
Increasingly, some of the Company’s customers, particularly the national oil companies, have required a certain percentage, or an increased percentage, of local content in the products they buy directly or indirectly from the Company. This requires the Company to add to or expand manufacturing capabilities in certain countries that are presently without the necessary infrastructure or human resources in place to conduct business in a manner as typically done by Cameron. This increases the risk of untimely deliveries, cost overruns and defective products.
The Company’s operations expose it to risks resulting from differing and/or increasing tax rates.
Economic conditions around the world have resulted in decreased tax revenues for many governments, which have led and could continue to lead to changes in tax laws in countries where the Company does business, including further changes in the United States. Changes in tax laws could have a negative impact on the Company’s future results.
14
The Company is subject to environmental, health and safety laws and regulations that expose the Company to potential liability and proposed new regulations that would restrict activities to which the Company currently provides equipment and services.
The Company’s operations are subject to a variety of national and state, provincial and local laws and regulations, including laws and regulations relating to the protection of the environment. The Company is required to invest financial and managerial resources to comply with these laws and expects to continue to do so in the future. To date, the cost of complying with governmental regulation has not been material, but the fact that such laws or regulations are frequently changed makes it impossible for the Company to predict the cost or impact of such laws and regulations on the Company’s future operations. The modification of existing laws or regulations or the adoption of new laws or regulations imposing more stringent environmental restrictions could adversely affect the Company.
The Company provides equipment and services to companies employing hydraulic fracturing or “fracking” and could be adversely impacted by additional regulations of this enhanced recovery technique.
Environmental concerns have been raised regarding the potential impact on underground water supplies of hydraulic fracturing which involves the pumping of water and certain chemicals under pressure into a well to break apart shale and other rock formations in order to increase the flow of oil and gas embedded in these formations. On March 20, 2015, the U.S. Interior Department’s Bureau of Land Management (BLM) released a final rule regulating hydraulic fracturing activities on Federal and Indian lands. The final rule includes new well-bore integrity requirements, imposes standards for interim storage of recovered waste fluids, and requires notifications and waiting periods for key parts of the fracturing process, which could lead to delays in fracturing and/or drilling operations. The rule also mandates disclosure of the chemicals used in the process. Additionally, on April 7, 2015, the U.S. Environmental Protection Agency (EPA) published a proposed rule that would prohibit the disposal of unconventional oil and natural gas wastewater at publicly owned treatment works.
A number of U.S. states have also proposed regulations regarding disclosure of chemicals used in fracking operations or have temporarily suspended issuance of permits for such operations. The State of New York implemented a statewide ban on hydraulic fracturing at the beginning of 2015 which limits natural gas production from a portion of the Marcellus Shale region. Additionally, the United States EPA issued rules, which became effective in January 2015, designed to limit the release of volatile organic compounds, or pollutants, from natural gas wells that are hydraulically fractured.
Should these regulations, or additional regulations and bans by governments, continue to restrict or further curtail hydraulic fracturing activities, the Company’s revenues and earnings could be negatively impacted.
Enacted and proposed climate protection regulations and legislation may impact the Company’s operations or those of its customers.
The EPA has made a finding under the United States Clean Air Act that greenhouse gas emissions endanger public health and welfare and enacted regulations requiring monitoring and reporting by certain facilities and companies of greenhouse gas emissions. In June 2014, the EPA, acting under President Obama’s Climate Action Plan, proposed its Clean Power Plan, which would set U.S. state-by-state guidelines for power plants to meet by 2030 to cut their carbon emissions by 30% nationwide from 2005 levels. The guidelines are also intended to cut pollution, nitrogen oxides and sulfur dioxide by more than 25% during the same period. Under the Clean Power Plan, States are to develop plans to meet state-specific goals to reduce carbon pollution and submit those plans to the EPA by June 2016, with a later deadline provided under certain circumstances. While these proposed rules may hasten the switch from coal to cleaner burning fuels such as natural gas, the overall long-term economic impact of the Plan is uncertain at this point.
Carbon emission reporting and reduction programs have also expanded in recent years at the state, regional and national levels with certain countries having already implemented various types of cap-and-trade programs aimed at reducing carbon emissions from companies that currently emit greenhouse gases.
To the extent the Company’s customers are subject to these or other similar proposed or newly enacted laws and regulations, the Company is exposed to risks that the additional costs by customers to comply with such laws and regulations could impact their ability or desire to continue to operate at current or anticipated levels in certain jurisdictions, which could negatively impact their demand for the Company’s products and services.
To the extent Cameron becomes subject to any of these or other similar proposed or newly enacted laws and regulations, the Company expects that its efforts to monitor, report and comply with such laws and regulations, and any related taxes imposed on companies by such programs, will increase the Company’s cost of doing business in certain jurisdictions, including the United States, and may require expenditures on a number of its facilities and possibly on modifications of certain of its products.
15
The Company could also be impacted by new laws and regulations establishing cap-and-trade and by those that might favor the increased use of non-fossil fuels, including nuclear, wind, solar and bio-fuels or that are designed to increase energy efficiency. If the proposed or newly executed laws have the effect of dampening demand for oil and gas production, they could lower spending by customers for the Company’s products and services.
Environmental Remediation
The Company’s worldwide operations are subject to domestic and international regulations with regard to air, soil, waste management, and water quality as well as other environmental matters such as resource conservation. The Company, through its Health, Safety and Environmental (HSE) Management System and corporate third-party regulatory compliance audit program, believes it is in substantial compliance with these regulations.
The Company is heir to a number of older manufacturing plants that conducted operations in accordance with the standards of the time, but which have since changed. The Company has undertaken clean-up efforts at these sites and now conducts its business in accordance with current standards and/or regulatory requirements. The Company’s clean-up efforts have yielded limited releases of liability from regulators in some instances, and have allowed sites with no current operations to be sold. The Company conducts environmental due diligence prior to all new site acquisitions. For further information, refer to Note 20 of the Notes to Consolidated Condensed Financial Statements.
Environmental Sustainability
The Company has pursued environmental sustainability in a number of ways. Processes are monitored in an attempt to minimize waste produced and conserve natural resources where possible. All of the waste disposal firms used by the Company are carefully selected in an attempt to prevent any future Superfund involvements. Actions are taken in an attempt to minimize the generation of hazardous wastes and to minimize air emissions. Recycling of process wastewater is a common practice. Best management practices related to spill prevention and storm water pollution prevention are used in an effort to prevent contamination of soil and ground water on the Company’s sites and neighboring facilities.
Cameron has implemented a corporate HSE Management System that incorporates many of the principles of ISO 14001 and OHSAS 18001. The HSE Management System contains a set of corporate standards that are required to be implemented and verified by each business unit. Cameron also has a corporate regulatory compliance audit program which uses independent third-party auditors to audit facilities on a regular basis to verify facility compliance with the relevant country, region and local environmental, health and safety laws and regulations. Audit reports are circulated to the senior management of the Company and to the appropriate business unit. The compliance program requires corrective and preventative actions be taken by a facility to remedy all findings of non-compliance which are tracked on the corporate HSE data base and monitored by corporate HSE staff.
The Company's 2014 Sustainability Report, issued in June 2015, is available on our website at www.c-a-m.com/company.
ITEM 1B. UNRESOLVED STAFF COMMENTS
There were no unresolved comments from the SEC staff at the time of filing of this Form 10-K.
ITEM 2. PROPERTIES
The Company manufactures, markets and sells its products and provides services throughout the world, operating facilities in numerous countries ranging in size from approximately 100 square feet to approximately 500,000 square feet. In addition to its manufacturing facilities, the Company owns and leases land, warehouses, distribution centers, service and storage facilities, sales and administrative offices. The Company leases its corporate headquarters office space for the staff of its segments in Houston, Texas.
16
The table below shows the number of significant operating manufacturing, warehouse, distribution and service facilities and sales and administrative offices by business segment and geographic area at December 31, 2015. The location and square footage information also includes land owned and leased.
Americas | Asia/Pacific and Middle East | Europe/Africa/ Caspian/Russia | Total | ||||||||
Subsea ― | |||||||||||
Number of locations | 46 | 11 | 45 | 102 | |||||||
Square footage: | |||||||||||
Owned | 3,611,348 | — | 492,406 | 4,103,754 | |||||||
Leased | 830,817 | 802,295 | 1,664,266 | 3,297,378 | |||||||
Surface ― | |||||||||||
Number of locations | 70 | 25 | 28 | 123 | |||||||
Square footage: | |||||||||||
Owned | 1,326,950 | — | 682,704 | 2,009,654 | |||||||
Leased | 895,839 | 1,772,780 | 261,556 | 2,930,175 | |||||||
Drilling ― | |||||||||||
Number of locations | 33 | 2 | 15 | 50 | |||||||
Square footage: | |||||||||||
Owned | 1,498,525 | — | 430,556 | 1,929,081 | |||||||
Leased | 887,592 | 452,022 | 263,879 | 1,603,493 | |||||||
V&M ― | |||||||||||
Number of locations | 55 | 22 | 13 | 90 | |||||||
Square footage: | |||||||||||
Owned | 1,437,670 | 18,729 | 758,640 | 2,215,039 | |||||||
Leased | 1,325,394 | 725,571 | 191,741 | 2,242,706 | |||||||
Corporate ― | |||||||||||
Number of locations | 10 | 6 | 8 | 24 | |||||||
Square footage: | |||||||||||
Owned | 75,165 | — | — | 75,165 | |||||||
Leased | 230,312 | 198,027 | 141,187 | 569,526 | |||||||
Total ― | |||||||||||
Number of locations | 214 | 66 | 109 | 389 | |||||||
Square footage: | |||||||||||
Owned | 7,949,658 | 18,729 | 2,364,306 | 10,332,693 | |||||||
Leased | 4,169,954 | 3,950,695 | 2,522,629 | 10,643,278 | |||||||
The Company’s operations in the “Americas” are mainly located in North and South America. The Company’s operations in the “Asia/Pacific and Middle East” region are mainly located on the Asian continent, in countries considered to be on the Pacific rim of the Asian continent or in the area of the world commonly known as the “Middle East”. The Company’s operations in “Europe/Africa/Caspian/Russia” are mainly located in the United Kingdom, Norway, on the European continent, in Angola, Algeria, Nigeria, Russia and areas surrounding the Caspian Sea.
Cameron believes its facilities are suitable for their present and intended purposes and are adequate for the Company’s current and anticipated level of operations.
17
ITEM 3. LEGAL PROCEEDINGS
The Company is subject to a number of contingencies, including litigation, tax contingencies and environmental matters.
Litigation
The Company has been and continues to be named as a defendant in a number of multi-defendant, multi-plaintiff tort lawsuits. At December 31, 2015, the Company’s Consolidated Balance Sheet included a liability of approximately $21 million for such cases. The Company believes, based on its review of the facts and law, that the potential exposure from these suits will not have a material adverse effect on its consolidated results of operations, financial condition or liquidity.
Tax and Other Contingencies
The Company has legal entities in over 50 countries. As a result, the Company is subject to various tax filing requirements in these countries. The Company prepares its tax filings in a manner which it believes is consistent with such filing requirements. However, some of the tax laws and regulations to which the Company is subject require interpretation and/or judgment. Although the Company believes that adequate provisions for the tax liabilities for periods ending on or before the balance sheet date have been made in the financial statements; to the extent a taxing authority believes the Company has not prepared its tax filings in accordance with the authority’s interpretation of the tax laws and regulations, the Company could be exposed to additional taxes.
The Company has been assessed customs duties and penalties by the government of Brazil totaling almost $34 million at December 31, 2015, including interest accrued at local country rates, following a customs audit for the years 2003-2010. The Company filed an administrative appeal and believes a majority of this assessment will ultimately be proven to be incorrect because of numerous errors in the assessment, and because the government has not provided appropriate supporting documentation for the assessment. As a result, the Company currently expects no material adverse impact on its results of operations or cash flows as a result of the ultimate resolution of this matter. No amounts have been accrued for this assessment as of December 31, 2015 as no loss is currently considered probable.
Environmental Matters
The Company is currently identified as a potentially responsible party (PRP) for one site designated for cleanup under the Comprehensive Environmental Response Compensation and Liability Act (CERCLA). The Osborne site is a landfill into which a predecessor of the Reciprocating Compression operation in Grove City, Pennsylvania deposited waste. Remediation was completed in 2011 and remaining costs relate to ongoing ground water monitoring. The Company is also a party with de minimis exposure at other sites covered by CERCLA or similar state laws.
The Company is engaged in site cleanup under the Voluntary Cleanup Plan of the Texas Commission on Environmental Quality ("TCEQ") at a former manufacturing site in Houston, Texas. In 2001, the Company discovered that contaminated underground water from this site had migrated under an adjacent residential area. Pursuant to applicable state regulations, the Company notified the affected homeowners. Concerns over the impact on property values of the underground water contamination and its public disclosure led to a number of claims by homeowners. The Company has settled these claims, primarily as a result of the settlement of a class action lawsuit, and is obligated to reimburse certain homeowners for any diminution in value of their property due to concerns over contamination at the time of the property's sale. As required, the Company has and will continue to notify surrounding property owners of testing and monitoring results, including concentration levels and migration patterns. The Company continues to monitor the situation to determine whether additional remedial measures would be appropriate. The Company believes, based on its review of the facts and law, that any potential exposure from existing agreements as well as any possible new claims that may be filed with respect to this underground water contamination will not have a material adverse effect on its financial position or results of operations. The Company's Consolidated Balance Sheet included a noncurrent liability of approximately $7 million for these matters as of December 31, 2015.
Additionally, the Company has discontinued operations at a number of other sites which had been active for many years and which may have yet undiscovered contamination. The Company does not believe, based upon information currently available, that there are any material environmental liabilities existing at these locations. At December 31, 2015, the Company's Consolidated Balance Sheet included a noncurrent liability of approximately $5 million for these environmental matters.
ITEM 4. MINE SAFETY DISCLOSURES
N/A.
18
PART II
ITEM 5. MARKET FOR REGISTRANT’S COMMON EQUITY, RELATED STOCKHOLDER MATTERS AND ISSUER PURCHASES OF EQUITY SECURITIES
The common stock of Cameron International Corporation, par value $.01 per share, is traded on the New York Stock Exchange (“NYSE”) under the symbol CAM. No dividends were paid during 2015 or 2014.
Common Stock and Market Prices
The trading activity during 2015 and 2014 was as follows:
Price Range ($) | |||||||||||
High | Low | Last | |||||||||
2015 | |||||||||||
First Quarter | $ | 50.25 | $ | 39.52 | $ | 45.12 | |||||
Second Quarter | 56.28 | 44.79 | 52.37 | ||||||||
Third Quarter | 67.12 | 40.50 | 61.32 | ||||||||
Fourth Quarter | 71.22 | 59.49 | 63.20 | ||||||||
Price Range ($) | |||||||||||
High | Low | Last | |||||||||
2014 | |||||||||||
First Quarter | $ | 64.38 | $ | 56.51 | $ | 61.77 | |||||
Second Quarter | 68.54 | 60.63 | 67.71 | ||||||||
Third Quarter | 74.89 | 65.88 | 66.38 | ||||||||
Fourth Quarter | 66.88 | 44.43 | 49.95 | ||||||||
As of January 15, 2016, the approximate number of stockholders of record of Cameron common stock was 804.
Information concerning securities authorized for issuance under stock-based compensation plans is included in Note 10 of the Notes to Consolidated Financial Statements, which notes are included in Part II, Item 8 hereof.
At December 31, 2015, the Company had remaining authority for future stock purchases totaling approximately $240 million. However, such stock purchases are currently prohibited under the Merger Agreement (see Note 2 of the Notes to Consolidated Condensed Financial Statements for further information).
There were no shares of common stock purchased and placed in treasury during the three months ended December 31, 2015. A total of 60,518,249 shares have been purchased to date under the Board’s authorization program , with a maximum remaining authorization of 3,795,855 shares that may yet be purchased based upon the Company's December 31, 2015 stock price.
Stockholder Return Performance Graph
The graph below shows the cumulative total stockholder return on the Company's common stock from December 31, 2010 to December 31, 2015 and compares it with the cumulative total return of the Standard & Poor's Composite 500 Stock Index and the Oil Service Sector Index (OSX). The weighted average (based on stock market capitalization) cumulative total return of an Industry Group selected by the Company will not be used this year due to the unavailability of information at the time of the 2015 Form 10-K filing.
The OSX is a price-weighed index composed of the common stocks of 15 companies that provide oil drilling and production services, oil field equipment, and support services. The OSX is included in the performance graph because it is a broader presentation of the oil service sector and will be used by the Company in future periods of comparison.
19
Each case assumes an investment of $100 on December 31, 2010 and the reinvestment of any dividends, and the points on the graph represent the value of each of these investments at the end of each year shown.
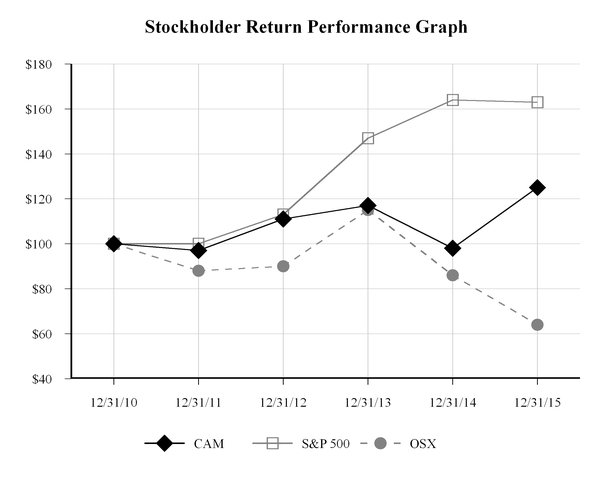
20
ITEM 6. SELECTED FINANCIAL DATA
The following table sets forth selected historical financial data for the Company for each of the five years in the period ended December 31, 2015. This information should be read in conjunction with the consolidated financial statements of the Company and notes thereto included elsewhere in this Annual Report.
Year Ended December 31, | |||||||||||||||||||
(dollars in millions, except per share data) | 2015 | 2014 | 2013 | 2012 | 2011 | ||||||||||||||
Income Statement Data: | |||||||||||||||||||
Revenues | $ | 8,782 | $ | 10,381 | $ | 9,138 | $ | 7,795 | $ | 6,348 | |||||||||
Costs and expenses: | |||||||||||||||||||
Cost of sales (exclusive of depreciation and amortization shown separately below) | 6,126 | 7,464 | 6,518 | 5,522 | 4,422 | ||||||||||||||
Selling and administrative expenses | 1,082 | 1,287 | 1,275 | 1,070 | 912 | ||||||||||||||
Depreciation and amortization | 342 | 348 | 298 | 238 | 191 | ||||||||||||||
Interest, net | 138 | 129 | 100 | 90 | 84 | ||||||||||||||
Asset charges (see Note 4) | 639 | 44 | — | — | — | ||||||||||||||
Other costs (see Note 4) | 134 | 29 | 92 | 33 | 177 | ||||||||||||||
Total costs and expenses | 8,461 | 9,301 | 8,283 | 6,953 | 5,786 | ||||||||||||||
Income from continuing operations before income taxes | 321 | 1,080 | 855 | 842 | 562 | ||||||||||||||
Income tax provision | (184 | ) | (258 | ) | (196 | ) | (157 | ) | (97 | ) | |||||||||
Income from continuing operations | 137 | 822 | 659 | 685 | 465 | ||||||||||||||
Income from discontinued operations, net of income taxes | 431 | 26 | 65 | 66 | 57 | ||||||||||||||
Net income | 568 | 848 | 724 | 751 | 522 | ||||||||||||||
Less: Net income attributable to noncontrolling interests | 67 | 37 | 25 | — | — | ||||||||||||||
Net income attributable to Cameron stockholders | $ | 501 | $ | 811 | $ | 699 | $ | 751 | $ | 522 | |||||||||
Amounts attributable to Cameron stockholders: | |||||||||||||||||||
Income from continuing operations | $ | 70 | $ | 785 | $ | 634 | $ | 685 | $ | 465 | |||||||||
Income from discontinued operations | 431 | 26 | 65 | 66 | 57 | ||||||||||||||
Net income attributable to Cameron stockholders | $ | 501 | $ | 811 | $ | 699 | $ | 751 | $ | 522 | |||||||||
Earnings per share attributable to Cameron stockholders: | |||||||||||||||||||
Basic - | |||||||||||||||||||
Continuing operations | $ | 0.36 | $ | 3.85 | $ | 2.62 | $ | 2.78 | $ | 1.90 | |||||||||
Discontinued operations | 2.25 | 0.13 | 0.27 | 0.27 | 0.23 | ||||||||||||||
Basic earnings per share | $ | 2.61 | $ | 3.98 | $ | 2.89 | $ | 3.05 | $ | 2.13 | |||||||||
Diluted - | |||||||||||||||||||
Continuing operations | $ | 0.36 | $ | 3.83 | $ | 2.60 | $ | 2.76 | $ | 1.87 | |||||||||
Discontinued operations | 2.24 | 0.13 | 0.27 | 0.27 | 0.23 | ||||||||||||||
Diluted earnings per share | $ | 2.60 | $ | 3.96 | $ | 2.87 | $ | 3.03 | $ | 2.10 | |||||||||
Balance Sheet Data (at the end of period): | |||||||||||||||||||
Total assets | $ | 11,500 | $ | 12,892 | $ | 14,249 | $ | 11,158 | $ | 9,362 | |||||||||
Cameron stockholders’ equity | $ | 4,554 | $ | 4,555 | $ | 5,852 | $ | 5,566 | $ | 4,707 | |||||||||
Long-term debt | $ | 2,542 | $ | 2,819 | $ | 2,563 | $ | 2,047 | $ | 1,574 | |||||||||
Other long-term obligations | $ | 362 | $ | 360 | $ | 510 | $ | 376 | $ | 400 | |||||||||
21
ITEM 7. MANAGEMENT’S DISCUSSION AND ANALYSIS OF FINANCIAL CONDITION AND RESULTS OF OPERATIONS
The following discussion of the historical results of operations and financial condition of Cameron International Corporation (the Company or Cameron) should be read in conjunction with the Company’s consolidated financial statements and notes thereto included elsewhere in this Annual Report. All per share amounts attributable to Cameron stockholders included in this discussion are based on diluted shares outstanding.
Merger of Cameron with Schlumberger
On August 26, 2015, Cameron and Schlumberger Limited ("Schlumberger") announced that the companies had entered into an Agreement and Plan of Merger (the “Merger Agreement”) whereby a U.S. subsidiary of Schlumberger would acquire all of the issued and outstanding stock of Cameron. Under the terms of the agreement, Cameron shareholders will receive 0.716 shares of Schlumberger common stock and a cash payment of $14.44 in exchange for each Cameron common share. The Merger Agreement was unanimously approved by the board of directors of both companies and has been approved by Cameron's stockholders. The Merger will be consummated upon receipt of required regulatory consents and approvals, expected to occur during the first quarter of 2016. Schlumberger stockholders are not required to vote on the Merger Agreement. Should Cameron terminate the Merger Agreement in specified circumstances, the Company would be required to pay Schlumberger a termination fee equal to $321 million.
Overview
Cameron provides flow equipment products, systems and services to worldwide oil and gas industries through four business segments – Subsea, Surface, Drilling and Valves & Measurement (V&M).
The Subsea segment delivers integrated solutions, products, systems and services to the subsea oil and gas market, including integrated subsea production systems involving wellheads, subsea trees, manifolds and flowline connectors, subsea processing systems for the enhanced recovery of hydrocarbons, control systems, connectors and services designed to maximize reservoir recovery and extend the life of each field. The Subsea segment includes the operations of OneSubsea™, a business jointly owned by Cameron (60%) and Schlumberger (40%).
The Surface segment provides onshore and offshore platform wellhead systems and processing solutions, including valves, chokes, actuators, Christmas trees and services to oil and gas operators. Rental equipment are also provided, as well as products and services involving shale gas production. One of the major services provided by the Surface segment is CAMSHALE™ Production Solutions, which specializes in shale oil and gas production. In this process, intense pressure from fracing fluid (usually a mixture of water and sand) is used to crack surrounding shale. Once the fractures are made, the water is removed from the well bore and the sand is left behind to hold the fractures open. Oil and natural gas then moves out of the fractures, into the well bore, and up to the surface.
The Drilling segment provides drilling equipment and services to shipyards, drilling contractors, exploration & production operators and rental tool companies. Products fall into two broad categories: pressure control equipment and rotary drilling equipment and are designed for either onshore or offshore applications. Such products include drilling equipment packages, blowout preventers (BOPs), BOP control systems, connectors, riser systems, valve and choke manifold systems, topdrives, mud pumps, pipe handling equipment, rig designs and rig kits.
The V&M segment businesses serve portions of the upstream, midstream and downstream markets. These businesses provide valves and measurement systems that are primarily used to control, direct and measure the flow of oil and gas as they are moved from wellheads through flow lines, gathering lines and transmission systems to refineries, petrochemical plants and industrial centers for processing. Products include gate valves, butterfly valves, Orbit® brand rising stem ball valves, double block and bleed valves, plug valves, globe valves, check valves, actuators, chokes and parts and services as well as measurement equipment products such as totalizers, turbine meters, flow computers, chart recorders, ultrasonic flow meters and sampling systems.
Exposure to offshore markets
The Company’s broad portfolio of products results in Cameron having a significant presence in the offshore oil and gas drilling, production and infrastructure market. Cameron provides drilling equipment packages for drilling rigs, drilling and production risers, subsea production systems, oil and gas separation equipment, chokes, valves and other equipment to the offshore market. Approximately 49% of the Company’s 2015 revenue was derived from the offshore market (62% in 2014).
22
Exposure to international markets
Revenues for the years ended December 31, 2015, 2014 and 2013 were generated from shipments to the following regions of the world (dollars in millions):
Region | 2015 | 2014 | 2013 | ||||||||
North America | $ | 3,367 | $ | 3,739 | $ | 3,557 | |||||
South America | 576 | 783 | 772 | ||||||||
Asia, including Middle East | 2,447 | 2,334 | 2,134 | ||||||||
Africa | 987 | 1,541 | 966 | ||||||||
Europe | 1,256 | 1,816 | 1,415 | ||||||||
Other | 149 | 168 | 294 | ||||||||
Total revenues | $ | 8,782 | $ | 10,381 | $ | 9,138 | |||||
Financial Summary
The following table sets forth the consolidated percentage relationship to revenues of certain income statement items for the periods presented:
Year Ended December 31, | ||||||||
2015 | 2014 | 2013 | ||||||
Revenues | 100.0 | % | 100 | % | 100 | % | ||
Costs and expenses: | ||||||||
Cost of sales (exclusive of depreciation and amortization shown separately below) | 69.8 | % | 71.9 | % | 71.3 | % | ||
Selling and administrative expenses | 12.3 | % | 12.4 | % | 13.9 | % | ||
Depreciation and amortization | 3.9 | % | 3.4 | % | 3.3 | % | ||
Interest, net | 1.6 | % | 1.2 | % | 1.1 | % | ||
Asset costs (see Note 4) | 7.3 | % | 0.4 | % | — | % | ||
Other costs (see Note 4) | 1.5 | % | 0.3 | % | 1.0 | % | ||
Total costs and expenses | 96.4 | % | 89.6 | % | 90.6 | % | ||
Income from continuing operations before income taxes | 3.6 | % | 10.4 | % | 9.4 | % | ||
Income tax provision | (2.1 | )% | (2.5 | )% | (2.2 | )% | ||
Income from continuing operations | 1.5 | % | 7.9 | % | 7.2 | % | ||
Income from discontinued operations, net of income taxes | 4.9 | % | 0.3 | % | 0.7 | % | ||
Net income | 6.4 | % | 8.2 | % | 7.9 | % | ||
Less: Net income attributable to noncontrolling interests | 0.8 | % | 0.4 | % | 0.3 | % | ||
Net income attributable to Cameron stockholders | 5.6 | % | 7.8 | % | 7.6 | % | ||
23
Year Ended December 31, 2015 Compared to Year Ended December 31, 2014
Market Conditions
Information related to a measure of drilling activity and certain commodity spot and futures prices during each year and the number of available deepwater floaters at the end of each period follows:
Year Ended December 31, | Increase (Decrease) | ||||||||||||
2015 | 2014 | Amount | % | ||||||||||
Drilling activity (average number of working rigs during period)1: | |||||||||||||
United States | 977 | 1,861 | (884 | ) | (47.5 | )% | |||||||
Canada | 193 | 380 | (187 | ) | (49.2 | )% | |||||||
Rest of world | 1,167 | 1,337 | (170 | ) | (12.7 | )% | |||||||
Global average rig count | 2,337 | 3,578 | (1,241 | ) | (34.7 | )% | |||||||
Commodity prices (average of daily U.S. dollar prices per unit during period)2: | |||||||||||||
West Texas Intermediate (WTI) Cushing, OK crude spot price (per barrel) | $ | 48.68 | $ | 93.03 | (44.35 | ) | (47.7 | )% | |||||
Brent crude spot price (per barrel) | $ | 57.20 | $ | 99.01 | (41.81 | ) | (42.2 | )% | |||||
Henry Hub natural gas spot price (per MMBtu) | $ | 2.61 | $ | 4.35 | (1.74 | ) | (40.0 | )% | |||||
Twelve-month futures strip price (U.S. dollar amount at period end)2: | |||||||||||||
West Texas Intermediate Cushing, OK crude oil contract (per barrel) | $ | 41.24 | $ | 56.57 | (15.33 | ) | (27.1 | )% | |||||
Brent crude oil contract (per barrel) | $ | 37.28 | $ | 57.33 | (20.05 | ) | (35.0 | )% | |||||
Henry Hub natural gas contract (per MMBtu) | $ | 2.53 | $ | 3.06 | (0.53 | ) | (17.3 | )% | |||||
Contracted drillships and semi submersibles by location3: | |||||||||||||
U.S. Gulf of Mexico | 35 | 53 | (18 | ) | (34.0 | )% | |||||||
Central and South America | 52 | 63 | (11 | ) | (17.5 | )% | |||||||
Northwestern Europe | 38 | 44 | (6 | ) | (13.6 | )% | |||||||
West Africa | 30 | 41 | (11 | ) | (26.8 | )% | |||||||
Far East, Southeast Asia and Australia | 29 | 39 | (10 | ) | (25.6 | )% | |||||||
Other | 37 | 38 | (1 | ) | (2.6 | )% | |||||||
Total | 221 | 278 | (57 | ) | (20.5 | )% | |||||||
1 Based on average monthly rig count data from Baker Hughes
2 Source: Bloomberg
3 Source: IHS Energy – IHS Petrodata World Rig Forecast
Overall market activity remains at significantly depressed levels due to the collapse of energy prices. Specifically, the 2015 average worldwide rig count levels were down significantly from the same period in 2014, largely due to lower activity levels in the United States, mainly reflecting (i) the continued low commodity prices that began during the latter half of 2014 and (ii) the resulting 2015 capital spending cuts announced by many oil and gas production companies. Average worldwide working rig count levels for the month of December 2015 decreased approximately 35% from December 2014. The current worldwide working rig count levels continue to be at their lowest levels since mid-2009. Although the Company is working through a backlog of work in 2015, these declines in commodity prices and drilling activity levels have already had and will continue to have a negative impact on future demand for our products and services and our future revenues and earnings. Based on the Company’s long history in the energy sector, we believe such declines in commodity prices and the level of demand are typically cyclical in nature. During such cyclical downturns, we take steps to adjust our commercial, manufacturing and support operations
24
as appropriate to ensure that the Company remains competitive. The Company cannot predict the duration or depth of this down cycle.
Consistent with the worldwide decrease in activity level as noted above, in the United States the average number of rigs drilling for oil during 2015 decreased approximately 51% from the same period in 2014 and, at the end of December 2015, decreased approximately 16%, to 536, from the end of the third quarter of 2015. Rigs drilling for oil accounted for approximately 77% of total U.S. rig count levels at the end of December 2015, compared to 82% at the end of December 2014. The average number of rigs drilling for gas in the United States during 2015 of 226 was approximately 32% less than that of 2014. Based on data from Baker Hughes, during 2015 oil rig count levels declined to their lowest level since August 2010 and gas rig count levels declined to their lowest levels in more than a quarter of a century.
The decrease in the Canadian rig count during 2015 as compared to the same period in 2014 was due largely to a decrease of approximately 61% in the number of rigs drilling for oil. Rigs drilling for gas decreased approximately 34% during those same periods.
Average crude oil and natural gas prices were significantly lower during 2015 as compared to the same period last year and continued to drop into early 2016 reaching $29.45 per barrel as of January 15, 2016. Both WTI and Brent crude prices at the end of 2015 have declined approximately 31% and 46%, respectively, since December 31, 2014. The twelve-month futures price for WTI crude oil at December 31, 2015 was approximately 10% higher than spot prices at the end of the year. The twelve-month futures price for Brent crude oil at December 31, 2015 was approximately 11% lower than spot prices at the end of the year.
Average natural gas prices during the 2015 were down approximately 40% from the same period in 2014. Spot prices at the end of December 2015 were approximately 40% lower than at the end of December 2014. At December 30, 2015, the twelve-month futures strip price for natural gas at Henry Hub was $2.53 per MMBtu, which was 9% higher than the spot price at that date of $2.31 per MMBtu.
The total number of drillships and semi-submersibles under contract at December 31, 2015 was down from December 31, 2014 due to the decline in commodity prices and drilling activity that began in the latter half of 2014. Based on data from IHS Energy, the contracted utilization rates for drillships was 80% at December 2015 compared to 87% at December 2014 and the contracted utilization rate for semi-submersibles was 79% at December 2015 compared to 93% at December 2014. At December 31, 2015, the supply of available semi-submersibles and drillships currently exceeds demand with additional supply expected to come on-line beyond 2015. Many of the newbuild drillships and semi-submersibles that are currently on order, planned or under construction do not currently have contracts in place. In connection with this, and in response to current market conditions, certain drilling contractors are making efforts to defer delivery of newbuild units and are cold stacking or scraping certain older rigs in their existing portfolios. This will cause our installed base of BOPs in the offshore market to decline which will have a negative impact on our drilling services revenue.
Results of Operations
Consolidated Results – 2015 Compared to 2014
Net income attributable to Cameron stockholders for 2015 totaled $501 million, compared to $811 million for 2014. The Company had income from continuing operations for 2015 of $137 million, which included pre-tax charges of $773 million, largely resulting from a non-cash write-off of goodwill related to the Process Systems business totaling $517 million, as well as a $33 million loss and impairment on the expected sale of the Company's LeTourneau Offshore Products business, other asset impairments, various restructuring costs and certain other items as described further below. The Company also had income from discontinued operations of $431 million in 2015, which mainly represented the gain from the sale of the Company’s Centrifugal Compression business in the first quarter of 2015.
The Company’s income from continuing operations per diluted share totaled $0.36 for 2015, compared to earnings from continuing operations per diluted share of $3.83 for the same period in 2014. The other costs referred to above and described further in Note 4 of the Notes to Consolidated Condensed Financial Statements totaled $3.64 per diluted share for 2015.
The results for 2014 included after-tax charges of $0.31 per share, primarily related to a goodwill impairment charge in the Process Systems and Equipment (PSE) business, a loss on disposal of non-core assets, as well as severance, restructuring and other costs, net of certain non-operating gains.
25
Total revenues for the Company decreased $1.6 billion, or 15%, during 2015 as compared to 2014. Revenues declined in each segment due to the impact of the weak market conditions resulting from the decrease in commodity prices and activity levels that began in the latter part of 2014.
The Company’s product margins (defined as revenues minus cost of sales, excluding depreciation and amortization, divided by revenues) increased from 28.1% during 2014 to 30.2% for 2015, mainly due to improvements in project execution coupled with favorable margin mix compared to the prior year in the Subsea and Drilling segments, partially offset by pricing pressures, higher costs and volume declines in the Surface and V&M segments, as described further below under “Segment Results”.
Selling and administrative expenses decreased $205 million, or 16%, during 2015 as compared to 2014. This decrease reflects the results of the Company’s response to the declining markets and the internal transformation which began in 2014. The goal of this transformation effort is to permanently lower the Company’s operating cost structure. Selling and administrative expenses were 12.3% of revenues in 2015, down from 12.4% in 2014.
Depreciation and amortization expense decreased $6 million, from $348 million in 2014 to $342 million in 2015, mainly reflecting lower amortization expense on certain intangible assets.
Interest expense net of interest income, increased $9 million, from $129 million in 2014 to $138 million in 2015, mainly as a result of $500 million of new senior notes issued in June 2014 and changes to interest accruals on uncertain tax positions.
During 2015, the Company incurred $773 million of asset charges and other costs, net of gains, compared to $73 million in 2014, as outlined below:
Year Ended December 31, | |||||||
(dollars in millions) | 2015 | 2014 | |||||
Asset charges - | |||||||
Goodwill impairment | $ | 517 | $ | 40 | |||
Other long-lived asset impairments | 78 | 4 | |||||
Accelerated depreciation on underutilized assets | 44 | — | |||||
Total asset charges | 639 | 44 | |||||
Other costs (gains) - | |||||||
Facility closures and severance | 88 | 15 | |||||
Loss on disposal of non-core assets | 15 | 10 | |||||
Mark-to-market impact on currency derivatives not designated as accounting hedges | 11 | 8 | |||||
Merger costs | 8 | — | |||||
Gain from remeasurement of prior interest in equity method investment | — | (8 | ) | ||||
All other costs, net | 12 | 4 | |||||
Total other costs (gains), net | 134 | 29 | |||||
Total asset charges and other costs (gains), net | $ | 773 | $ | 73 | |||
26
The Company’s effective income tax rate on income from continuing operations in 2015 was 57.3% as compared to 23.9% in 2014. The components of the effective tax rates for both periods were as follows:
Year Ended December 31, | ||||||||||
2015 | 2014 | |||||||||
(dollars in millions) | Tax Provision | Tax Rate | Tax Provision | Tax Rate | ||||||
Provision based on statutory rates in jurisdictions where income is earned | $ | 63 | 19.7 | % | $ | 254 | 23.5 | % | ||
Adjustments to income tax provision: | ||||||||||
Impairments with no tax benefit | 109 | 33.9 | 9 | 0.9 | ||||||
Other asset impairments | (5 | ) | (1.6 | ) | — | — | ||||
Finalization of prior year returns | 2 | 0.6 | 17 | 1.6 | ||||||
Tax effects of changes in legislation | (4 | ) | (1.1 | ) | 2 | 0.2 | ||||
Accrual adjustments and other | 20 | 6.1 | (19 | ) | (1.8 | ) | ||||
Changes in valuation allowance | (1 | ) | (0.3 | ) | (5 | ) | (0.5 | ) | ||
Tax provision | $ | 184 | 57.3 | % | $ | 258 | 23.9 | % | ||
Segment Results – 2015 Compared to 2014
Segment revenues and operating income before interest and income taxes represent the results of activities involving third-party customers and transactions with other segments. Segment operating income before interest and income taxes represents the profit remaining in the segment after deducting third-party and intersegment cost of sales, selling and administrative expenses and depreciation and amortization expense from third-party and intersegment revenues. For further information on the Company’s segments, see Note 16 of the Notes to Consolidated Financial Statements included in Part II, Item 8 of this Annual Report on Form 10-K.
Subsea Segment
Year Ended December 31, | Increase (Decrease) | |||||||||||||
(dollars in millions) | 2015 | 2014 | $ | % | ||||||||||
Revenues | $ | 2,753 | $ | 3,067 | $ | (314 | ) | (10.2 | )% | |||||
Segment operating income before interest and income taxes | $ | 407 | $ | 207 | $ | 200 | 96.6 | % | ||||||
Segment operating income before interest and income taxes as a percent of revenues | 14.8 | % | 6.7 | % | N/A | 8.1 pts. | ||||||||
Orders | $ | 2,228 | $ | 2,356 | $ | (128 | ) | (5.4 | )% | |||||
Backlog (at period-end) | $ | 3,421 | $ | 4,263 | $ | (842 | ) | (19.8 | )% | |||||
Revenues
Revenues decreased in 2015 as compared to 2014 due to weak new project orders in 2014 and 2015. As a result, as projects in beginning backlog are completed, there are fewer projects in remaining backlog ready for execution. The decrease in revenues was primarily a result of completion of a large subsea project offshore West Africa during 2015 and lower 2015 activity levels on a Canada offshore subsea project as compared to 2014.
Segment operating income before interest and income taxes as a percent of revenues
Segment operating income before interest and income taxes as a percent of revenues improved in 2015 as compared to 2014, due mainly to strong project execution and better cost control which improved margin performance, primarily associated with large subsea projects (a 6.5 percentage-point increase) and lower selling and administrative expenses and depreciation and amortization (a combined 1.6 percentage-point increase).
27
Orders
Orders declined in 2015 as compared to 2014, as customers delayed investment decisions, and reduced planned project scopes reflecting changing market conditions during the year. This decline was partially offset by orders for 12 additional subsea trees in 2015 as compared to the 201 trees in 2014, mainly for installation in fields offshore North Africa.
Backlog (at period-end)
Backlog has been negatively impacted by project award delays as customers adjust their spending due to falling oil prices. As a result, progress on existing projects exceeded new project awards during 2015 resulting in a reduction in backlog levels at December 31, 2015 as compared to December 31, 2014.
Surface Segment
Year Ended December 31, | Decrease | |||||||||||||
(dollars in millions) | 2015 | 2014 | $ | % | ||||||||||
Revenues | $ | 1,957 | $ | 2,411 | $ | (454 | ) | (18.8 | )% | |||||
Segment operating income before interest and income taxes | $ | 264 | $ | 427 | $ | (163 | ) | (38.2 | )% | |||||
Segment operating income before interest and income taxes as a percent of revenues | 13.5 | % | 17.7 | % | N/A | (4.2) pts. | ||||||||
Orders | $ | 1,770 | $ | 2,480 | $ | (710 | ) | (28.6 | )% | |||||
Backlog (at period-end) | $ | 884 | $ | 1,025 | $ | (141 | ) | (13.8 | )% | |||||
Revenues
Revenues decreased in 2015 as compared to 2014 due mainly to lower volume resulting from declining market fundamentals in North America and weak pricing, which in total accounted for nearly two-thirds of the decline in revenues. The remaining decrease was largely attributable to lower shipments for North Sea projects, partially offset by higher deliveries from existing backlog to customers in the Middle East.
Segment operating income before interest and income taxes as a percent of revenues
Higher depreciation and amortization expense in 2015 in relation to lower revenues for the year resulted in a decline of 1.7 percentage points in the ratio of segment operating income before interest and income taxes as a percent of revenues during 2015 as compared to 2014. While cost control efforts contributed to a decline in selling and administrative costs in 2015 as compared to 2014, the decline was only about one-half the rate of decline in revenues which lowered the ratio of segment operating income before interest and income taxes as a percent of revenues by a further 1.4 percentage points. Finally, lower product margins, largely due to pricing pressures and lower volumes, resulted in an additional 1.2 percentage-point decline in the ratio during 2015.
Orders
Orders were down across all major regions of the world with weak market conditions in North America accounting for over one-half of the decline. Lower demand for equipment in the North Sea and from customers in Saudi Arabia, Mexico and Venezuela largely contributed to the remaining decrease.
Backlog (at period-end)
Backlog declined from December 31, 2014 at many of the segment's locations in North America, South America and the Asia-Pacific region as new equipment order rates fell short of deliveries during the year.
28
Drilling Segment
Year Ended December 31, | Increase (Decrease) | |||||||||||||
(dollars in millions) | 2015 | 2014 | $ | % | ||||||||||
Revenues | $ | 2,708 | $ | 3,049 | $ | (341 | ) | (11.2 | )% | |||||
Segment operating income before interest and income taxes | $ | 528 | $ | 474 | $ | 54 | 11.4 | % | ||||||
Segment operating income before interest and income taxes as a percent of revenues | 19.5 | % | 15.5 | % | N/A | 4.0 pts. | ||||||||
Orders | $ | 1,107 | $ | 2,449 | $ | (1,342 | ) | (54.8 | )% | |||||
Backlog (at period-end) | $ | 1,611 | $ | 3,327 | $ | (1,716 | ) | (51.6 | )% | |||||
Revenues
Service revenues, which include activities and products to support our existing customer installed base, declined 20% in 2015 as compared to 2014, driven by material decreases in offshore and onshore drilling activity levels during the year. This accounted for more than one-half of the decline in total revenues. New equipment revenues were also down 5%, largely related to declining project activity levels as a result of lower beginning-of-the-year project backlog.
Segment operating income before interest and income taxes as a percent of revenues
The increase in the 2015 ratio of segment operating income before interest and income taxes as a percent of revenues in comparison to 2014 was due primarily to (i) higher margin new equipment and project mix in 2015, combined with continued improvement in project execution, and (ii) cost control efforts, which led to a decrease in selling and administrative expenses in 2015 as compared to 2014, adding 4.5 percentage-points to the ratio. This was partially offset by higher depreciation and amortization expense, mainly associated with amortization of certain intangible assets, in relation to lower revenues, which resulted in a decline of 0.5 percentage-points in the ratio.
Orders
Nearly three-fourths of the decline in segment orders was attributable to (i) shut down in awards for large rig construction and drilling stack project awards in 2015 and (ii) weakness in demand for new equipment on onshore and jackup rigs. The remaining decline was largely attributable to current market weakness and constrained spending by customers that resulted in a 37% decline in service orders, which include activities and products to support our existing customer installed base.
Backlog (at period-end)
Over 90% of the decline in backlog at December 31, 2015 from December 31, 2014, was due mainly to the slowdown in large rig construction and drilling stack project awards in 2015 and lower demand for new equipment on onshore and jackup rigs, as described above.
29
V&M Segment
Year Ended December 31, | Decrease | |||||||||||||
(dollars in millions) | 2015 | 2014 | $ | % | ||||||||||
Revenues | $ | 1,548 | $ | 2,125 | $ | (577 | ) | (27.2 | )% | |||||
Segment operating income before interest and income taxes | $ | 177 | $ | 393 | $ | (216 | ) | (55.0 | )% | |||||
Segment operating income before interest and income taxes as a percent of revenues | 11.4 | % | 18.5 | % | N/A | (7.1) pts. | ||||||||
Orders | $ | 1,418 | $ | 2,091 | $ | (673 | ) | (32.2 | )% | |||||
Backlog (at period-end) | $ | 701 | $ | 921 | $ | (220 | ) | (23.9 | )% | |||||
Revenues
Overall, segment revenues for 2015 were down 27% when compared to 2014, primarily due to weaker demand for products sold into the upstream drilling and production market segments in North America. Valve sales into the North American upstream drilling and production markets were down 33% as our major distributors significantly reduced their inventory levels in response to market weakness in North America. In addition, a lower beginning-of-year backlog largely accounted for a 24% decline in sales of valves used in midstream pipeline and critical service applications in comparison to 2014. Similarly, sales of Measurement products were down 28% in 2015 as compared to 2014, due largely to lower demand for products sold into upstream production markets and lower project activity for midstream products sold into international markets. Services revenue, which include activities and products to support our existing customer installed base, also declined 12%, mainly due to lower activity levels in the Asia Pacific region.
Segment operating income before interest and income taxes as a percent of revenues
The decline in the ratio of segment operating income before interest and income taxes as a percent of revenues in 2015 as compared to 2014 was due to (i) a 3.8 percentage-point decline in product margins, largely related to pricing pressures and the impact of higher inventory obsolescence, warranty and research and development costs during 2015, (ii) the impact of selling and administrative costs which, although declining, did not decline at the same rate as revenues (a 2.2 percentage-point decline), and (iii) increased depreciation and amortization expense in relation lower revenues, which negatively impacted the ratio by 1.1 percentage points.
Orders
Segment orders for 2015 were down 32% when compared to 2014, primarily due to weaker demand for products sold into the upstream drilling, subsea and production market segments. Orders for valves to be used in the upstream drilling and production markets in North America were down 51% as compared to 2014, accounting for more than one-half the total decrease in segment orders. Demand for valves to be used primarily in liquefied natural gas (LNG), refinery and petrochemical applications were down 22% due to lower project activity levels in 2015. Measurement orders were also down 31% in 2015 as compared to 2014, due primarily to lower demand for products sold into upstream markets in North America and international midstream project delays. Finally, services orders, which include activities and products to support our existing customer installed base, declined 11% in 2015 as compared to 2014, primarily due to lower activity levels in the Asia Pacific region.
Backlog (at period-end)
Almost one-half of the decline in backlog in the V&M segment at December 31, 2015 as compared to December 31, 2014, was due to the lack of demand for pipeline and critical service valves resulting from low activity levels associated with new LNG, refinery and petrochemical projects. Low order rates from major distributors for valves to be used in the North American upstream drilling and production markets also accounted for an additional 42% of the backlog decline as of December 31, 2015.
Corporate Expenses
Corporate expenses were $108 million for 2015, a decline of $37 million from $145 million in 2014. This decrease reflects the results of the Company's internal transformation which began in 2014. The goal of this transformation effort is to permanently lower the Company's operating cost structure.
30
Year Ended December 31, 2014 Compared to Year Ended December 31, 2013
Market Conditions
Information related to a measure of drilling activity and certain commodity spot and futures prices during each year and the number of available deepwater floaters at the end of each period follows:
Year Ended December 31, | Increase (Decrease) | |||||||||||||
2014 | 2013 | Amount | % | |||||||||||
Drilling activity (average number of working rigs during period)1: | ||||||||||||||
United States | 1,861 | 1,761 | 100 | 5.7 | % | |||||||||
Canada | 380 | 355 | 25 | 7.0 | % | |||||||||
Rest of world | 1,337 | 1,296 | 41 | 3.2 | % | |||||||||
Global average rig count | 3,578 | 3,412 | 166 | 4.9 | % | |||||||||
Commodity prices (average of daily U.S. dollar prices per unit during period)2: | ||||||||||||||
West Texas Intermediate (WTI) Cushing, OK crude spot price (per barrel) | $ | 93.03 | $ | 98.01 | $ | (4.98 | ) | (5.1 | )% | |||||
Brent crude spot price (per barrel) | $ | 99.01 | $ | 105.76 | $ | (6.75 | ) | (6.4 | )% | |||||
Henry Hub natural gas spot price (per MMBtu) | $ | 4.35 | $ | 3.73 | $ | 0.62 | 16.6 | % | ||||||
Twelve-month futures strip price (U.S. dollar amount at period end)2: | ||||||||||||||
West Texas Intermediate Cushing, OK crude oil contract (per barrel) | $ | 56.57 | $ | 95.79 | $ | (39.22 | ) | (40.9 | )% | |||||
Brent crude oil contract (per barrel) | $ | 57.33 | $ | 110.80 | $ | (53.47 | ) | (48.3 | )% | |||||
Henry Hub natural gas contract (per MMBtu) | $ | 3.06 | $ | 4.19 | $ | (1.13 | ) | (27.0 | )% | |||||
Contracted drillships and semi submersibles by location3: | ||||||||||||||
U.S. Gulf of Mexico | 53 | 46 | 7 | 15.2 | % | |||||||||
Central and South America | 63 | 73 | (10 | ) | (13.7 | )% | ||||||||
Northwestern Europe | 44 | 47 | (3 | ) | (6.4 | )% | ||||||||
West Africa | 41 | 39 | 2 | 5.1 | % | |||||||||
Southeast Asia and Australia | 28 | 27 | 1 | 3.7 | % | |||||||||
Other | 49 | 48 | 1 | 2.1 | % | |||||||||
Total | 278 | 280 | (2 | ) | (0.7 | )% | ||||||||
1 Based on average monthly rig count data from Baker Hughes
2 Source: Bloomberg
3 Source: IHS – Petrodata
Drilling activity was generally strong for the first nine months of 2014 and then began to weaken toward the end of the year as commodity prices dropped sharply in the fourth quarter and continued their rapid decline during early 2015. We believe these declines in commodity prices will significantly reduce drilling activity levels in 2015, which will lower the demand for our products and services. Although the Company has a substantial backlog of work that is scheduled to be executed during 2015, weaker demand for our products and services is expected to have an adverse impact on new orders, revenues and earnings. Based on the Company’s long history in the energy sector, we believe such declines in commodity prices and demand are cyclical in nature. During such cyclical downturns, we take steps to adjust our commercial, manufacturing and support operations as appropriate to ensure that the Company remains competitive and financially sound. The Company cannot predict the duration or depth of this down-cycle.
31
The increase in drilling rig activity during 2014 as compared to 2013 was primarily due to an increase in North American rigs drilling for oil and higher activity levels in most major regions of the world, except Latin America. Despite the improvement in natural gas pricing for much of 2014, overall average drilling activity levels reflected only a modest improvement. The average number of rigs drilling for gas was down in North America during 2014 as compared to 2013. Rigs drilling for gas were approximately 18% of the total North American rig count in December 2014 compared to 21% in December 2013. While December 2014 rig count levels were near the averages for the full year, there was a 7% drop in the average global rig count level in January 2015, mainly as the result of a nearly 11% drop in the average U.S. rig count, reflecting the impact of the decline in commodity prices during the latter half of 2014.
Crude oil prices trended downward during the second half of 2014. For example, after reaching a high of $107.62 in late July, WTI crude prices closed the year at $53.27 per barrel, a decline of over 50%. The twelve month futures price for crude oil at December 31, 2014 was approximately 6% higher than spot prices at the end of the year. Prices for Brent crude followed a similar trend, ending the year with a $57.33 futures strip price, or 8% lower than the closing spot price. The year-end Brent crude spot price was down 44% from mid-year levels.
Natural gas prices were fairly consistent for much of 2014, averaging $4.35 per MMBtu at Henry Hub, which is a 17% increase as compared to 2013, although prices began to decline near the end of 2014. The 12-month futures strip price for natural gas at December 31, 2014 was $3.06 per MMBtu at Henry Hub, which is comparable to the spot price of $2.99 at December 31, 2014.
The total number of drillships and semi-submersibles available for contract and under contract at December 31, 2014 were generally consistent with the prior year with some redeployment occurring away from Central and South America to the U.S. Gulf of Mexico and certain other regions of the world. At December 31, 2014, the supply of available semisubmersibles and drillships currently exceeds demand with additional supply expected to come on-line during 2015. In connection with this and in response to current market conditions, certain drilling contractors have previously announced plans to cold stack or scrap certain older rigs in their existing portfolio during 2015.
Results of Operations
Consolidated Results – 2014 Compared to 2013
Net income attributable to Cameron stockholders for 2014 totaled $811 million, compared to $699 million for 2013. These amounts included $26 million and $65 million, respectively, of income from discontinued operations for 2014 and 2013. Discontinued operations include the Company’s Reciprocating Compression business sold in June 2014 and the Centrifugal Compression business for which the Company entered into a definitive agreement to sell in August 2014 (see Note 3 of the Notes to Consolidated Condensed Financial Statements for further information). The closing of the sale of Centrifugal Compression was effective January 1, 2015. Consolidated net income also includes $37 million and $25 million, respectively, of income attributable to noncontrolling interests for 2014 and 2013.
Earnings from continuing operations per diluted share attributable to Cameron stockholders totaled $3.83 in 2014, compared to $2.60 in 2013. Included in the 2014 and 2013 results were other costs, totaling $0.31 and $0.29 per diluted share, respectively, as described further below.
Total revenues for the Company increased $1.2 billion, or 13.6%, during 2014 as compared 2013. The vast majority of the increase was attributable to higher revenues in the Drilling and Surface segments reflecting the impact of higher beginning-of-the-year backlog and continued strength throughout a good portion of 2014 in North American activity levels. Revenues in the Subsea business were also up 9%, whereas V&M segment revenues were essentially flat with 2013.
The Company's product margins (defined as revenues minus cost of sales, excluding depreciation and amortization, divided by revenues) declined from 28.7% in 2013 to 28.1% in 2014, mainly as a result of lower product margins in the Surface and V&M segments largely related to pricing pressures and higher costs.
Selling and administrative expenses increased $12 million, or 1%, during 2014 as compared to 2013. Selling and administrative expenses were 12.4% of revenues for 2014, down from 13.9% for 2013, reflecting the impact of cost control efforts throughout the Company.
Depreciation and amortization expense totaled $348 million for 2014 as compared to $298 million during 2013, an increase of $50 million. The increase was due primarily to higher depreciation expense as a result of recent increased levels of capital spending, mainly in the Subsea and Surface segments.
32
Net interest increased $29 million, from $100 million during 2013 to $129 million during 2014, mainly as a result of additional interest associated with (i) $750 million of new senior notes issued by the Company in December 2013, and (ii) $500 million of new senior notes issued in June 2014.
During 2014, the Company incurred $73 million of asset charges and other costs, net of gains, as compared to $92 million in 2013 as outlined below:
Year Ended December 31, | |||||||
(dollars in millions) | 2014 | 2013 | |||||
Asset charges - | |||||||
Goodwill impairment | $ | 40 | $ | — | |||
Other long-lived asset impairments | 4 | — | |||||
Total asset charges | 44 | — | |||||
Other costs (gains) - | |||||||
Facility closures and severance | 15 | 13 | |||||
Loss on disposal of non-core assets | 10 | — | |||||
Mark-to-market impact on currency derivatives not designated as accounting hedges | 8 | 1 | |||||
Gain from remeasurement of prior interest in equity method investment | (8 | ) | — | ||||
All other costs, net | 4 | 78 | |||||
Total other costs (gains), net | 29 | 92 | |||||
Total asset charges and other costs (gains), net | $ | 73 | $ | 92 | |||
The Company’s effective tax rate for 2014 was 23.9% compared to 22.9% during 2013. The components of the effective tax rates for both years were as follows:
Year Ended December 31, | |||||||||||||
2014 | 2013 | ||||||||||||
(dollars in millions) | Tax Provision | Tax Rate | Tax Provision | Tax Rate | |||||||||
Provision based on statutory rates in jurisdictions where income is earned | $ | 254 | 23.5 | % | $ | 193 | 22.5 | % | |||||
Adjustments to income tax provision: | |||||||||||||
Changes in valuation allowance | (5 | ) | (0.5 | ) | (16 | ) | (1.9 | ) | |||||
Tax effect of goodwill impairment | 9 | 0.9 | — | — | |||||||||
Finalization of prior year returns | 17 | 1.6 | 29 | 3.4 | |||||||||
Tax effects of changes in legislation | 2 | 0.2 | (10 | ) | (1.1 | ) | |||||||
Accrual adjustments and other | (19 | ) | (1.8 | ) | — | — | |||||||
Tax provision | $ | 258 | 23.9 | % | $ | 196 | 22.9 | % | |||||
Segment Results – 2014 Compared to 2013
Segment revenues and operating income before interest and income taxes represent the results of activities involving third-party customers and transactions with other segments. Segment operating income before interest and income taxes represents the profit remaining in the segment after deducting third-party and intersegment cost of sales, selling and administrative expenses and depreciation and amortization expense from third-party and intersegment revenues. For further information on the Company’s segments, see Note 16 of the Notes to Consolidated Financial Statements included in Part II, Item 8 of this Annual Report on Form 10-K.
33
Subsea Segment
Year Ended December 31, | Increase (Decrease) | |||||||||||||
(dollars in millions) | 2014 | 2013 | $ | % | ||||||||||
Revenues | $ | 3,067 | $ | 2,813 | $ | 254 | 9.0 | % | ||||||
Segment operating income before interest and income taxes | $ | 207 | $ | 152 | $ | 55 | 36.2 | % | ||||||
Segment operating income before interest and income taxes as a percent of revenues | 6.7 | % | 5.4 | % | N/A | 1.3 pts. | ||||||||
Orders | $ | 2,356 | $ | 4,405 | $ | (2,049 | ) | (46.5 | )% | |||||
Backlog (at period-end) | $ | 4,263 | $ | 4,958 | $ | (695 | ) | (14.0 | )% | |||||
Revenues
Revenues increased in 2014 as compared to 2013 primarily as a result of higher international project activity levels on large subsea projects offshore Brazil and Nigeria, totaling nearly $600 million, partially offset by a nearly $300 million decrease in revenues on certain subsea projects nearing completion in the Gulf of Mexico and the Asia-Pacific region, as well as a 7% decline in custom processing equipment revenues.
Segment operating income before interest and income taxes as a percent of revenues
Segment operating income before interest and income taxes as a percent of revenues improved in 2014 as compared to 2013, due mainly to better margin performance on large subsea projects (a 1.7 percentage-point increase) and cost control efforts that limited increases in selling and administrative expenses (a 0.2 percentage-point increase). Partially offsetting these improvements was increased depreciation and amortization expense, largely associated with higher amortization of purchased intangibles and additional capital spending in recent periods that reduced segment operating income before interest and income taxes as a percent of revenues by 0.7 percentage points.
Orders
Orders declined significantly in 2014 as compared to 2013, a year in which there were four large project awards totaling over $1.7 billion received covering more than 90 new subsea trees and two large project awards for custom processing equipment totaling in excess of $300 million. No similar-sized large subsea or custom processing equipment orders were received in 2014.
Backlog (at period-end)
A decline in new project awards during 2014, along with increased revenues, were the main drivers for the reduction in backlog levels at December 31, 2014 as compared to December 31, 2013.
Surface Segment
Year Ended December 31, | Increase | |||||||||||||
(dollars in millions) | 2014 | 2013 | $ | % | ||||||||||
Revenues | $ | 2,411 | $ | 2,077 | $ | 334 | 16.1 | % | ||||||
Segment operating income before interest and income taxes | $ | 427 | $ | 367 | $ | 60 | 16.3 | % | ||||||
Segment operating income before interest and income taxes as a percent of revenues | 17.7 | % | 17.7 | % | N/A | 0.0 pts. | ||||||||
Orders | $ | 2,480 | $ | 2,372 | $ | 108 | 4.6 | % | ||||||
Backlog (at period-end) | $ | 1,025 | $ | 963 | $ | 62 | 6.4 | % | ||||||
Revenues
34
Revenues increased in 2014 as compared to 2013 due mainly to higher activity levels, as well as increased market penetration, in various North American unconventional resource regions, which accounted for over 60% of the increase in revenues. Other factors contributing to the revenue increase were higher deliveries to customers in the North Sea, Saudi Arabia and Oman, as well as higher sales of more than $70 million to the Company’s Drilling segment.
Segment operating income before interest and income taxes as a percent of revenues
Segment operating income before interest and income taxes as a percent of revenues was flat in 2014 as compared to 2013 as overall cost increases mostly mirrored the increase in revenues during 2014.
Orders
Orders were up modestly in 2014 as compared to 2013 as increased activity levels, along with higher market penetration in various North American unconventional resource regions, accounted for an increase of more than $200 million in orders, which was partially offset by a decline in 2014 demand from customers operating in Iraq, in comparison to the strong order levels received for that region in 2013.
Backlog (at period-end)
The increase in segment backlog at December 31, 2014 as compared to December 31, 2013 was entirely due to new equipment order rates exceeding deliveries during the year.
Drilling Segment
Year Ended December 31, | Increase (Decrease) | |||||||||||||
(dollars in millions) | 2014 | 2013 | $ | % | ||||||||||
Revenues | $ | 3,049 | $ | 2,327 | $ | 722 | 31.0 | % | ||||||
Segment operating income before interest and income taxes | $ | 474 | $ | 311 | $ | 163 | 52.4 | % | ||||||
Segment operating income before interest and income taxes as a percent of revenues | 15.5 | % | 13.4 | % | N/A | 2.1 pts. | ||||||||
Orders | $ | 2,449 | $ | 2,803 | $ | (354 | ) | (12.6 | )% | |||||
Backlog (at period-end) | $ | 3,327 | $ | 4,141 | $ | (814 | ) | (19.7 | )% | |||||
Revenues
Revenues increased in 2014 as compared to 2013 driven by execution of orders from the segment’s substantial beginning-of-the-year backlog levels and better project execution, which contributed to a 36% increase in new equipment revenues, as well as a 24% increase in demand for the Company’s services.
Segment operating income before interest and income taxes as a percent of revenues
The increase in segment operating income before interest and income taxes as a percent of revenues in 2014 as compared to 2013 was due primarily to cost control efforts which limited the amount of increase in selling and administrative expenses as compared to 2013, which accounted for 1.9 percentage points of the increase in the ratio.
Orders
Order rates declined in 2014 as compared to 2013, primarily as a result of a slowdown in large rig construction and drilling stack project awards in 2014, partially offset by a 3% improvement in orders for services.
Backlog (at period-end)
Backlog at December 31, 2014 decreased from December 31, 2013 mainly due to the slowdown in large rig construction and drilling stack project awards in 2014, as described above.
35
V&M Segment
Year Ended December 31, | Increase (Decrease) | |||||||||||||
(dollars in millions) | 2014 | 2013 | $ | % | ||||||||||
Revenues | $ | 2,125 | $ | 2,105 | $ | 20 | 1.0 | % | ||||||
Segment operating income before interest and income taxes | $ | 393 | $ | 414 | $ | (21 | ) | (5.1 | )% | |||||
Segment operating income before interest and income taxes as a percent of revenues | 18.5 | % | 19.7 | % | N/A | (1.2) pts. | ||||||||
Orders | $ | 2,091 | $ | 2,086 | $ | 5 | 0.2 | % | ||||||
Backlog (at period-end) | $ | 921 | $ | 1,017 | $ | (96 | ) | (9.4 | )% | |||||
Revenues
Overall, segment revenues for 2014 were relatively flat when compared to 2013 as a combined 12% increase in sales of valves to be used in the upstream drilling and production markets in North America and measurement products, mainly resulting from continued strength in the North American market for much of the year, were mostly offset by a combined 8% decrease in sales of valves for pipelines and critical service applications, due largely to project slippage, recent order weakness and delayed timing of valve deliveries resulting from various customer changes.
Segment operating income before interest and income taxes as a percent of revenues
The ratio of segment operating income before interest and income taxes as a percent of revenues declined in 2014 as compared to 2013 as a result of a 1.9 percentage-point decline in product margins, largely related to pricing pressures and the impact of higher manufacturing costs in the pipeline and critical service valve product lines, partially offset by lower selling and administrative costs which added 0.8 percentage points to the ratio of segment operating income before interest and income taxes as a percent of revenues.
Orders
Orders were essentially flat in 2014 as compared to 2013. Higher North American activity levels for much of 2014 resulted in a combined 14% full year order increase for valves to be used in the upstream drilling and production markets in North America and measurement products. Sequentially, however, order rates declined in both product lines in the fourth quarter of 2014 as compared to the third quarter of 2014 as a result of weakening commodity prices and activity levels during the latter half of 2014.
The full year product line increases described above were largely offset by a 14% combined decrease in demand for pipeline and critical service valves resulting mainly from project slippage and customer spending constraints associated with large international production expansion projects.
Backlog (at period-end)
Backlog levels for the V&M segment at December 31, 2014 decreased from December 31, 2013, as recent order rates for pipeline and critical service valves have not kept pace with recent deliveries. These decreases were partially offset by strong demand for valves to be used in the upstream drilling and production markets in North America during much of 2014.
Corporate Expenses
Corporate expenses were $145 million for 2014, a decline of $17 million from $162 million in 2013. The decrease was due primarily to lower spending associated with the Company’s information technology systems and lower costs associated with various legal matters.
Liquidity and Capital Resources
Consolidated statements of cash flows
During 2015, net cash provided by operations totaled $708 million, a decrease of $485.0 million from the $1.2 billion of cash provided by operations during the same period in 2014. This is largely reflective of the decline in earnings and changes in working capital during 2015 as compared to the same period in 2014.
36
Cash totaling $161 million was used for working capital during 2015 compared to the $5 million of cash provided by movements in working capital during the same period in 2014, a decrease of $166 million. During 2015, the timing of payments to third parties and the consumption of customer advances on projects largely contributed to a $913 million use of cash for during 2015. Increased collections of receivables mainly in the Drilling and Surface segments, added $390 million in cash. Inventory reductions, primarily in the Drilling segment, also increased cash by $362 million.
Cash provided by investing activities was $89 million for 2015 as compared to $96 million during the same period in 2014. In 2015, the Company received $831 million of cash, net of transaction costs, from the sale of the Centrifugal Compression business to Ingersoll Rand. In 2014, the Company received $547 million, net of transaction costs, from the sale of the Reciprocating Compression business to General Electric. Approximately $471 million of cash was used to increase the Company’s short term investments portfolio during 2015 as compared to $72 million for the same period in 2014. Capital spending for 2015 consumed $285 million, as compared to $385 million during the same period in 2014. Capital needs in the Subsea, Surface and Drilling segments accounted for the majority of the 2015 capital spending.
Net cash used for financing activities totaled $461 million for 2015 as compared to $1.6 billion used for financing activities during the same period in 2014. During 2015, the Company acquired over 5 million shares of treasury stock at a cash cost of $240 million. Over $1.7 billion of cash was used to acquire approximately 27 million shares of treasury stock during 2014. In 2014, the Board of Directors authorized the Company to initiate a commercial paper program with authority to issue up to $500 million in short-term debt. Under this program, the Company had $201 million of outstanding commercial paper at December 31, 2014 that was repaid during 2015. In June 2014, the Company issued a total of $500 million of new senior notes split equally between 3- and 10-year maturities and, in July 2014, made an early redemption of senior notes at a cash cost of $253 million.
Future liquidity requirements
At December 31, 2015, the Company had $2.4 billion of cash, cash equivalents and short-term investments. Approximately $815 million of the Company’s cash, cash equivalents and short-term investments at December 31, 2015 were in the OneSubsea venture. Dividends of available cash from OneSubsea to the venture partners require unanimous approval of the OneSubsea Board of Directors prior to payment.
Of the remaining cash, cash equivalents and short-term investments not in the OneSubsea venture, $715 million was located in the United States. Total debt at December 31, 2015 was approximately $2.8 billion, most of which was in the United States. Excluding capital leases, approximately $950 million of the senior notes have maturities within the next three-year period. The remainder of the Company’s long-term debt is due in varying amounts between 2021 and 2043.
Largely as a result of the weak market conditions which have suppressed new demand, the Company’s backlog at December 31, 2015 has declined $2.9 billion, or 31%, since December 31, 2014 to approximately $6.6 billion at December 31, 2015. Additionally, orders during 2015 were down approximately 30% from the same period in 2014. The Company views its backlog of unfilled orders, current order rates, current rig count levels and current and future expected oil and gas prices to be, in varying degrees, leading indicators of and factors in determining its estimates of future revenues, cash flows and profitability levels. Information regarding average rig count and commodity price levels in 2015 and 2014 and forward-looking twelve-month market-traded futures prices for crude oil and natural gas are shown in more detail under the captions “Market Conditions” above. A more detailed discussion of orders and December 31, backlog levels by segment may be found under “Segment Results” above.
While the Company believes, based on its past experience, that the current decline in commodity prices and the level of demand are cyclical in nature, we cannot predict the duration or depth of this down cycle. The current weak level of orders and the decline in backlog have negatively impacted our reported revenues and results of operations and will continue to negatively impact those measures of performance in the future until customer demand begins to increase again. As a result of these market conditions, the Company has taken steps to control costs and adjust production levels to match current and expected demand.
In order to extend the length of its currently available credit facilities, the Company, including certain of its subsidiaries, entered into an amended and restated multi-currency credit agreement (the “Credit Agreement”) with various banks and other financial institutions on May 14, 2015. The Credit Agreement is for $750 million, has a term of five years, expiring on May 14, 2020, and replaces a previously existing $835 million multi-currency credit agreement due to expire in June 2016. The Credit Agreement will be used to finance working capital needs and for other general corporate purposes, including acquisitions, capital expenditures, repurchases of common stock, repayment of debt and issuances of letters of credit. Up to $200 million of this facility may be used for letters of credit. At December 31, 2015, The Company issued no letters of credit, leaving the full $750 million available for future use.
37
The Company also has a $750 million multi-currency syndicated Revolving Credit Facility expiring April 11, 2017. Up to $200 million of this facility may be used for letters of credit. The Company has issued letters of credit totaling $34 million under the Revolving Credit Facility, leaving $716 million available for future use at December 31, 2015.
Despite current market conditions, the Company believes, based on its current financial condition, existing backlog levels and current expectations for future longer-term market conditions, that it will be able to meet its short- and longer-term liquidity needs with existing cash, cash equivalents and short-term investments on hand, expected cash flow from future operating activities and amounts available for borrowing under the credit facilities described above, including its $500 million commercial paper program described further in Note 11 of the Notes to Consolidated Condensed Financial Statements, and any future credit facilities the Company may enter into.
Critical Accounting Policies
The Company believes the following critical accounting policies affect the more significant judgments and estimates used in the preparation of its consolidated financial statements. These policies and the other sections of the Company’s Management’s Discussion and Analysis of Results of Operations and Financial Condition have been reviewed with the Company’s Audit Committee of the Board of Directors.
Revenue Recognition — The Company generally recognizes revenue, net of sales taxes, related to products, services or rental arrangements once the following four criteria are met: (i) persuasive evidence of an arrangement exists, (ii) delivery of the equipment has occurred or the customer has taken title and risk of loss or services have been rendered, (iii) the price of the equipment or service is fixed and determinable and (iv) collectibility is reasonably assured. For engineering, procurement and construction-type contracts, revenue is generally reported on the percentage-of-completion method of accounting. Progress is primarily measured by the completion of milestones; however, progress for specific types of subsea and drilling systems contracts, which differ from our other contracts, is measured by the ratio of actual costs incurred to date on the project in relation to total estimated project costs. Both methods require the Company to make estimates regarding the total costs of the project, which impacts the amount of gross margin the Company recognizes in each reporting period. Under the percentage-of-completion method, the use of estimated costs to complete each contract is a significant variable in the process of determining recognized revenue and is a significant factor in accounting for contracts. All known or anticipated losses on contracts are provided for in the period they become evident. Revenues and gross profit on contracts can be significantly affected by change orders that may be approved subsequent to completion of related work. If it is not probable that costs will be recovered through a change in contract price, the costs attributable to change orders are treated as contract costs without incremental revenue. If it is probable that costs will be recovered through a change order, the costs are treated as contract costs and contract revenue is recognized to the extent of the lesser of the amounts management expects to recover or the costs expected to be incurred.
Factors that may affect future project costs and margins include the ability to properly execute the engineering and design phases consistent with our customers’ expectations, production efficiencies obtained, and the availability and costs of labor, materials and subcomponents. These factors can significantly impact the accuracy of the Company’s estimates and can materially impact the Company’s future period earnings. Approximately 32%, 31% and 31% of the Company's revenues for the years ended December 31, 2015, 2014 and 2013, respectively, were recognized under the percentage-of-completion method.
Goodwill and Intangible Assets — Cameron allocates the purchase price of acquired businesses to their identifiable tangible assets and liabilities, such as accounts receivable, inventory, property, plant and equipment, accounts payable and accrued liabilities, based on their estimated fair values. The Company also typically allocates a portion of the purchase price to identifiable intangible assets, such as noncompete agreements, trademarks, trade names, patents, technology, customer relationships and backlog using various widely accepted valuation techniques such as discounted future cash flows and the relief-from-royalty and excess earnings methods. Each of these methods involves level 3 unobservable market inputs. Any remaining excess of cost over allocated fair values is recorded as goodwill. On larger acquisitions, Cameron will typically engage third-party valuation experts to assist in determining the fair values for both the identifiable tangible and intangible assets. Certain estimates and judgments are required in the application of the fair value techniques, including estimates of future cash flows, selling prices, replacement costs, royalty rates for use of assets, economic lives and the selection of a discount rate.
The Company reviews the carrying value of goodwill in accordance with accounting rules on impairment of goodwill, which require that the Company estimate the fair value of each of its reporting units annually, or when impairment indicators exist, and compare such amounts to their respective carrying values to determine if an impairment of goodwill is required. The estimated fair value of each reporting unit is primarily determined using discounted future expected cash flows (level 3 unobservable inputs) consistent with the accounting guidance for fair-value measurements. Certain estimates and judgments are required in the application of the fair value models, including, but not limited to, estimates of future cash flows and the selection of a discount rate. At December 31, 2015, the Company’s reporting units for goodwill impairment evaluation purposes were the OneSubsea, Process Systems, Surface, Drilling, Valves and Measurement businesses. Prior to the fourth quarter of
38
2014, there were five reporting units within the V&M segment (now combined into two reporting units based on changes in management’s reporting structure during the fourth quarter of 2014).
In connection with our annual goodwill impairment test as of March 31, 2015, we tested the goodwill for each of our six reporting units. With the exception of the Process Systems reporting unit, no goodwill impairments were indicated. With respect to the Process Systems reporting unit, our determination of fair value as of March 31, 2015 considered events that occurred in the first quarter, as well as our updated long-term outlook for this reporting unit. Those events included ongoing changes in the energy industry during the first quarter of 2015, a 42% reduction in North American rig count, numerous industry-wide deepwater project deferrals and idling of deepwater drilling rigs, as well as significant capital spending cuts announced by a number of oil and gas exploration companies since December 31, 2014. Consistent with these industry-wide market changes, the Company also experienced the loss or indefinite deferral of several major project awards that we previously anticipated receiving. Accordingly, when determining the fair value of the Process Systems reporting unit as of March 31, 2015, our projections considered these factors as well as the negative impact of the low commodity price environment on the long-term outlook for revenue growth and profitability in this business. Based on these considerations, we concluded the fair value (estimated using Level 3 unobservable inputs) of the Process Systems reporting unit was less than its carrying value as of March 31, 2015. We conducted a Step 2 analysis, which included a hypothetical purchase price allocation, and recorded a goodwill impairment charge of $517 million. As of December 31, 2015, following the impairment, the Process Systems reporting unit had $52 million of goodwill remaining.
With the continued decline in commodity prices and activity levels since our annual goodwill impairment test, we performed a qualitative assessment of current market conditions and our future long-term expectations of oil and gas markets as of December 31, 2015 to conclude as to whether it was more likely than not that the fair values of our reporting units continued to be higher than each respective reporting unit's carrying value at December 31, 2015. Our assessment took into consideration, among other things, the valuation of Cameron that was implied in the August 2015 announcement of the merger with Schlumberger, as well as changes in commodity prices and activity levels and financial performance during 2015 by each of our reporting units, against expectations that were considered as part of the annual goodwill impairment test as of March 31, 2015. As a result of our analysis, no further impairment of goodwill was required as of December 31, 2015.
Intangible assets are tested for recoverability whenever events or changes in circumstances indicate that the carrying amount of the asset may not be recoverable. In such an event, the Company will determine the fair value of the asset using an undiscounted cash flow analysis of the asset at the lowest level for which identifiable cash flows exist. If an impairment has occurred, the Company will recognize a loss for the difference between the carrying value and the estimated fair value of the intangible asset. Additional information relating to the Company’s goodwill and intangible assets may be found in Note 7 of the Notes to Consolidated Financial Statements. Information relating to previous impairments of intangible assets may be found in Note 4 of the Notes to Consolidated Financial Statements.
Long-Lived Assets — In accordance with accounting rules for the impairment or disposal of long-lived assets, such assets, excluding goodwill and indefinite-lived intangibles, to be held and used by the Company are reviewed, at least quarterly, to determine whether any events or changes in circumstances indicate that the carrying amount of the asset may not be recoverable or that its remaining useful life may be shorter than previously expected. For long-lived assets to be held and used, the Company bases its evaluation on impairment indicators such as the nature of the assets, the future economic benefit of the assets, any historical or future profitability measurements and other external market conditions or factors that may be present. If such impairment indicators are present or other factors exist that indicate the carrying amount of the asset may not be recoverable, the Company determines whether an impairment has occurred through the use of an undiscounted cash flow analysis of the asset at the lowest level for which identifiable cash flows exist. If an impairment has occurred, the Company recognizes a loss for the difference between the carrying amount and the fair value of the asset, which in most cases is estimated based upon Level 3 unobservable inputs. If the asset is determined to have a remaining useful life shorter than previously expected, an adjustment for the shorter remaining life will be made for purposes of recognizing future depreciation expense. Assets are classified as held for sale when the Company has a plan, approved by the appropriate levels of management, for disposal of such assets and those assets are stated at the lower of carrying value or estimated fair value less estimated costs to sell. During the years ended December 31, 2015 and 2014, the Company identified various instances of assets whose carrying values were impaired or had shorter remaining useful lives than previously anticipated due to current and expected future market conditions. The impairment charges and accelerated depreciation amounts associated with these items are discussed further in Note 4 of the Notes to Consolidated Financial Statements. If future market conditions continue to weaken beyond currently expected levels, additional instances of asset impairments may be identified if the Company further adjusts its operations to respond to these changes.
Contingencies — The Company accrues for costs relating to litigation when such liabilities become probable and reasonably estimable. Such estimates may be based on advice from third parties, amounts specified by contract, amounts designated by legal statute or management’s judgment, as appropriate. Revisions to contingent liabilities are reflected in income in the period
39
in which different facts or information become known or circumstances change that affect the Company’s previous assumptions with respect to the likelihood or amount of loss. Amounts paid upon the ultimate resolution of contingent liabilities may be materially different from previous estimates and could require adjustments to the estimated reserves to be recognized in the period such new information becomes known. See Note 20 of the Notes to Consolidated Financial Statements.
Uncertain Tax Positions — The Company accounts for uncertainties in its income tax positions in accordance with income tax accounting rules. Rulings from tax authorities on the validity and amounts allowed for uncertain tax positions taken in current and previous income tax filings could impact the Company’s estimate of the value of its uncertain tax positions in those filings. Changes in the Company’s estimates are recognized as an increase or decrease in income tax expense in the period determined. See Note 13 of the Notes to Consolidated Financial Statements for further information.
Pension and Postretirement Benefits Accounting — The Company recognizes the funded status of its defined benefit pension and other postretirement benefit plans in its Consolidated Balance Sheets. The measurement date for all of the Company’s plans was December 31, 2015. As described more fully in Note 9 of the Notes to Consolidated Financial Statements, the assumptions used in calculating the pension amounts recognized in the Company’s consolidated financial statements include discount rates, interest costs, expected return on plan assets, retirement and mortality rates, inflation rates, salary growth and other factors. The Company based the discount rate assumptions of its defined benefit pension plans on the average yields at December 31, 2015 of hypothetical high-quality bond portfolios (rated AA- or better) with maturities that approximately matched the estimated cash flow needs of the plans. The Company’s inflation assumptions were based on an evaluation of external market indicators. The expected rates of return on plan assets were based on historical experience and estimated future investment returns taking into consideration anticipated asset allocations, investment strategy and the views of various investment professionals. During 2015, the actual return on plan assets was approximately $11 million. The difference between this actual return and the estimated 2015 return on those assets of $23 million will be deferred in accumulated other elements of comprehensive income and amortized as an increase to expense over the remaining service life of the plan participants. Retirement and mortality rates were based primarily on actuarial tables that were expected to best approximate actual plan experience. In accordance with the accounting requirements for retirement plans, actual results that differ from pension and postretirement benefit plan assumptions are recorded in accumulated other elements of comprehensive income as a net actuarial gain or loss and amortized over future periods and, therefore, generally affect recognized expense and the recorded obligation in future periods. At December 31, 2015, the Company had a net after-tax accumulated actuarial loss, totaling $112 million, that will be amortized as an increase in future pension expense. While the Company believes the assumptions used are appropriate, differences in actual experience or changes in assumptions may affect the Company’s pension obligations and future expense.
The following table illustrates the sensitivity to a change in certain assumptions used in (i) the calculation of pension expense for the year ending December 31, 2016 and (ii) the calculation of the projected benefit obligation (PBO) at December 31, 2015 for the Company’s most significant pension plan, the United Kingdom pension plan:
(dollars in millions) | Increase (decrease) in 2016 pre-tax pension expense | Increase (decrease) in PBO at December 31, 2015 | |||||
Change in Assumption: | |||||||
25 basis point decrease in discount rate | $ | 2 | $ | 14 | |||
25 basis point increase in discount rate | $ | (1 | ) | $ | (13 | ) | |
25 basis point decrease in expected return on assets | $ | 1 | $ | — | |||
25 basis point increase in expected return on assets | $ | (1 | ) | $ | — | ||
Forward-looking Statement Disclaimer
In addition to the historical data contained herein, this Annual Report, including the information set forth in the Company’s Management’s Discussion and Analysis of Financial Condition and Results of Operations and elsewhere in this report, may include forward-looking statements regarding future market strength, customer spending and order levels, revenues and earnings of the Company, as well as expectations regarding equipment deliveries, margins, profitability, the ability to control and reduce raw material, overhead and operating costs, cash generated from operations, capital expenditures and the use of existing cash balances and future anticipated cash flows made in reliance upon the safe harbor provisions of the Private Securities Litigation Reform Act of 1995. The Company’s actual results may differ materially from those described in any forward-looking statements.
40
Any such statements are based on current expectations of the Company’s performance and are subject to a variety of factors, some of which are not under the control of the Company, but which can affect the Company’s results of operations, liquidity or financial condition. Such factors may include overall demand for, and pricing of, the Company’s products; the size and timing of orders; the Company’s ability to successfully execute large subsea and drilling projects it has been awarded; the possibility of cancellations of orders in backlog; the Company’s ability to convert backlog into revenues on a timely and profitable basis; warranty and product liability claims; the impact of acquisitions the Company has made or may make; the potential impairment of goodwill related to such acquisitions; changes in the price of (and demand for) oil and gas in both domestic and international markets; raw material costs and availability; political and social issues affecting the countries in which the Company does business; fluctuations in currency markets worldwide; and variations in global economic activity. In particular, current and projected oil and gas prices historically have generally directly affected customers’ spending levels and their related purchases of the Company’s products and services. As a result, changes in oil and gas price expectations may impact the demand for the Company’s products and services and the Company’s financial results. See additional factors discussed in “Factors That May Affect Financial Condition and Future Results” contained herein.
Because the information herein is based solely on data currently available, it is subject to change as a result of, among other things, changes in conditions over which the Company has no control or influence, and should not therefore be viewed as assurance regarding the Company’s future performance. Additionally, the Company is not obligated to make public disclosure of such changes unless required under applicable disclosure rules and regulations.
Estimates in Financial Statements
The Company’s discussion and analysis of its financial condition and results of operations are based upon the Company’s consolidated financial statements, which have been prepared in accordance with accounting principles generally accepted in the United States. The preparation of these financial statements requires management to make estimates and assumptions that affect the reported amounts of assets and liabilities and disclosure of contingent assets and liabilities at the date of the financial statements and the reported amounts of revenues and expenses during the reporting period. Such estimates include, but are not limited to, estimates of total contract profit or loss on certain long-term production contracts, estimated losses on accounts receivable, estimated realizable value on excess and obsolete inventory, contingencies (including tax contingencies, estimated liabilities for litigation exposures and liquidated damages), estimated warranty costs, estimates related to pension accounting, estimates used to determine fair values in purchase accounting, estimates related to the fair value of reporting units for purposes of assessing goodwill and long-lived assets for impairment and estimates related to deferred tax assets and liabilities, including valuation allowances on deferred tax assets. Actual results could differ materially from these estimates. The Company bases its estimates on historical experience and on various other assumptions that the Company believes are reasonable under the circumstances. Actual results may differ materially from these estimates under different assumptions or conditions.
Contractual Obligations and Other Commercial Commitments
The following summarizes the Company’s significant cash contractual obligations and other commercial commitments for the next five years as of December 31, 2015.
(dollars in millions) | Payments Due by Period | ||||||||||||||||||
Contractual Obligations | Total | Less Than 1 Year | 1 – 3 Years | 4 – 5 Years | After 5 Years | ||||||||||||||
Debt, including interest payments (a) | $ | 4,368 | $ | 397 | $ | 936 | $ | 176 | $ | 2,859 | |||||||||
Capital lease obligations (b) | 99 | 18 | 25 | 9 | 47 | ||||||||||||||
Operating leases | 495 | 109 | 143 | 104 | 139 | ||||||||||||||
Purchase obligations (c) | 1,044 | 987 | 53 | 4 | — | ||||||||||||||
Minimum required contributions to funded defined benefit pension plans (d) | 9 | 9 | — | — | — | ||||||||||||||
Benefit payments expected for unfunded pension and postretirement benefit plans (e) | 19 | 2 | 4 | 4 | 9 | ||||||||||||||
Liabilities for uncertain tax benefits (f) | 68 | 68 | — | — | — | ||||||||||||||
Total contractual cash obligations | $ | 6,102 | $ | 1,590 | $ | 1,161 | $ | 297 | $ | 3,054 | |||||||||
41
(a) | See Note 11 of the Notes to Consolidated Financial Statements included in Part II, Item 8 of this Annual Report on Form 10-K for further information. |
(b) | Payments shown include interest. |
(c) | Represents outstanding purchase orders entered into in the ordinary course of business. |
(d) | The Company does not estimate its future minimum required contributions beyond one year. |
(e) | Benefit payments after five years are those estimated for the years 2021 to 2025. |
(f) | The balance shown represents the current portion of the Company’s liability for uncertain tax benefits at December 31, 2015. The remaining noncurrent balance totaling $1 million has been excluded from the table as the Company cannot reasonably estimate the timing of the associated future cash outflows. |
(dollars in millions) | Amount of Commitment Expiration by Period | ||||||||||||||||||
Other Unrecorded Commercial Commitments and Off-Balance Sheet Arrangements | Total Commitment | Less Than 1 Year | 1 - 3 Years | 4 – 5 Years | After 5 Years | ||||||||||||||
Committed lines of credit available as of year-end | $ | 1,575 | 45 | 780 | 750 | — | |||||||||||||
Standby letters of credit and bank guarantees | 1,060 | 446 | 448 | 146 | 20 | ||||||||||||||
Financial letters of credit | 29 | 24 | — | — | 5 | ||||||||||||||
Insurance bonds | 36 | 34 | 2 | — | — | ||||||||||||||
Other financial guarantees | 7 | — | — | — | 7 | ||||||||||||||
Total commercial commitments | $ | 2,707 | $ | 549 | $ | 1,230 | $ | 896 | $ | 32 | |||||||||
The Company secures certain contractual obligations under various agreements with its customers or other parties through the issuance of letters of credit or bank guarantees. The Company has various agreements with financial institutions to issue such instruments. At December 31, 2015, the Company had $1.1 billion of letters of credit and bank guarantees outstanding in connection with the delivery, installation and performance of the Company’s products. Additional letters of credit and guarantees are outstanding at December 31, 2015 in connection with certain financial obligations of the Company. Should these facilities become unavailable to the Company, the Company’s operations and liquidity could be negatively impacted. Circumstances which could result in the withdrawal of such facilities include, but are not limited to, deteriorating financial performance of the Company (which could be caused by operating issues within the Company or weakness in the overall energy markets), deteriorating financial condition of the financial institutions providing such facilities, overall constriction in the credit markets, catastrophic accidents in the energy industry which could cause a contraction in the level of credit extended to the industry, or rating downgrades of the Company.
42
ITEM 7A. QUANTITATIVE AND QUALITATIVE DISCLOSURES ABOUT MARKET RISK
The Company is currently exposed to market risk from changes in foreign currency rates and changes in interest rates. A discussion of the Company’s market risk exposure in financial instruments follows.
Foreign Currency Exchange Rates
A large portion of the Company’s operations consist of manufacturing and sales activities in foreign jurisdictions, principally in Europe, Canada, West Africa, the Middle East, Latin America, China and other countries in the Pacific Rim. As a result, the Company’s financial performance may be affected by changes in foreign currency exchange rates in these markets. Overall, for those locations where the Company is a net receiver of local non-U.S. dollar currencies, Cameron generally benefits from a weaker U.S. dollar with respect to those currencies. Alternatively, for those locations where the Company is a net payer of local non-U.S. dollar currencies, a weaker U.S. dollar with respect to those currencies will generally have an adverse impact on the Company’s financial results. The impact on the Company’s financial results of gains or losses arising from foreign currency denominated transactions, if material, have been described under “Results of Operations” in this Management’s Discussion and Analysis of Financial Condition and Results of Operations for the periods shown.
In order to mitigate the effect of exchange rate changes, the Company will often structure sales contracts to provide for collections from customers in the currency in which the Company incurs its manufacturing costs. In certain instances, the Company will enter into foreign currency forward contracts to hedge specific large anticipated receipts or disbursements in currencies for which the Company does not traditionally have fully offsetting local currency expenditures or receipts. The Company was party to a number of long-term foreign currency forward contracts at December 31, 2015. The purpose of the majority of these contracts was to hedge large anticipated non-functional currency cash flows on major subsea, drilling, valve or other equipment contracts involving the Company’s United States operations and various wholly-owned international subsidiaries. Many of these contracts have been designated as and are accounted for as cash flow hedges, with changes in the fair value of those contracts recorded in accumulated other comprehensive income (loss) in the period such change occurs. Certain other contracts, many of which are centrally managed, are intended to offset other foreign currency exposures but have not been designated as hedges for accounting purposes and, therefore, any change in the fair value of those contracts are reflected in earnings in the period such change occurs. The Company expects to expand its use of such contracts in the future.
Capital Markets and Interest Rates
The Company is subject to interest rate risk on its variable-interest rate and commercial paper borrowings. Variable-rate debt, where the interest rate fluctuates periodically, exposes the Company’s cash flows to variability due to changes in market interest rates. Additionally, the fair value of the Company’s fixed-rate debt changes with changes in market interest rates.
The fair values of the 1.15% and 1.4% 3-year Senior Notes, the 3.6%, 3.7%, 4.0%, 4.5% and 6.375% 10-year Senior Notes and the 5.125%, 5.95% and 7.0% 30-year Senior Notes are principally dependent on prevailing interest rates. The fair value of the commercial paper is expected to approximate its book value.
The Company has various other long-term debt instruments, but believes that the impact of changes in interest rates in the near term will not be material to these instruments.
The Company has performed a sensitivity analysis to determine how market interest rate changes might affect the fair value of its debt. This analysis is inherently limited because it represents a singular, hypothetical set of assumptions. Actual market movements may vary significantly from the assumptions. The effects of market movements may also directly or indirectly affect the Company’s assumptions and its rights and obligations not covered by the sensitivity analysis. Fair value sensitivity is not necessarily indicative of the ultimate cash flow or the earnings effect from the assumed market rate movements.
An instantaneous one-percentage-point decrease in interest rates across all maturities and applicable yield curves would have increased the fair value of the Company’s fixed-rate debt positions by approximately $205 million at December 31, 2015 ($238 million at December 31, 2014), whereas a one-percentage-point increase in interest rates would have decreased the fair value of the Company’s fixed-rate debt by $198 million at December 31, 2015 $206 million at December 31, 2014). This analysis does not reflect the effect that increasing or decreasing interest rates would have on other items, such as new borrowings, nor the impact they would have on interest expense and cash payments for interest.
43
Derivatives Activity
Total gross volume bought (sold) by notional currency and maturity date on open derivative contracts at December 31, 2015 was as follows:
Notional Amount - Buy | Notional Amount - Sell | |||||||||||||||||||
(in millions) | 2016 | 2017 | Total | 2016 | 2017 | 2018 | Total | |||||||||||||
Foreign exchange forward contracts - | ||||||||||||||||||||
Notional currency in: | ||||||||||||||||||||
Euro | 89 | 37 | 126 | (11 | ) | — | — | (11 | ) | |||||||||||
Malaysian ringgit | 175 | — | 175 | (9 | ) | — | — | (9 | ) | |||||||||||
Norwegian krone | 604 | 31 | 635 | (132 | ) | (4 | ) | — | (136 | ) | ||||||||||
Pound Sterling | 113 | 2 | 115 | (5 | ) | — | — | (5 | ) | |||||||||||
U.S. dollar | 212 | 4 | 216 | (440 | ) | (101 | ) | (1 | ) | (542 | ) | |||||||||
As described further in Note 19 of the Notes to Consolidated Financial Statements, the net fair value of the Company’s outstanding derivatives was a $34 million liability to the Company at December 31, 2015 ($99 million liability at December 31, 2014).
Fair Value of Financial Instruments
The Company had approximately $1.8 billion of cash equivalents and $584 million of short-term investments at December 31, 2015. Cash equivalents represent highly liquid investments which are readily convertible to cash and have maturities of three months or less at the time of purchase. Short-term investments have original maturities of more than three months but less than one year. Certain of these investments are valued based upon quoted or estimated market prices which represent levels 1 and 2 market inputs.
The fair value of the Company’s foreign exchange forward contracts were based on quoted exchange rates for the respective currencies applicable to similar instruments (level 2 observable market inputs).
The Company’s international pension plans have assets available to fund future pension obligations totaling $384 million at December 31, 2015 ($455 million at December 31, 2014). The majority of these assets are invested in debt and equity securities or mutual funds, which were valued based on quoted market prices for an individual asset (level 1 market inputs), or mutual fund unit values, which were based on the fair values of the individual securities that the fund had invested in (level 2 observable market inputs). A certain portion of the assets were invested in insurance contracts, real estate and other investments, which were valued based on level 3 unobservable inputs (see Note 9 of the Notes to Consolidated Financial Statements for further information).
The values of these assets are subject to change, based generally on changes in market conditions involving foreign exchange rates, interest rates and debt and equity security investment pricing.
44
ITEM 8. FINANCIAL STATEMENTS AND SUPPLEMENTARY DATA
MANAGEMENT’S REPORT ON INTERNAL CONTROL OVER FINANCIAL REPORTING
The Company maintains a system of internal controls that is designed to provide reasonable but not absolute assurance as to the reliable preparation of the consolidated financial statements. The Company’s management, including its Chief Executive Officer and Chief Financial Officer, does not expect that the Company’s disclosure controls and procedures or the Company’s internal controls will prevent or detect all errors and all fraud. A control system, no matter how well conceived and operated, can provide only reasonable, but not absolute, assurance that the objectives of the control system are met. Further, the design of a control system must reflect the fact that there are resource constraints, and the benefits of controls must be considered relative to their costs. Because of the inherent limitations in all control systems, no evaluation of controls can provide absolute assurance that all control issues and instances of errors or fraud, if any, within Cameron have been detected.
The control environment of Cameron is the foundation for its system of internal controls over financial reporting and is embodied in the Company’s Standards of Conduct. It sets the tone of the Company’s organization and includes factors such as integrity and ethical values. The Company’s internal controls over financial reporting are supported by formal policies and procedures that are reviewed, modified and improved as changes occur in the Company’s business or as otherwise required by applicable rule-making bodies.
The Audit Committee of the Board of Directors, which is composed solely of outside directors, meets periodically with members of management, the internal audit department and the independent registered public accountants to review and discuss internal controls over financial reporting and accounting and financial reporting matters. The independent registered public accountants and the internal audit department report to the Audit Committee and accordingly have full and free access to the Audit Committee at any time.
Assessment of Internal Control Over Financial Reporting
Cameron’s management is responsible for establishing and maintaining adequate internal control (as defined in Rule 13a-15(f) under the Securities Exchange Act of 1934) over financial reporting.
Management conducted an evaluation of the effectiveness of its internal control over financial reporting based on the framework established in “Internal Control – Integrated Framework” issued by the Committee of Sponsoring Organizations of the Treadway Commission (2013 framework). This evaluation included a review of the documentation surrounding the Company’s financial controls, an evaluation of the design effectiveness of these controls, testing of the operating effectiveness of these controls and a conclusion on this evaluation. Although there are inherent limitations in the effectiveness of any system of internal controls over financial reporting – including the possibility of the circumvention or overriding of controls – based on management’s evaluation, management has concluded that the Company’s internal controls over financial reporting were effective as of December 31, 2015, based on the framework established in “Internal Control – Integrated Framework” (2013 framework). However, because of changes in conditions, it is important to note that internal control system effectiveness may vary over time.
Ernst & Young LLP, an independent registered public accounting firm that has audited the Company’s financial statements as of and for the three-year period ended December 31, 2015, has issued a report on their audit of management’s internal control over financial reporting, which is included herein.
/s/ R. Scott Rowe |
R. Scott Rowe President & Chief Executive Officer |
Date: January 29, 2016 |
/s/ Charles M. Sledge |
Charles M. Sledge Senior Vice President and Chief Financial Officer |
Date: January 29, 2016 |
45
REPORT OF INDEPENDENT REGISTERED PUBLIC ACCOUNTING FIRM
The Board of Directors and Stockholders of
Cameron International Corporation
We have audited Cameron International Corporation’s internal control over financial reporting as of December 31, 2015, based on criteria established in Internal Control-Integrated Framework issued by the Committee of Sponsoring Organizations of the Treadway Commission (2013 framework) (the COSO criteria). Cameron International Corporation’s management is responsible for maintaining effective internal control over financial reporting, and for its assessment of the effectiveness of internal control over financial reporting included in the accompanying Management’s Report on Internal Control over Financial Reporting. Our responsibility is to express an opinion on the company’s internal control over financial reporting based on our audit.
We conducted our audit in accordance with the standards of the Public Company Accounting Oversight Board (United States). Those standards require that we plan and perform the audit to obtain reasonable assurance about whether effective internal control over financial reporting was maintained in all material respects. Our audit included obtaining an understanding of internal control over financial reporting, assessing the risk that a material weakness exists, testing and evaluating the design and operating effectiveness of internal control based on the assessed risk, and performing such other procedures as we considered necessary in the circumstances. We believe that our audit provides a reasonable basis for our opinion.
A company’s internal control over financial reporting is a process designed to provide reasonable assurance regarding the reliability of financial reporting and the preparation of financial statements for external purposes in accordance with generally accepted accounting principles. A company’s internal control over financial reporting includes those policies and procedures that (1) pertain to the maintenance of records that, in reasonable detail, accurately and fairly reflect the transactions and dispositions of the assets of the company; (2) provide reasonable assurance that transactions are recorded as necessary to permit preparation of financial statements in accordance with generally accepted accounting principles, and that receipts and expenditures of the company are being made only in accordance with authorizations of management and directors of the company; and (3) provide reasonable assurance regarding prevention or timely detection of unauthorized acquisition, use or disposition of the company’s assets that could have a material effect on the financial statements.
Because of its inherent limitations, internal control over financial reporting may not prevent or detect misstatements. Also, projections of any evaluation of effectiveness to future periods are subject to the risk that controls may become inadequate because of changes in conditions, or that the degree of compliance with the policies or procedures may deteriorate.
In our opinion, Cameron International Corporation maintained, in all material respects, effective internal control over financial reporting as of December 31, 2015, based on the COSO criteria.
We also have audited, in accordance with the standards of the Public Company Accounting Oversight Board (United States), the consolidated balance sheets of Cameron International Corporation as of December 31, 2015 and 2014, and the related statements of consolidated results of operations, comprehensive income, cash flows and changes in stockholders’ equity for each of the three years in the period ended December 31, 2015 and our report dated January 29, 2016 expressed an unqualified opinion thereon.
/s/ Ernst & Young LLP | |
Houston, Texas
January 29, 2016
46
REPORT OF INDEPENDENT REGISTERED PUBLIC ACCOUNTING FIRM
The Board of Directors and Stockholders of
Cameron International Corporation
We have audited the accompanying consolidated balance sheets of Cameron International Corporation as of December 31, 2015 and 2014, and the related statements of consolidated results of operations, comprehensive income, cash flows and changes in stockholders’ equity for each of the three years in the period ended December 31, 2015. These financial statements are the responsibility of the Company’s management. Our responsibility is to express an opinion on these financial statements based on our audits.
We conducted our audits in accordance with the standards of the Public Company Accounting Oversight Board (United States). Those standards require that we plan and perform the audit to obtain reasonable assurance about whether the financial statements are free of material misstatement. An audit includes examining, on a test basis, evidence supporting the amounts and disclosures in the financial statements. An audit also includes assessing the accounting principles used and significant estimates made by management, as well as evaluating the overall financial statement presentation. We believe that our audits provide a reasonable basis for our opinion.
In our opinion, the consolidated financial statements referred to above present fairly, in all material respects, the consolidated financial position of Cameron International Corporation at December 31, 2015 and 2014, and the consolidated results of its operations and its cash flows for each of the three years in the period ended December 31, 2015, in conformity with U.S. generally accepted accounting principles.
We have also audited, in accordance with the standards of the Public Company Accounting Oversight Board (United States), the Cameron International Corporation’s internal control over financial reporting as of December 31, 2015, based on criteria established in Internal Control - Integrated Framework issued by the Committee of Sponsoring Organizations of the Treadway Commission (2013 framework) and our report dated January 29, 2016 expressed an unqualified opinion thereon.
/s/ Ernst & Young LLP | |
Houston, Texas
January 29, 2016
47
Consolidated Results of Operations
Year Ended December 31, | |||||||||||
(dollars in millions, except per share data) | 2015 | 2014 | 2013 | ||||||||
Revenues | $ | 8,782 | $ | 10,381 | $ | 9,138 | |||||
Costs and expenses: | |||||||||||
Cost of sales (exclusive of depreciation and amortization shown separately below) | 6,126 | 7,464 | 6,518 | ||||||||
Selling and administrative expenses | 1,082 | 1,287 | 1,275 | ||||||||
Depreciation and amortization | 342 | 348 | 298 | ||||||||
Interest, net | 138 | 129 | 100 | ||||||||
Asset charges (see Note 4) | 639 | 44 | — | ||||||||
Other costs (see Note 4) | 134 | 29 | 92 | ||||||||
Total costs and expenses | 8,461 | 9,301 | 8,283 | ||||||||
Income from continuing operations before income taxes | 321 | 1,080 | 855 | ||||||||
Income tax provision | (184 | ) | (258 | ) | (196 | ) | |||||
Income from continuing operations | 137 | 822 | 659 | ||||||||
Income from discontinued operations, net of income taxes | 431 | 26 | 65 | ||||||||
Net income | 568 | 848 | 724 | ||||||||
Less: Net income attributable to noncontrolling interests | 67 | 37 | 25 | ||||||||
Net income attributable to Cameron stockholders | $ | 501 | $ | 811 | $ | 699 | |||||
Amounts attributable to Cameron stockholders: | |||||||||||
Income from continuing operations | $ | 70 | $ | 785 | $ | 634 | |||||
Income from discontinued operations | 431 | 26 | 65 | ||||||||
Net income attributable to Cameron stockholders | $ | 501 | $ | 811 | $ | 699 | |||||
Earnings per share attributable to Cameron stockholders: | |||||||||||
Basic - | |||||||||||
Continuing operations | $ | 0.36 | $ | 3.85 | $ | 2.62 | |||||
Discontinued operations | 2.25 | 0.13 | 0.27 | ||||||||
Basic earnings per share | $ | 2.61 | $ | 3.98 | $ | 2.89 | |||||
Diluted - | |||||||||||
Continuing operations | $ | 0.36 | $ | 3.83 | $ | 2.60 | |||||
Discontinued operations | 2.24 | 0.13 | 0.27 | ||||||||
Diluted earnings per share | $ | 2.60 | $ | 3.96 | $ | 2.87 | |||||
The Notes to Consolidated Financial Statements are an integral part of these statements.
48
Consolidated Comprehensive Income
Year Ended December 31, | |||||||||||
(dollars in millions) | 2015 | 2014 | 2013 | ||||||||
Net income | $ | 568 | $ | 848 | $ | 724 | |||||
Foreign currency translation losses | (469 | ) | (526 | ) | (70 | ) | |||||
Gains (losses) on derivatives recognized in other comprehensive income: | |||||||||||
Pre-tax | (80 | ) | (109 | ) | 19 | ||||||
Tax effect | 15 | 33 | (5 | ) | |||||||
(Gains) losses on derivatives reclassified from accumulated other comprehensive income to: | |||||||||||
Revenues | 59 | 7 | (2 | ) | |||||||
Cost of sales | 40 | 6 | (5 | ) | |||||||
Tax effect | (29 | ) | (5 | ) | 2 | ||||||
Actuarial gains (losses) recognized in other comprehensive income: | |||||||||||
Pre-tax | 10 | (43 | ) | 25 | |||||||
Tax effect | (2 | ) | 8 | (12 | ) | ||||||
Curtailment and settlement (gains) losses recognized: | |||||||||||
Pre-tax | 2 | (11 | ) | — | |||||||
Tax effect | (1 | ) | 3 | — | |||||||
Amortization to selling and administrative expenses of: | |||||||||||
Prior service credits | (3 | ) | (2 | ) | (3 | ) | |||||
Net actuarial losses | 8 | 6 | 7 | ||||||||
Tax effect | (1 | ) | (1 | ) | — | ||||||
Comprehensive income | 117 | 214 | 680 | ||||||||
Comprehensive income attributable to noncontrolling interest: | |||||||||||
Net income | 67 | 37 | 25 | ||||||||
Foreign currency translation gains (losses) | (111 | ) | (147 | ) | 24 | ||||||
Gains (losses) on derivatives recognized in other comprehensive income, net of tax | (11 | ) | (24 | ) | 7 | ||||||
(Gains) losses on derivatives reclassified from accumulated other comprehensive income, net of tax | 11 | 4 | (1 | ) | |||||||
Actuarial gains recognized in other comprehensive income, net of tax | (4 | ) | (4 | ) | (26 | ) | |||||
Curtailment and settlement losses recognized in other comprehensive income, net of tax | — | (5 | ) | — | |||||||
Amortization to selling and administrative expenses, net of tax | 1 | 2 | 2 | ||||||||
Comprehensive income (loss) attributable to noncontrolling interest | (47 | ) | (137 | ) | 31 | ||||||
Comprehensive income attributable to Cameron | $ | 164 | $ | 351 | $ | 649 | |||||
The Notes to Consolidated Financial Statements are an integral part of these statements.
49
Consolidated Balance Sheets
December 31, | |||||||
(dollars in millions, except shares and per share data) | 2015 | 2014 | |||||
Assets: | |||||||
Cash and cash equivalents | $ | 1,775 | $ | 1,513 | |||
Short-term investments | 584 | 113 | |||||
Receivables, net | 1,964 | 2,389 | |||||
Inventories, net | 2,360 | 2,929 | |||||
Other current assets | 333 | 391 | |||||
Assets held for sale | 102 | 217 | |||||
Total current assets | 7,118 | 7,552 | |||||
Plant and equipment, net | 1,717 | 1,964 | |||||
Goodwill | 1,764 | 2,461 | |||||
Intangibles, net | 582 | 728 | |||||
Other assets | 319 | 187 | |||||
Total assets | $ | 11,500 | $ | 12,892 | |||
Liabilities and stockholders’ equity: | |||||||
Short-term debt | $ | 284 | $ | 263 | |||
Accounts payable and accrued liabilities | 2,793 | 3,748 | |||||
Accrued income taxes | 127 | 168 | |||||
Liabilities held for sale | 2 | 90 | |||||
Total current liabilities | 3,206 | 4,269 | |||||
Long-term debt | 2,542 | 2,819 | |||||
Deferred income taxes | 212 | 193 | |||||
Other long-term liabilities | 150 | 167 | |||||
Total liabilities | 6,110 | 7,448 | |||||
Commitments and contingencies | |||||||
Stockholders’ equity: | |||||||
Common stock, par value $.01 per share, 400,000,000 shares authorized, 263,111,472 shares issued at December 31, 2015 and 2014 | 3 | 3 | |||||
Preferred stock, par value $.01 per share, 10,000,000 shares authorized, no shares issued or outstanding | — | — | |||||
Capital in excess of par value | 3,265 | 3,255 | |||||
Retained earnings | 6,132 | 5,631 | |||||
Accumulated other elements of comprehensive income (loss) | (877 | ) | (540 | ) | |||
Less: Treasury stock at cost, 71,931,558 shares at December 31, 2015 and 68,139,027 shares at December 31, 2014 | (3,969 | ) | (3,794 | ) | |||
Total Cameron stockholders’ equity | 4,554 | 4,555 | |||||
Noncontrolling interests | 836 | 889 | |||||
Total equity | 5,390 | 5,444 | |||||
Total liabilities and stockholders’ equity | $ | 11,500 | $ | 12,892 | |||
The Notes to Consolidated Financial Statements are an integral part of these statements.
50
Consolidated Cash Flows
Year Ended December 31, | |||||||||||
(dollars in millions) | 2015 | 2014 | 2013 | ||||||||
Cash flows from operating activities: | |||||||||||
Net income | $ | 568 | $ | 848 | $ | 724 | |||||
Adjustments to reconcile net income to net cash provided by operating activities: | |||||||||||
Asset charges | 639 | 44 | — | ||||||||
Loss on disposal of non-core assets | 15 | 10 | — | ||||||||
Pre-tax gain on sale of compression businesses | (681 | ) | (95 | ) | — | ||||||
Depreciation | 293 | 296 | 246 | ||||||||
Amortization | 49 | 64 | 69 | ||||||||
Non-cash stock compensation expense | 49 | 54 | 54 | ||||||||
Gain from remeasurement of prior interest in equity method investment | — | (8 | ) | — | |||||||
Deferred income taxes and tax benefit of stock compensation plan transactions | (50 | ) | (48 | ) | 11 | ||||||
Changes in assets and liabilities, net of translation, acquisitions and non-cash items: | |||||||||||
Receivables | 390 | 166 | (470 | ) | |||||||
Inventories | 362 | (144 | ) | (367 | ) | ||||||
Accounts payable and accrued liabilities | (913 | ) | (17 | ) | 556 | ||||||
Other assets and liabilities, net | (13 | ) | 23 | 15 | |||||||
Net cash provided by operating activities | 708 | 1,193 | 838 | ||||||||
Cash flows from investing activities: | |||||||||||
Proceeds from sales and maturities of short-term investments | 923 | 65 | 1,559 | ||||||||
Purchases of short-term investments | (1,394 | ) | (137 | ) | (1,082 | ) | |||||
Capital expenditures | (285 | ) | (385 | ) | (520 | ) | |||||
Net proceeds received from sale of compression businesses, net | 831 | 547 | — | ||||||||
Other dispositions (acquisitions), net of cash acquired | — | (7 | ) | (11 | ) | ||||||
Proceeds received and cash acquired from formation of OneSubsea™, net of taxes paid of $80 | — | — | 523 | ||||||||
Proceeds from sales of plant and equipment | 14 | 13 | 13 | ||||||||
Net cash provided by investing activities | 89 | 96 | 482 | ||||||||
Cash flows from financing activities: | |||||||||||
Issuance of senior debt | — | 500 | 747 | ||||||||
Debt issuance costs | — | (4 | ) | (6 | ) | ||||||
Early retirement of senior notes | — | (253 | ) | — | |||||||
Short-term loan borrowings (repayments), net | (222 | ) | (34 | ) | 46 | ||||||
Purchase of treasury stock | (240 | ) | (1,747 | ) | (1,531 | ) | |||||
Contributions from (distributions to) noncontrolling interest owners | (3 | ) | (42 | ) | 62 | ||||||
Purchases of noncontrolling ownership interests | — | — | (7 | ) | |||||||
Proceeds from stock option exercises, net of tax payments from stock compensation plan transactions | 20 | 40 | 31 | ||||||||
Excess tax benefits from stock compensation plan transactions | 2 | 6 | 9 | ||||||||
Principal payments on capital leases | (18 | ) | (20 | ) | (18 | ) | |||||
Net cash used for financing activities | (461 | ) | (1,554 | ) | (667 | ) | |||||
Effect of translation on cash | (74 | ) | (35 | ) | (26 | ) | |||||
Increase (decrease) in cash and cash equivalents | 262 | (300 | ) | 627 | |||||||
Cash and cash equivalents, beginning of year | 1,513 | 1,813 | 1,186 | ||||||||
Cash and cash equivalents, end of year | $ | 1,775 | $ | 1,513 | $ | 1,813 | |||||
The Notes to Consolidated Financial Statements are an integral part of these statements.
51
Consolidated Changes in Stockholders’ Equity
Cameron Stockholders | |||||||||||||||||||||||||||
(dollars in millions) | Common Stock | Capital in Excess of Par value | Retained Earnings | Accumulated Other Elements of Comprehensive Income (Loss) | Treasury Stock | Non-controlling Interests | Total | ||||||||||||||||||||
Balance ― December 31, 2012 | $ | 3 | $ | 2,094 | $ | 4,121 | $ | (30 | ) | $ | (622 | ) | $ | — | $ | 5,566 | |||||||||||
Formation of OneSubsea, net of tax effects of $90 | — | 1,083 | — | — | — | 927 | 2,010 | ||||||||||||||||||||
Net income | — | — | 699 | — | — | 25 | 724 | ||||||||||||||||||||
Other comprehensive income (loss) | — | — | — | (50 | ) | — | 6 | (44 | ) | ||||||||||||||||||
Non-cash stock compensation expense | — | 54 | — | — | — | — | 54 | ||||||||||||||||||||
Net change in treasury shares owned by participants in nonqualified deferred compensation plans | — | — | — | — | (2 | ) | — | (2 | ) | ||||||||||||||||||
Purchase of treasury stock | — | — | — | — | (1,533 | ) | — | (1,533 | ) | ||||||||||||||||||
Treasury stock issued under stock compensation plans | — | (28 | ) | — | — | 59 | — | 31 | |||||||||||||||||||
Tax benefit of stock compensation plan transactions | — | 10 | — | — | — | — | 10 | ||||||||||||||||||||
Contributions from noncontrolling interest owners | — | — | — | — | — | 75 | 75 | ||||||||||||||||||||
Purchases of noncontrolling ownership interests | — | — | — | — | — | (7 | ) | (7 | ) | ||||||||||||||||||
Other noncontrolling interests | — | — | — | — | — | 38 | 38 | ||||||||||||||||||||
Other | — | (6 | ) | — | — | — | — | (6 | ) | ||||||||||||||||||
Balance ― December 31, 2013 | 3 | 3,207 | 4,820 | (80 | ) | (2,098 | ) | 1,064 | 6,916 | ||||||||||||||||||
Net income | — | — | 811 | — | — | 37 | 848 | ||||||||||||||||||||
Other comprehensive income (loss) | — | — | — | (460 | ) | — | (174 | ) | (634 | ) | |||||||||||||||||
Non-cash stock compensation expense | — | 54 | — | — | — | — | 54 | ||||||||||||||||||||
Purchase of treasury stock | — | — | — | — | (1,750 | ) | — | (1,750 | ) | ||||||||||||||||||
Treasury stock issued under stock compensation plans | — | (12 | ) | — | — | 54 | — | 42 | |||||||||||||||||||
Tax benefit of stock compensation plan transactions | — | 6 | — | — | — | — | 6 | ||||||||||||||||||||
Purchase of noncontrolling ownership interests | — | — | — | — | — | 4 | 4 | ||||||||||||||||||||
Distributions to noncontrolling interest owners | — | — | — | — | — | (42 | ) | (42 | ) | ||||||||||||||||||
Balance ― December 31, 2014 | 3 | 3,255 | 5,631 | (540 | ) | (3,794 | ) | 889 | 5,444 | ||||||||||||||||||
Net income | — | — | 501 | — | — | 67 | 568 | ||||||||||||||||||||
Other comprehensive income (loss) | — | — | — | (337 | ) | — | (114 | ) | (451 | ) | |||||||||||||||||
Non-cash stock compensation expense | — | 49 | — | — | — | — | 49 | ||||||||||||||||||||
Purchase of treasury stock | — | — | — | — | (236 | ) | — | (236 | ) | ||||||||||||||||||
Treasury stock issued under stock compensation plans | — | (41 | ) | — | — | 61 | — | 20 | |||||||||||||||||||
Tax benefit of stock compensation plan transactions | — | 2 | — | — | — | — | 2 | ||||||||||||||||||||
Contributions from noncontrolling interest owners | — | — | — | — | — | 18 | 18 | ||||||||||||||||||||
Distributions to noncontrolling interest owners | — | — | — | — | — | (21 | ) | (21 | ) | ||||||||||||||||||
Other | — | — | — | — | — | (3 | ) | (3 | ) | ||||||||||||||||||
Balance ― December 31, 2015 | $ | 3 | $ | 3,265 | $ | 6,132 | $ | (877 | ) | $ | (3,969 | ) | $ | 836 | $ | 5,390 | |||||||||||
The Notes to Consolidated Financial Statements are an integral part of these statements.
52
NOTES TO CONSOLIDATED FINANCIAL STATEMENTS
Note 1: Summary of Major Accounting Policies
Company Operations — Cameron International Corporation (Cameron or the Company) provides flow equipment products, systems and services to worldwide oil, gas and process industries through four business segments, Subsea, Surface, Drilling and Valves & Measurement (V&M). Prior to the fourth quarter of 2014, the Company reported its business segments as being Drilling & Production Systems (DPS), which included the Subsea, Drilling and Surface businesses, V&M and Process and Compression Systems, which included the Reciprocating and Centrifugal Compression businesses, both of which are now reported as discontinued operations (See Note 3 of the Notes to Consolidated Financial Statements) and the Processing Systems business. Additional information regarding each segment may be found in Note 16 of the Notes to Consolidated Financial Statements.
Principles of Consolidation — These consolidated financial statements include the accounts of the Company and all majority-owned subsidiaries. Investments in affiliated companies are accounted for using the equity method when we are able to exert significant influence over the operations of the investee.
Estimates in Financial Statements — Preparation of the financial statements in conformity with U.S. generally accepted accounting principles requires management to make estimates and assumptions that affect the reported amounts of assets and liabilities and disclosure of contingent assets and liabilities at the date of the financial statements and the reported amounts of revenues and expenses during the reporting period. Such estimates include, but are not limited to, estimates of total contract profit or loss on certain long-term production contracts, estimated losses on accounts receivable, estimated realizable value on excess and obsolete inventory, contingencies (including tax contingencies, estimated liabilities for litigation exposures and liquidated damages), estimated warranty costs, estimates related to pension accounting, estimates used to determine fair values in purchase accounting, estimates related to the fair value of reporting units for purposes of assessing goodwill for impairment and estimates related to deferred tax assets and liabilities, including valuation allowances on deferred tax assets. Actual results could differ materially from these estimates.
Revenue Recognition — The Company generally recognizes revenue, net of sales taxes, related to products, services or rental arrangements once the following four criteria are met: (i) persuasive evidence of an arrangement exists, (ii) delivery of the equipment has occurred or the customer has taken title and risk of loss or services have been rendered, (iii) the price of the equipment or service is fixed and determinable and (iv) collectibility is reasonably assured. For engineering, procurement and construction-type contracts, revenue is generally reported on the percentage-of-completion method of accounting. Progress is primarily measured by the completion of milestones; however, progress for specific types of subsea and drilling systems contracts, which differ from our other contracts, is measured by the ratio of actual costs incurred to date on the project in relation to total estimated project costs. Both methods require the Company to make estimates regarding the total costs of the project, which impacts the amount of gross margin the Company recognizes in each reporting period. Under the percentage-of-completion method, the use of estimated costs to complete each contract is a significant variable in the process of determining recognized revenue and is a significant factor in accounting for contracts. All known or anticipated losses on contracts are provided for in the period they become evident. Revenues and gross profit on contracts can be significantly affected by change orders that may be approved subsequent to completion of related work. If it is not probable that costs will be recovered through a change in contract price, the costs attributable to change orders are treated as contract costs without incremental revenue. If it is probable that costs will be recovered through a change order, the costs are treated as contract costs and contract revenue is recognized to the extent of the lesser of the amounts management expects to recover or the costs expected to be incurred.
Approximately 32%, 31% and 31% of the Company’s revenues for the years ended December 31, 2015, 2014 and 2013, respectively, were recognized under the percentage-of-completion method.
Shipping and Handling Costs — Shipping and handling costs are reflected in the caption entitled “Cost of sales (exclusive of depreciation and amortization shown separately below)” in the accompanying Consolidated Results of Operations statements.
Cash Equivalents and Short-Term Investments — Cash equivalents consist of highly liquid investments which are readily convertible to cash and have maturities of three months or less at the time of purchase. Short-term investments consist primarily of commercial paper, U.S. Treasury securities, U.S. non-governmental agency asset-backed securities and corporate debt obligations that have maturities of more than three months but less than one year. All of our short-term investments are classified as available-for-sale and recorded at fair value, with unrealized holding gains and losses recorded as a component of accumulated other comprehensive income (loss).
Allowance for Doubtful Accounts — The Company maintains allowances for doubtful accounts for estimated losses expected to result from the inability of its customers to make required payments. Such allowances are based upon several factors including,
but not limited to, historical experience, the length of time an invoice has been outstanding, responses from customers relating to demands for payment and the current and projected financial condition of specific customers.
Inventories — Aggregate inventories are carried at the lower of cost or market. On the basis of current costs less accumulated depreciation and impairment charges, 54% of inventories at December 31, 2015 and 54% at December 31, 2014 are carried on the last-in, first-out (LIFO) method. For these locations, the use of LIFO results in a better matching of costs and revenues. The remaining inventories, which are generally located outside the United States and Canada, are carried on the first-in, first-out (FIFO) method. The Company provides a reserve for estimated inventory obsolescence or excess quantities on hand equal to the difference between the cost of the inventory and its estimated realizable value.
Plant and Equipment — Property, plant and equipment, both owned and under capital lease, are carried at cost. Maintenance and repair costs are expensed as incurred. The cost of renewals, replacements and betterments is capitalized. The Company capitalizes software developed or obtained for internal use. Accordingly, the cost of third-party software, as well as the cost of third-party and internal personnel that are directly involved in application development activities, are capitalized during the application development phase of new software systems projects. Costs during the preliminary project stage and post-implementation stage of new software systems projects, including data conversion and training costs, are expensed as incurred. Depreciation and amortization is provided over the estimated useful lives of the related assets, or in the case of assets under capital leases, over the related lease term, if less, using the straight-line method. The estimated useful lives of the major classes of property, plant and equipment are as follows:
Estimated Useful Lives | |
Buildings and leasehold improvements | 10-40 years |
Machinery, equipment and tooling | 3-18 years |
Office furniture, software and other | 3-10 years |
Goodwill and Intangible Assets —
Cameron allocates the purchase price of acquired businesses to their identifiable tangible assets and liabilities, such as accounts receivable, inventory, property, plant and equipment, accounts payable and accrued liabilities, based on their estimated fair values. The Company also typically allocates a portion of the purchase price to identifiable intangible assets, such as noncompete agreements, trademarks, trade names, patents, technology, customer relationships and backlog using various widely accepted valuation techniques such as discounted future cash flows and the relief-from-royalty and excess earnings methods. Each of these methods involves level 3 unobservable market inputs. Any remaining excess of cost over allocated fair values is recorded as goodwill. On larger acquisitions, Cameron will typically engage third-party valuation experts to assist in determining the fair values for both the identifiable tangible and intangible assets. Certain estimates and judgments are required in the application of the fair value techniques, including estimates of future cash flows, selling prices, replacement costs, royalty rates for use of assets, economic lives and the selection of a discount rate.
The Company reviews the carrying value of goodwill in accordance with accounting rules on impairment of goodwill, which require that the Company estimate the fair value of each of its reporting units annually, or when impairment indicators exist, and compare such amounts to their respective carrying values to determine if an impairment of goodwill is required. The estimated fair value of each reporting unit is primarily determined using discounted future expected cash flows (level 3 unobservable inputs) consistent with the accounting guidance for fair-value measurements. Certain estimates and judgments are required in the application of the fair value models, including, but not limited to, estimates of future cash flows and the selection of a discount rate. At December 31, 2015, the Company’s reporting units for goodwill impairment evaluation purposes were the OneSubsea, Process Systems, Surface, Drilling, Valves and Measurement businesses. Prior to the fourth quarter of 2014, there were five reporting units within the V&M segment (now combined into two reporting units based on changes in management’s reporting structure during the fourth quarter of 2014).
In connection with our annual goodwill impairment test as of March 31, 2015, we tested the goodwill for each of our six reporting units. With the exception of the Process Systems reporting unit, no goodwill impairments were indicated. With respect to the Process Systems reporting unit, our determination of fair value as of March 31, 2015 considered events that occurred in the first quarter, as well as our updated long-term outlook for this reporting unit. Those events included ongoing changes in the energy industry during the first quarter of 2015, a reduction in North American rig count, numerous industry-wide deepwater project deferrals and idling of deepwater drilling rigs, as well as significant capital spending cuts announced by a number of oil and gas exploration companies since December 31, 2014. Consistent with these industry-wide market changes, the Company also experienced the loss or indefinite deferral of several major project awards that we previously anticipated receiving. Accordingly, when determining the fair value of the Process Systems reporting unit as of March 31, 2015, our projections considered these
53
factors as well as the negative impact of the low commodity price environment on the long-term outlook for revenue growth and profitability in this business. Based on these considerations, we concluded the fair value (estimated using Level 3 unobservable inputs) of the Process Systems reporting unit was less than its carrying value as of March 31, 2015. We conducted a Step 2 analysis, which included a hypothetical purchase price allocation, and recorded a goodwill impairment charge of $517 million. As of December 31, 2015, following the impairment, the Process Systems reporting unit had $52 million of goodwill remaining.
With the continued decline in commodity prices and activity levels since our annual goodwill impairment test, we performed a qualitative assessment of current market conditions and our future long-term expectations of oil and gas markets as of December 31, 2015 to conclude as to whether it was more likely than not that the fair values of our reporting units continued to be higher than each respective reporting unit's carrying value at December 31, 2015. Our assessment took into consideration, among other things, the valuation of Cameron that was implied in the August 2015 announcement of the merger with Schlumberger, as well as changes in commodity prices and activity levels and financial performance during 2015 by each of our reporting units, against expectations that were considered as part of the annual goodwill impairment test as of March 31, 2015. As a result of our analysis, no further impairment of goodwill was required as of December 31, 2015.
The Company’s intangible assets, excluding goodwill, represent purchased patents, trademarks, customer relationships and other identifiable intangible assets. The majority of intangible assets are amortized on a straight-line basis over the years expected to be benefited, generally ranging from 5 to 28 years. Such intangibles are tested for recoverability whenever events or changes in circumstances indicate that their carrying value may not be recoverable. As many areas of the Company’s business rely on patents and proprietary technology, it has followed a policy of seeking patent protection both inside and outside the United States for products and methods that appear to have commercial significance. The costs of developing any intangibles internally, as well as costs of defending such intangibles, are expensed as incurred.
Long-Lived Assets — In accordance with accounting rules for the impairment or disposal of long-lived assets, such assets, excluding goodwill and indefinite-lived intangibles, to be held and used by the Company are reviewed, at least quarterly, to determine whether any events or changes in circumstances indicate that the carrying amount of the asset may not be recoverable or that its remaining useful life may be shorter than previously expected. For long-lived assets to be held and used, the Company bases its evaluation on impairment indicators such as the nature of the assets, the future economic benefit of the assets, any historical or future profitability measurements and other external market conditions or factors that may be present. If such impairment indicators are present or other factors exist that indicate the carrying amount of the asset may not be recoverable, the Company determines whether an impairment has occurred through the use of an undiscounted cash flow analysis of the asset at the lowest level for which identifiable cash flows exist. If an impairment has occurred, the Company recognizes a loss for the difference between the carrying amount and the fair value of the asset, which in most cases is estimated based upon Level 3 unobservable inputs. If the asset is determined to have a remaining useful life shorter than previously expected, an adjustment for the shorter remaining life will be made for purposes of recognizing future depreciation expense. Assets are classified as held for sale when the Company has a plan, approved by the appropriate levels of management, for disposal of such assets and those assets are stated at the lower of carrying value or estimated fair value less estimated costs to sell. During the years ended December 31, 2015 and 2014, the Company identified various instances of assets whose carrying values were impaired or had shorter remaining useful lives than previously anticipated due to current and expected future market conditions. The impairment charges and accelerated depreciation amounts associated with these items are discussed further in Note 4 of the Notes to Consolidated Financial Statements.
Product Warranty — Estimated warranty costs are accrued either at the time of sale based upon historical experience or, in some cases, when specific warranty problems are encountered. Adjustments to the recorded liability are made periodically to reflect actual experience.
Contingencies — The Company accrues for costs relating to litigation when such liabilities become probable and reasonably estimable. Such estimates may be based on advice from third parties, amounts specified by contract, amounts designated by legal statute or management’s judgment, as appropriate. Revisions to contingent liabilities are reflected in income in the period in which different facts or information become known or circumstances change that affect the Company’s previous assumptions with respect to the likelihood or amount of loss. Amounts paid upon the ultimate resolution of contingent liabilities may be materially different from previous estimates and could require adjustments to the estimated reserves to be recognized in the period such new information becomes known.
Income Taxes — The asset and liability approach is used to account for income taxes by recognizing deferred tax assets and liabilities for the expected future tax consequences of temporary differences between the carrying amounts and the tax basis of assets and liabilities. Income tax expense includes U.S. and foreign income taxes, including U.S. federal taxes on undistributed earnings of foreign subsidiaries to the extent such earnings are planned to be remitted. Taxes are not provided on the translation
54
component of comprehensive income since the effect of translation is not considered to modify the amount of the earnings that are planned to be remitted.
A valuation allowance is provided to offset any net deferred tax asset, if, based upon available evidence, it is more likely than not that some or all of the deferred tax assets will not be realized. Interest related to accruals for uncertain tax positions is reflected as a component of interest expense in the Consolidated Results of Operations statement. Penalties on a tax position taken by the Company are reflected as a component of income tax expense in the Consolidated Results of Operations statement. See Note 13 of the Notes to Consolidated Financial Statements for further discussion of the Company’s income taxes.
Environmental Remediation and Compliance — Environmental remediation and postremediation monitoring costs are accrued when such obligations become probable and reasonably estimable. Such future expenditures are not discounted to their present value.
Pension and Postretirement Benefits Accounting — The Company recognizes the funded status of its defined benefit pension and other postretirement benefit plans in its Consolidated Balance Sheets. The measurement date for all of the Company’s plans was December 31, 2015. See Note 9 of the Notes to Consolidated Financial Statements for further information.
Stock-Based Compensation — At December 31, 2015, the Company had grants outstanding under various stock-based employee compensation plans, which are described in further detail in Note 10 of the Notes to Consolidated Financial Statements. Compensation expense for the Company’s stock-based compensation plans is measured using the fair value method required by accounting rules on stock compensation. Under this guidance, the fair value of stock option grants and restricted stock unit awards is amortized to expense using the straight-line method over the shorter of the vesting period or the remaining employee service period.
Derivative Financial Instruments — The Company recognizes all derivative financial instruments as assets and liabilities on a gross basis and measures them at fair value. Hedge accounting is only applied when the derivative is deemed highly effective at offsetting changes in anticipated cash flows of the hedged item or transaction. Changes in fair value of derivatives that are designated as cash flow hedges are deferred in accumulated other elements of comprehensive income (loss) until the underlying transactions are recognized in earnings, at which time any deferred hedging gains or losses are reclassified to earnings in the same income statement caption as impacted by the hedged item. Any ineffective portion of the change in the fair value of a derivative used as a cash flow hedge is recorded in earnings as incurred. The amounts recorded in earnings from ineffectiveness for the years ended December 31, 2015, 2014 and 2013 have not been material. The Company may at times also use forward or option contracts to hedge certain other foreign currency exposures. These contracts are not designated as hedges under the accounting guidance described above. Therefore, the changes in fair value of these contracts are recognized in earnings as they occur and offset gains or losses on the related exposures.
Foreign Currency — For most subsidiaries and branches outside the U.S., the local currency is the functional currency. The financial statements of these subsidiaries and branches are translated into U.S. dollars as follows: (i) assets and liabilities at year-end exchange rates; (ii) income and expenses at monthly average exchange rates or exchange rates in effect on the date of the transaction; and (iii) stockholders’ equity at historical exchange rates. For those subsidiaries where the local currency is the functional currency, the resulting translation adjustment is recorded as a component of accumulated other elements of comprehensive income (loss) in the accompanying Consolidated Balance Sheets.
For certain other subsidiaries and branches, operations are conducted primarily in currencies other than the local currencies, which are therefore the functional currency. Non-functional currency monetary assets and liabilities are remeasured at ending exchange rates. Revenue, expense and gain and loss accounts of these foreign subsidiaries and branches are remeasured at average exchange rates or exchange rates in effect on the date of the transaction. Non-functional currency non-monetary assets and liabilities, and the related revenue, expense, gain and loss accounts are remeasured at historical rates.
Foreign currency gains and losses arising from monetary transactions denominated in a currency other than the functional currency of the entity involved are included in income. The effects of foreign currency transactions were a pre-tax loss of approximately $16 million for the year ended December 31, 2015, a gain of approximately $22 million for the year ended December 31, 2014 and a loss of approximately $1 million for the year ended December 31, 2013. Consequently, the remeasurement of deferred income tax assets were $10 million, $3 million, and nil, for the year ended December 31, 2015, 2014, and 2013, respectively.
Reclassifications — Certain prior year amounts have been reclassified to conform to the current year presentation.
55
Note 2: Merger of Cameron with Schlumberger
On August 26, 2015, Cameron and Schlumberger Limited "Schlumberger" announced that the companies had entered into an Agreement and Plan of Merger (the “Merger Agreement”) whereby a U.S. subsidiary of Schlumberger would acquire all of the issued and outstanding stock of Cameron. Under the terms of the agreement, Cameron shareholders will receive 0.716 shares of Schlumberger common stock and a cash payment of $14.44 in exchange for each Cameron common share. The Merger Agreement was unanimously approved by the board of directors of both companies and has been approved by Cameron's stockholders. The Merger will be consummated upon receipt of required regulatory consents and approvals, currently expected to occur during the first quarter of 2016. Schlumberger stockholders are not required to vote on the Merger Agreement. Should Cameron terminate the Merger Agreement in specified circumstances, the Company would be required to pay Schlumberger a termination fee equal to $321 million.
Note 3: Business Dispositions and Combinations
Business Dispositions
The Company completed the sale of its Reciprocating Compression business to General Electric, effective June 1, 2014, and the sale of its Centrifugal Compression business to Ingersoll Rand on January 1, 2015. The gross cash consideration from the sale of both businesses was $1.4 billion, subject to pending closing adjustments.
The Company’s historical consolidated Results of Operations statement has been retrospectively revised to reflect the results of operations for both businesses as discontinued operations for all periods presented. Summarized financial information relating to these businesses is shown below:
Year Ended December 31, | |||||||||||
(dollars in millions) | 2015 | 2014 | 2013 | ||||||||
Revenues | $ | — | $ | 428 | $ | 701 | |||||
Cost of sales (excluding depreciation and amortization) | — | (306 | ) | (498 | ) | ||||||
All other costs | (2 | ) | (94 | ) | (105 | ) | |||||
Gain on sale of the compression businesses, before tax | 681 | 95 | — | ||||||||
Income before income taxes | 679 | 123 | 98 | ||||||||
Income tax provision | (248 | ) | (97 | ) | (33 | ) | |||||
Income from discontinued operations, net of income taxes | $ | 431 | $ | 26 | $ | 65 | |||||
Gains on the sale of the Compression businesses were determined as follows (dollars in millions):
(dollars in millions) | Sale of Centrifugal Compression | Sale of Reciprocating Compression | ||||
Sales price | $ | 850 | $ | 550 | ||
Net assets sold | (160 | ) | (442 | ) | ||
Transaction and other costs associated with the sale | (9 | ) | (13 | ) | ||
Pre-tax gain | 681 | 95 | ||||
Tax provision(1) | (248 | ) | (85 | ) | ||
Gain on sale | $ | 433 | $ | 10 | ||
(1)The tax provision associated with the pre-tax gain on the Reciprocating Compression business was impacted by nondeductible goodwill of approximately $192 million included in the total net assets sold.
As described further in Note 4 of the Notes to Consolidated Financial Statements, on August 27, 2015, Cameron entered into an agreement to sell the LeTourneau Offshore Products business within the Drilling Systems division to Keppel Offshore & Marine USA, Inc. for $100 million. This business is currently reflected as held for sale at December 31, 2015.
56
Assets and liabilities of all businesses held for sale in the Company’s Consolidated Balance Sheets at December 31, 2015 and 2014 were as follows:
(dollars in millions) | December 31, 2015 | December 31, 2014 | ||||
Receivables, net | $ | 4 | $ | 37 | ||
Inventories, net | 62 | 86 | ||||
Other current assets | — | 14 | ||||
Plant and equipment, net | 7 | 45 | ||||
Intangibles, net | 15 | — | ||||
Goodwill | 14 | 35 | ||||
Assets held for sale | 102 | 217 | ||||
Accounts payable, accrued and other current liabilities | $ | 2 | $ | 89 | ||
Other long-term liabilities | — | 1 | ||||
Liabilities held for sale | $ | 2 | $ | 90 | ||
Business Combinations
Douglas Chero — During the third quarter of 2013, the Company’s V&M segment acquired Douglas Chero, an Italian valve manufacturer, for approximately $20 million, net of cash acquired. The acquisition was made to support the Company’s international growth strategy by expanding its downstream industrial valve offerings. Douglas Chero’s results of operations have been included in the V&M segment since the date of acquisition.
OneSubsea — On June 30, 2013, Cameron and Schlumberger Limited completed the formation of OneSubsea, a venture established to manufacture and develop products, systems and services for the subsea oil and gas market. Cameron contributed its existing subsea business unit and received $600 million from Schlumberger, while Schlumberger contributed its Framo, Surveillance, Flow Assurance and Power and Controls businesses, which included an additional $3 million of cash. As 60% owner, Cameron manages the venture and reflects a noncontrolling interest in its financial statements for Schlumberger’s 40% interest in the venture.
Under the purchase method of accounting, the assets and liabilities of the Schlumberger businesses contributed to OneSubsea were reflected at their estimated fair values at June 30, 2013. The excess of the fair value of the businesses contributed by Schlumberger over the net tangible and identifiable intangible assets of those businesses was recorded as goodwill. The OneSubsea goodwill, totaling approximately $1 billion, is not deductible for tax purposes.
Due to Cameron maintaining control of OneSubsea, the contribution of Cameron’s existing subsea business unit into the venture was recorded at historical cost and the issuance of a 40% interest in the venture to Schlumberger was reflected as an adjustment to Cameron’s paid in capital in accordance with accounting rules governing decreases in a parent’s ownership interest in a subsidiary without loss of control. Accordingly, the direct income tax consequences were also reflected as an adjustment to paid in capital. During the fourth quarter of 2013, the Company paid approximately $80 million in taxes associated with this transaction.
57
Note 4: Asset Charges and Other Costs
Asset charges and other costs, net of gains, consisted of the following:
Year Ended December 31, | |||||||||||
(dollars in millions) | 2015 | 2014 | 2013 | ||||||||
Asset charges - | |||||||||||
Goodwill impairment | $ | 517 | $ | 40 | $ | — | |||||
Other long-lived asset impairments | 78 | 4 | — | ||||||||
Accelerated depreciation on underutilized assets | 44 | — | — | ||||||||
Total asset charges | 639 | 44 | — | ||||||||
Other costs (gains) - | |||||||||||
Facility closures and severance | 88 | 15 | 13 | ||||||||
Loss on disposal of non-core assets | 15 | 10 | — | ||||||||
Mark-to-market impact on currency derivatives not designated as accounting hedges | 11 | 8 | 1 | ||||||||
Merger costs | 8 | — | — | ||||||||
Gain from remeasurement of prior interest in equity method investment | — | (8 | ) | — | |||||||
All other costs, net | 12 | 4 | 78 | ||||||||
Total other costs (gains), net | 134 | 29 | 92 | ||||||||
Total asset charges and other costs (gains), net | $ | 773 | $ | 73 | $ | 92 | |||||
Asset charges
The Company tests the carrying value of goodwill in accordance with accounting rules on impairment of goodwill, which require that the Company estimate the fair value of each of its reporting units annually, or when impairment indicators exist, and compare such amounts to their respective carrying values to determine if an impairment of goodwill is required.
In connection with our annual goodwill impairment test as of March 31, 2015, we tested the goodwill for each of our six reporting units. With the exception of the Process Systems reporting unit, no goodwill impairments were indicated. We recorded a goodwill impairment charge of $517 million at March 31, 2015 for the Process Systems reporting unit, leaving a remaining balance of goodwill in this reporting unit at December 31, 2015 of $52 million.
During the first quarter of 2014, goodwill totaling $40 million relating to the Company’s Process Systems and Equipment (PSE) reporting unit was considered to be fully impaired during the annual goodwill impairment test.
The Company also recognized impairment charges of $78 million during 2015 relating to certain facilities resulting from weak market conditions including an $18 million write-down of assets that will be retained following the sell of LeTourneau Offshore Products business (see further discussion below). Charges of $4 million were recognized during 2014 for impairment of certain intangible assets.
Loss on disposal of non-core assets
On August 27, 2015, Cameron entered into an agreement to sell the LeTourneau Offshore Products business within the Drilling Systems division to Keppel Offshore & Marine USA, Inc. for $100 million. In connection with this transaction, the Company recorded an estimated pre-tax loss of $15 million during 2015 to write-down the remaining carrying value of the business to its fair value including certain other accrued liabilities associated with the sale. This was in addition to the write-down of retained assets discussed above. The sale is currently expected to close during the second quarter of 2016.
All other costs (gains)
As a result of current market conditions and the impact on the Company’s operations, charges of $132 million were recognized during 2015 related to the impact of accelerated depreciation on underutilized assets, facility closures and severance due to workforce reductions.
Merger costs includes costs related directly to activities to support and facilitate Cameron's merger with Schlumberger.
58
In May 2014, the Company increased its ownership interest in Cameron Services Middle East LLC from 49% to 90%, for approximately $18 million. The Company recognized a pre-tax gain of nearly $8 million as a result of remeasuring its prior interest, which had been accounted for under the equity method, to fair value upon obtaining control of this entity.
Note 5: Receivables
Receivables consisted of the following:
December 31, | |||||||
(dollars in millions) | 2015 | 2014 | |||||
Trade receivables | $ | 1,167 | $ | 1,678 | |||
Costs and estimated earnings in excess of billings on uncompleted contracts | 736 | 621 | |||||
Other receivables | 118 | 122 | |||||
Allowance for doubtful accounts | (57 | ) | (32 | ) | |||
Total receivables | $ | 1,964 | $ | 2,389 | |||
Note 6: Inventories
Inventories consisted of the following:
December 31, | |||||||
(dollars in millions) | 2015 | 2014 | |||||
Raw materials | $ | 106 | $ | 159 | |||
Work-in-process | 562 | 827 | |||||
Finished goods, including parts and subassemblies | 1,871 | 2,150 | |||||
Other | 20 | 24 | |||||
2,559 | 3,160 | ||||||
Excess of current costs over LIFO costs | (73 | ) | (86 | ) | |||
Allowance for obsolete and excess inventory | (126 | ) | (145 | ) | |||
Total inventories | $ | 2,360 | $ | 2,929 | |||
59
Note 7: Plant and Equipment, Goodwill and Intangibles
Plant and equipment consisted of the following:
December 31, | |||||||
(dollars in millions) | 2015 | 2014 | |||||
Land and land improvements | $ | 118 | $ | 130 | |||
Buildings | 702 | 726 | |||||
Machinery and equipment | 1,586 | 1,682 | |||||
Tooling, dies, patterns, etc. | 185 | 179 | |||||
Office furniture & equipment | 213 | 212 | |||||
Capitalized software | 370 | 370 | |||||
Assets under capital leases | 108 | 120 | |||||
Construction in progress | 162 | 127 | |||||
All other | 17 | 34 | |||||
3,461 | 3,580 | ||||||
Accumulated depreciation | (1,744 | ) | (1,616 | ) | |||
Total plant and equipment, net | $ | 1,717 | $ | 1,964 | |||
Changes in goodwill during 2015 were as follows:
(dollars in millions) | Subsea | Surface | Drilling | Valves & Measurement | Total | ||||||||||||||
Balance at December 31, 2014 | $ | 1,476 | $ | 173 | $ | 501 | $ | 311 | $ | 2,461 | |||||||||
Impairment (See Note 4) | (517 | ) | — | — | — | (517 | ) | ||||||||||||
Goodwill associated with assets held for sale | — | — | (14 | ) | — | (14 | ) | ||||||||||||
Adjustments to the purchase price allocation for prior year acquisitions | (8 | ) | (4 | ) | — | — | (12 | ) | |||||||||||
Translation effect of currency changes and other | (134 | ) | (4 | ) | (4 | ) | (12 | ) | (154 | ) | |||||||||
Balance at December 31, 2015 | $ | 817 | $ | 165 | $ | 483 | $ | 299 | $ | 1,764 | |||||||||
Intangibles consisted of the following:
December 31, | |||||||
(dollars in millions) | 2015 | 2014 | |||||
Customer relationships | $ | 398 | $ | 459 | |||
Patents and technology | 345 | 382 | |||||
Trademarks | 54 | 68 | |||||
Noncompete agreements, engineering drawings and other | 61 | 80 | |||||
858 | 989 | ||||||
Accumulated amortization | (276 | ) | (261 | ) | |||
Total intangibles, net | $ | 582 | $ | 728 | |||
60
Amortization expense associated with the Company’s amortizable intangibles recorded as of December 31, 2015 is expected to approximate $41 million, $40 million, $39 million, $36 million, and $34 million for the year ending December 31, 2016, 2017, 2018, 2019, and 2020, respectively.
Note 8: Accounts Payable and Accrued Liabilities
Accounts payable and accrued liabilities consisted of the following:
December 31, | |||||||
(dollars in millions) | 2015 | 2014 | |||||
Trade accounts payable and accruals | $ | 650 | $ | 1,084 | |||
Advances from customers | 1,082 | 1,576 | |||||
Salaries, wages, and related fringe | 373 | 355 | |||||
Other accruals | 688 | 733 | |||||
Total accounts payable and accrued liabilities | $ | 2,793 | $ | 3,748 | |||
Note 9: Employee Benefit Plans
As of December 31, 2015, the Company sponsored separate defined benefit pension plans for employees of certain of its international subsidiaries, as well as several unfunded defined benefit arrangements for various other employee groups. The defined benefit pension plan covering employees in the United Kingdom was frozen to new entrants effective June 14, 1996.
Certain of the Company’s employees also participate in various employee welfare benefit plans, including medical, dental and prescriptions. Additionally, certain retirees based in the United States receive retiree medical, prescription and life insurance benefits. All of the welfare benefit plans, including those providing postretirement benefits, are unfunded.
During 2014, the Company communicated to employees and beneficiaries of three of its international retirement plans that it had elected to terminate the respective defined benefit plans and replace them with defined contribution plans. In connection with this, the Company recorded a pre-tax curtailment gain, net of settlement losses, of approximately $8 million during 2014 related to the termination of these plans. The final settlement payments were made in 2015.
Total net benefit plan expense (income) associated with the Company’s defined benefit pension and postretirement benefit plans consisted of the following:
Pension Benefits | Postretirement Benefits | ||||||||||||||||||||||
(dollars in millions) | 2015 | 2014 | 2013 | 2015 | 2014 | 2013 | |||||||||||||||||
Service cost | $ | 8 | $ | 18 | $ | 10 | $ | — | $ | — | $ | — | |||||||||||
Interest cost | 15 | 20 | 17 | — | — | — | |||||||||||||||||
Expected return on plan assets | (23 | ) | (27 | ) | (21 | ) | — | — | — | ||||||||||||||
Amortization of prior service credits | (2 | ) | (2 | ) | (2 | ) | (1 | ) | (1 | ) | (1 | ) | |||||||||||
Amortization of losses (gains) | 9 | 9 | 8 | (1 | ) | (1 | ) | (1 | ) | ||||||||||||||
Curtailment gain | — | (12 | ) | — | — | — | — | ||||||||||||||||
Settlement loss | 1 | 4 | — | — | — | — | |||||||||||||||||
Total net benefit plan expense (income) | $ | 8 | $ | 10 | $ | 12 | $ | (2 | ) | $ | (2 | ) | $ | (2 | ) | ||||||||
Included in accumulated other elements of comprehensive income (loss) at December 31, 2015 and 2014 are the following amounts that have not yet been recognized in net periodic benefit plan cost, as well as the amounts that are expected to be recognized in net periodic benefit plan cost during the year ending December 31, 2016:
61
December 31, 2015 | December 31, 2014 | Year ending December 31, 2016 | |||||||||||||||||
(dollars in millions) | Before Tax | After Tax | Before Tax | After Tax | Expected Amortization | ||||||||||||||
Pension benefits: | |||||||||||||||||||
Prior service credits | $ | 15 | $ | 14 | $ | 19 | $ | 15 | $ | (2 | ) | ||||||||
Actuarial losses, net | (131 | ) | (116 | ) | (164 | ) | (132 | ) | 9 | ||||||||||
Postretirement benefits: | |||||||||||||||||||
Prior service credits | 2 | 1 | 3 | 2 | (1 | ) | |||||||||||||
Actuarial gains | 7 | 4 | 8 | 5 | (1 | ) | |||||||||||||
$ | (107 | ) | $ | (97 | ) | $ | (134 | ) | $ | (110 | ) | $ | 5 | ||||||
The change in the projected benefit obligation associated with the Company’s defined benefit pension plans and the change in the accumulated benefit obligation associated with the Company’s postretirement benefit plans was as follows:
Pension Benefits | Postretirement Benefits | ||||||||||||||
(dollars in millions) | 2015 | 2014 | 2015 | 2014 | |||||||||||
Benefit obligation at beginning of year | $ | 509 | $ | 489 | $ | 9 | $ | 11 | |||||||
Service cost | 8 | 18 | — | — | |||||||||||
Interest cost | 15 | 20 | — | — | |||||||||||
Plan participants’ contributions | 1 | 1 | — | — | |||||||||||
Actuarial losses (gains) | 3 | 78 | 1 | (1 | ) | ||||||||||
Exchange rate changes | (29 | ) | (52 | ) | — | — | |||||||||
Benefit payments | (12 | ) | (14 | ) | (1 | ) | (1 | ) | |||||||
Curtailments | — | (23 | ) | — | — | ||||||||||
Settlements | (59 | ) | (8 | ) | — | — | |||||||||
Benefit obligation at end of year | $ | 436 | $ | 509 | $ | 9 | $ | 9 | |||||||
The total accumulated benefit obligation for the Company’s defined benefit pension plans was $392 million and $469 million at December 31, 2015 and 2014, respectively.
The change in the plan assets associated with the Company’s defined benefit pension and postretirement benefit plans was as follows:
Pension Benefits | Postretirement Benefits | ||||||||||||||
(dollars in millions) | 2015 | 2014 | 2015 | 2014 | |||||||||||
Fair value of plan assets at beginning of year | $ | 455 | $ | 432 | $ | — | $ | — | |||||||
Actual return on plan assets | 11 | 53 | — | — | |||||||||||
Company contributions | 14 | 27 | 1 | 1 | |||||||||||
Plan participants’ contributions | 1 | 1 | — | — | |||||||||||
Exchange rate changes | (24 | ) | (40 | ) | — | — | |||||||||
Benefit payments | (12 | ) | (14 | ) | (1 | ) | (1 | ) | |||||||
Settlements | (59 | ) | (8 | ) | — | — | |||||||||
Other | (2 | ) | 4 | — | — | ||||||||||
Fair value of plan assets at end of year | $ | 384 | $ | 455 | $ | — | $ | — | |||||||
The status of the Company’s underfunded defined benefit pension and postretirement benefit plans was as follows:
62
Pension Benefits December 31, | Postretirement Benefits December 31, | ||||||||||||||
(dollars in millions) | 2015 | 2014 | 2015 | 2014 | |||||||||||
Noncurrent assets | $ | 20 | $ | — | $ | — | $ | — | |||||||
Current liabilities | (1 | ) | (1 | ) | (2 | ) | (1 | ) | |||||||
Non-current liabilities | (71 | ) | (53 | ) | (7 | ) | (8 | ) | |||||||
Underfunded status at end of year | $ | (52 | ) | $ | (54 | ) | $ | (9 | ) | $ | (9 | ) | |||
Actual asset investment allocations for the Company’s main defined benefit pension plan in the United Kingdom, which accounts for approximately 89% of total plan assets, were as follows:
2015 | 2014 | 2013 | ||||||
U.K. plan: | ||||||||
Equity securities | 33 | % | 55 | % | 60 | % | ||
Fixed income debt securities, cash and other | 67 | % | 45 | % | 40 | % | ||
In each jurisdiction, the investment of plan assets is overseen by a plan asset committee whose members act as trustees of the plan and set investment policy. For the years ended December 31, 2015 and 2014 and 2013, the investment strategy has been designed to approximate the performance of market indexes. The Company’s targeted allocation for the U.K. plan for 2016 and beyond is approximately 33% in equities, 8% in fixed income debt securities and 59% in real estate and other.
During 2015, the Company made contributions totaling approximately $14 million to the assets of its various defined benefit pension plans. Contributions to plan assets for 2016 are currently expected to approximate $9 million assuming no change in the current discount rate or expected investment earnings.
The assets of the Company’s pension plans are generally invested in debt and equity securities or mutual funds, which are valued based on quoted market prices for an individual asset (level 1 market inputs) or mutual fund unit values, which are based on the fair values of the individual securities that the fund has invested in (level 2 observable market inputs). A certain portion of the assets are invested in insurance contracts, real estate and other investments, which are valued based on level 3 unobservable inputs.
63
The fair values of the Company’s pension plan assets by asset category at December 31, 2015 and 2014 were as follows:
Fair Value Based on Quoted Prices in Active Markets for Identical Assets (Level 1) | Fair Value Based on Significant Other Observable Inputs (Level 2) | Fair Value Based on Significant Unobservable Inputs (Level 3) | Total | ||||||||||||||||||||||||||||
(dollars in millions) | 2015 | 2014 | 2015 | 2014 | 2015 | 2014 | 2015 | 2014 | |||||||||||||||||||||||
Cash and cash equivalents | $ | 1 | $ | 1 | $ | — | $ | — | $ | — | $ | — | $ | 1 | $ | 1 | |||||||||||||||
Equity securities: | |||||||||||||||||||||||||||||||
U.S. equities | — | — | 78 | 83 | — | — | 78 | 83 | |||||||||||||||||||||||
Non-U.S. equities | — | — | 120 | 120 | — | — | 120 | 120 | |||||||||||||||||||||||
Bonds: | |||||||||||||||||||||||||||||||
Non-U.S. government bonds | — | — | 114 | 117 | — | — | 114 | 117 | |||||||||||||||||||||||
Non-U.S. corporate bonds | — | — | 29 | 30 | — | — | 29 | 30 | |||||||||||||||||||||||
Alternative investments: | |||||||||||||||||||||||||||||||
Insurance contracts | — | — | — | — | 28 | 89 | 28 | 89 | |||||||||||||||||||||||
Real estate and other | — | — | — | — | 14 | 15 | 14 | 15 | |||||||||||||||||||||||
Total assets | $ | 1 | $ | 1 | $ | 341 | $ | 350 | $ | 42 | $ | 104 | $ | 384 | $ | 455 | |||||||||||||||
Changes in the fair value of pension plan assets determined based on level 3 unobservable inputs were as follows:
Year Ended December 31, | |||||||
(dollars in millions) | 2015 | 2014 | |||||
Balance at beginning of the year | $ | 104 | $ | 105 | |||
Purchases/sales, net | (56 | ) | 10 | ||||
Actual return on plan assets | (2 | ) | 4 | ||||
Currency impact | (4 | ) | (15 | ) | |||
Balance at end of the year | $ | 42 | $ | 104 | |||
64
The weighted-average assumptions associated with the Company’s defined benefit pension and postretirement benefit plans were as follows:
Pension Benefits | Postretirement Benefits | ||||||||||
2015 | 2014 | 2015 | 2014 | ||||||||
Assumptions related to net benefit costs: | |||||||||||
U.S. plans: | |||||||||||
Discount rate | 3.25 | % | 3.75 | % | 3.25 | % | 3.75 | % | |||
Measurement date | 1/1/2015 | 1/1/2014 | 1/1/2015 | 1/1/2014 | |||||||
Foreign plans: | |||||||||||
Discount rate | 2.25-4.25% | 3.5-5.25% | — | — | |||||||
Expected return on plan assets | 2.25-6.25% | 2.25-6.75% | — | — | |||||||
Rate of compensation increase | 2.25-5.00% | 2.25-4.50% | — | — | |||||||
Measurement date | 1/1/2015 | 1/1/2014 | — | — | |||||||
Assumptions related to end-of-period benefit obligations: | |||||||||||
U.S. plans: | |||||||||||
Discount rate | 3.50 | % | 3.25 | % | 3.50 | % | 3.25 | % | |||
Health care cost trend rate | — | — | 7.00 | % | 7.00 | % | |||||
Measurement date | 12/31/2015 | 12/31/2014 | 12/31/2015 | 12/31/2014 | |||||||
Foreign plans: | |||||||||||
Discount rate | 2.25-4.25% | 2.25-4.25% | — | — | |||||||
Rate of compensation increase | 2.25-4.00% | 2.25-5.00% | — | — | |||||||
Measurement date | 12/31/2015 | 12/31/2014 | — | — | |||||||
The Company’s discount rate assumptions for its U.S. postretirement benefits plan and its international defined benefit pension plans are based on the average yield of a hypothetical high quality bond portfolio with maturities that approximately match the estimated cash flow needs of the plans.
The assumptions for expected long-term rates of return on assets are based on historical experience and estimated future investment returns, taking into consideration anticipated asset allocations, investment strategies and the views of various investment professionals.
The rate of compensation increase assumption for international plans reflects local economic conditions and the Company’s compensation strategy in those locations.
The health care cost trend rate is assumed to decrease gradually from 7% to 5% by 2021 and remain at that level thereafter. A one-percentage-point increase or decrease in the assumed health care cost trend rate would not have a material impact on the service and interest cost components in 2015 or the postretirement benefit obligation as of December 31, 2015.
Amounts applicable to the Company’s pension plans with projected benefit obligations in excess of plan assets and accumulated benefit obligations in excess of plan assets were as follows:
65
Projected Benefit Obligation in Excess of Plan Assets at December 31, | Accumulated Benefit Obligation in Excess of Plan Assets at December 31, | ||||||||||||||
(dollars in millions) | 2015 | 2014 | 2015 | 2014 | |||||||||||
Fair value of applicable plan assets | $ | 41 | $ | 101 | $ | 41 | $ | 101 | |||||||
Projected benefit obligation of applicable plans | $ | 113 | $ | 171 | — | — | |||||||||
Accumulated benefit obligation of applicable plans | — | — | $ | 86 | $ | 149 | |||||||||
Future expected benefit payments are as follows:
(dollars in millions) | Pension Benefits | Postretirement Benefits | |||||
Year ending December 31: | |||||||
2016 | $ | 11 | $ | 1 | |||
2017 | $ | 11 | $ | 1 | |||
2018 | $ | 12 | $ | 1 | |||
2019 | $ | 13 | $ | 1 | |||
2020 | $ | 13 | $ | 1 | |||
2021 - 2025 | $ | 71 | $ | 3 | |||
The Company’s United States-based employees who are not covered by a bargaining unit and certain others are also eligible to participate in the Cameron International Corporation Retirement Savings Plan or the OneSubsea LLC Retirement Savings Plan (the Retirement Savings Plans). Under these plans, employees’ savings deferrals are partially matched in cash and invested at the employees’ discretion. The Company provides nondiscretionary retirement contributions to the Retirement Savings Plans on behalf of each eligible employee equal to 3% of their defined pay. Eligible employees vest in the 3% retirement contributions plus any earnings after completing three years of service. In addition, the Company provides an immediately vested matching contribution of up to 100% of the first 6% of pay contributed by each eligible employee. Employees may contribute amounts in excess of 6% of their pay to the Retirement Savings Plans, subject to certain United States Internal Revenue Service limitations. The Company’s expense for the matching and retirement contribution for the years ended December 31, 2015, 2014 and 2013 amounted to $67 million, $77 million and $77 million, respectively. In addition, the Company provides savings or other benefit plans for employees under collective bargaining agreements and, in the case of certain international employees, as required by government mandate, which provide for, among other things, Company funding in cash based on specified formulas. Expense with respect to these various defined contribution and government-mandated plans for the years ended December 31, 2015, 2014 and 2013 amounted to $57 million, $73 million and $83 million, respectively.
Note 10: Stock-Based Compensation Plans
The Company has grants outstanding under various equity compensation plans, only one of which, the Equity Incentive Plan (EQIP), is currently available for future grants of equity compensation awards to employees and non-employee directors. Options granted under the Company’s equity compensation plans had an exercise price equal to the market value of the underlying common stock on the date of grant and all terms were fixed.
Stock-based compensation expense recognized was as follows:
Year Ended December 31, | |||||||||||
(dollars in millions) | 2015 | 2014 | 2013 | ||||||||
Outstanding restricted and deferred stock units and awards | $ | 40 | $ | 44 | $ | 40 | |||||
Unvested outstanding stock options | 9 | 10 | 14 | ||||||||
Total stock-based compensation expense | $ | 49 | $ | 54 | $ | 54 | |||||
66
The total income statement tax benefit recognized from stock-based compensation arrangements during the years ended December 31, 2015, 2014 and 2013 totaled approximately $18 million, $20 million and $20 million, respectively.
Stock options
Options with terms of seven or ten years have been granted to officers and other key employees of the Company under the EQIP plan at a fixed exercise price equal to the fair value of the Company’s common stock on the date of grant. The options generally vest in one-third increments each year on the anniversary date following the date of grant, based on continued employment.
A summary of option activity under the Company’s stock compensation plans as of and for the year ended December 31, 2015 is presented below:
Options | Shares | Weighted- Average Exercise Price | Weighted- Average Remaining Contractual Term (in years) | Aggregate Intrinsic Value (dollars in millions) | ||||||||
Outstanding at January 1, 2015 | 3,912,488 | $ | 51.89 | |||||||||
Granted | 620,968 | 65.20 | ||||||||||
Exercised | (771,707 | ) | 40.39 | |||||||||
Forfeited and expired | (37,603 | ) | 59.09 | |||||||||
Outstanding at December 31, 2015 | 3,724,146 | $ | 56.42 | 6.77 | $ | 28 | ||||||
Vested at December 31, 2015 or expected to vest in the future | 3,710,191 | $ | 56.40 | 6.76 | $ | 28 | ||||||
Exercisable at December 31, 2015 | 2,377,609 | $ | 53.07 | 5.49 | $ | 25 | ||||||
At December 31, 2015 | |||
Stock-based compensation cost not yet recognized under the straight-line method (dollars in millions) | $ | 15 | |
Weighted-average remaining expense recognition period (in years) | 2.21 | ||
The fair values per share of option grants for the years ended December 31, 2015, 2014 and 2013 were estimated using the Black-Scholes-Merton option pricing formula with the following weighted-average assumptions:
Year Ended December 31, | ||||||||
2015 | 2014 | 2013 | ||||||
Expected life (in years) | 3.5 | 3.3 | 3.2 | |||||
Risk-free interest rate | 0.95 | % | 0.86 | % | 0.67 | % | ||
Volatility | 27.9 | % | 33.8 | % | 34.3 | % | ||
Expected dividend yield | 0.0 | % | 0.0 | % | 0.0 | % | ||
The Company determined the assumptions involving the expected life of its options and volatility rates based primarily on historical data and consideration of expectations for the future.
The above assumptions and market prices of the Company’s common stock at the date of option exercises resulted in the following values:
67
Year Ended December 31, | |||||||||||
2015 | 2014 | 2013 | |||||||||
Grant-date fair value per option | $ | 14.47 | $ | 14.51 | $ | 16.19 | |||||
Intrinsic value of options exercised (dollars in millions) | $ | 16 | $ | 26 | $ | 31 | |||||
Average intrinsic value per share of options exercised | $ | 21.31 | $ | 24.17 | $ | 26.30 | |||||
Restricted and deferred stock units and awards
Grants of restricted stock units are made to officers and other key employees. Restricted stock grants are made in two different forms: performance units and time-based units. The performance restricted stock units must be earned by performance against established return on invested capital and total shareholder return goals. Time-based restricted stock units require continued employment for three years. Both types of restricted stock units granted generally provide for vesting in one-third increments each year or three-year 100% cliff vesting on the third anniversary of the date of grant, based on continued employment.
Non-employee directors are entitled to receive an annual number of deferred stock units equal to a value of $250,000 determined on the day following the Company’s annual meeting of stockholders or, if a director’s election to the Board occurs between annual meetings of stockholders, the initial grant of deferred stock units is based on a pro-rata portion of the annual grant amount equal to the remaining number of months in the board year until the next annual meeting of stockholders. These units, which have no exercise price and no expiration date, vest in one-fourth increments quarterly over the following year but cannot be converted into common stock until the earlier of termination of Board service or three years, although Board members have the ability to voluntarily defer conversion for a longer period of time.
A summary of restricted and deferred stock unit award activity under the Company’s stock compensation plans as of and for the year ended December 31, 2015 is presented below:
Restricted and Deferred Stock Units | Number | Weighted-Average Grant Date Fair Value | ||||
Nonvested at January 1, 2015 | 1,848,682 | $ | 56.85 | |||
Granted | 1,183,828 | 54.95 | ||||
Vested | (780,163 | ) | 54.79 | |||
Forfeited | (86,910 | ) | 54.25 | |||
Nonvested at December 31, 2015 | 2,165,437 | $ | 56.66 | |||
At December 31, 2015 | |||
Stock-based compensation cost not yet recognized under the straight-line method (dollars in millions) | $ | 64 | |
Weighted-average remaining expense recognition period (in years) | 1.80 | ||
Information on restricted and deferred stock units granted and vesting during the three years ended December 31, 2015 follows:
Year Ended December 31, | |||||||||||
2015 | 2014 | 2013 | |||||||||
Number of units granted with performance conditions | 214,072 | 174,697 | 185,992 | ||||||||
Intrinsic value of units vesting (dollars in millions) | $ | 39 | $ | 34 | $ | 46 | |||||
Total number of units granted | 1,183,828 | 826,329 | 838,207 | ||||||||
Weighted average grant date fair value per unit | $ | 54.95 | $ | 59.63 | $ | 57.95 | |||||
68
The fair value of restricted and deferred stock units is determined based on the closing trading price of the Company’s common stock on the grant date.
At December 31, 2015, 9,236,764 shares were reserved for future grants of options, deferred stock units, restricted stock units and other awards. The Company may issue either treasury shares or newly issued shares of its common stock in satisfaction of these awards.
Note 11: Debt
The Company’s debt obligations were as follows:
December 31, | |||||||
(dollars in millions) | 2015 | 2014 | |||||
Commercial paper (0.49% weighted average rate at December 31, 2014) | $ | — | $ | 201 | |||
Senior notes: | |||||||
1.15% notes due December 15, 2016 | 250 | 250 | |||||
1.4% notes due June 15, 2017 | 250 | 250 | |||||
6.375% notes due July 15, 2018 | 450 | 450 | |||||
4.5% notes due June 1, 2021 | 250 | 250 | |||||
3.6% notes due April 30, 2022 | 250 | 250 | |||||
4.0% notes due December 15, 2023 | 250 | 250 | |||||
3.7% notes due June 15, 2024 | 250 | 250 | |||||
7.0% notes due July 15, 2038 | 300 | 300 | |||||
5.95% notes due June 1, 2041 | 250 | 250 | |||||
5.125% notes due December 15, 2043 | 250 | 250 | |||||
Unamortized original issue discount | (6 | ) | (7 | ) | |||
Other debt | 22 | 67 | |||||
Obligations under capital leases | 60 | 71 | |||||
2,826 | 3,082 | ||||||
Current maturities | (284 | ) | (263 | ) | |||
Long-term maturities | $ | 2,542 | $ | 2,819 | |||
Commercial paper program
The Company has in place a commercial paper program for general corporate purposes which allows for issuances of up to $500 million of commercial paper with maturities of no more than 364 days.
Credit agreements and revolving credit facilities
In order to extend the length of its currently available credit facilities, the Company, including certain of its subsidiaries, entered into an amended and restated multi-currency credit agreement (the “Credit Agreement”) with various banks and other financial institutions on May 14, 2015. The Credit Agreement is for $750 million, has a term of five years, expiring on May 14, 2020, and replaces a previously existing $835 million multi-currency credit agreement due to expire in June 2016. The Credit Agreement will be used to finance working capital needs and for other general corporate purposes, including acquisitions, capital expenditures, repurchases of common stock, repayment of debt and issuances of letters of credit. Up to $200 million of this facility may be used for letters of credit. At December 31, 2015, The Company issued no letters of credit, leaving the full leaving the full $750 million available for future use.
The Company also has a $750 million multi-currency syndicated Revolving Credit Facility expiring April 11, 2017. Up to $200 million of this facility may be used for letters of credit. The Company has issued letters of credit totaling $34 million under the Revolving Credit Facility, leaving $716 million available for future use at December 31, 2015.
69
Other
Other debt, some of which is held by entities located in countries with high rates of inflation, has a weighted-average interest rate of 15.6% at December 31, 2015 (6.5% at December 31, 2014).
Future maturities of the Company’s debt (excluding the remaining amount of unamortized discount and capital leases) are approximately $272 million in 2016, $250 million in 2017, $450 million in 2018, no amounts in 2019 and $1.8 billion thereafter.
In addition to the above, the Company also has other unsecured and uncommitted credit facilities available to its foreign subsidiaries to fund ongoing operating activities. Certain of these facilities also include annual facility fees.
Information on interest expensed and paid during the three years ended December 31, 2015 was as follows:
Year Ended December 31 | |||||||||||
(dollars in millions) | 2015 | 2014 | 2013 | ||||||||
Interest expensed | $ | 160 | $ | 149 | $ | 115 | |||||
Interest paid | $ | 154 | $ | 142 | $ | 105 | |||||
Note 12: Leases
The Company leases certain facilities, office space, vehicles, data processing and other equipment under capital and operating leases. Rental expenses for the years ended December 31, 2015, 2014 and 2013 were $100 million, $115 million and $111 million, respectively. Future minimum lease payments with respect to capital leases and operating leases with noncancelable terms in excess of one year were as follows:
Capital | Operating | ||||||
(dollars in millions) | Lease Payments | Lease Payments | |||||
Year ending December 31: | |||||||
2016 | $ | 18 | $ | 109 | |||
2017 | 15 | 81 | |||||
2018 | 10 | 62 | |||||
2019 | 5 | 54 | |||||
2020 | 4 | 50 | |||||
Thereafter | 47 | 139 | |||||
Future minimum lease payments | 99 | 495 | |||||
Less: amount representing interest | (39 | ) | — | ||||
Lease obligations at December 31, 2015 | $ | 60 | $ | 495 | |||
Note 13: Income Taxes
The components of income from continuing operations before income taxes were as follows:
Year Ended December 31, | |||||||||||
(dollars in millions) | 2015 | 2014 | 2013 | ||||||||
U.S. operations | $ | (423 | ) | $ | 294 | $ | 219 | ||||
Foreign operations | 744 | 786 | 636 | ||||||||
Income from continuing operations before income taxes | $ | 321 | $ | 1,080 | $ | 855 | |||||
70
The provisions for income taxes were as follows:
Year Ended December 31, | |||||||||||
(dollars in millions) | 2015 | 2014 | 2013 | ||||||||
Current: | |||||||||||
U.S. federal | $ | 35 | $ | 70 | $ | — | |||||
U.S. state and local | (1 | ) | 4 | 11 | |||||||
Foreign | 198 | 231 | 166 | ||||||||
232 | 305 | 177 | |||||||||
Deferred: | |||||||||||
U.S. federal | (55 | ) | — | 31 | |||||||
U.S. state and local | — | (3 | ) | 2 | |||||||
Foreign | 7 | (44 | ) | (14 | ) | ||||||
(48 | ) | (47 | ) | 19 | |||||||
Income tax provision | $ | 184 | $ | 258 | $ | 196 | |||||
The reasons for the differences between the provision for income taxes and income taxes using the U.S. federal income tax rate were as follows:
Year Ended December 31, | |||||||||||
2015 | 2014 | 2013 | |||||||||
U.S. federal statutory rate | 35.0 | % | 35.0 | % | 35.0 | % | |||||
State and local income taxes | (0.1 | )% | — | % | 1.0 | % | |||||
Foreign statutory rate differential | (34.7 | )% | (9.7 | )% | (10.6 | )% | |||||
Change in valuation allowance on deferred tax assets | 5.4 | % | 3.4 | % | (1.7 | )% | |||||
Nondeductible expenses | (1.1 | )% | (0.1 | )% | 1.1 | % | |||||
Goodwill impairments | 56.4 | % | 1.0 | % | — | % | |||||
Net U.S. tax on foreign source income | (5.8 | )% | (2.9 | )% | (3.2 | )% | |||||
All other | 2.2 | % | (2.8 | )% | 1.3 | % | |||||
Total | 57.3 | % | 23.9 | % | 22.9 | % | |||||
Total income taxes paid (dollars in millions) | $ | 548 | $ | 353 | $ | 329 | |||||
71
Components of deferred tax assets (liabilities) were as follows:
December 31, | |||||||
(dollars in millions) | 2015 | 2014 | |||||
Deferred tax liabilities: | |||||||
Plant and equipment | $ | (117 | ) | $ | (190 | ) | |
Intangible assets | (181 | ) | (221 | ) | |||
Other | (9 | ) | (9 | ) | |||
Total deferred tax liabilities | (307 | ) | (420 | ) | |||
Deferred tax assets: | |||||||
Inventory | 22 | 48 | |||||
Postretirement benefits other than pensions | — | 3 | |||||
Reserves and accruals | 199 | 160 | |||||
Net operating losses and tax credits | 149 | 259 | |||||
Pensions | 28 | 38 | |||||
Other | 26 | 27 | |||||
Total deferred tax assets | 424 | 535 | |||||
Valuation allowance | (93 | ) | (79 | ) | |||
Net deferred tax assets | $ | 24 | $ | 36 | |||
Changes in the Company’s accruals for unrecognized tax benefits were as follows:
Year Ended December 31, | |||||||||||
(dollars in millions) | 2015 | 2014 | 2013 | ||||||||
Balance at beginning of year | $ | 97 | $ | 103 | $ | 121 | |||||
Increases in estimates of tax positions related to prior fiscal year | 1 | — | — | ||||||||
Increases due to tax positions taken during the current year | — | 6 | 3 | ||||||||
Decreases relating to settlements with tax authorities | (5 | ) | (10 | ) | (19 | ) | |||||
Decreases resulting from the lapse of applicable statutes of limitation | — | — | — | ||||||||
Net increases (decreases) due to translation and interest | 2 | (2 | ) | (2 | ) | ||||||
Balance at end of year | $ | 95 | $ | 97 | $ | 103 | |||||
The Company has a $95 million accrual for unrecognized tax benefits at December 31, 2015, of which, approximately $85 million are expected to be settled during the next twelve-month period as a result of the conclusion of various income tax audits or due to the expiration of the applicable statute of limitations. The Company is not currently aware of any material amounts included as unrecognized tax benefits at December 31, 2015 that, if recognized, would not impact the Company’s future effective income tax rate.
There were no material payments for interest or penalties for the years ended December 31, 2015, 2014 or 2013. Also, there were no material accruals for unpaid interest or penalties at December 31, 2015 or 2014.
72
The Company and its subsidiaries file income tax returns in the United States, various domestic states and localities and in many foreign jurisdictions. The earliest years’ tax returns filed by the Company that are still subject to examination by authorities in the major tax jurisdictions are as follows:
United States | United Kingdom | Canada | France | Germany | Norway | Singapore | Italy | |||||||
2011 | 2012 | 2010 | 2013 | 2012 | 2013 | 2012 | 2011 | |||||||
At December 31, 2015, the Company had net operating loss and credit carryforwards in numerous jurisdictions with various expiration periods, including certain jurisdictions which have no expiration period. Changes in the Company’s valuation allowances against these net operating loss and credit carryforwards and other deferred tax assets were as follows:
Year Ended December 31, | |||||||||||
(dollars in millions) | 2015 | 2014 | 2013 | ||||||||
Balance at beginning of year | $ | 79 | $ | 59 | $ | 84 | |||||
Valuation allowances for unutilized net operating losses and excess foreign tax credits generated in the current year | 45 | 25 | 11 | ||||||||
Change in valuation allowances related to prior years | (20 | ) | (2 | ) | (16 | ) | |||||
Write-off of valuation allowances and associated deferred tax assets for certain losses that have no possibility of being utilized | — | — | (19 | ) | |||||||
Effect of translation | (11 | ) | (3 | ) | (1 | ) | |||||
Balance at end of year | $ | 93 | $ | 79 | $ | 59 | |||||
The Company has considered all available evidence in assessing the need for the valuation allowance, including future taxable income, future foreign source income, and ongoing prudent and feasible tax planning strategies. In the event the Company were to determine that it would not be able to realize all or part of its net deferred tax assets in the future, an adjustment to the net deferred tax assets would be charged to income in the period such determination was made.
Tax attribute carryforwards which are available for use on future income tax returns at December 31, 2015 are as follows:
(dollars in millions) | Domestic | Foreign | Expiration | ||||||
Net operating losses - regular income tax | $ | — | $ | 316 | 2018 - Indefinite | ||||
Net operating losses – state income tax | $ | 32 | $ | — | 2018 – 2035 | ||||
Foreign tax credits | $ | 26 | $ | — | 2025 | ||||
The tax benefit that the Company receives with respect to certain stock compensation plan transactions is credited to capital in excess of par value and does not reduce income tax expense. This benefit amounted to $2 million, $6 million and $10 million in 2015, 2014 and 2013, respectively.
As of December 31, 2015, the Company has not provided deferred U.S. income taxes or foreign withholding taxes on temporary differences of approximately $8.3 billion resulting primarily from earnings of certain non-U.S. subsidiaries which are permanently reinvested outside of the U.S. A determination of the amount of any unrecognized U.S. deferred income tax liability is not practicable due to the complexities associated with the underlying hypothetical calculations.
The Company operates in jurisdictions, primarily Singapore and Malaysia, in which it has been granted tax holidays. The benefit of these holidays for 2015, 2014 and 2013 was approximately $16 million, $11 million and $3 million, respectively.
73
Note 14: Stockholders’ Equity
Common Stock
The Company’s Board of Directors has given management the authority to purchase approximately $3.8 billion of the Company’s common stock. The Company, under this authorization, may purchase shares directly or indirectly by way of open market transactions or structured programs, including the use of derivatives, for the Company’s own account or through commercial banks or financial institutions. At December 31, 2015, the Company had remaining authority for future stock purchases totaling approximately $240 million. However, such stock purchases are currently prohibited under the Merger Agreement (see Note 2 of the Notes to Consolidated Condensed Financial Statements for further information).
Changes in the number of shares of the Company’s outstanding stock for the last three years were as follows:
Common Stock | Treasury Stock | Shares Outstanding | ||||||
Balance - December 31, 2012 | 263,111,472 | (16,415,336 | ) | 246,696,136 | ||||
Purchase of treasury stock | — | (26,955,623 | ) | (26,955,623 | ) | |||
Stock issued under stock compensation plans | — | 1,687,795 | 1,687,795 | |||||
Balance - December 31, 2013 | 263,111,472 | (41,683,164 | ) | 221,428,308 | ||||
Purchase of treasury stock | — | (27,970,492 | ) | (27,970,492 | ) | |||
Stock issued under stock compensation plans | — | 1,514,629 | 1,514,629 | |||||
Balance - December 31, 2014 | 263,111,472 | (68,139,027 | ) | 194,972,445 | ||||
Purchase of treasury stock | — | (5,130,334 | ) | (5,130,334 | ) | |||
Stock issued under stock compensation plans | — | 1,337,803 | 1,337,803 | |||||
Balance - December 31, 2015 | 263,111,472 | (71,931,558 | ) | (191,179,914 | ) | |||
At December 31, 2015, 15,126,347 shares of unissued common stock or treasury stock were reserved for future issuance relating to previous grants of options, deferred stock units, restricted stock units and other awards under various stock compensation plans that were still outstanding at December 31, 2015, and for future available grants under those plans.
Preferred Stock
The Company is authorized to issue up to 10 million shares of preferred stock, par value of $0.01 per share. Shares of preferred stock may be issued in one or more series of classes, each of which series or class shall have such distinctive designation or title and terms as shall be fixed by the Board of Directors of the Company prior to issuance of any shares.
Retained Earnings
Delaware law, under which the Company is incorporated, provides that dividends may be declared by the Company’s Board of Directors from a current year’s earnings as well as from the total of capital in excess of par value plus the retained earnings, which amounted to approximately $9 billion at December 31, 2015.
In addition, dividends to be paid by OneSubsea to the venture partners require approval by the Board of Directors of OneSubsea.
74
Note 15: Accumulated Other Elements of Comprehensive Income (Loss)
Accumulated other elements of comprehensive income (loss) comprised the following
(dollars in millions) | Accumulated Foreign Currency Translation Gain (Loss) | Prior Service Credits and Net Actuarial Losses | Accumulated Gain (Loss) on Cash Flow Hedges | Total | Other Comprehensive Income (Loss) | ||||||||||||||
Balance at December 31, 2012 | $ | 46 | $ | (87 | ) | $ | 11 | $ | (30 | ) | |||||||||
Foreign currency translation gain (loss) | (95 | ) | — | — | (95 | ) | $ | (95 | ) | ||||||||||
Actuarial gains (losses) recognized in other comprehensive income, net of tax | — | 40 | — | 40 | 40 | ||||||||||||||
Amortization of actuarial (gains) losses, net of tax | — | 2 | — | 2 | 2 | ||||||||||||||
Gain (loss) on derivatives recognized in other comprehensive income, net of tax | — | — | 6 | 6 | 6 | ||||||||||||||
(Gain) loss on derivatives reclassified from accumulated other comprehensive income, net of tax | (3 | ) | (3 | ) | (3 | ) | |||||||||||||
Balance at December 31, 2013 | (49 | ) | (45 | ) | 14 | (80 | ) | $ | (50 | ) | |||||||||
Foreign currency translation gain (loss) | (379 | ) | — | — | (379 | ) | $ | (379 | ) | ||||||||||
Actuarial gains (losses) recognized in other comprehensive income, net of tax | — | (31 | ) | — | (31 | ) | (31 | ) | |||||||||||
Curtailment and settlement gains (losses) recognized in other comprehensive income, net of tax | — | (3 | ) | — | (3 | ) | (3 | ) | |||||||||||
Amortization of actuarial (gains) losses, net of tax | — | 1 | — | 1 | 1 | ||||||||||||||
Gain (loss) on derivatives recognized in other comprehensive income, net of tax | — | — | (52 | ) | (52 | ) | (52 | ) | |||||||||||
(Gain) loss on derivatives reclassified from accumulated other comprehensive income, net of tax | — | — | 4 | 4 | 4 | ||||||||||||||
Balance at December 31, 2014 | (428 | ) | (78 | ) | (34 | ) | (540 | ) | $ | (460 | ) | ||||||||
Foreign currency translation gain (loss) | (358 | ) | — | — | (358 | ) | $ | (358 | ) | ||||||||||
Actuarial gains (losses) recognized in other comprehensive income, net of tax | — | 12 | — | 12 | 12 | ||||||||||||||
Curtailment and settlement gains (losses) recognized in other comprehensive income, net of tax | — | 1 | — | 1 | 1 | ||||||||||||||
Amortization of actuarial (gains) losses, net of tax | — | 3 | — | 3 | 3 | ||||||||||||||
Gain (loss) on derivatives recognized in other comprehensive income, net of tax | — | — | (54 | ) | (54 | ) | (54 | ) | |||||||||||
(Gain) loss on derivatives reclassified from accumulated other comprehensive income, net of tax | — | — | 59 | 59 | 59 | ||||||||||||||
Balance of December 31, 2015 | $ | (786 | ) | $ | (62 | ) | $ | (29 | ) | $ | (877 | ) | $ | (337 | ) | ||||
75
Note 16: Business Segments
In the fourth quarter of 2014, following the divestiture of our compression businesses, the Company’s operations were reorganized into four reportable segments: Subsea, Surface, Drilling, and Valves & Measurement (V&M), based on the guidelines of ASC 280, Segment Reporting (ASC 280). Within our four reportable segments, Surface, Drilling, and V&M are comprised of a single operating segment and the fourth reportable segment, Subsea, is an aggregation of two operating segments, OneSubsea and Custom Process Systems (CPS).
We determined our operating segments based on how our chief executive officer (who is our chief operating decision maker) evaluates financial information, allocates resources and assesses the performance of each operating segment. In addition, each operating segment is managed by a segment president.
With respect to the OneSubsea and CPS operating segments, we determined that aggregation of these two operating segments into the Subsea reportable segment was appropriate because aggregation was consistent with the objectives and basic principles of ASC 280 and these operating segments met all of the criteria for aggregation set forth in ASC 280. On a long-term basis, these segments are expected to demonstrate similar economic characteristics, in terms of gross margin and income before interest, income taxes and depreciation and amortization. Both segments perform construction projects and offer similar or complementary products and services for the same or similar customers active in subsea oil and gas production. In some instances, OneSubsea and CPS work together to provide complementary or an integrated offering of products and services to the same customer for the same project. The CPS operating segment’s revenues were approximately five percent of the Company’s consolidated revenues for the years ended December 31, 2015 and 2014.
The Subsea segment includes the operations of OneSubsea, a business jointly owned by Cameron (60%) and Schlumberger (40%). The Subsea segment delivers integrated solutions, products, systems and services to the subsea oil and gas market, including integrated subsea production systems involving wellheads, subsea trees, manifolds and flowline connectors, subsea processing systems for the enhanced recovery of hydrocarbons, control systems, connectors and services designed to maximize reservoir recovery and extend the life of each field.
The Surface segment provides onshore and offshore platform wellhead systems and processing solutions, including valves, chokes, actuators, Christmas trees and aftermarket services to oil and gas operators. Rental equipment and artificial lift technologies are also provided, as well as products and services involving shale gas production.
One of the major services provided by the Surface segment is CAMSHALE™ Production Solutions, which specializes in shale gas production. In this process, intense pressure from fracing fluid (usually a mixture of water and sand) is used to crack surrounding shale. Once the fractures are made, the water is removed from the well bore and the sand is left behind to hold the fractures open. Oil and natural gas then moves out of the fractures, into the well bore, and up to the surface.
The Drilling segment provides drilling equipment and aftermarket services to shipyards, drilling contractors, exploration & production operators and rental tool companies. Products fall into two broad categories: pressure control equipment and rotary drilling equipment and are designed for either onshore or offshore applications. Such products include drilling equipment packages, blowout preventers (BOPs), BOP control systems, connectors, riser systems, valve and choke manifold systems, top drives, mud pumps, pipe handling equipment, rig designs and rig kits.
The V&M segment businesses serve portions of the upstream, midstream and downstream markets. These businesses provide valves and measurement systems that are primarily used to control, direct and measure the flow of oil and gas as they are moved from individual wellheads through flow lines, gathering lines and transmission systems to refineries, petrochemical plants and industrial centers for processing. Products include gate valves, butterfly valves, Orbit® brand rising stem ball valves, double block and bleed valves, plug valves, globe valves, check valves, actuators, chokes and aftermarket parts and services as well as measurement equipment products such as totalizers, turbine meters, flow computers, chart recorders, ultrasonic flow meters and sampling systems.
The Company’s primary customers are oil and gas majors, national oil companies, independent producers, engineering and construction companies, drilling contractors, rental companies, geothermal energy and independent power producers, pipeline operators, major chemical, petrochemical and refining companies, natural gas processing and transmission companies, compression leasing companies, durable goods manufacturers, utilities and air separation companies.
The Company markets its equipment through a worldwide network of sales and marketing employees supported by agents and distributors in selected international locations. Due to the extremely technical nature of many of the products, the marketing effort is further supported by a staff of engineering employees.
76
The Company expenses all research and product development and enhancement costs as incurred, or if incurred in connection with a product ordered by a customer, when the revenue associated with the product is recognized. For the years ended December 31, 2015, 2014 and 2013, research and product development expenditures, including amounts incurred on projects designed to enhance or add to its existing product offerings, totaled approximately $140 million, $128 million and $83 million, respectively. The Subsea segment accounted for 52%, 58% and 44% of each respective year’s total costs.
77
Summary financial data by segment follows:
Year Ended December 31, | |||||||||||
(dollars in millions) | 2015 | 2014 | 2013 | ||||||||
Revenues: | |||||||||||
Subsea | $ | 2,753 | $ | 3,067 | $ | 2,813 | |||||
Surface | 1,957 | 2,411 | 2,077 | ||||||||
Drilling | 2,708 | 3,049 | 2,327 | ||||||||
V&M | 1,548 | 2,125 | 2,105 | ||||||||
Elimination of intersegment revenues | (184 | ) | (271 | ) | (184 | ) | |||||
Consolidated revenues | $ | 8,782 | $ | 10,381 | $ | 9,138 | |||||
Depreciation and amortization: | |||||||||||
Subsea | $ | 87 | $ | 113 | $ | 85 | |||||
Surface | 135 | 126 | 106 | ||||||||
Drilling | 67 | 60 | 60 | ||||||||
V&M | 53 | 49 | 47 | ||||||||
Consolidated depreciation and amortization | $ | 342 | $ | 348 | $ | 298 | |||||
Segment operating income before interest and income taxes: | |||||||||||
Subsea | $ | 407 | $ | 207 | $ | 152 | |||||
Surface | 264 | 427 | 367 | ||||||||
Drilling | 528 | 474 | 311 | ||||||||
V&M | 177 | 393 | 414 | ||||||||
Elimination of intersegment earnings | (36 | ) | (74 | ) | (35 | ) | |||||
Segment operating income before interest and income taxes | 1,340 | 1,427 | 1,209 | ||||||||
Corporate items: | |||||||||||
Corporate expenses | (108 | ) | (145 | ) | (162 | ) | |||||
Interest, net | (138 | ) | (129 | ) | (100 | ) | |||||
Other costs | (773 | ) | (73 | ) | (92 | ) | |||||
Consolidated income from continuing operations before income taxes | $ | 321 | $ | 1,080 | $ | 855 | |||||
Capital expenditures: | |||||||||||
Subsea | $ | 60 | $ | 70 | $ | 80 | |||||
Surface | 109 | 125 | 156 | ||||||||
Drilling | 44 | 38 | 111 | ||||||||
V&M | 36 | 49 | 58 | ||||||||
Corporate | 36 | 96 | 102 | ||||||||
Discontinued operations | — | 7 | 13 | ||||||||
Consolidated capital expenditures | $ | 285 | $ | 385 | $ | 520 | |||||
Total assets: | |||||||||||
Subsea | $ | 4,735 | $ | 5,571 | $ | 5,897 | |||||
Surface | 2,667 | 2,756 | 2,705 | ||||||||
Drilling | 2,394 | 3,011 | 3,076 | ||||||||
V&M | 1,540 | 1,633 | 1,765 | ||||||||
Corporate | 1,025 | 581 | 844 | ||||||||
Discontinued operations | — | 217 | 616 | ||||||||
Elimination of intersegment investments | (861 | ) | (877 | ) | (654 | ) | |||||
Consolidated total assets | $ | 11,500 | $ | 12,892 | $ | 14,249 | |||||
78
For internal management reporting, and therefore in the above segment information, “Corporate items” include governance expenses associated with the Company’s corporate office, as well as all of the Company’s interest income, interest expense, certain litigation expense managed by the Company’s General Counsel, foreign currency gains and losses from certain derivative and intercompany lending activities managed by the Company’s centralized Treasury function, all of the Company’s pension settlement costs, asset impairment and restructuring expenses, acquisition-related costs and various other unusual or one-time costs that are not considered a component of segment operating income. Consolidated interest income and expense are treated as a corporate item because cash equivalents, short-term investments and debt, including location, type, currency, etc., are managed on a worldwide basis by the Corporate Treasury Department.
Customer revenue by shipping location and long-lived assets by country were as follows:
Year Ended December 31, | |||||||||||
(dollars in millions) | 2015 | 2014 | 2013 | ||||||||
Revenues: | |||||||||||
United States | $ | 4,609 | $ | 4,689 | $ | 4,311 | |||||
United Kingdom | 1,200 | 964 | 822 | ||||||||
Norway | 776 | 952 | 684 | ||||||||
Other foreign countries | 2,197 | 3,776 | 3,321 | ||||||||
Total revenues | $ | 8,782 | $ | 10,381 | $ | 9,138 | |||||
December 31, | |||||||||||
(dollars in millions) | 2015 | 2014 | 2013 | ||||||||
Long-lived assets: | |||||||||||
United States | $ | 1,703 | $ | 2,367 | $ | 2,670 | |||||
United Kingdom | 221 | 219 | 197 | ||||||||
Norway | 1,314 | 1,627 | 1,953 | ||||||||
Other foreign countries | 825 | 940 | 1,046 | ||||||||
Total long-lived assets | $ | 4,063 | $ | 5,153 | $ | 5,866 | |||||
Note 17: Earnings Per Share
The calculation of basic and diluted earnings per share for each period presented was as follows:
Year Ended December 31, | |||||||||||
(amounts in millions, except per share data) | 2015 | 2014 | 2013 | ||||||||
Net income attributable to Cameron | $ | 501 | $ | 811 | $ | 699 | |||||
Average shares outstanding (basic) | 192 | 204 | 242 | ||||||||
Common stock equivalents | 1 | 1 | 2 | ||||||||
Shares utilized in diluted earnings per share calculation | 193 | 205 | 244 | ||||||||
Earnings per share attributable to Cameron stockholders: | |||||||||||
Basic | $ | 2.61 | $ | 3.98 | $ | 2.89 | |||||
Diluted | $ | 2.60 | $ | 3.96 | $ | 2.87 | |||||
79
Note 18: Summary of Non-cash Operating, Investing and Financing Activities
The effect on net assets of non-cash operating, investing and financing activities was as follows:
(dollars in millions) | 2015 | 2014 | 2013 | ||||||||
Tax benefit of stock compensation plan transactions | $ | 2 | $ | 6 | $ | 10 | |||||
Change in fair value of derivatives accounted for as cash flow hedges, net of tax | $ | (65 | ) | $ | (76 | ) | $ | 14 | |||
Actuarial gain (loss), net, related to defined benefit pension and postretirement benefit plans | $ | 8 | $ | (35 | ) | $ | 13 | ||||
Note 19: Off-Balance Sheet Risk and Guarantees, Concentrations of Credit Risk and Fair Value of Financial Instruments
Off-Balance Sheet Risk and Guarantees
At December 31, 2015, the Company was contingently liable with respect to approximately $1.1 billion of bank guarantees and standby letters of credit issued on its behalf by major domestic and international financial institutions in connection with the delivery, installation and performance of the Company’s products under contract with customers throughout the world. The Company was also liable to these financial institutions for financial letters of credit and other guarantees issued on its behalf totaling nearly $36 million, which provide security to third parties relating to the Company’s ability to meet specified financial obligations, including payment of leases, customs duties, insurance and other matters. Additionally, the Company was liable for approximately $36 million of insurance bonds at December 31, 2015 relating to the requirements in certain foreign jurisdictions where the Company does business that the Company hold insurance bonds rather than bank guarantees.
The Company’s other off-balance sheet risks were not material at December 31, 2015.
Concentrations of Credit Risk and Major Customers
Apart from its normal exposure to its customers, who are predominantly in the energy industry, the Company had no significant concentrations of credit risk at December 31, 2015. The Company typically does not require collateral for its customer trade receivables but does often obtain letters of credit from third-party banks as security for future payment on certain large product shipments. Allowances for doubtful accounts are recorded for estimated losses that may result from the inability of customers to make required payments. See Note 5 of the Notes to Consolidated Financial Statements for additional information.
Fair Value of Financial Instruments
The Company’s financial instruments consist primarily of cash and cash equivalents, short-term investments, trade receivables, trade payables, derivative instruments and debt instruments. The book values of trade receivables, trade payables and floating-rate debt instruments are considered to be representative of their respective fair values.
80
Following is a summary of the Company’s financial instruments which have been valued at fair value in the Company’s Consolidated Balance Sheets at December 31, 2015 and 2014:
Fair Value Based on Quoted Prices in Active Markets for Identical Assets (Level 1) | Fair Value Based on Significant Other Observable Inputs (Level 2) | Total | |||||||||||||||||||||
(dollars in millions) | 2015 | 2014 | 2015 | 2014 | 2015 | 2014 | |||||||||||||||||
Cash and cash equivalents: | |||||||||||||||||||||||
Cash | $ | 562 | $ | 616 | $ | — | $ | — | $ | 562 | $ | 616 | |||||||||||
Money market funds | 1,024 | 842 | — | — | 1,024 | 842 | |||||||||||||||||
Commercial paper | — | — | 105 | 13 | 105 | 13 | |||||||||||||||||
U.S. treasury securities | — | 5 | — | — | — | 5 | |||||||||||||||||
U.S. corporate obligations | 25 | 4 | — | — | 25 | 4 | |||||||||||||||||
Non-U.S. bank and other obligations | 59 | 33 | — | — | 59 | 33 | |||||||||||||||||
Short-term investments: | |||||||||||||||||||||||
Commercial paper | — | — | 223 | 11 | 223 | 11 | |||||||||||||||||
U.S. Treasury securities | 84 | 51 | — | — | 84 | 51 | |||||||||||||||||
U.S. corporate obligations | 202 | 51 | — | — | 202 | 51 | |||||||||||||||||
U.S. non-governmental agency asset-backed securities | — | — | 75 | — | 75 | — | |||||||||||||||||
Non-qualified plan assets: | |||||||||||||||||||||||
Money market funds | 1 | 1 | — | — | 1 | 1 | |||||||||||||||||
Domestic bond funds | 3 | 3 | — | — | 3 | 3 | |||||||||||||||||
Domestic equity funds | 6 | 5 | — | — | 6 | 5 | |||||||||||||||||
International equity funds | 3 | 3 | — | — | 3 | 3 | |||||||||||||||||
Blended equity funds | 6 | 5 | — | — | 6 | 5 | |||||||||||||||||
Common stock | 1 | 2 | — | — | 1 | 2 | |||||||||||||||||
Derivatives, net asset (liability): | |||||||||||||||||||||||
Foreign currency contracts | — | — | (34 | ) | (99 | ) | (34 | ) | (99 | ) | |||||||||||||
Total financial instruments | $ | 1,976 | $ | 1,621 | $ | 369 | $ | (75 | ) | $ | 2,345 | $ | 1,546 | ||||||||||
Fair values for financial instruments utilizing level 2 inputs were determined from information obtained from third-party pricing sources, broker quotes, calculations involving the use of market indices or mutual fund unit values determined based upon the valuation of the funds’ underlying assets.
At December 31, 2015 and December 31, 2014, the fair value of the Company’s fixed-rate debt (based on Level 1 quoted market rates) was approximately $2.9 billion as compared to the $2.7 billion face value of the debt recorded, net of original issue discounts, in the Company’s Consolidated Balance Sheet.
Derivative Contracts
In order to mitigate the effect of exchange rate changes, the Company will often attempt to structure sales contracts to provide for collections from customers in the currency in which the Company incurs its manufacturing costs. In certain instances, the Company will enter into foreign currency forward contracts to hedge specific large anticipated receipts or disbursements in currencies for which the Company does not have fully offsetting local currency expenditures or receipts. The Company was party to a number of long-term foreign currency forward contracts at December 31, 2015. The purpose of the majority of these contracts was to hedge large anticipated non-functional currency cash flows on major subsea, drilling, valve or other equipment contracts. Many of these contracts have been designated as and are accounted for as cash flow hedges with changes in the fair value of those contracts recorded in accumulated other elements of comprehensive income (loss) in the period such change occurs. Certain other contracts, many of which are centrally managed, are intended to offset other foreign currency exposures but have not been designated as hedges for accounting purposes and, therefore, any change in the fair value of those contracts are reflected in earnings in the period such change occurs. The Company determines the fair value of its outstanding foreign currency forward contracts based on quoted exchange rates for the respective currencies applicable to similar instruments.
81
Total gross volume bought (sold) by notional currency and maturity date on open foreign currency forward contracts at December 31, 2015 was as follows:
Notional Amount - Buy | Notional Amount - Sell | |||||||||||||||||||
(in millions) | 2016 | 2017 | Total | 2016 | 2017 | 2018 | Total | |||||||||||||
Foreign exchange forward contracts - | ||||||||||||||||||||
Notional currency in: | ||||||||||||||||||||
Euro | 89 | 37 | 126 | (11 | ) | — | — | (11 | ) | |||||||||||
Malaysian ringgit | 175 | — | 175 | (9 | ) | — | — | (9 | ) | |||||||||||
Norwegian krone | 604 | 31 | 635 | (132 | ) | (4 | ) | — | (136 | ) | ||||||||||
Pound Sterling | 113 | 2 | 115 | (5 | ) | — | — | (5 | ) | |||||||||||
U.S. dollar | 212 | 4 | 216 | (440 | ) | (101 | ) | (1 | ) | (542 | ) | |||||||||
While the Company and its counterparties have the right to offset gains and losses on different derivative contracts under certain circumstances, the Company’s policy is to record its derivative contracts on a gross basis. The fair values of derivative financial instruments recorded in the Company’s Consolidated Balance Sheets were as follows:
December 31, | |||||||||||||||
2015 | 2014 | ||||||||||||||
(dollars in millions) | Assets | Liabilities | Assets | Liabilities | |||||||||||
Derivatives designated as hedges: | |||||||||||||||
Foreign exchange contracts – | |||||||||||||||
Current | $ | 7 | $ | 38 | $ | 8 | $ | 83 | |||||||
Non-current | 1 | 2 | 1 | 12 | |||||||||||
Total derivatives designated as hedges | 8 | 40 | 9 | 95 | |||||||||||
Derivatives not designated as hedges: | |||||||||||||||
Foreign exchange contracts – | |||||||||||||||
Current | 1 | 3 | 1 | 14 | |||||||||||
Non-current | — | — | — | — | |||||||||||
Total derivatives not designated as hedges | 1 | 3 | 1 | 14 | |||||||||||
Total derivatives | $ | 9 | $ | 43 | $ | 10 | $ | 109 | |||||||
82
The amount of pre-tax gain (loss) from the ineffective portion of derivatives designated as hedging instruments and from derivatives not designated as hedging instruments was:
Year Ended December 31, | |||||||||||
(dollars in millions) | 2015 | 2014 | 2013 | ||||||||
Derivatives designated as hedging instruments: | |||||||||||
Foreign currency contracts – | |||||||||||
Cost of sales | $ | 6 | $ | (7 | ) | $ | 1 | ||||
Derivatives not designated as hedging instruments: | |||||||||||
Foreign currency contracts – | |||||||||||
Cost of sales | (24 | ) | (11 | ) | 7 | ||||||
Other costs | (11 | ) | (8 | ) | (1 | ) | |||||
Total pre-tax gain (loss) | $ | (29 | ) | $ | (26 | ) | $ | 7 | |||
Note 20: Contingencies
The Company is subject to a number of contingencies, including litigation, tax contingencies and environmental matters.
Litigation
The Company has been and continues to be named as a defendant in a number of multi-defendant, multi-plaintiff tort lawsuits. At December 31, 2015, the Company’s Consolidated Balance Sheet included a liability of approximately $21 million for such cases. The Company believes, based on its review of the facts and law, that the potential exposure from these suits will not have a material adverse effect on its consolidated results of operations, financial condition or liquidity.
Tax and Other Contingencies
The Company has legal entities in over 50 countries. As a result, the Company is subject to various tax filing requirements in these countries. The Company prepares its tax filings in a manner which it believes is consistent with such filing requirements. However, some of the tax laws and regulations to which the Company is subject require interpretation and/or judgment. Although the Company believes that adequate provisions for the tax liabilities for periods ending on or before the balance sheet date have been made in the financial statements; to the extent a taxing authority believes the Company has not prepared its tax filings in accordance with the authority’s interpretation of the tax laws and regulations, the Company could be exposed to additional taxes.
The Company has been assessed customs duties and penalties by the government of Brazil totaling approximately $34 million at December 31, 2015, including interest accrued at local country rates, following a customs audit for the years 2003-2010. The Company filed an administrative appeal and believes a majority of this assessment will ultimately be proven to be incorrect because of numerous errors in the assessment, and because the government has not provided appropriate supporting documentation for the assessment. As a result, the Company currently expects no material adverse impact on its results of operations or cash flows as a result of the ultimate resolution of this matter. No amounts have been accrued for this assessment as of December 31, 2015 as no loss is currently considered probable.
Environmental Matters
The Company is currently identified as a potentially responsible party (PRP) for one site designated for cleanup under the Comprehensive Environmental Response Compensation and Liability Act (CERCLA). The Osborne site is a landfill into which a predecessor of the Reciprocating Compression operation in Grove City, Pennsylvania deposited waste. Remediation was completed in 2011 and remaining costs relate to ongoing ground water monitoring. The Company is also a party with de minimis exposure at other sites covered by CERCLA or similar state laws.
The Company is engaged in site cleanup under the Voluntary Cleanup Plan of the Texas Commission on Environmental Quality ("TCEQ") at a former manufacturing site in Houston, Texas. In 2001, the Company discovered that contaminated underground water had migrated under an adjacent residential area. Pursuant to applicable state regulations, the Company notified the affected homeowners. Concerns over the impact on property values of the underground water contamination and its public disclosure led to a number of claims by homeowners. The Company has settled these claims, primarily as a result of the settlement of a class action lawsuit, and is obligated to reimburse certain homeowners for any diminution in value of their property due to
83
concerns over contamination at the time of the property's sale. As required, the Company has and will continue to notify surrounding property owners of testing and monitoring results, including concentration levels and migration patterns. The Company continues to monitor the situation to determine whether additional remedial measures would be appropriate. The Company believes, based on its review of the facts and law, that any potential exposure from existing agreements as well as any possible new claims that may be filed with respect to this underground water contamination will not have a material adverse effect on its financial position or results of operations. The Company's Consolidated Balance Sheet included a noncurrent liability of approximately $7 million for these matters as of December 31, 2015.
Additionally, the Company has discontinued operations at a number of other sites which had been active for many years and which may have yet undiscovered contamination. The Company does not believe, based upon information currently available, that there are any material environmental liabilities existing at these locations. At December 31, 2015, the Company's Consolidated Balance Sheet included a noncurrent liability of approximately $5 million for these environmental matters.
Note 21: Recently Issued Accounting Pronouncements
Revenue
In May 2014, the U.S. Financial Accounting Standards Board (FASB) and the International Accounting Standards Board (IASB) jointly issued a comprehensive new revenue recognition standard that will supersede nearly all existing revenue recognition guidance under U.S. GAAP and International Financial Reporting Standards (IFRS).
The core principle of Accounting Standards Update 2014-09, Revenue from Contracts with Customers (ASU 2014-09), is that a company will recognize revenue when it transfers promised goods and services to customers in an amount that reflects the consideration to which the company expects to be entitled in exchange for those goods and services. In order to comply with this new standard, companies will need to:
• | identify performance obligations in each contract, |
• | estimate the amount of variable consideration to include in the transaction price, and |
• | allocate the transaction price to each separate performance obligation. |
In October 2015, the FASB further voted to amend this standard with regard to accounting for licenses of intellectual property and identifying performance obligations and in December 2015, the FASB and IASB unanimously voted to finalize clarifying amendments to the principal versus agent guidance in the new revenue standard. The FASB has also indicated they are planning to issue other proposed amendments that would clarify the collectibility criterion and provide practical expedients to ease transition, among other things. ASU 2014-09, as amended in 2015, will be effective for Cameron beginning in the first quarter of 2018. The Company is currently evaluating this standard and our existing revenue recognition policies to determine which contracts in the scope of the guidance will be affected by the new requirements and what impact, if any, they would have on our consolidated financial statements upon adoption of this standard. We have not yet determined if we will select the full retrospective or the modified retrospective implementation method upon adoption.
Going Concern
In August 2014, the FASB issued ASU 2014-15, Presentation of Financial Statements- Going Concern (Subtopic 205-40). ASU 2015-11 provides guidance in GAAP about management’s responsibility to evaluate whether there is substantial doubt about an entity’s ability to continue as a going concern and to provide related footnote disclosures. This guidance is effective for the Company beginning January 1, 2017. The Company does not anticipate a material impact on its consolidated financial statements at the time of adoption of this new standard.
Debt Issuance Costs
In April 2015, the FASB issued ASU 2015-03, Interest-Imputation of Interest (Subtopic 835-30): Simplifying the Presentation of Debt Issuance Costs (ASU 2015-03). ASU 2015-03 requires that debt issuance costs related to a recognized liability in the balance sheet be presented as a direct deduction to that liability rather than as an asset. This will align the presentation of debt issuance costs with that of debt discounts and premiums. Final guidance on this standard, issued as ASU 2015-15 in August 2015, includes an SEC staff announcement that the SEC staff will not object to an entity presenting the cost of securing a revolving line of credit as an asset, regardless of whether a balance is outstanding. The original standard, as issued, did not address revolving lines of credit, which may not have outstanding balances. The Company will adopt this new standard beginning January 1, 2016, with the guidance applied retrospectively to all prior periods presented in financial statements issued after that
84
date. The Company does not anticipate a material impact on its Consolidated Balance Sheet at the time of adoption of this new standard.
Inventory
In July 2015, the FASB issued ASU 2015-11, Inventory (Topic 330): Simplifying the Measurement of Inventory (ASU 2015-11). ASU 2015-11 requires companies to measure inventory at the lower of cost or net realizable value rather than at the lower of cost or market. Net realizable value is the estimated selling price in the ordinary course of business, less reasonably predictable costs of completion, disposal and transportation. This guidance is effective for the Company’s FIFO inventories beginning January 1, 2016. The Company does not anticipate a material impact on its consolidated financial statements at the time of adoption of this new standard.
Business Combinations
In September 2015, the FASB issued ASU 2015-16, Business Combinations (Topic 805): Simplifying the Accounting for Measurement-Period Adjustments (ASU 2015-16). This new standard specifies that an acquirer should recognize adjustments to provisional amounts that are identified during the measurement period in the reporting period in which the adjustment amounts are determined, eliminating the current requirement to retrospectively account for these adjustments. Additionally, the full effect on earnings of changes in depreciation, amortization, or other income effects, if any, as a result of the change to the provisional amounts should be recognized in the same period as the adjustments to the provisional amounts. The Company will adopt this new standard beginning January 1, 2016. The Company does not anticipate a material impact on its consolidated financial statements at the time of adoption of this new standard.
Deferred taxes
In November 2015, the FASB issued ASU 2015-17, Income Taxes (Topic 740): Balance Sheet Classification of Deferred Taxes (ASU 2015-17). This new standard requires companies to classify all deferred tax assets and liabilities as noncurrent on the balance sheet instead of separating deferred taxes into current and noncurrent amounts. The current requirement that deferred tax liabilities and assets of a tax-paying component of an entity be offset and presented as a single amount is not affected by this guidance. ASU 2015-17 is effective for the Company beginning January 1, 2017. The Company does not anticipate a material impact on its consolidated financial statements at the time of adoption of this new standard.
Financial Instruments
In January 2016, the FASB issued ASU 2016-01, Financial Instruments - Overall - Recognition and Measurement of Financial Assets and Financial Liabilities (ASU 2016-01). This new standard requires, among other things, that entities measure equity investments (except those accounted for under the equity method of accounting or those that result in consolidation of the investee) at fair value, with changes in fair value recognized in net income. Under ASU 2016-01, entities will no longer be able to recognize unrealized holding gains and losses on equity securities classified today as available for sale in other comprehensive income and they will no longer be able to use the cost method of accounting for equity securities that do not have readily determinable fair values. This new standard does not change the guidance for classifying and measuring investments in debt securities and loans. ASU 2016-01 is effective for the Company January 1, 2018. The Company does not anticipate a material impact on its consolidated financial statements at the time of adoption of this new standard.
85
Note 22: Unaudited Quarterly Operating Results
Unaudited quarterly operating results were as follows:
2015 (Quarter Ended) | |||||||||||||||
(dollars in millions, except per share data) | March 31, | June 30, | September 30, | December 31, | |||||||||||
Revenues | $ | 2,273 | $ | 2,222 | $ | 2,208 | $ | 2,079 | |||||||
Revenues less cost of sales (exclusive of depreciation and amortization) | $ | 665 | $ | 637 | $ | 678 | $ | 676 | |||||||
Asset charges | $ | 553 | $ | 10 | $ | 18 | $ | 58 | |||||||
Other costs | $ | 24 | $ | 27 | $ | 26 | $ | 57 | |||||||
Net income | $ | 51 | $ | 155 | $ | 213 | $ | 149 | |||||||
Net income attributable to noncontrolling interests | $ | 2 | $ | 15 | $ | 26 | $ | 24 | |||||||
Net income attributable to Cameron stockholders | $ | 49 | $ | 140 | $ | 187 | $ | 125 | |||||||
Earnings per share attributable to Cameron stockholders: | |||||||||||||||
Basic | $ | 0.25 | $ | 0.73 | $ | 0.98 | $ | 0.65 | |||||||
Diluted | $ | 0.25 | $ | 0.73 | $ | 0.97 | $ | 0.65 | |||||||
2014 (Quarter Ended) | |||||||||||||||
(dollars in millions, except per share data) | March 31, | June 30, | September 30, | December 31, | |||||||||||
Revenues | $ | 2,329 | $ | 2,570 | $ | 2,678 | $ | 2,804 | |||||||
Revenues less cost of sales (exclusive of depreciation and amortization) | $ | 639 | $ | 720 | $ | 763 | $ | 795 | |||||||
Other costs (credits) | $ | 49 | $ | (6 | ) | $ | 19 | $ | 11 | ||||||
Net income | $ | 115 | $ | 233 | $ | 238 | $ | 262 | |||||||
Net income attributable to noncontrolling interests | $ | 4 | $ | 12 | $ | 13 | $ | 8 | |||||||
Net income attributable to Cameron stockholders | $ | 111 | $ | 221 | $ | 225 | $ | 254 | |||||||
Earnings per share attributable to Cameron stockholders: | |||||||||||||||
Basic | $ | 0.51 | $ | 1.08 | $ | 1.12 | $ | 1.30 | |||||||
Diluted | $ | 0.51 | $ | 1.08 | $ | 1.11 | $ | 1.28 | |||||||
86
ITEM 9. CHANGES IN AND DISAGREEMENTS WITH ACCOUNTANTS ON ACCOUNTING AND FINANCIAL DISCLOSURE
None.
ITEM 9A. CONTROLS AND PROCEDURES
(a) | The Company carried out an evaluation, under the supervision and with the participation of the Company’s Sarbanes-Oxley Disclosure Committee and the Company’s management, including the Chief Executive Officer and the Chief Financial Officer, of the effectiveness of the design and operation of the Company’s disclosure controls and procedures, as defined in Rules 13a-15(e) and 15d-15(e) of the Securities Exchange Act of 1934, as of December 31, 2015. Based upon that evaluation, the Chief Executive Officer and the Chief Financial Officer concluded that the Company’s disclosure controls and procedures were effective as of December 31, 2015 to ensure that information required to be disclosed by the Company that it files or submits under the Exchange Act is recorded, processed, summarized and reported within the time periods specified in the SEC’s rules and forms and that information required to be disclosed in the reports that the Company files or submits under the Exchange Act is accumulated and communicated to the Company’s management, including its Chief Executive Officer and Chief Financial Officer, as appropriate, to allow timely decisions regarding required disclosure. |
(b) | Management’s Report on Internal Control over Financial Reporting - The report of management of the Company regarding internal control over financial reporting is set forth in Part II, Item 8 of this Annual Report on Form 10-K under the caption “Management’s Report on Internal Control over Financial Reporting” and incorporated herein by reference. |
(c) | Attestation Report of Independent Registered Public Accounting Firm - The attestation report of the Company’s independent registered public accounting firm regarding internal control over financial reporting is set forth in Part II, Item 8 of this Annual Report on Form 10-K under the caption “Report of Independent Registered Public Accounting Firm” and incorporated herein by reference. |
(d) | Changes in Internal Control over Financial Reporting – There were no changes made in the Company’s internal control over financial reporting during the fourth quarter of 2015 that have materially affected, or are reasonably likely to materially affect, the Company’s internal control over financial reporting. |
ITEM 9B. OTHER INFORMATION
In early 2016, the U.S. Securities and Exchange Commission and the U.S. Department of Justice requested the Company to voluntarily provide documents and information concerning the Company’s anti-bribery policies and program and any suspected, alleged, or reported violations thereof; certain former employees; and our business activities with certain customers and the agents or other intermediaries involved with these activities, both generally and with respect to certain countries. The Department of Justice also requested the Company to voluntarily provide documents and information regarding the Company’s compliance with the U.S. economic sanctions against Iran. The Company is cooperating with these requests.
PART III
ITEM 10. DIRECTORS, EXECUTIVE OFFICERS AND CORPORATE GOVERNANCE
Information regarding Section 16(a) compliance, the Audit Committee, the Company’s "Code of Conduct", "Code of Ethics for Directors", and "Code of Ethics for Management Personnel, including Senior Officers", shareholder nominating procedures and background of the directors appearing under the captions “Section 16(a) Beneficial Ownership Reporting Compliance”, “Corporate Governance”, “Election of Directors”, and “Security Ownership of Management” in the Company’s Proxy Statement for the 2016 Annual Meeting of Stockholders is incorporated herein by reference.
The Registrant has adopted a Code of Conduct that applies to all employees; a Code of Ethics for Senior Financial Officers; and a Code of Ethics for Directors. A copy of each of these policies is available on the Registrant’s Internet website at www.c-a-m.com and is available in print to any shareholder free of charge upon request. The Registrant intends to satisfy the disclosure requirements under Item 10 of Form 8-K regarding an amendment to, or a waiver from, a provision of its code of ethics that applies to its principal executive officer, principal financial officer, principal accounting officer or persons performing similar functions, by posting such information on its website at the address set forth above.
The information under the heading “Executive Officers of the Registrant” in Part I, Item 1 of this Form 10-K is incorporated by reference in this section.
87
Stockholder Information
TRANSFER AGENT AND REGISTRAR
Shareholder correspondence should be mailed to:
Computershare
P.O. Box 30170
College Station, TX 77842-3170
Website: www.computershare.com/investor
Overnight correspondence should be sent to:
Computershare
211 Quality Circle, Suite 210
College Station, TX 77845
Shareholder online inquiries should be made at:
https://www-us.computershare.com/investor/Contact
ADDITIONAL STOCKHOLDER ASSISTANCE
Shareholder correspondence should be mailed to:
Computershare
P.O. Box 30170
College Station, TX 77842-3170
Website: www.computershare.com/investor
Overnight correspondence should be sent to:
Computershare
211 Quality Circle, Suite 210
College Station, TX 77845
Shareholder online inquiries should be made at:
https://www-us.computershare.com/investor/Contact
CERTIFICATIONS
The Company filed with the Securities and Exchange Commission, as Exhibit 31 to its Annual Report on Form 10-K for the 2015 fiscal year, certification of its Chief Executive Officer and Chief Financial Officer regarding the quality of the Company’s public disclosures. The Company also submitted to the New York Stock Exchange (NYSE) the previous year’s certification of its Chief Executive Officer certifying that he was not aware of any violations by the Company of NYSE corporate governance listing standards.
STOCKHOLDERS OF RECORD
The approximate number of record holders of Cameron International Corporation common stock was 804 as of January 15, 2016.
AS A PUBLIC COMPANY, CAMERON HAS MAINTAINED THE FOLLOWING DOCUMENTS ON ITS WEBSITE AT WWW.C-A-M.COM
• | The Company’s fiings with the Securities and Exchange Commission (SEC). |
• | The charters of the Committees of the Board. |
• | Other documents that may be required to be made so available by the SEC or the New York Stock Exchange. |
88
DIRECTORS
JACK B. MOORE
Chairman of the Board
Former CEO
Cameron
Houston, Texas
H. PAULETT EBERHART
Former President and Chief Executive Officer
CDI Corporation
Philadelphia, Pennsylvania
PETER J. FLUOR
Chairman of the Board and Chief Executive Officer
Texas Crude Energy, LLC
Houston, Texas
DOUGLAS L. FOSHEE
Former Chairman, President and Chief Executive Officer
El Paso Corporation
Houston, Texas
RODOLFO LANDIM
Controlling Partner and Managing Director
Mare Investimentos S.A.
Partner and Chief Executive Officer
Ouro Preto Oleo e Gas
Rio de Janeiro, Brazil
Former Leadership Positions
Petroleo Brasileiro S.A., a wholly-owned
subsidiary of Petrobras
MICHAEL E. PATRICK
Former Vice President and Chief Investment Officer
Meadows Foundation, Inc.
Dallas, Texas
TIMOTHY J. PROBERT
Former President of Strategy and Corporate Development
Halliburton Company
Houston, Texas
JON ERIK REINHARDSEN
President and Chief Executive Officer
Petroleum Geo-Services ASA
Lysaker, Norway
R. SCOTT ROWE
President and Chief Executive Officer
Cameron
Houston, Texas
BRENT J. SMOLIK
Chairman of the Board, President and Chief Executive Officer
EP Energy Corporation
Houston, Texas
BRUCE W. WILKINSON
Former Chairman, President and Chief Executive Officer
McDermott International, Inc.
Houston, Texas
OFFICERS
R. SCOTT ROWE
President and Chief Executive Officer
WILLIAM C. LEMMER
Senior Vice President and General Counsel
CHARLES M. SLEDGE
Senior Vice President and Chief Financial Officer
DENNIS S. BALDWIN
Vice President, Controller and Chief Accounting Officer
MIKE GARDING
Chief Executive Officer, OneSubsea
STEVEN P. GEIGER
Vice President and Chief Administrative Officer
GRACE B. HOLMES
Vice President, Corporate Secretary and Chief Governance Officer
H. KEITH JENNINGS
Vice President and Treasurer
HUNTER W. JONES
Vice President and President, Drilling Systems
W. SCOTT LAMB
Vice President, Investor Relations
DOUGLAS E. MEIKLE
Vice President and President, Valves and Measurement
STEFAN RADWANSKI
Vice President and President, Surface Systems
STEVEN W. ROLL
Vice President and President, Process Systems
89
ITEM 11. EXECUTIVE COMPENSATION
The information concerning "Executive Compensation" required by Item 11 will be included in our Proxy Statement to be filed relating to our 2016 Annual Meeting of Stockholders and is incorporated herein by reference.
ITEM 12. SECURITY OWNERSHIP OF CERTAIN BENEFICIAL OWNERS AND MANAGEMENT AND RELATED STOCKHOLDER MATTERS
The information concerning "Security Ownership of Certain Beneficial Owners" and "Security Ownership of Management" required by Item 12 will be included in our Proxy Statement to be filed relating to the 2016 Annual Meeting of Stockholders and is incorporated herein by reference.
ITEM 13. CERTAIN RELATIONSHIPS AND RELATED TRANSACTIONS, AND DIRECTOR INDEPENDENCE
The information concerning the Company's "Policy on Related Person Transactions" and "Director Independence" required by Item 13 will be included in our Proxy Statement to be filed relating to the 2016 Annual Meeting of Stockholders and is incorporated herein by reference.
ITEM 14. PRINCIPAL ACCOUNTING FEES AND SERVICES
The information concerning "Principal Accounting Firm Fees" required by Item 14 will be included in our Proxy Statement to be filed relating to our 2016 Annual Meeting of Stockholders and is incorporated herein by reference.
PART IV
ITEM 15. EXHIBITS, FINANCIAL STATEMENT SCHEDULES
(a) | The following documents are filed as part of this Report: |
(1) | Financial statements: |
All financial statements of the Registrant as set forth under Part II, Item 8 of this Annual Report on Form 10-K
(2) | Financial statement schedules: |
90
REPORT OF INDEPENDENT REGISTERED PUBLIC ACCOUNTING FIRM
The Board of Directors and Stockholders of
Cameron International Corporation
We have audited the consolidated financial statements of Cameron International Corporation as of December 31, 2015 and 2014, and for each of the three years in the period ended December 31, 2015, and have issued our report thereon dated January 29, 2016 (included in Part II, Item 8 of this Form 10-K). Our audits also included the financial statement schedule included in Item 15(a)(2) of this Form 10-K. This schedule is the responsibility of the Company’s management. Our responsibility is to express an opinion based on our audits.
In our opinion, the financial statement schedule referred to above, when considered in relation to the basic consolidated financial statements taken as a whole, presents fairly, in all material respects, the information set forth therein.
/s/ Ernst & Young LLP | |
Houston, Texas
January 29, 2016
91
Schedule II - Valuation and Qualifying Accounts
(dollars in millions)
Additions | |||||||||||||||||||||||
FOR THE YEAR ENDED | Balance at beginning of period | Charged to costs and expenses | Charged to other accounts | Deductions (a) | Translation | Balance at end of period | |||||||||||||||||
DECEMBER 31, 2015: | |||||||||||||||||||||||
Allowance for doubtful accounts | $ | 32 | $ | 30 | $ | 1 | $ | (3 | ) | $ | (3 | ) | $ | 57 | |||||||||
Allowance for obsolete and excess inventory | $ | 145 | $ | 22 | $ | 2 | $ | (38 | ) | $ | (5 | ) | $ | 126 | |||||||||
DECEMBER 31, 2014: | |||||||||||||||||||||||
Allowance for doubtful accounts | $ | 21 | $ | 10 | $ | 8 | $ | (5 | ) | $ | (2 | ) | $ | 32 | |||||||||
Allowance for obsolete and excess inventory | $ | 109 | $ | 65 | $ | (3 | ) | $ | (21 | ) | $ | (5 | ) | $ | 145 | ||||||||
DECEMBER 31, 2013: | |||||||||||||||||||||||
Allowance for doubtful accounts | $ | 8 | $ | 14 | $ | — | $ | (1 | ) | $ | — | $ | 21 | ||||||||||
Allowance for obsolete and excess inventory | $ | 89 | $ | 28 | $ | 4 | $ | (12 | ) | $ | — | $ | 109 | ||||||||||
(a) | Discontinued operations, write-offs of uncollectible receivables, deductions for collections of previously reserved receivables and write-offs of obsolete inventory. |
All other financial schedules are not required under the related instructions, or are inapplicable and therefore have been omitted.
92
EXHIBIT INDEX
Exhibit Number | Exhibit Index Description |
2.1 | Amended and Restated Master Formation Agreement, dated as of June 30, 2013, by and among Cameron International Corporation, Schlumberger Limited and the other parties listed on the signature pages thereto filed as Exhibit 2.1 to the Current Report on Form 8-K filed on July 1, 2013, and incorporated herein by reference. |
2.2 | Shareholder’s Agreement, dated as of June 30, 2013, by and among Cameron International Corporation, Schlumberger Limited and the other parties listed therein filed as Exhibit 2.2 to the Current Report on Form 8-K filed on July 1, 2013, and incorporated herein by reference. |
2.3 | Agreement and Plan of Merger among Schlumberger Holding Corporation, Rain Merger Sub LLC, Schlumberger N.V. and Cameron International Corporation dated as of August 25, 2015, filed as Exhibit 2.1 to the Current Report on Form 8-K filed on August 25, 2015, and incorporated herein by reference. |
3.1 | Restated Certificate of Incorporation of Cameron International Corporation, dated May 11, 2012, filed as Appendix C to the Company’s Supplement to the 2012 Proxy Statement, and incorporated herein by reference. |
3.2 | Bylaws of Cameron International Corporation filed as Exhibit 3.1 to the Current Report on Form 8-K filed on April 18, 2012, and incorporated herein by reference. |
3.3 | Amendment to the Bylaws of Cameron International Corporation filed as Exhibit 3.1 to the Current Report on Form 8-K filed on October 18, 2012, and incorporated herein by reference. |
3.4 | Amendment to the Bylaws of Cameron International Corporation filed as Exhibit 3.1 to the Current Report on Form 8-K filed on August 26, 2015, and incorporated herein by reference. |
4.1 | Form of Indenture for senior debt securities filed as Exhibit 4.1 to the Registration Statement on Form S-3 filed with the Securities and Exchange Commission on June 23, 2008 (File No. 333-151838) and incorporated herein by reference. |
4.2 | Indenture dated as of June 26, 2008, between Cameron International Corporation and Wells Fargo Bank, National Association for senior debt securities filed as Exhibit 4.1 to the Current Report on Form 8-K filed with the Securities and Exchange Commission on June 26, 2008, and incorporated herein by reference. |
4.3 | First Supplemental Indenture dated as of June 26, 2008, between Cameron International Corporation and Wells Fargo Bank, National Association filed as Exhibit 4.2 to the Current Report on Form 8-K filed with the Securities and Exchange Commission of June 26, 2008, and incorporated herein by reference. |
4.4 | Second Supplemental Indenture dated as of June 26, 2008, between Cameron International Corporation and Wells Fargo Bank, National Association filed as Exhibit 4.3 to the Current Report on Form 8-K filed with the Securities and Exchange Commission on June 26, 2008, and incorporated herein by reference. |
4.5 | Third Supplemental Indenture dated as of June 2, 2011, between Cameron International Corporation and Wells Fargo Bank, National Association filed as Exhibit 4.2 to the Current Report on Form 8-K filed with the Securities and Exchange Commission on June 2, 2011, and incorporated herein by reference. |
4.6 | Fourth Supplemental Indenture dated as of June 2, 2011, between Cameron International Corporation and Wells Fargo Bank, National Association filed as Exhibit 4.3 to the Current Report on Form 8-K filed with the Securities and Exchange Commission on June 2, 2011, and incorporated herein by reference. |
4.7 | Indenture dated as of May 17, 2012, between Cameron International Corporation and Union Bank, N.A for debt securities filed as Exhibit 4.1 to the Current Report on Form 8-K/A filed with the Securities and Exchange Commission on May 22, 2012, and incorporated herein by reference. |
93
Exhibit Number | Exhibit Index Description |
4.8 | Second Supplemental Indenture dated as of May 17, 2012, between Cameron International Corporation and Union Bank, N.A. filed as Exhibit 4.3 to the Current Report on Form 8-K filed with the Securities and Exchange Commission on May 17, 2012, and incorporated herein by reference. |
4.9 | Third Supplemental Indenture dated as of December 16, 2013, between Cameron International Corporation and Union Bank, N.A. filed as Exhibit 4.2 to the Current Report on Form 8-K filed with the Securities and Exchange Commission on December 16, 2013, and incorporated herein by reference. |
4.10 | Fourth Supplemental Indenture dated as of December 16, 2013, between Cameron International Corporation and Union Bank, N.A. filed as Exhibit 4.3 to the Current Report on Form 8-K filed with the Securities and Exchange Commission on December 16, 2013, and incorporated herein by reference. |
4.11 | Fifth Supplemental Indenture dated as of December 16, 2013, between Cameron International Corporation and Union Bank, N.A. filed as Exhibit 4.4 to the Current Report on Form 8-K filed with the Securities and Exchange Commission on December 16, 2013, and incorporated herein by reference. |
4.12 | Sixth Supplemental Indenture dated as of June 20, 2014, between Cameron International Corporation and Union Bank, N.A. filed as Exhibit 4.2 to the Current Report on Form 8-K filed with the Securities and Exchange Commission on June 20, 2014, and incorporated herein by reference. |
4.13 | Seventh Supplemental Indenture dated as of June 20, 2014, between Cameron International Corporation and Union Bank, N.A. filed as Exhibit 4.3 to the Current Report on Form 8-K filed with the Securities and Exchange Commission on June 20, 2014, and incorporated herein by reference. |
10.1 | Cameron International Corporation Retirement Savings Plan, as Amended and Restated, effective January 1, 2014, filed as Exhibit 10.1 to the Annual Report on Form 10-K for 2014 of the Company, and incorporated herein by reference. |
10.2 | Merger of the NATCO Group Profit Sharing And Savings Plan with and into the Cameron International Corporation Retirement Savings Plan, effective March 17, 2010, filed as Exhibit 10.49 to the Annual Report on Form 10-K for 2010 of the Company, and incorporated herein by reference. |
10.3 | OneSubsea Retirement Savings Plan, as Amended and Restated effective January 1, 2015, filed as Exhibit 10.3 to the Annual Report on Form 10-K for 2014 of the Company, and incorporated herein by reference. |
10.4 | Cameron International Corporation Deferred Compensation Plan for Non-Employee Directors, filed as Exhibit 10.41 to the Annual Report on Form 10-K for 2005 of the Company, and incorporated herein by reference. |
10.5 | The Amended and Restated Cameron International Corporation Nonqualified Deferred Compensation Plan, effective January 1, 2013, filed as Exhibit 10.18 to the Annual Report on Form 10-K for 2012 of the Company, and incorporated herein by reference. |
10.6 | OneSubsea LLC Nonqualified Deferred Compensation Plan, effective April 1, 2013, on Registration Statement Form S-8 with the Securities and Exchange Commission on June 25, 2013 (File No. 333-189589), and incorporated herein by reference. |
10.7 | The 2011 Management Incentive Compensation Plan, as Amended and Restated October 16, 2014, of the Company filed as Exhibit 10.1 to the Annual Report on Form 10-K for 2014 of the Company, and incorporated herein by reference. |
10.8 | Cameron International Corporation Equity Incentive Plan, effective January 1, 2013, as amended and restated, filed as an Appendix to the Company’s 2013 Proxy Statement, and incorporated herein by reference. |
94
Exhibit Number | Exhibit Index Description |
10.9 | Change in Control Policy of the Company, approved February 19, 1996, filed as Exhibit 10.18 to the Annual Report on Form 10-K for 1996 of the Company, and incorporated herein by reference. |
10.10 | Form of Change of Control Agreement, effective December 18, 2008, by and between the Company and John Bartos, Hal J. Goldie, William C. Lemmer, Joseph H. Mongrain, Jack B. Moore and Charles M. Sledge filed as Exhibit 10.17 to the Annual Report on Form 10-K for 2008 of the Company, and incorporated herein by reference. |
10.11 | Form of Change in Control Agreement, effective June 16, 2009, by and between the Company and H. Keith Jennings, filed as Exhibit 10.52 to the Annual Report on Form 10-K for 2010 of the Company, and incorporated herein by reference. |
10.12 | Form of Change in Control Agreement, effective November 16, 2013, by and between the Company and Steven P. Geiger, Gary M. Halverson, Owen Serjeant, Brent Baumann and Mark Cordell filed as Exhibit 10.11 to the Annual Report on Form 10-K for 2013 of the Company, and incorporated herein by reference. |
10.13 | Form of Change in Control Agreement, effective July 1, 2014, by and between the Company and Dennis S. Baldwin filed as Exhibit 10.12 to the Annual Report on Form 10-K for 2014 of the Company, and incorporated herein by reference. |
10.14 | Form of Change in Control Agreement, effective August 7, 2014, by and between the Company and Steven W. Roll filed as Exhibit 10.13 to the Annual Report on Form 10-K for 2014 of the Company, and incorporated herein by reference. |
10.15 | Form of Change in Control Agreement, effective December 9, 2014, by and between the Company and William S. Lamb filed as Exhibit 10.14 to the Annual Report on Form 10-K for 2014 of the Company, and incorporated herein by reference. |
Form of Change in Control Agreement, effective March 23, 2015, by and between the Company and Justin Rounce. | |
Form of Change in Control Agreement, effective May 8, 2015, by and between the Company and Jennifer Hartsock. | |
Form of Change in Control Agreement, effective May 8, 2015, by and between the Company and Hunter W. Jones, Douglas E. Meikle and Stefan Radwanski.. | |
Form of Change in Control Agreement, effective October 5, 2015, by and between the Company and R. Scott Rowe. | |
Form of Executive Severance Program of the Company, effective October 13, 2015. | |
10.21 | Form of Indemnification Agreement, effective February 20, 2003, by and between the Company and Michael E. Patrick and Bruce W. Wilkinson, filed as Exhibit 10.32 to the Annual Report on Form 10-K/A for 2002 of the Company, and incorporated herein by reference. |
10.22 | Form of Indemnification Agreement, effective February 7, 2005, by and between the Company and Peter J. Fluor, filed as Exhibit 10.23 to the Annual Report on Form 10-K for 2008 of the Company, and incorporated herein by reference. |
10.23 | Form of Indemnification Agreement, effective July 1, 2008, by and between the Company and Douglas L. Foshee, filed as Exhibit 10.24 to the Annual Report on Form 10-K for 2008 of the Company, and incorporated herein by reference. |
95
Exhibit Number | Exhibit Index Description |
10.24 | Form of Indemnification Agreement, effective June 12, 2009, by and between the Company and Jon Erik Reinhardsen, filed as Exhibit 10.28 to the Annual Report on Form 10-K for 2009 of the Company, and incorporated herein by reference. |
10.25 | Form of Indemnification Agreement, effective August 13, 2007, by and between the Company and William C. Lemmer and Joseph H. Mongrain, filed as Exhibit 10.50 to the Annual Report on Form 10-K for 2010 of the Company, and incorporated herein by reference. |
10.26 | Form of Indemnification Agreement, effective January 1, 2011, by and between the Company and John C. Bartos, Mark L. Carter, Gary Devlin, Brad Eastman, Kevin Fleming, Hal J. Goldie, Grace B. Holmes, H. Keith Jennings, Jack B. Moore, Owen Serjeant and Charles M. Sledge, filed as Exhibit 10.51 to the Annual Report on Form 10-K for 2010 of the Company, and incorporated herein by reference. |
10.27 | Form of Indemnification Agreement, effective October 18, 2011, by and between the Company and Rodolfo Landim, filed as Exhibit 10.47 to the Annual Report on Form 10-K for 2011 of the Company, and incorporated herein by reference. |
10.28 | Form of Indemnification Agreement, by and between the Company and James T. Hackett effective August 1, 2012, filed as Exhibit 10.36 to the Annual Report on Form 10-K for 2012 of the Company, and incorporated herein by reference. |
10.29 | Form of Indemnification Agreement, effective December 9, 2013, by and between the Company and H. Paulett Eberhart, filed as Exhibit 10.22 to the Annual Report on Form 10-K for 2013 of the Company, and incorporated herein by reference. |
Form of Indemnification Agreement, effective February 25, 2015, by and between the Company and Brent J. Smolik. | |
Form of Indemnification Agreement, effective May 8, 2015, by and between the Company and Timothy J. Probert. | |
10.32 | Credit Agreement, dated as of April 11, 2014, among the Company and certain of its subsidiaries and the banks named therein and Citibank, N.A., filed as Exhibit 10.1 to the Current Report on Form 8-K dated April 11, 2014, of the Company, and incorporated herein by reference. |
10.33 | Amended and Restated Credit Agreement dated as of May 14, 2015, among the Company and certain of its subsidiaries and the banks named therein and JPMorgan Chase Bank, N.A., as agent, filed as Exhibit 10.1 to the Current Report on Form 8-K dated May 14, 2015, of the Company, and incorporated herein by reference. |
10.34 | Form of Stock Option Agreement for stock option grants dated on or after April 1, 2009, filed as Exhibit 10.30 to the Annual Report on Form 10-K for 2009 of the Company, and incorporated herein by reference. |
10.35 | Form of Stock Option Agreement for stock option grants dated on or after October 20, 2010, filed as Exhibit 10.39 to the Annual Report on Form 10-K for 2010 of the Company, and incorporated herein by reference. |
10.36 | Form of Amendment dated October 20, 2010, to Stock Option Agreement, filed as Exhibit 10.49 to the Annual Report on Form 10-K for 2011 of the Company, and incorporated herein by reference. |
96
Exhibit Number | Exhibit Index Description |
10.37 | Form of Stock Option Agreement for stock option grants dated on or after October 18, 2012, filed as Exhibit 10.46 to the Annual Report on Form 10-K for 2012 of the Company, and incorporated herein by reference. |
10.38 | Form of Stock Option Agreement for stock options granted on or after October 17, 2013, filed as Exhibit 10.45 to the Annual Report on Form 10-K for 2013 of the Company, and incorporated herein by reference. |
10.39 | Form of Stock Option Agreement for stock option grants dated on or after October 16, 2014 filed as Exhibit 10.34 to the Annual Report on Form 10-K for 2014 of the Company, and incorporated herein by reference. |
Form of Incentive Stock Option Agreement for incentive stock option grants awarded to the Chief Executive Officer dated on or after October 14, 2015. | |
Form of Non-Qualified Stock Option Agreement for non-qualified stock option grants awarded to the Chief Executive Officer dated on or after October 14, 2015. | |
Form of Incentive Stock Option Agreement for incentive stock option grants awarded to Dennis S. Baldwin, J. Daniel Chapman, Steven P. Geiger, Grace B. Holmes, H. Keith Jennings, William C. Lemmer and Charles M. Sledge dated on or after October 14, 2015. | |
Form of Non-Qualified Stock Option Agreement for non-qualified stock option grants awarded to Dennis S. Baldwin, J. Daniel Chapman, Steven P. Geiger, Grace B. Holmes, H. Keith Jennings, William C. Lemmer and Charles M. Sledge dated on or after October 14, 2015. | |
Form of Incentive Stock Option Agreement for incentive stock option grants awarded to Jennifer Harstock and Justin J. Rounce dated on or after October 14, 2015. | |
Form of Non-Qualified Stock Option Agreement for non-qualified stock option grants awarded to Jennifer Hartsock and Justin J. Rounce Employees dated on or after October 14, 2015. | |
Form of Incentive Stock Option Agreement for incentive stock option grants awarded on or after October 14, 2015. | |
Form of Non-Qualified Stock Option Agreement for non-qualified stock option grants awarded on or after October 14, 2015. | |
10.48 | Form of Grant Agreement for restricted stock units granted on or after January 1, 2013, filed as Exhibit 10.51 to the Annual Report on Form 10-K for 2012 of the Company, and incorporated herein by reference. |
10.49 | Form of Grant Agreement for restricted stock units granted on or after October 17, 2013, filed as Exhibit 10.46 to the Annual Report on Form 10-K for 2013 of the Company, and incorporated herein by reference. |
10.50 | Form of Grant Agreement for restricted stock units granted on or after October 16, 2014 filed as Exhibit 10.38 to the Annual Report on Form 10-K for 2014 of the Company, and incorporated herein by reference. |
Form of Grant Agreement for restricted stock units granted to the Chief Executive Officer on or after October 14, 2015. | |
Form of Grant Agreement for restricted stock units granted to Dennis S. Baldwin, J. Daniel Chapman, Steven P. Geiger, Grace B. Holmes, H. Keith Jennings, William C. Lemmer and Charles M. Sledge on or after October 14, 2015. | |
97
Exhibit Number | Exhibit Index Description |
Form of Grant Agreement for restricted stock units granted to Jennifer Hartsock and Justin J. Rounce on or after October 14, 2015. | |
Form of Grant Agreement for restricted stock units granted on or after October 14, 2015. | |
10.55 | Form of Grant Agreement for restricted stock units for Executive Officers granted on or after October 17, 2013, filed as Exhibit 10.47 to the Annual Report on Form 10-K for 2013 of the Company, and incorporated herein by reference. |
10.56 | Form of Grant Agreement for restricted stock units for Executive Officers granted on or after October 16, 2014 filed as Exhibit 10.40 to the Annual Report on Form 10-K for 2014 of the Company, and incorporated herein by reference. |
10.57 | Form of Grant Agreement for performance-based restricted stock units granted on or after January 1, 2012, filed as Exhibit 10.54 to the Annual Report on Form 10-K for 2012 of the Company, and incorporated herein by reference. |
10.58 | Form of Grant Agreement for performance-based restricted stock units granted on or after January 1, 2013, filed as Exhibit 10.55 to the Annual Report on Form 10-K for 2012 of the Company, and incorporated herein by reference. |
10.59 | Form of Grant Agreement for performance-based restricted stock unit awards grants on or after January 1, 2014, filed as Exhibit 10.44 to the Annual Report on Form 10-K for 2013 of the Company, and incorporated herein by reference. |
10.60 | Form of Grant Agreement for performance-based restricted stock unit awards grants on or after January 1, 2015, filed as Exhibit 10.44 to the Annual Report on Form 10-K for 2014 of the Company, and incorporated by reference. |
10.61 | Form of Deferred Stock Unit Agreement for deferred stock units for non-employee directors granted on or after December 9, 2013, filed as Exhibit 10.48 to the Annual Report on Form 10-K for 2013 of the Company, and incorporated herein by reference. |
10.62 | Form of Deferred Stock Unit Agreement for deferred stock units for non-employee directors granted on or after May 17, 2014, filed as Exhibit 10.46 to the Annual Report on Form 10-K for 2014 of the Company, and incorporated herein by reference. |
Form of Deferred Stock Unit Agreement for deferred stock units for non-employee directors granted on or after May 8, 2015. | |
Form of Letter Agreement to amend stock option and restricted stock unit agreements from 2010 through 2015. | |
10.65 | NATCO Group, Inc. 1998 Employee Stock Option Plan, filed as Exhibit 10.3 to NATCO’s Proxy Statement on Form S-1 (No. 333-48851), and incorporated herein by reference. |
10.66 | NATCO Group, Inc. 2004 Stock Incentive Plan, filed as Appendix B to NATCO’s Proxy Statement dated May 27, 2004, and incorporated herein by reference. |
14.1 | Code of Ethics for Management Personnel, including Senior Financial Officers, filed as Exhibit 14.2 to the Annual Report on Form 10-K for 2004 of the Company, and incorporated herein by reference. |
98
Exhibit Number | Exhibit Index Description |
14.2 | Cameron Code of Conduct, effective April, 2013, filed as Exhibit 14.2 to the Annual Report on Form 10-K for 2014 of the Company, and incorporated herein by reference.. |
14.3 | Code of Ethics for Directors effective August 8, 2014, filed as Exhibit 14.3 to the Annual Report on Form 10-K for 2014 of the Company, and incorporated herein by reference.. |
21.1* | Subsidiaries of registrant. |
23.1* | Consent of Independent Registered Public Accounting Firm. |
31.1* | Certification. |
31.2* | Certification. |
32.1* | Certification of Chief Executive Officer and Chief Financial Officer Pursuant to Section 906 of the Sarbanes-Oxley Act of 2002. |
101.INS* | XBRL Instance Document |
101.SCH* | XBRL Taxonomy Extension Schema Document |
101.CAL* | XBRL Taxonomy Extension Calculation Linkbase Document |
101.DEF* | XBRL Taxonomy Extension Definition Linkbase Document |
101.LAB* | XBRL Taxonomy Extension Label Linkbase Document |
101.PRE* | XBRL Taxonomy Extension Presentation Linkbase Document |
*Filed herewith
99
SIGNATURES
Pursuant to the requirements of Section 13 or 15(d) of the Securities Exchange Act of 1934, the Registrant has duly caused this report to be signed on its behalf by the undersigned, thereunto duly authorized.
CAMERON INTERNATIONAL CORPORATION | ||
Registrant | ||
By: | /s/ Dennis S. Baldwin | |
(Dennis S. Baldwin) | ||
Vice President, Controller and Chief Accounting Officer | ||
(principal accounting officer) | ||
Date: January 29, 2016 | ||
Pursuant to the requirements of the Securities Exchange Act of 1934, this report has been signed on this 29th day of January, 2016, by the following persons on behalf of the Registrant and in the capacities indicated.
100
Signature | Title | |
/s/ H. Paulett Eberhart | ||
(H. Paulett Eberhart) | Director | |
/s/ Peter J. Fluor | ||
(Peter J. Fluor) | Director | |
/s/ Douglas L. Foshee | ||
(Douglas L. Foshee) | Director | |
/s/ Rodolfo Landim | ||
(Rodolfo Landim) | Director | |
/s/ Jack B. Moore | ||
(Jack B. Moore) | Chairman of the Board | |
/s/ Michael E. Patrick | ||
(Michael E. Patrick) | Director | |
/s/ Timothy J. Probert | ||
Timothy J. Probert | Director | |
/s/ Jon Erik Reinhardsen | ||
(Jon Erik Reinhardsen) | Director | |
/s/ R. Scott Rowe | ||
(R. Scott Rowe) | President and Chief Executive Officer | |
(principal executive officer) | ||
/s/ Brent J. Smolik | ||
(Brent J. Smolik) | Director | |
/s/ Bruce W. Wilkinson | ||
(Bruce W. Wilkinson) | Director | |
/s/ Charles M. Sledge | Senior Vice President and Chief Financial Officer | |
(Charles M. Sledge) | (principal financial officer) | |
101