Attached files
| file | filename |
|---|---|
| 8-K - 8-K - WESTERN DIGITAL CORP | d114717d8k.htm |
| EX-99.1 - EX-99.1 - WESTERN DIGITAL CORP | d114717dex991.htm |
Exhibit 99.2
| Amounts in millions, except |
Q3 FY12 |
Q4 FY12 |
Q1 FY13 |
Q2 FY13 |
Q3 FY13 |
Q4 FY13 |
Q1 FY14 |
Q2 FY14 |
Q3 FY14 |
Q4 FY14 |
Q1 FY15 |
Q2 FY15 |
Q3 FY15 |
Q4 FY15 |
Q1 FY16 |
Q2 FY169 |
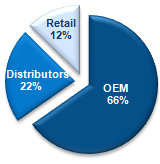
Revenue by Channel R4Q Ending Q2 FY16
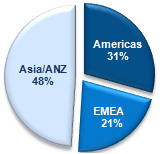
Revenue by Geography R4Q Ending Q2 FY16
| |||||||||||||||||||||||||||||||||||||||||||||||||
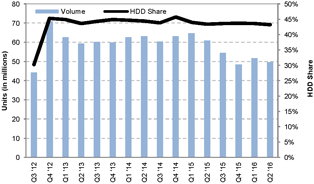
| TAM |
146.4 | 156.7 | 139.1 | 135.8 | 135.9 | 133.3 | 140.2 | 142.2 | 138.1 | 138.0 | 147.3 | 140.8 | 125.0 | 111.0 | 118.7 | 115.1 | ||||||||||||||||||||||||||||||||||||||||||||||||||
| HDD Share |
30.2 | % | 45.3 | % | 44.9 | % | 43.6 | % | 44.3 | % | 44.9 | % | 44.7 | % | 44.4 | % | 43.8 | % | 45.7 | % | 44.0 | % | 43.4 | % | 43.6 | % | 43.7 | % | 43.6 | % | 43.2 | % | ||||||||||||||||||||||||||||||||||
| Units (HDD)2 |
44.2 | 71.0 | 62.5 | 59.2 | 60.2 | 59.9 | 62.6 | 63.1 | 60.4 | 63.1 | 64.7 | 61.0 | 54.5 | 48.5 | 51.7 | 49.7 | ||||||||||||||||||||||||||||||||||||||||||||||||||
| ASP (HDD) |
$ | 68 | $ | 65 | $ | 62 | $ | 62 | $ | 61 | $ | 60 | $ | 58 | $ | 60 | $ | 58 | $ | 56 | $ | 58 | $ | 60 | $ | 61 | $ | 60 | $ | 60 | $ | 61 | ||||||||||||||||||||||||||||||||||
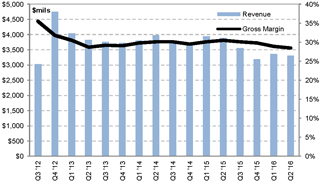
| Revenue |
$ | 3,035 | $ | 4,754 | $ | 4,035 | $ | 3,824 | $ | 3,764 | $ | 3,728 | $ | 3,804 | $ | 3,972 | $ | 3,703 | $ | 3,651 | $ | 3,943 | $ | 3,888 | $ | 3,550 | $ | 3,191 | $ | 3,360 | $ | 3,317 | ||||||||||||||||||||||||||||||||||
| Gross Profit |
$ | 977 | $ | 1,472 | $ | 1,193 | $ | 1,059 | $ | 1,061 | $ | 1,050 | $ | 1,099 | $ | 1,156 | $ | 1,076 | $ | 1,029 | $ | 1,149 | $ | 1,110 | $ | 1,032 | $ | 930 | $ | 955 | $ | 906 | ||||||||||||||||||||||||||||||||||
| Gross Margin |
32.2 | % | 31.0 | % | 29.6 | % | 27.7 | % | 28.2 | % | 28.2 | % | 28.9 | % | 29.1 | % | 29.1 | % | 28.2 | % | 29.1 | % | 28.5 | % | 29.1 | % | 29.1 | % | 28.4 | % | 27.3 | % | ||||||||||||||||||||||||||||||||||
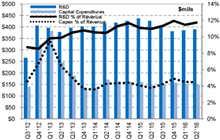
| R&D |
$ | 265 | $ | 406 | $ | 396 | $ | 378 | $ | 396 | $ | 402 | $ | 401 | $ | 416 | $ | 418 | $ | 426 | $ | 437 | $ | 426 | $ | 402 | $ | 381 | $ | 385 | $ | 389 | ||||||||||||||||||||||||||||||||||
| SG&A |
122 | 178 | 179 | 162 | 185 | 180 | 132 | 226 | 201 | 202 | 220 | 164 | 199 | 190 | 192 | 207 | ||||||||||||||||||||||||||||||||||||||||||||||||||
| Other |
48 | 80 | 26 | 41 | 63 | 689 | 24 | 36 | 38 | 49 | 23 | 54 | 10 | 104 | 56 | 59 | ||||||||||||||||||||||||||||||||||||||||||||||||||
|
|
|
|
|
|
|
|
|
|
|
|
|
|
|
|
|
|
|
|
|
|
|
|
|
|
|
|
|
|
|
|
|
|||||||||||||||||||||||||||||||||||
| Total Operating Expenses |
$ | 435 | $ | 664 | $ | 601 | $ | 581 | $ | 644 | $ | 1,271 | $ | 557 | $ | 678 | $ | 657 | $ | 677 | $ | 680 | $ | 644 | $ | 611 | $ | 675 | $ | 633 | $ | 655 | ||||||||||||||||||||||||||||||||||
| Operating Income (Loss) |
$ | 542 | $ | 808 | $ | 592 | $ | 478 | $ | 417 | $ | (221 | ) | $ | 542 | $ | 478 | $ | 419 | $ | 352 | $ | 469 | $ | 466 | $ | 421 | $ | 255 | $ | 322 | $ | 251 | |||||||||||||||||||||||||||||||||
| Net Income (Loss) |
$ | 483 | $ | 745 | $ | 519 | $ | 335 | $ | 391 | $ | (265 | ) | $ | 495 | $ | 430 | $ | 375 | $ | 317 | $ | 423 | $ | 438 | $ | 384 | $ | 220 | $ | 283 | $ | 251 | |||||||||||||||||||||||||||||||||
| EPS |
$ | 1.96 | $ | 2.87 | $ | 2.06 | $ | 1.36 | $ | 1.60 | $ | (1.12 | ) | $ | 2.05 | $ | 1.77 | $ | 1.55 | $ | 1.32 | $ | 1.76 | $ | 1.84 | $ | 1.63 | $ | 0.94 | $ | 1.21 | $ | 1.07 | |||||||||||||||||||||||||||||||||
| Diluted Shares Outstanding |
246 | 260 | 252 | 246 | 245 | 236 | 242 | 243 | 242 | 241 | 240 | 238 | 236 | 235 | 234 | 234 | ||||||||||||||||||||||||||||||||||||||||||||||||||
| Non-GAAP Results |
||||||||||||||||||||||||||||||||||||||||||||||||||||||||||||||||||
| Gross Profit10 |
$ | 1,077 | $ | 1,511 | $ | 1,231 | $ | 1,097 | $ | 1,099 | $ | 1,085 | $ | 1,135 | $ | 1,196 | $ | 1,115 | $ | 1,078 | $ | 1,188 | $ | 1,187 | $ | 1,069 | $ | 951 | $ | 972 | $ | 944 | ||||||||||||||||||||||||||||||||||
| Gross Margin10 |
35.5 | % | 31.8 | % | 30.5 | % | 28.7 | % | 29.2 | % | 29.1 | % | 29.8 | % | 30.1 | % | 30.1 | % | 29.5 | % | 30.1 | % | 30.5 | % | 30.1 | % | 29.8 | % | 28.9 | % | 28.5 | % | ||||||||||||||||||||||||||||||||||
| Operating Expenses 10 |
$ | 383 | $ | 572 | $ | 564 | $ | 529 | $ | 559 | $ | 564 | $ | 574 | $ | 616 | $ | 605 | $ | 598 | $ | 638 | $ | 620 | $ | 591 | $ | 560 | $ | 567 | $ | 542 | ||||||||||||||||||||||||||||||||||
| Net Income |
$ | 619 | $ | 872 | $ | 594 | $ | 513 | $ | 514 | $ | 477 | $ | 514 | $ | 532 | $ | 470 | $ | 445 | $ | 504 | $ | 539 | $ | 441 | $ | 356 | $ | 366 | $ | 374 | ||||||||||||||||||||||||||||||||||
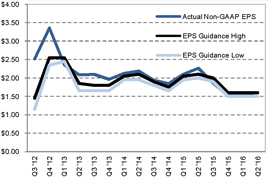
| EPS6 |
$ | 2.52 | $ | 3.35 | $ | 2.36 | $ | 2.09 | $ | 2.10 | $ | 1.96 | $ | 2.12 | $ | 2.19 | $ | 1.94 | $ | 1.85 | $ | 2.10 | $ | 2.26 | $ | 1.87 | $ | 1.51 | $ | 1.56 | $ | 1.60 | ||||||||||||||||||||||||||||||||||
| Revenue By Channel |
||||||||||||||||||||||||||||||||||||||||||||||||||||||||||||||||||
| OEM |
64 | % | 69 | % | 63 | % | 61 | % | 60 | % | 66 | % | 64 | % | 62 | % | 62 | % | 65 | % | 63 | % | 63 | % | 64 | % | 67 | % | 67 | % | 65 | % | ||||||||||||||||||||||||||||||||||
| Distributors |
28 | % | 21 | % | 24 | % | 24 | % | 26 | % | 23 | % | 24 | % | 24 | % | 25 | % | 23 | % | 24 | % | 23 | % | 23 | % | 21 | % | 21 | % | 21 | % | ||||||||||||||||||||||||||||||||||
| Retail |
8 | % | 10 | % | 13 | % | 15 | % | 14 | % | 11 | % | 12 | % | 14 | % | 13 | % | 12 | % | 13 | % | 14 | % | 13 | % | 12 | % | 12 | % | 14 | % | ||||||||||||||||||||||||||||||||||
| Revenue by Geography |
||||||||||||||||||||||||||||||||||||||||||||||||||||||||||||||||||
| Americas |
21 | % | 27 | % | 23 | % | 27 | % | 27 | % | 28 | % | 26 | % | 25 | % | 25 | % | 24 | % | 27 | % | 27 | % | 29 | % | 32 | % | 30 | % | 31 | % | ||||||||||||||||||||||||||||||||||
| EMEA |
18 | % | 18 | % | 18 | % | 23 | % | 22 | % | 19 | % | 20 | % | 23 | % | 21 | % | 20 | % | 21 | % | 24 | % | 21 | % | 21 | % | 21 | % | 23 | % | ||||||||||||||||||||||||||||||||||
| Asia/ANZ |
61 | % | 55 | % | 59 | % | 50 | % | 51 | % | 53 | % | 54 | % | 52 | % | 54 | % | 56 | % | 52 | % | 49 | % | 50 | % | 47 | % | 49 | % | 46 | % | ||||||||||||||||||||||||||||||||||
| Top 10 Customers Revenue |
53 | % | 53 | % | 44 | % | 45 | % | 45 | % | 48 | % | 48 | % | 42 | % | 44 | % | 45 | % | 45 | % | 44 | % | 43 | % | 44 | % | 48 | % | 44 | % | ||||||||||||||||||||||||||||||||||
| Enterprise SSD Revenue |
$ | 11 | $ | 54 | $ | 70 | $ | 89 | $ | 92 | $ | 104 | $ | 106 | $ | 155 | $ | 134 | $ | 113 | $ | 156 | $ | 187 | $ | 224 | $ | 244 | $ | 233 | $ | 270 | ||||||||||||||||||||||||||||||||||
| Non-PC Revenue12 |
31 | % | 45 | % | 46 | % | 51 | % | 51 | % | 52 | % | 53 | % | 54 | % | 53 | % | 54 | % | 55 | % | 58 | % | 60 | % | 65 | % | 66 | % | 65 | % | ||||||||||||||||||||||||||||||||||
| PC Units5 |
||||||||||||||||||||||||||||||||||||||||||||||||||||||||||||||||||
| Notebook |
18.067 | 32.773 | 25.887 | 21.300 | 21.547 | 23.989 | 22.912 | 22.662 | 21.814 | 22.899 | 23.396 | 21.178 | 18.785 | 15.513 | 15.804 | 15.318 | ||||||||||||||||||||||||||||||||||||||||||||||||||
| Desktop |
15.975 | 21.211 | 16.819 | 17.717 | 18.383 | 16.185 | 17.307 | 16.825 | 16.635 | 16.182 | 16.320 | 15.375 | 13.523 | 11.601 | 11.683 | 12.458 | ||||||||||||||||||||||||||||||||||||||||||||||||||
| Non-PC Units |
||||||||||||||||||||||||||||||||||||||||||||||||||||||||||||||||||
| Consumer Electronics4 |
3.643 | 4.155 | 8.019 | 6.452 | 6.517 | 6.544 | 8.474 | 8.794 | 8.573 | 10.906 | 10.485 | 9.295 | 8.610 | 9.056 | 11.484 | 8.461 | ||||||||||||||||||||||||||||||||||||||||||||||||||
| Branded |
2.926 | 4.986 | 5.767 | 7.139 | 6.517 | 5.281 | 6.146 | 7.018 | 6.272 | 6.012 | 6.780 | 7.156 | 6.090 | 5.151 | 5.575 | 6.443 | ||||||||||||||||||||||||||||||||||||||||||||||||||
| Enterprise |
3.616 | 7.913 | 5.988 | 6.633 | 7.211 | 7.897 | 7.771 | 7.783 | 7.129 | 7.098 | 7.763 | 8.041 | 7.519 | 7.199 | 7.185 | 7.008 | ||||||||||||||||||||||||||||||||||||||||||||||||||
|
|
|
|
|
|
|
|
|
|
|
|
|
|
|
|
|
|
|
|
|
|
|
|
|
|
|
|
|
|
|
|
|
|||||||||||||||||||||||||||||||||||
| Total HDD |
44.227 | 71.038 | 62.480 | 59.241 | 60.175 | 59.896 | 62.610 | 63.082 | 60.423 | 63.097 | 64.744 | 61.045 | 54.527 | 48.520 | 51.731 | 49.688 | ||||||||||||||||||||||||||||||||||||||||||||||||||
| Average GB Shipped |
581 | 668 | 708 | 804 | 805 | 797 | 811 | 874 | 888 | 875 | 1,001 | 1,088 | 1,123 | 1,159 | 1,228 | 1,390 | ||||||||||||||||||||||||||||||||||||||||||||||||||
| EB Shipped |
25.7 | 47.4 | 44.3 | 47.6 | 48.4 | 47.7 | 50.8 | 55.1 | 53.6 | 55.2 | 64.8 | 66.4 | 61.3 | 56.2 | 63.5 | 69.1 | ||||||||||||||||||||||||||||||||||||||||||||||||||
| R4Q EB Shipped |
111.5 | 126.3 | 133.9 | 165.1 | 187.8 | 188.0 | 194.5 | 202.0 | 207.2 | 214.7 | 228.7 | 240.0 | 247.7 | 248.7 | 247.4 | 250.1 | ||||||||||||||||||||||||||||||||||||||||||||||||||
| Volume and HDD Share2 |
Revenue and Non-GAAP Gross Margin10 | Non-GAAP EPS Analysis | ||
|
|
| ||
Note: Refer to “Non-GAAP Financial Measures” for information about non-GAAP financial measures included in this quarterly fact sheet.
| Page 1 | WDC Quarterly Fact Sheet - Q2 FY16

|
| Balance sheet, cash flows, |
Q3 FY12 |
Q4 FY12 |
Q1 FY13 |
Q2 FY13 |
Q3 FY13 |
Q4 FY13 |
Q1 FY14 |
Q2 FY14 |
Q3 FY14 |
Q4 FY14 |
Q1 FY15 |
Q2 FY15 |
Q3 FY15 |
Q4 FY15 |
Q1 FY16 |
Q2 FY16 |
Business Model (Non-GAAP)
Gross Margin* 27%-32%
Operating Expense* 10%-12%
Operating Income* 15%-22%
Tax 7%-10% of Income Before Tax
Capital Expenditures* 5%-7%
Conversion Cycle 4-8 Days
*Percent of Revenue | |||||||||||||||||||||||||||||||||||||||||||||||||
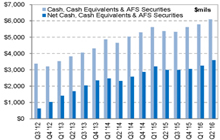
| Cash and Cash Equivalents |
$ | 3,377 | $ | 3,208 | $ | 3,537 | $ | 3,816 | $ | 4,060 | $ | 4,309 | $ | 4,869 | $ | 4,655 | $ | 4,569 | $ | 4,804 | $ | 5,159 | $ | 4,902 | $ | 4,812 | $ | 5,024 | $ | 5,081 | $ | 5,363 | ||||||||||||||||||||||||||||||||||
| Available-for-Sale (AFS) Securities |
— | — | — | — | — | — | — | — | 470 | 499 | 454 | 465 | 523 | 590 | 704 | 732 | ||||||||||||||||||||||||||||||||||||||||||||||||||
| Debt |
(2,743 | ) | (2,185 | ) | (2,128 | ) | (2,128 | ) | (2,013 | ) | (1,955 | ) | (2,398 | ) | (2,340 | ) | (2,469 | ) | (2,438 | ) | (2,406 | ) | (2,375 | ) | (2,344 | ) | (2,567 | ) | (2,536 | ) | (2,505 | ) | ||||||||||||||||||||||||||||||||||
|
|
|
|
|
|
|
|
|
|
|
|
|
|
|
|
|
|
|
|
|
|
|
|
|
|
|
|
|
|
|
|
|
|||||||||||||||||||||||||||||||||||
| Net Cash, Cash Equivalents & AFS Securities |
$ | 634 | $ | 1,023 | $ | 1,409 | $ | 1,688 | $ | 2,047 | $ | 2,354 | $ | 2,471 | $ | 2,315 | $ | 2,570 | $ | 2,865 | $ | 3,207 | $ | 2,992 | $ | 2,991 | $ | 3,047 | $ | 3,249 | $ | 3,590 | ||||||||||||||||||||||||||||||||||
| Cash Flow From Operations |
$ | 1,208 | $ | 1,128 | $ | 936 | $ | 772 | $ | 727 | $ | 684 | $ | 680 | $ | 727 | $ | 697 | $ | 713 | $ | 827 | $ | 243 | $ | 684 | $ | 488 | $ | 545 | $ | 598 | ||||||||||||||||||||||||||||||||||
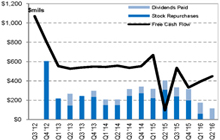
| Free Cash Flow |
$ | 1,069 | $ | 804 | $ | 554 | $ | 526 | $ | 539 | $ | 548 | $ | 544 | $ | 557 | $ | 536 | $ | 552 | $ | 667 | $ | 97 | $ | 534 | $ | 332 | $ | 394 | $ | 449 | ||||||||||||||||||||||||||||||||||
| Capital Expenditures |
$ | 139 | $ | 324 | $ | 382 | $ | 246 | $ | 188 | $ | 136 | $ | 136 | $ | 170 | $ | 161 | $ | 161 | $ | 160 | $ | 146 | $ | 150 | $ | 156 | $ | 151 | $ | 149 | ||||||||||||||||||||||||||||||||||
| Depreciation and Amortization |
$ | 188 | $ | 339 | $ | 313 | $ | 309 | $ | 309 | $ | 302 | $ | 312 | $ | 317 | $ | 307 | $ | 308 | $ | 289 | $ | 290 | $ | 285 | $ | 250 | $ | 236 | $ | 252 | ||||||||||||||||||||||||||||||||||
| EBITDA |
$ | 730 | $ | 1,147 | $ | 905 | $ | 787 | $ | 726 | $ | 81 | $ | 854 | $ | 795 | $ | 726 | $ | 660 | $ | 758 | $ | 756 | $ | 706 | $ | 505 | $ | 558 | $ | 503 | ||||||||||||||||||||||||||||||||||
| Accounts Receivable, Net |
$ | 2,377 | $ | 2,364 | $ | 1,951 | $ | 1,732 | $ | 1,700 | $ | 1,793 | $ | 1,791 | $ | 1,959 | $ | 1,802 | $ | 1,989 | $ | 1,915 | $ | 1,880 | $ | 1,696 | $ | 1,532 | $ | 1,616 | $ | 1,650 | ||||||||||||||||||||||||||||||||||
| Inventory |
||||||||||||||||||||||||||||||||||||||||||||||||||||||||||||||||||
| Raw Materials |
$ | 329 | $ | 245 | $ | 237 | $ | 193 | $ | 191 | $ | 167 | $ | 208 | $ | 201 | $ | 204 | $ | 168 | $ | 178 | $ | 154 | $ | 173 | $ | 168 | $ | 135 | $ | 130 | ||||||||||||||||||||||||||||||||||
| Work in Process |
667 | 552 | 559 | 581 | 583 | 575 | 579 | 581 | 519 | 493 | 509 | 510 | 498 | 500 | 507 | 474 | ||||||||||||||||||||||||||||||||||||||||||||||||||
| Finished Goods |
286 | 413 | 508 | 430 | 423 | 446 | 457 | 511 | 554 | 565 | 585 | 618 | 651 | 700 | 618 | 634 | ||||||||||||||||||||||||||||||||||||||||||||||||||
|
|
|
|
|
|
|
|
|
|
|
|
|
|
|
|
|
|
|
|
|
|
|
|
|
|
|
|
|
|
|
|
|
|||||||||||||||||||||||||||||||||||
| Total Inventory |
$ | 1,282 | $ | 1,210 | $ | 1,304 | $ | 1,204 | $ | 1,197 | $ | 1,188 | $ | 1,244 | $ | 1,293 | $ | 1,277 | $ | 1,226 | $ | 1,272 | $ | 1,282 | $ | 1,322 | $ | 1,368 | $ | 1,260 | $ | 1,238 | ||||||||||||||||||||||||||||||||||
| Property, Plant and Equipment, Net |
$ | 4,171 | $ | 4,067 | $ | 4,027 | $ | 3,938 | $ | 3,803 | $ | 3,700 | $ | 3,638 | $ | 3,509 | $ | 3,406 | $ | 3,293 | $ | 3,202 | $ | 3,099 | $ | 3,051 | $ | 2,965 | $ | 2,890 | $ | 2,801 | ||||||||||||||||||||||||||||||||||
| Accounts Payable |
$ | 2,774 | $ | 2,773 | $ | 2,545 | $ | 2,185 | $ | 2,037 | $ | 1,990 | $ | 2,061 | $ | 2,106 | $ | 1,902 | $ | 1,971 | $ | 2,016 | $ | 2,071 | $ | 2,020 | $ | 1,881 | $ | 1,799 | $ | 1,806 | ||||||||||||||||||||||||||||||||||
| Days Sales Outstanding11 |
71 | 45 | 44 | 41 | 41 | 44 | 43 | 45 | 44 | 50 | 48 | 44 | 44 | 44 | 44 | 45 | ||||||||||||||||||||||||||||||||||||||||||||||||||
| Days Inventory Outstanding11 |
57 | 34 | 42 | 40 | 40 | 40 | 42 | 42 | 44 | 42 | 45 | 42 | 48 | 55 | 48 | 47 | ||||||||||||||||||||||||||||||||||||||||||||||||||
| Days Payables Outstanding11 |
123 | 77 | 82 | 72 | 69 | 67 | 69 | 68 | 65 | 68 | 71 | 68 | 73 | 76 | 68 | 68 | ||||||||||||||||||||||||||||||||||||||||||||||||||
| Cash Conversion Cycle11 |
5 | 2 | 4 | 9 | 12 | 17 | 16 | 19 | 23 | 24 | 22 | 18 | 19 | 23 | 24 | 24 | ||||||||||||||||||||||||||||||||||||||||||||||||||
| Inventory Turns11 |
6 | 11 | 9 | 9 | 9 | 9 | 9 | 9 | 8 | 9 | 8 | 9 | 8 | 7 | 8 | 8 | ||||||||||||||||||||||||||||||||||||||||||||||||||
| Dividends Paid |
$ | — | $ | — | $ | — | $ | 121 | $ | — | $ | 60 | $ | 59 | $ | 59 | $ | 71 | $ | 70 | $ | 94 | $ | 94 | $ | 93 | $ | 116 | $ | 115 | $ | 116 | ||||||||||||||||||||||||||||||||||
| Shares Repurchased |
— | 16.4 | 5.2 | 4.2 | 5.2 | 4.4 | 2.3 | 2.0 | 2.8 | 3.2 | 2.2 | 3.2 | 2.2 | 2.0 | 0.7 | — | ||||||||||||||||||||||||||||||||||||||||||||||||||
| Shares Repurchased |
$ | — | $ | 604 | $ | 218 | $ | 146 | $ | 243 | $ | 235 | $ | 150 | $ | 150 | $ | 244 | $ | 272 | $ | 223 | $ | 309 | $ | 240 | $ | 198 | $ | 60 | $ | — | ||||||||||||||||||||||||||||||||||
| Remaining Amount Authorized |
$ | 416 | $ | 1,312 | $ | 2,594 | $ | 2,448 | $ | 2,205 | $ | 1,970 | $ | 1,820 | $ | 1,670 | $ | 1,426 | $ | 1,154 | $ | 931 | $ | 622 | $ | 2,382 | $ | 2,184 | $ | 2,124 | $ | 2,124 | ||||||||||||||||||||||||||||||||||
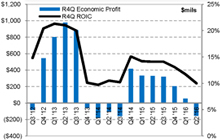
| R4Q Economic Profit8 |
$ | (83 | ) | $ | 542 | $ | 801 | $ | 976 | $ | 884 | $ | (59 | ) | $ | (176 | ) | $ | (109 | ) | $ | (158 | ) | $ | 415 | $ | 332 | $ | 328 | $ | 320 | $ | 203 | $ | 52 | $ | (157 | ) | ||||||||||||||||||||||||||||
| R4Q ROIC8 |
14.8 | % | 20.4 | % | 21.3 | % | 21.0 | % | 20.0 | % | 10.1 | % | 9.7 | % | 10.5 | % | 10.2 | % | 15.1 | % | 14.2 | % | 14.1 | % | 14.1 | % | 13.1 | % | 11.7 | % | 10.0 | % | ||||||||||||||||||||||||||||||||||
| R4Q ROA8 |
10.5 | % | 14.3 | % | 14.9 | % | 14.7 | % | 14.2 | % | 7.0 | % | 6.7 | % | 7.2 | % | 7.0 | % | 10.6 | % | 10.0 | % | 10.1 | % | 10.2 | % | 9.6 | % | 8.7 | % | 7.5 | % | ||||||||||||||||||||||||||||||||||
| Worldwide Headcount3 |
106,604 | 103,111 | 96,002 | 93,820 | 87,565 | 85,777 | 87,586 | 87,976 | 84,556 | 84,072 | 83,277 | 83,993 | 80,767 | 76,449 | 76,052 | 74,891 | ||||||||||||||||||||||||||||||||||||||||||||||||||
| Gross vs. Net Cash, Cash Equivalents & AFS Securities |
R&D10 and Capital Expenditures | Free Cash Flow | R4Q ROIC & R4Q Economic Profit8 | |||
|
|
|
| |||
Note: Refer to “Non-GAAP Financial Measures” for information about non-GAAP financial measures included in this quarterly fact sheet.
| Page 2 | WDC Quarterly Fact Sheet - Q2 FY16
|
Non-GAAP Financial Measures
Free Cash Flow: Free cash flow is a non-GAAP financial measure defined as cash flows from operations less capital expenditures. We consider free cash flow to be useful as an indicator of our overall liquidity, as the amount of free cash flow generated in any period is representative of cash that is available for strategic opportunities including, among others, investing in the Company’s business, making strategic acquisitions, strengthening the balance sheet, repaying debt, paying dividends and repurchasing stock. Free cash flow should not be construed as an alternative to cash flows from operations or other cash flow measurements determined in accordance with GAAP.
EBITDA: EBITDA is a non-GAAP financial measure defined as net income before interest, income tax expense, depreciation and amortization. We include information concerning EBITDA because we believe it is a useful measure to evaluate our operating performance. As a measure of our operating performance, we believe EBITDA provides a measure of operating results unaffected by differences in capital structures, capital investment cycles and ages of related assets among otherwise comparable companies. While EBITDA is a relevant and widely used measure of operating performance, it does not represent net income as defined by GAAP and it should not be considered as an alternative to that measure in evaluating operating performance.
Non-GAAP Gross Margin and Non-GAAP Gross Profit: Non-GAAP gross margin is a non-GAAP measure defined as non-GAAP gross profit divided by revenue. Non-GAAP gross profit is a non-GAAP measure defined as gross profit before any charges to cost of goods sold that may not be indicative of ongoing operations. We believe that non-GAAP gross profit is a useful measure to investors as an alternative method for measuring our operating performance and comparing it against prior periods’ performance.
Non-GAAP Operating Expenses: Non-GAAP operating expenses is a non-GAAP measure defined as operating expenses before any charges that may not be indicative of ongoing operations. We believe that non-GAAP operating expenses is a useful measure to investors as an alternative method for measuring our expense management and comparing it against prior periods’ performance.
Non-GAAP Net Income and Non-GAAP EPS: Non-GAAP net income and non-GAAP EPS are non-GAAP measures defined as net income and EPS, respectively, before any charges that may not be indicative of ongoing operations, or any tax impact related to those charges. We believe that non-GAAP net income and non-GAAP EPS are useful measures to investors as an alternative method for measuring our earnings performance and comparing it against prior periods’ performance.
Non-GAAP income tax provision as a percentage of non-GAAP pre-tax income: Non-GAAP income tax provision is a non-GAAP measure defined as income tax provision plus any income tax adjustments that may not be indicative of ongoing operations. We believe that non-GAAP income tax provision as a percentage of non-GAAP pre-tax income is a useful measure to investors as an alternative method for measuring our effective tax rate and comparing it against prior periods’ performance.
| In millions, except gross margin and per share amounts |
Q2 FY12 |
Q3 FY12 |
Q4 FY12 |
Q1 FY13 |
Q2 FY13 |
Q3 FY13 |
Q4 FY13 |
Q1 FY14 |
Q2 FY14 |
Q3 FY14 |
Q4 FY14 |
Q1 FY15 |
Q2 FY15 |
Q3 FY15 |
Q4 FY15 |
Q1 FY16 |
Q2 FY16 |
|||||||||||||||||||||||||||||||||||||||||||||||||||
| Reconciliation of Cash Flows from Operations to Free Cash Flow |
||||||||||||||||||||||||||||||||||||||||||||||||||||||||||||||||||||
| Cash Flows from Operations |
$ | 378 | $ | 1,208 | $ | 1,128 | $ | 936 | $ | 772 | $ | 727 | $ | 684 | $ | 680 | $ | 727 | $ | 697 | $ | 713 | $ | 827 | $ | 243 | $ | 684 | $ | 488 | $ | 545 | $ | 598 | ||||||||||||||||||||||||||||||||||
| Capital Expenditures |
(120 | ) | (139 | ) | (324 | ) | (382 | ) | (246 | ) | (188 | ) | (136 | ) | (136 | ) | (170 | ) | (161 | ) | (161 | ) | (160 | ) | (146 | ) | (150 | ) | (156 | ) | (151 | ) | (149 | ) | ||||||||||||||||||||||||||||||||||
|
|
|
|
|
|
|
|
|
|
|
|
|
|
|
|
|
|
|
|
|
|
|
|
|
|
|
|
|
|
|
|
|
|
|
|||||||||||||||||||||||||||||||||||
| Free Cash Flow |
$ | 258 | $ | 1,069 | $ | 804 | $ | 554 | $ | 526 | $ | 539 | $ | 548 | $ | 544 | $ | 557 | $ | 536 | $ | 552 | $ | 667 | $ | 97 | $ | 534 | $ | 332 | $ | 394 | $ | 449 | ||||||||||||||||||||||||||||||||||
| Reconciliation of Net Income to EBITDA |
||||||||||||||||||||||||||||||||||||||||||||||||||||||||||||||||||||
| Net Income (Loss) |
$ | 145 | $ | 483 | $ | 745 | $ | 519 | $ | 335 | $ | 391 | $ | (265 | ) | $ | 495 | $ | 430 | $ | 375 | $ | 317 | $ | 423 | $ | 438 | $ | 384 | $ | 220 | $ | 283 | $ | 251 | |||||||||||||||||||||||||||||||||
| Interest |
2 | 4 | 7 | 14 | 10 | 11 | 9 | 10 | 11 | 13 | 5 | 9 | 8 | 9 | 8 | 8 | 7 | |||||||||||||||||||||||||||||||||||||||||||||||||||
| Income Tax Provision |
15 | 55 | 56 | 59 | 133 | 15 | 35 | 37 | 37 | 31 | 30 | 37 | 20 | 28 | 27 | 31 | (7 | ) | ||||||||||||||||||||||||||||||||||||||||||||||||||
| Depreciation and Amortization |
140 | 188 | 339 | 313 | 309 | 309 | 302 | 312 | 317 | 307 | 308 | 289 | 290 | 285 | 250 | 236 | 252 | |||||||||||||||||||||||||||||||||||||||||||||||||||
|
|
|
|
|
|
|
|
|
|
|
|
|
|
|
|
|
|
|
|
|
|
|
|
|
|
|
|
|
|
|
|
|
|
|
|||||||||||||||||||||||||||||||||||
| EBITDA |
$ | 302 | $ | 730 | $ | 1,147 | $ | 905 | $ | 787 | $ | 726 | $ | 81 | $ | 854 | $ | 795 | $ | 726 | $ | 660 | $ | 758 | $ | 756 | $ | 706 | $ | 505 | $ | 558 | $ | 503 | ||||||||||||||||||||||||||||||||||
| Reconciliation of Gross Margin to Non-GAAP Gross Margin & Gross Profit to Non-GAAP Gross Profit |
||||||||||||||||||||||||||||||||||||||||||||||||||||||||||||||||||||
| Gross Profit10 |
$ | 648 | $ | 977 | $ | 1,472 | $ | 1,193 | $ | 1,059 | $ | 1,061 | $ | 1,050 | $ | 1,099 | $ | 1,156 | $ | 1,076 | $ | 1,029 | $ | 1,149 | $ | 1,110 | $ | 1,032 | $ | 930 | $ | 955 | $ | 906 | ||||||||||||||||||||||||||||||||||
| Acquisition-related charges |
— | 91 | — | — | — | — | — | — | — | — | — | — | — | — | — | — | — | |||||||||||||||||||||||||||||||||||||||||||||||||||
| Charges related to cost saving initiatives |
— | — | — | — | — | — | — | — | — | — | — | — | — | — | — | — | 22 | |||||||||||||||||||||||||||||||||||||||||||||||||||
| Other charges |
— | — | — | — | — | — | — | — | — | — | 10 | — | 39 | — | 1 | — | — | |||||||||||||||||||||||||||||||||||||||||||||||||||
| Amortization of acquired intangible assets |
— | 9 | 39 | 38 | 38 | 38 | 35 | 36 | 40 | 39 | 39 | 39 | 38 | 37 | 20 | 17 | 16 | |||||||||||||||||||||||||||||||||||||||||||||||||||
|
|
|
|
|
|
|
|
|
|
|
|
|
|
|
|
|
|
|
|
|
|
|
|
|
|
|
|
|
|
|
|
|
|
|
|||||||||||||||||||||||||||||||||||
| Non-GAAP Gross Profit10 |
$ | 648 | $ | 1,077 | $ | 1,511 | $ | 1,231 | $ | 1,097 | $ | 1,099 | $ | 1,085 | $ | 1,135 | $ | 1,196 | $ | 1,115 | $ | 1,078 | $ | 1,188 | $ | 1,187 | $ | 1,069 | $ | 951 | $ | 972 | $ | 944 | ||||||||||||||||||||||||||||||||||
| Revenue |
$ | 1,995 | $ | 3,035 | $ | 4,754 | $ | 4,035 | $ | 3,824 | $ | 3,764 | $ | 3,728 | $ | 3,804 | $ | 3,972 | $ | 3,703 | $ | 3,651 | $ | 3,943 | $ | 3,888 | $ | 3,550 | $ | 3,191 | $ | 3,360 | $ | 3,317 | ||||||||||||||||||||||||||||||||||
| Gross Margin10 |
32.5 | % | 32.2 | % | 31.0 | % | 29.6 | % | 27.7 | % | 28.2 | % | 28.2 | % | 28.9 | % | 29.1 | % | 29.1 | % | 28.2 | % | 29.1 | % | 28.5 | % | 29.1 | % | 29.1 | % | 28.4 | % | 27.3 | % | ||||||||||||||||||||||||||||||||||
| Non-GAAP Gross Margin10 |
32.5 | % | 35.5 | % | 31.8 | % | 30.5 | % | 28.7 | % | 29.2 | % | 29.1 | % | 29.8 | % | 30.1 | % | 30.1 | % | 29.5 | % | 30.1 | % | 30.5 | % | 30.1 | % | 29.8 | % | 28.9 | % | 28.5 | % | ||||||||||||||||||||||||||||||||||
| Reconciliation of Operating Expenses to Non-GAAP Operating Expenses |
||||||||||||||||||||||||||||||||||||||||||||||||||||||||||||||||||||
| Total Operating Expenses |
$ | 486 | $ | 435 | $ | 664 | $ | 601 | $ | 581 | $ | 644 | $ | 1,271 | $ | 557 | $ | 678 | $ | 657 | $ | 677 | $ | 680 | $ | 644 | $ | 611 | $ | 675 | $ | 633 | $ | 655 | ||||||||||||||||||||||||||||||||||
| Less: |
||||||||||||||||||||||||||||||||||||||||||||||||||||||||||||||||||||
| Amortization of acquired intangible assets |
— | (3 | ) | (12 | ) | (11 | ) | (11 | ) | (11 | ) | (11 | ) | (11 | ) | (11 | ) | (11 | ) | (8 | ) | (7 | ) | (7 | ) | (7 | ) | (8 | ) | (8 | ) | (8 | ) | |||||||||||||||||||||||||||||||||||
| Employee termination, asset impairment and other charges |
— | — | (80 | ) | (26 | ) | (41 | ) | (63 | ) | (8 | ) | (11 | ) | (23 | ) | (25 | ) | (26 | ) | (9 | ) | (36 | ) | (10 | ) | (104 | ) | (56 | ) | (27 | ) | ||||||||||||||||||||||||||||||||||||
| Charges related to cost saving initiatives |
— | — | — | — | — | — | — | — | — | — | — | — | — | — | — | — | (15 | ) | ||||||||||||||||||||||||||||||||||||||||||||||||||
| Charges related to arbitration award |
— | — | — | — | — | — | (681 | ) | (13 | ) | (13 | ) | (13 | ) | (13 | ) | (14 | ) | (1 | ) | — | — | — | (32 | ) | |||||||||||||||||||||||||||||||||||||||||||
| Acquisition-related charges |
(14 | ) | (34 | ) | — | — | — | — | (7 | ) | (13 | ) | — | — | — | — | — | (3 | ) | — | — | (27 | ) | |||||||||||||||||||||||||||||||||||||||||||||
| Charges and insurance recoveries related to flooding, net |
(199 | ) | (15 | ) | — | — | — | — | — | 65 | — | — | — | — | 37 | — | — | — | — | |||||||||||||||||||||||||||||||||||||||||||||||||
| Other charges |
— | — | — | — | — | (11 | ) | — | — | (15 | ) | (3 | ) | (32 | ) | (12 | ) | (17 | ) | — | (3 | ) | (2 | ) | (4 | ) | ||||||||||||||||||||||||||||||||||||||||||
|
|
|
|
|
|
|
|
|
|
|
|
|
|
|
|
|
|
|
|
|
|
|
|
|
|
|
|
|
|
|
|
|
|
|
|||||||||||||||||||||||||||||||||||
| Non-GAAP Operating Expenses |
$ | 273 | $ | 383 | $ | 572 | $ | 564 | $ | 529 | $ | 559 | $ | 564 | $ | 574 | $ | 616 | $ | 605 | $ | 598 | $ | 638 | $ | 620 | $ | 591 | $ | 560 | $ | 567 | $ | 542 | ||||||||||||||||||||||||||||||||||
| Reconciliation of Net Income (Loss) to Non-GAAP Net Income |
||||||||||||||||||||||||||||||||||||||||||||||||||||||||||||||||||||
| Net Income (Loss) |
$ | 145 | $ | 483 | $ | 745 | $ | 519 | $ | 335 | $ | 391 | $ | (265 | ) | $ | 495 | $ | 430 | $ | 375 | $ | 317 | $ | 423 | $ | 438 | $ | 384 | $ | 220 | $ | 283 | $ | 251 | |||||||||||||||||||||||||||||||||
| Amortization of acquired intangible assets |
— | 12 | 51 | 49 | 49 | 49 | 46 | 47 | 51 | 50 | 47 | 46 | 45 | 44 | 28 | 25 | 24 | |||||||||||||||||||||||||||||||||||||||||||||||||||
| Employee termination, asset impairment and other charges |
— | — | 80 | 26 | 41 | 63 | 8 | 11 | 23 | 25 | 36 | 9 | 53 | 10 | 104 | 56 | 27 | |||||||||||||||||||||||||||||||||||||||||||||||||||
| Charges related to cost saving initiatives |
— | — | — | — | — | — | — | — | — | — | — | — | — | — | — | — | 37 | |||||||||||||||||||||||||||||||||||||||||||||||||||
| Charges related to arbitration award |
— | — | — | — | — | — | 681 | 13 | 13 | 13 | 13 | 14 | 1 | — | — | — | 32 | |||||||||||||||||||||||||||||||||||||||||||||||||||
| Acquisition-related charges |
14 | 125 | — | — | — | — | 7 | 13 | — | — | — | — | — | 3 | — | — | 27 | |||||||||||||||||||||||||||||||||||||||||||||||||||
| Charges and insurance recoveries related to flooding, net |
199 | 15 | — | — | — | — | — | (65 | ) | — | — | — | — | (37 | ) | — | — | — | — | |||||||||||||||||||||||||||||||||||||||||||||||||
| Other charges |
— | — | — | — | — | 11 | — | — | 15 | 7 | 32 | 12 | 39 | — | 4 | 2 | 4 | |||||||||||||||||||||||||||||||||||||||||||||||||||
| Income tax adjustments |
— | (16 | ) | (4 | ) | — | 88 | — | — | — | — | — | — | — | — | — | — | — | (28 | ) | ||||||||||||||||||||||||||||||||||||||||||||||||
|
|
|
|
|
|
|
|
|
|
|
|
|
|
|
|
|
|
|
|
|
|
|
|
|
|
|
|
|
|
|
|
|
|
|
|||||||||||||||||||||||||||||||||||
| Non-GAAP Net Income |
$ | 358 | $ | 619 | $ | 872 | $ | 594 | $ | 513 | $ | 514 | $ | 477 | $ | 514 | $ | 532 | $ | 470 | $ | 445 | $ | 504 | $ | 539 | $ | 441 | $ | 356 | $ | 366 | $ | 374 | ||||||||||||||||||||||||||||||||||
| EPS |
$ | 0.61 | $ | 1.96 | $ | 2.87 | $ | 2.06 | $ | 1.36 | $ | 1.60 | $ | (1.12 | ) | $ | 2.05 | $ | 1.77 | $ | 1.55 | $ | 1.32 | $ | 1.76 | $ | 1.84 | $ | 1.63 | $ | 0.94 | $ | 1.21 | $ | 1.07 | |||||||||||||||||||||||||||||||||
| Non-GAAP EPS |
$ | 1.51 | $ | 2.52 | $ | 3.35 | $ | 2.36 | $ | 2.09 | $ | 2.10 | $ | 1.96 | $ | 2.12 | $ | 2.19 | $ | 1.94 | $ | 1.85 | $ | 2.10 | $ | 2.26 | $ | 1.87 | $ | 1.51 | $ | 1.56 | $ | 1.60 | ||||||||||||||||||||||||||||||||||
| Diluted Shares Outstanding |
237 | 246 | 260 | 252 | 246 | 245 | 236 | 242 | 243 | 242 | 241 | 240 | 238 | 236 | 235 | 234 | 234 | |||||||||||||||||||||||||||||||||||||||||||||||||||
| Non-GAAP Diluted Shares Outstanding6 |
237 | 246 | 260 | 252 | 246 | 245 | 243 | 242 | 243 | 242 | 241 | 240 | 238 | 236 | 235 | 234 | 234 | |||||||||||||||||||||||||||||||||||||||||||||||||||
| Reconciliation of Income Tax Provision as a percentage of pre-tax income to Non-GAAP income tax provision as a percentage of non-GAAP pre-tax income |
||||||||||||||||||||||||||||||||||||||||||||||||||||||||||||||||||||
| Net income (loss) |
$ | 145 | $ | 483 | $ | 745 | $ | 519 | $ | 335 | $ | 391 | $ | (265 | ) | $ | 495 | $ | 430 | $ | 375 | $ | 317 | $ | 423 | $ | 438 | $ | 384 | $ | 220 | $ | 283 | $ | 251 | |||||||||||||||||||||||||||||||||
| Income tax provision |
15 | 55 | 56 | 59 | 133 | 15 | 35 | 37 | 37 | 31 | 30 | 37 | 20 | 28 | 27 | 31 | (7 | ) | ||||||||||||||||||||||||||||||||||||||||||||||||||
|
|
|
|
|
|
|
|
|
|
|
|
|
|
|
|
|
|
|
|
|
|
|
|
|
|
|
|
|
|
|
|
|
|
|
|||||||||||||||||||||||||||||||||||
| Pre-tax income |
$ | 160 | $ | 538 | $ | 801 | $ | 578 | $ | 468 | $ | 406 | $ | (230 | ) | $ | 532 | $ | 467 | $ | 406 | $ | 347 | $ | 460 | $ | 458 | $ | 412 | $ | 247 | $ | 314 | $ | 244 | |||||||||||||||||||||||||||||||||
| Income tax provision as a percentage of pre-tax income |
9 | % | 10 | % | 7 | % | 10 | % | 28 | % | 4 | % | -15 | % | 7 | % | 8 | % | 8 | % | 9 | % | 8 | % | 4 | % | 7 | % | 11 | % | 10 | % | -3 | % | ||||||||||||||||||||||||||||||||||
| Non-GAAP Net Income |
$ | 358 | $ | 619 | $ | 872 | $ | 594 | $ | 513 | $ | 514 | $ | 477 | $ | 514 | $ | 532 | $ | 470 | $ | 445 | $ | 504 | $ | 539 | $ | 441 | $ | 356 | $ | 366 | $ | 374 | ||||||||||||||||||||||||||||||||||
| Add: |
||||||||||||||||||||||||||||||||||||||||||||||||||||||||||||||||||||
| Income tax provision |
15 | 55 | 56 | 59 | 133 | 15 | 35 | 37 | 37 | 31 | 30 | 37 | 20 | 28 | 27 | 31 | (7 | ) | ||||||||||||||||||||||||||||||||||||||||||||||||||
| Income tax adjustments |
— | 16 | 4 | — | (88 | ) | — | — | — | — | — | — | — | — | — | — | — | 28 | ||||||||||||||||||||||||||||||||||||||||||||||||||
|
|
|
|
|
|
|
|
|
|
|
|
|
|
|
|
|
|
|
|
|
|
|
|
|
|
|
|
|
|
|
|
|
|
|
|||||||||||||||||||||||||||||||||||
| Non-GAAP income tax provision |
15 | 71 | 60 | 59 | 45 | 15 | 35 | 37 | 37 | 31 | 30 | 37 | 20 | 28 | 27 | 31 | 21 | |||||||||||||||||||||||||||||||||||||||||||||||||||
| Non-GAAP pre-tax income |
$ | 373 | $ | 690 | $ | 932 | $ | 653 | $ | 558 | $ | 529 | $ | 512 | $ | 551 | $ | 569 | $ | 501 | $ | 475 | $ | 541 | $ | 559 | $ | 469 | $ | 383 | $ | 397 | $ | 395 | ||||||||||||||||||||||||||||||||||
| Non-GAAP income tax provision as a percentage of pre-tax income |
4 | % | 10 | % | 6 | % | 9 | % | 8 | % | 3 | % | 7 | % | 7 | % | 7 | % | 6 | % | 6 | % | 7 | % | 4 | % | 6 | % | 7 | % | 8 | % | 5 | % | ||||||||||||||||||||||||||||||||||
| Page 3 | WDC Quarterly Fact Sheet - Q2 FY16
|
Non-GAAP Financial Measures
Economic Profit: Economic profit (EP) is a non-GAAP financial measure defined as net operating profit after taxes less the value of invested capital multiplied by the weighted average cost of capital, where net operating profit after taxes is defined as income from operations minus tax expense and invested capital is defined as the sum of current debt, long-term debt and equity. Management uses EP to evaluate business performance and allocate resources, and it is a component in determining management’s incentive compensation. Management believes EP provides additional perspective to investors about financial returns generated by the business and represents profit generated over and above the cost of capital used by the business to generate that profit.
| In millions |
Q4 FY11 |
Q1 FY12 |
Q2 FY12 |
Q3 FY12 |
Q4 FY12 |
Q1 FY13 |
Q2 FY13 |
Q3 FY13 |
Q4 FY13 |
Q1 FY14 |
Q2 FY14 |
Q3 FY14 |
Q4 FY14 |
Q1 FY15 |
Q2 FY15 |
Q3 FY15 |
Q4 FY15 |
Q1 FY16 |
Q2 FY16 |
|||||||||||||||||||||||||||||||||||||||||||||||||||||||||
| Reconciliation of Operating Income (Loss) to R4Q Economic Profit |
||||||||||||||||||||||||||||||||||||||||||||||||||||||||||||||||||||||||||||
| Operating Income (Loss) |
$ | 172 | $ | 259 | $ | 162 | $ | 542 | $ | 808 | $ | 592 | $ | 478 | $ | 417 | $ | (221 | ) | $ | 542 | $ | 478 | $ | 419 | $ | 352 | $ | 469 | $ | 466 | $ | 421 | $ | 255 | $ | 322 | $ | 251 | |||||||||||||||||||||||||||||||||||||
| Income Tax Provision |
(12 | ) | (19 | ) | (15 | ) | (55 | ) | (56 | ) | (59 | ) | (133 | ) | (15 | ) | (35 | ) | (37 | ) | (37 | ) | (31 | ) | (30 | ) | (37 | ) | (20 | ) | (28 | ) | (27 | ) | (31 | ) | 7 | |||||||||||||||||||||||||||||||||||||||
|
|
|
|
|
|
|
|
|
|
|
|
|
|
|
|
|
|
|
|
|
|
|
|
|
|
|
|
|
|
|
|
|
|
|
|
|
|
|
|||||||||||||||||||||||||||||||||||||||
| Net Operating Profit After Taxes |
160 | 240 | 147 | 487 | 752 | 533 | 345 | 402 | (256 | ) | 505 | 441 | 388 | 322 | 432 | 446 | 393 | 228 | 291 | 258 | ||||||||||||||||||||||||||||||||||||||||||||||||||||||||
| R4Q Net Operating Profit After Taxes |
728 | 771 | 692 | 1,034 | 1,626 | 1,919 | 2,117 | 2,032 | 1,024 | 996 | 1,092 | 1,078 | 1,656 | 1,583 | 1,588 | 1,593 | 1,499 | 1,358 | 1,170 | |||||||||||||||||||||||||||||||||||||||||||||||||||||||||
| Invested Capital x WACC |
(636 | ) | (658 | ) | (677 | ) | (1,117 | ) | (1,084 | ) | (1,118 | ) | (1,141 | ) | (1,148 | ) | (1,083 | ) | (1,172 | ) | (1,201 | ) | (1,236 | ) | (1,241 | ) | (1,251 | ) | (1,260 | ) | (1,273 | ) | (1,296 | ) | (1,306 | ) | (1,327 | ) | ||||||||||||||||||||||||||||||||||||||
|
|
|
|
|
|
|
|
|
|
|
|
|
|
|
|
|
|
|
|
|
|
|
|
|
|
|
|
|
|
|
|
|
|
|
|
|
|
|
|||||||||||||||||||||||||||||||||||||||
| R4Q Economic Profit |
$ | 92 | $ | 113 | $ | 15 | $ | (83 | ) | $ | 542 | $ | 801 | $ | 976 | $ | 884 | $ | (59 | ) | $ | (176 | ) | $ | (109 | ) | $ | (158 | ) | $ | 415 | $ | 332 | $ | 328 | $ | 320 | $ | 203 | $ | 52 | $ | (157 | ) | ||||||||||||||||||||||||||||||||
Formulas
Share = Units (HDD) / TAM
ASP = Revenue / Units (HDD)
Free Cash Flow = Cash Flow from Operations – Capital Expenditures
EBITDA = Net Income (Loss) + Interest + Income Tax Expense + Depreciation and Amortization
Days Sales Outstanding (DSO) = Accounts Receivable / (Revenue / 91 days)
Days Inventory Outstanding (DIO) = Inventory / (Cost of Revenue / 91 days)
Days Payables Outstanding (DPO) = Accounts Payable / (Cost of Revenue / 91 days)
Cash Conversion Cycle = DSO + DIO – DPO
Inventory Turns = 364 days / DIO
R4Q Economic Profit = R4Q Net Operating Profit After Taxes – (Invested Capital x WACC)
| • | Invested Capital = Short-term debt + Current portion of long-term debt + Long-term debt + Total shareholders’ equity |
| • | WACC7 = 11% |
R4Q ROIC = R4Q (Net Income (Loss) + Interest Expense) / R4Q Average (Short-term debt + Current portion of long-term debt + Long-term debt + Total shareholders’ equity)
R4Q ROA = R4Q Net Income (Loss) / R4Q Average Total Assets
Footnotes
| 1. | ASP, Revenue by Channel and Revenue by Geography exclude external sales of media/substrates. |
| 2. | Unit volume excludes WD TV Media Players without hard drives, WD Livewire, SSD and media. |
| 3. | Worldwide Headcount excludes temporary and contracted employees. |
| 4. | Consumer Electronics includes gaming. |
| 5. | PC includes shipments to distributors, second/third tier external HDD manufacturers, and white box manufacturers. |
| 6. | Q4 FY13 non-GAAP EPS is calculated using the same number of shares used for Q4 FY13 GAAP EPS plus 7 million dilutive shares. Dilutive shares are not included in the Q4 FY13 GAAP EPS calculation as Q4 FY13 resulted in a net loss. |
| 7. | WACC of 11% is an internal assumption. |
| 8. | Q2 FY12 includes charges related to the flooding. Q4 FY13 includes charges related to the arbitration award. |
| 9. | TAM is preliminary and based on internal information. |
| 10. | Certain FY14 prior quarter amounts have been reclassified from gross profit, R&D and SG&A to the other charges line within operating expenses to conform to the annual presentation of FY14 in Part II, Item 8, Note18 in the Notes to Consolidated Financial Statements included in our Annual Report on Form 10-K. |
| 11. | Q1 FY15 cash conversion cycle calculated using 98 days due to a 14 week quarter. Q1 FY15 inventory turns calculated using 371 days due to a 53 week year. |
| 12. | Non-PC revenue percentage includes consumer electronics, enterprise applications, branded products, and SSD. |
| Page 4 | WDC Quarterly Fact Sheet - Q2 FY16
|