Attached files
| file | filename |
|---|---|
| EX-99.2 - EXHIBIT 99.2 - PDF VERSION - Mead Johnson Nutrition Co | q42015mjnearningscalldeck.pdf |
| EX-99.1 - EXHIBIT 99.1 - Mead Johnson Nutrition Co | ex991-pressreleasex4q2015.htm |
| 8-K - 8-K - Mead Johnson Nutrition Co | form8-kforearningsreleasex.htm |

Fourth Quarter and Full Year 2015 Earnings Call Presentation January 28, 2016
Safe Harbor Statement 2 Forward-LookingStatements Certain statements in this presentation are forward-looking as defined in the Private Securities Litigation Reform Act of 1995. These forward-looking statements may be identified by the fact they use words such as “should,” “expect,” “anticipate,” “estimate,” “target,” “may,” “project,” “guidance,” “intend,” “plan,” “believe” and other words and terms of similar meaning and expression. Such statements are likely to relate to, among other things, a discussion of goals, plans and projections regarding financial position, results of operations, cash flows, market position, market growth and trends, product development, product approvals, sales efforts, expenses, capital expenditures, performance or results of current and anticipated products and the outcome of contingencies such as legal proceedings and financial results. Forward- looking statements can also be identified by the fact that they do not relate strictly to historical or current facts. Such forward-looking statements are based on current expectations that involve inherent risks, uncertainties and assumptions that may cause actual results to differ materially from expectations as of the date of this presentation. These risks include, but are not limited to: (1) the ability to sustain brand strength, particularly the Enfa family of brands; (2) the effect on the company's reputation of real or perceived quality issues; (3) the effect of regulatory restrictions related to the company’s products; (4) the adverse effect of commodity costs; (5) increased competition from branded, private label, store and economy-branded products; (6) the effect of an economic downturn on consumers' purchasing behavior and customers' ability to pay for product; (7) inventory reductions by customers; (8) the adverse effect of changes in foreign currency exchange rates; (9) the effect of changes in economic, political and social conditions in the markets where we operate; (10) changing consumer preferences; (11) the possibility of changes in the Women, Infant and Children (WIC) program, or participation in WIC; (12) legislative, regulatory or judicial action that may adversely affect the company's ability to advertise its products, maintain product margins, or negatively impact the company’s reputation or result in fines or penalties that decrease earnings; and (13) the ability to develop and market new, innovative products. For additional information regarding these and other factors, see the company’s filings with the United States Securities and Exchange Commission (the SEC), including its most recent Annual Report on Form 10-K, which filings are available upon request from the SEC or at www.meadjohnson.com. The company cautions readers not to place undue reliance on any forward-looking statements, which speak only as of the date made. The company undertakes no obligation to publicly update any forward-looking statement, whether as a result of new information, future events or otherwise. Factors Affecting Comparability – Non-GAAP Financial Measures This presentation contains non-GAAP financial measures, including non-GAAP net sales, EBIT, earnings, earnings per share information, and effective tax rates. Specified Items are terms included in GAAP measures, but excluded for the purpose of determining non-GAAP net sales, EBIT, earnings and earnings per share. In addition, other items include the tax impact on Specified Items. Non-GAAP net sales, EBIT, earnings and earnings per share information adjusted for these items is an indication of the company’s underlying operating results and intended to enhance an investor’s overall understanding of the company’s financial performance. In addition, this information is among the primary indicators the company uses as a basis for evaluating company performance, setting incentive compensation targets and planning and forecasting of future periods. This information is not intended to be considered in isolation or as a substitute for financial measures prepared in accordance with GAAP. Tables that reconcile non-GAAP to GAAP disclosure are included in the Appendix. For more information: Kathy MacDonald, Vice President – Investor Relations Mead Johnson Nutrition Company 847-832-2182 kathy.macdonald@mjn.com January 2016
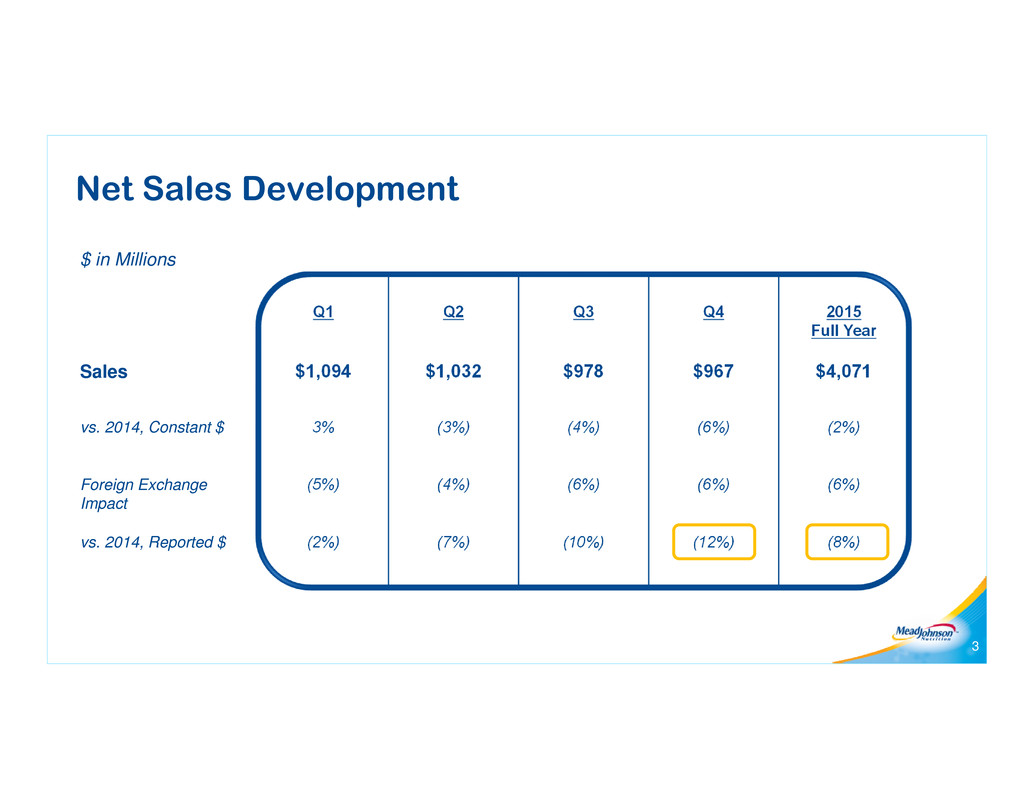
Net Sales Development 3 $ in Millions Q1 Q2 Q3 Q4 2015 Full Year Sales $1,094 $1,032 $978 $967 $4,071 vs. 2014, Constant $ 3% (3%) (4%) (6%) (2%) Foreign Exchange Impact (5%) (4%) (6%) (6%) (6%) vs. 2014, Reported $ (2%) (7%) (10%) (12%) (8%)
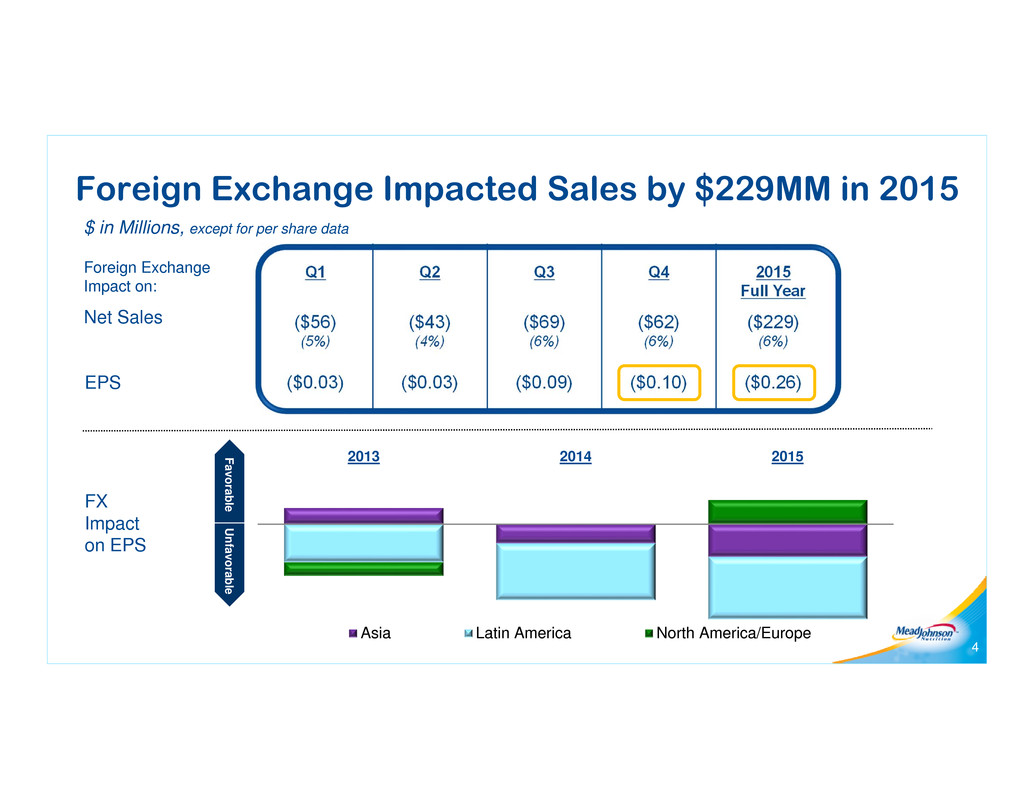
Foreign Exchange Impacted Sales by $229MM in 2015 4 $ in Millions, except for per share data Foreign Exchange Impact on: Q1 Q2 Q3 Q4 2015 Full Year Net Sales ($56) (5%) ($43) (4%) ($69) (6%) ($62) (6%) ($229) (6%) EPS ($0.03) ($0.03) ($0.09) ($0.10) ($0.26) 2013 2014 2015 Asia Latin America North America/Europe Favorable U nfavorable FX Impact on EPS
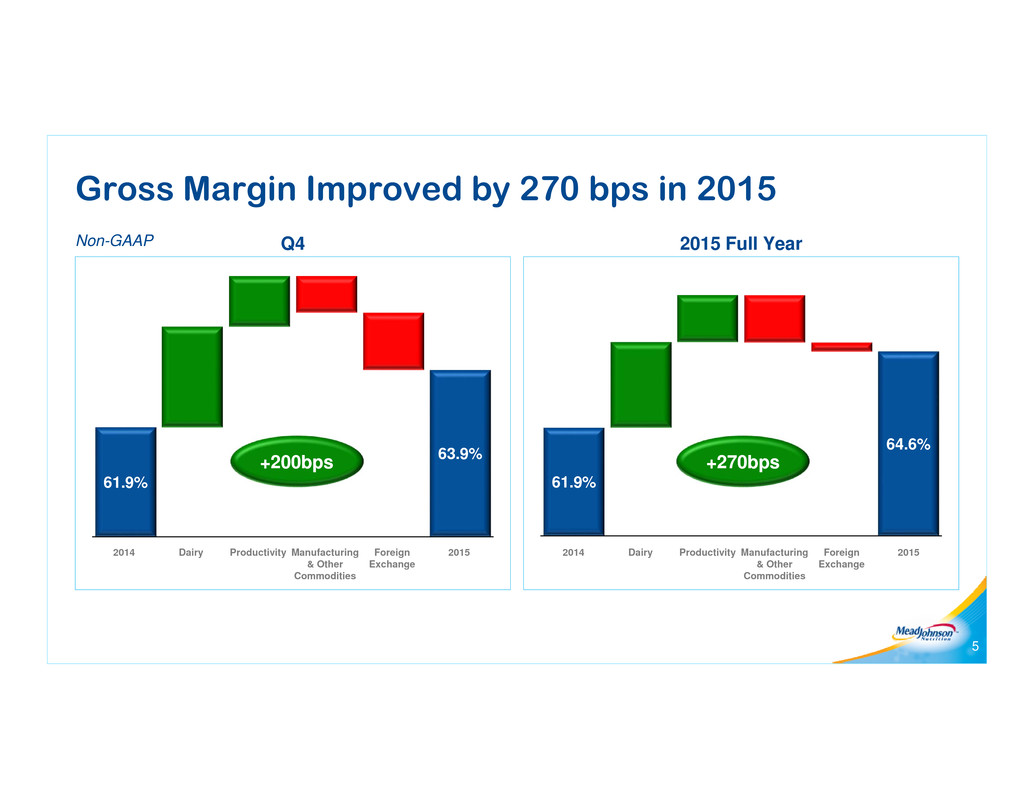
Q4 2015 Full Year Gross Margin Improved by 270 bps in 2015 5 61.9% 63.9% 61.9% 64.6% +200bps +270bps 2014 Dairy Productivity Manufacturing & Other Commodities Foreign Exchange 2015 2014 Dairy Productivity Manufacturing & Other Commodities Foreign Exchange 2015 Non-GAAP
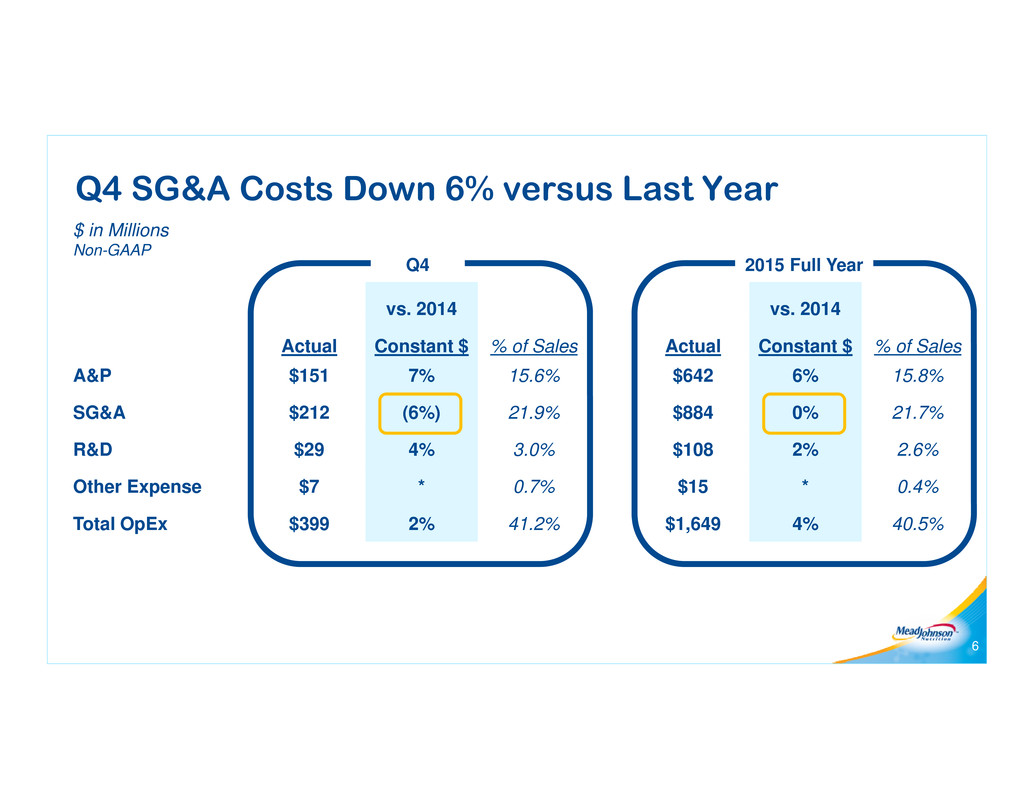
Q4 SG&A Costs Down 6% versus Last Year $ in Millions Non-GAAP vs. 2014 vs. 2014 Actual Constant $ % of Sales Actual Constant $ % of Sales A&P $151 7% 15.6% $642 6% 15.8% SG&A $212 (6%) 21.9% $884 0% 21.7% R&D $29 4% 3.0% $108 2% 2.6% Other Expense $7 * 0.7% $15 * 0.4% Total OpEx $399 2% 41.2% $1,649 4% 40.5% Q4 2015 Full Year 6
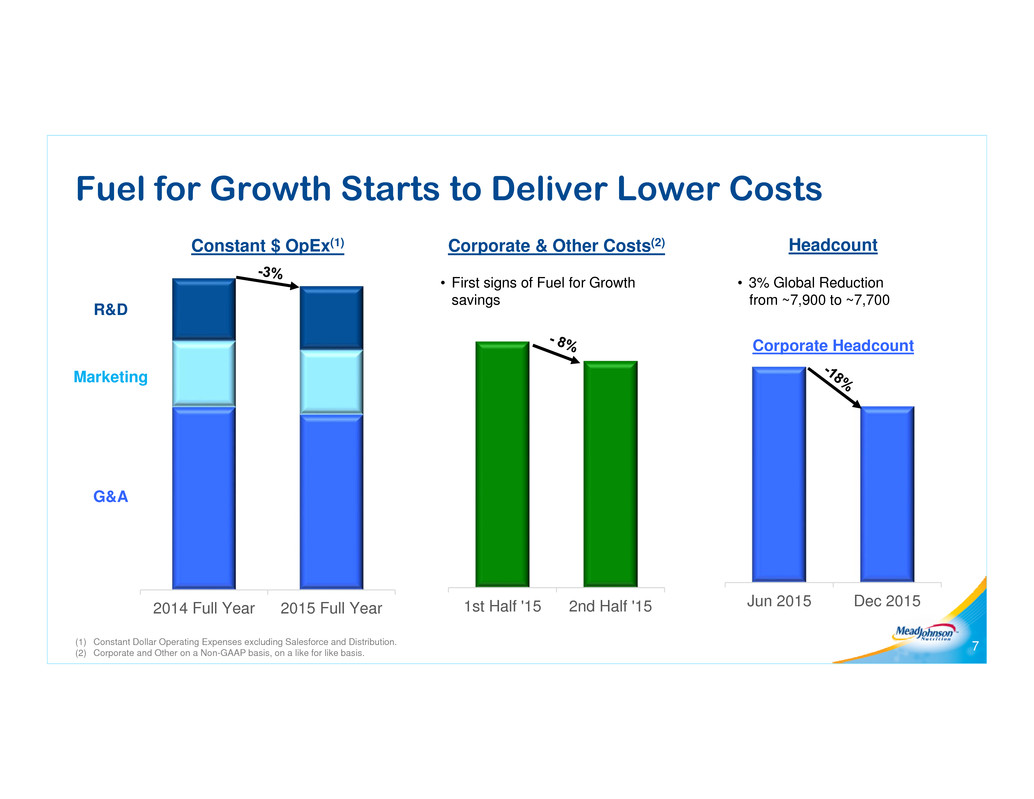
Fuel for Growth Starts to Deliver Lower Costs 7(1) Constant Dollar Operating Expenses excluding Salesforce and Distribution.(2) Corporate and Other on a Non-GAAP basis, on a like for like basis. 2014 Full Year 2015 Full Year Constant $ OpEx(1) G&A Marketing R&D Jun 2015 Dec 20151st Half '15 2nd Half '15 Corporate & Other Costs(2) • First signs of Fuel for Growth savings Headcount • 3% Global Reduction from ~7,900 to ~7,700 Corporate Headcount
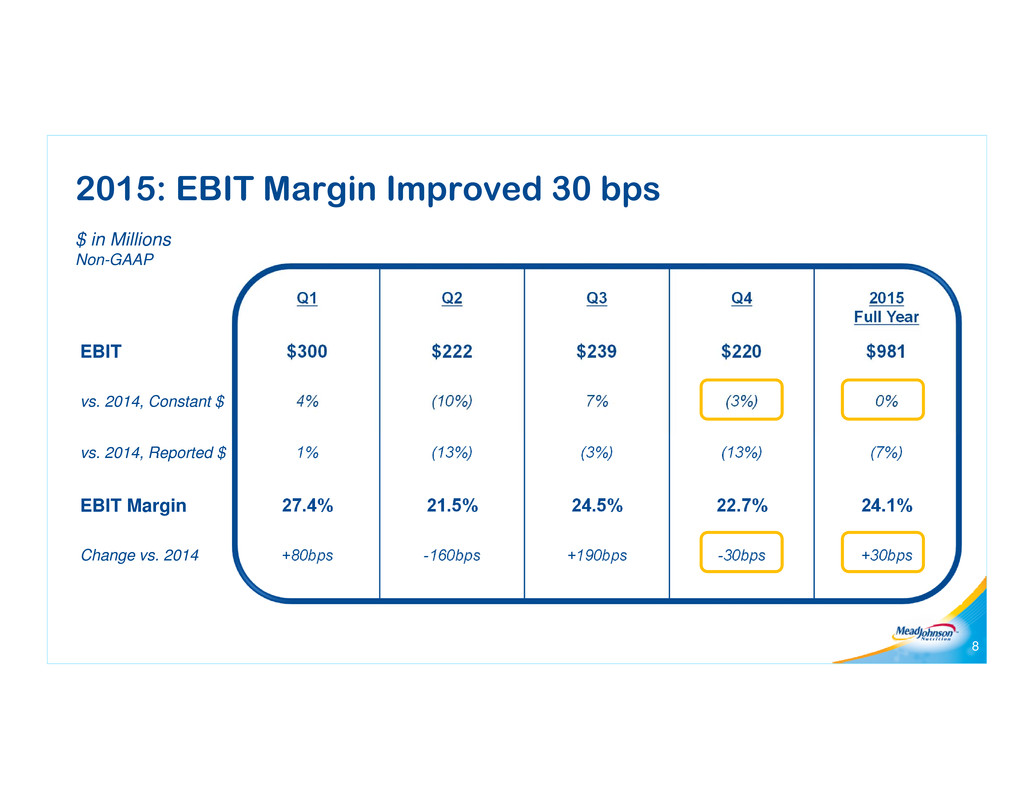
2015: EBIT Margin Improved 30 bps 8 $ in Millions Non-GAAP Q1 Q2 Q3 Q4 2015 Full Year EBIT $300 $222 $239 $220 $981 vs. 2014, Constant $ 4% (10%) 7% (3%) 0% vs. 2014, Reported $ 1% (13%) (3%) (13%) (7%) EBIT Margin 27.4% 21.5% 24.5% 22.7% 24.1% Change vs. 2014 +80bps -160bps +190bps -30bps +30bps
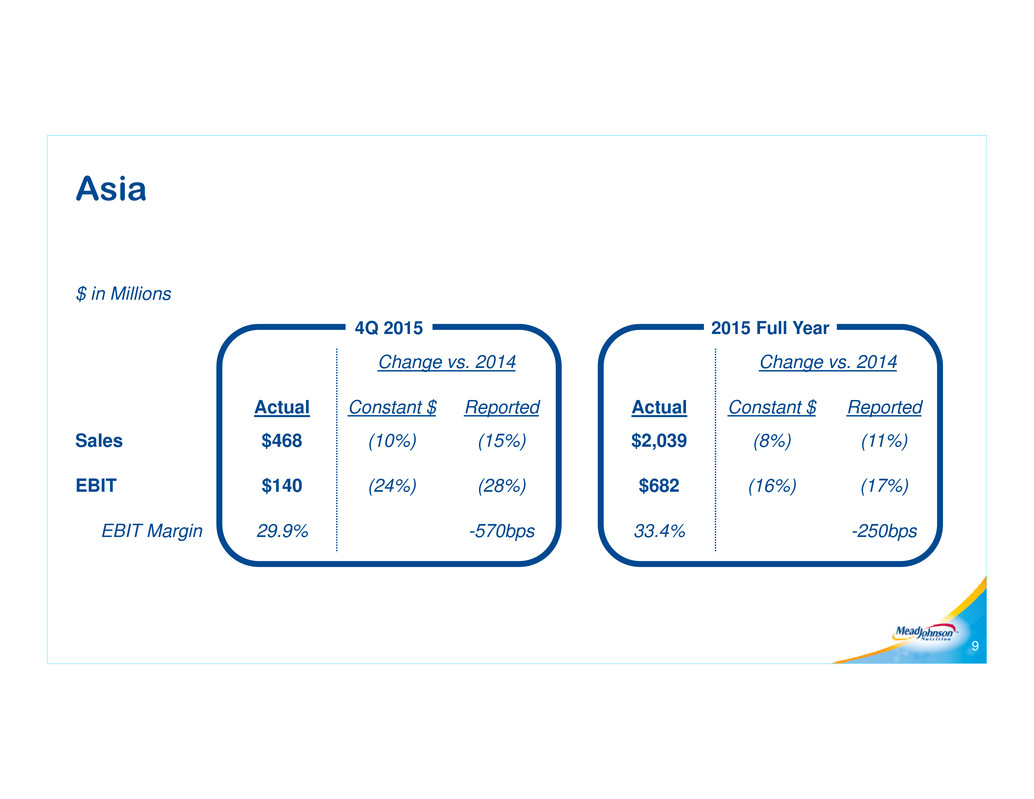
Asia 9 $ in Millions Change vs. 2014 Change vs. 2014 Actual Constant $ Reported Actual Constant $ Reported Sales $468 (10%) (15%) $2,039 (8%) (11%) EBIT $140 (24%) (28%) $682 (16%) (17%) EBIT Margin 29.9% -570bps 33.4% -250bps 4Q 2015 2015 Full Year
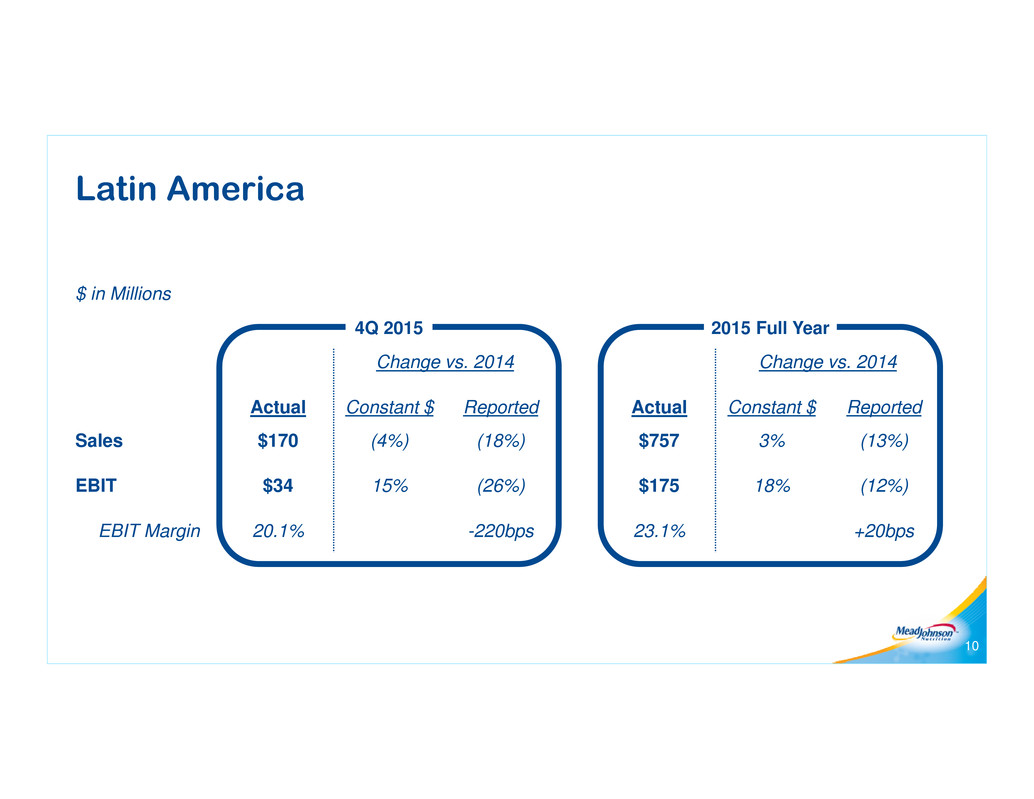
Latin America 10 $ in Millions Change vs. 2014 Change vs. 2014 Actual Constant $ Reported Actual Constant $ Reported Sales $170 (4%) (18%) $757 3% (13%) EBIT $34 15% (26%) $175 18% (12%) EBIT Margin 20.1% -220bps 23.1% +20bps 4Q 2015 2015 Full Year
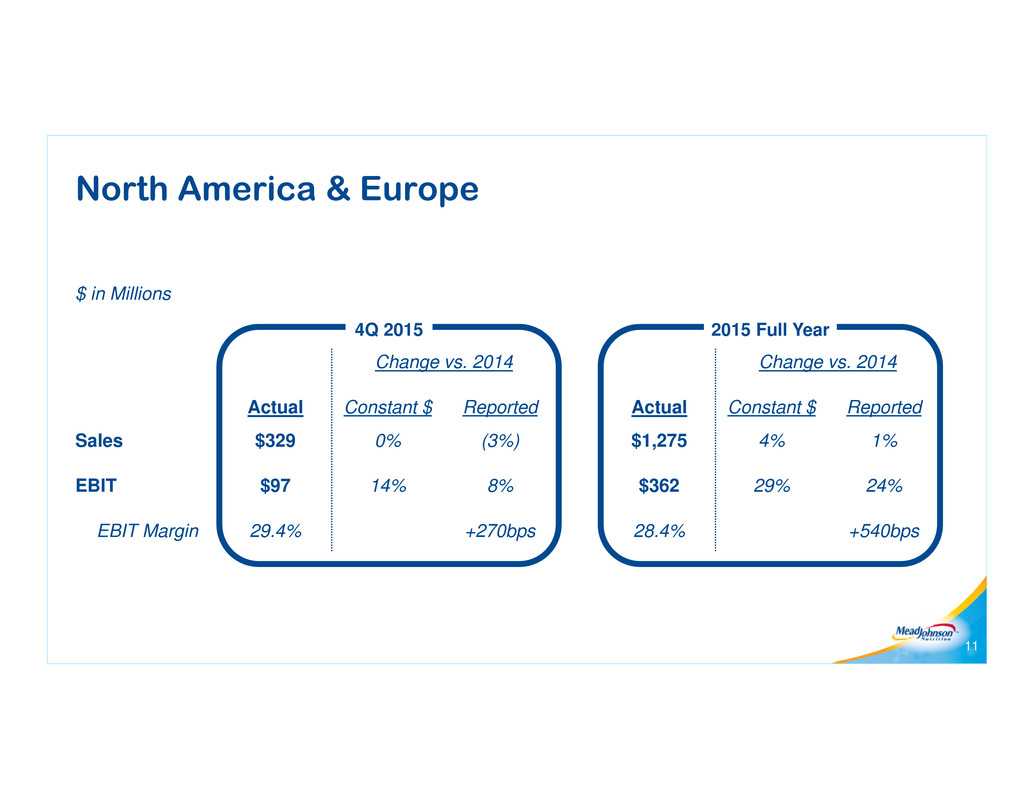
North America & Europe 11 $ in Millions Change vs. 2014 Change vs. 2014 Actual Constant $ Reported Actual Constant $ Reported Sales $329 0% (3%) $1,275 4% 1% EBIT $97 14% 8% $362 29% 24% EBIT Margin 29.4% +270bps 28.4% +540bps 4Q 2015 2015 Full Year
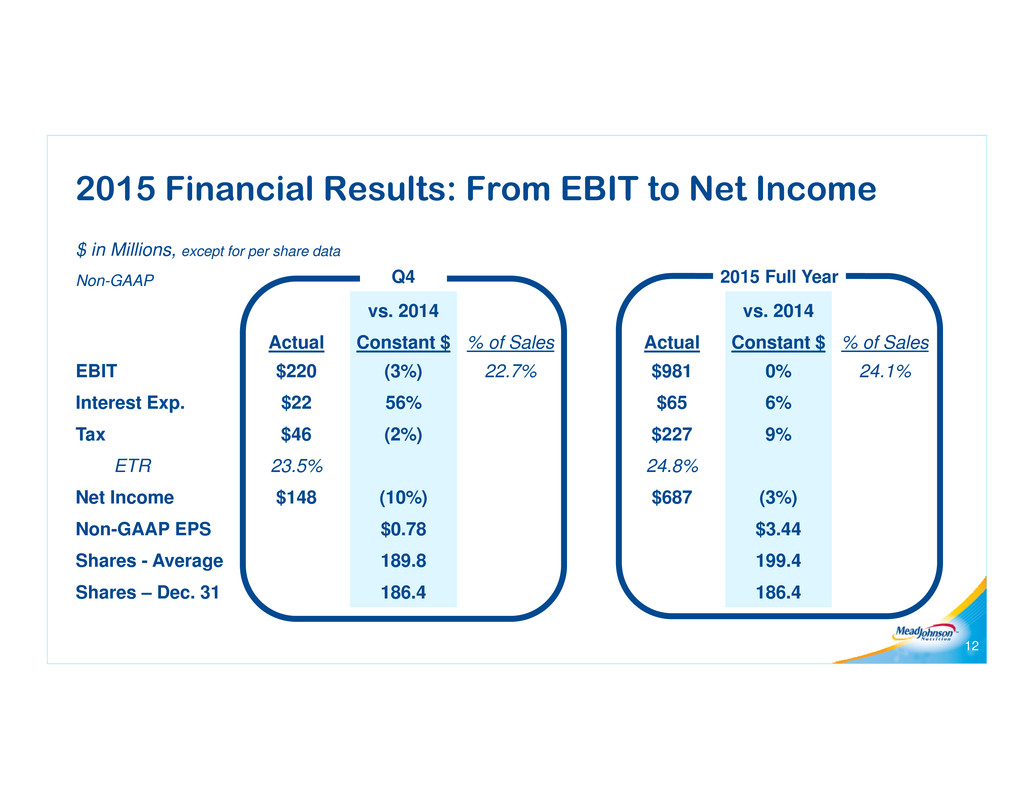
2015 Financial Results: From EBIT to Net Income 12 $ in Millions, except for per share data Non-GAAP vs. 2014 vs. 2014 Actual Constant $ % of Sales Actual Constant $ % of Sales EBIT $220 (3%) 22.7% $981 0% 24.1% Interest Exp. $22 56% $65 6% Tax $46 (2%) $227 9% ETR 23.5% 24.8% Net Income $148 (10%) $687 (3%) Non-GAAP EPS $0.78 $3.44 Shares - Average 189.8 199.4 Shares – Dec. 31 186.4 186.4 Q4 2015 Full Year
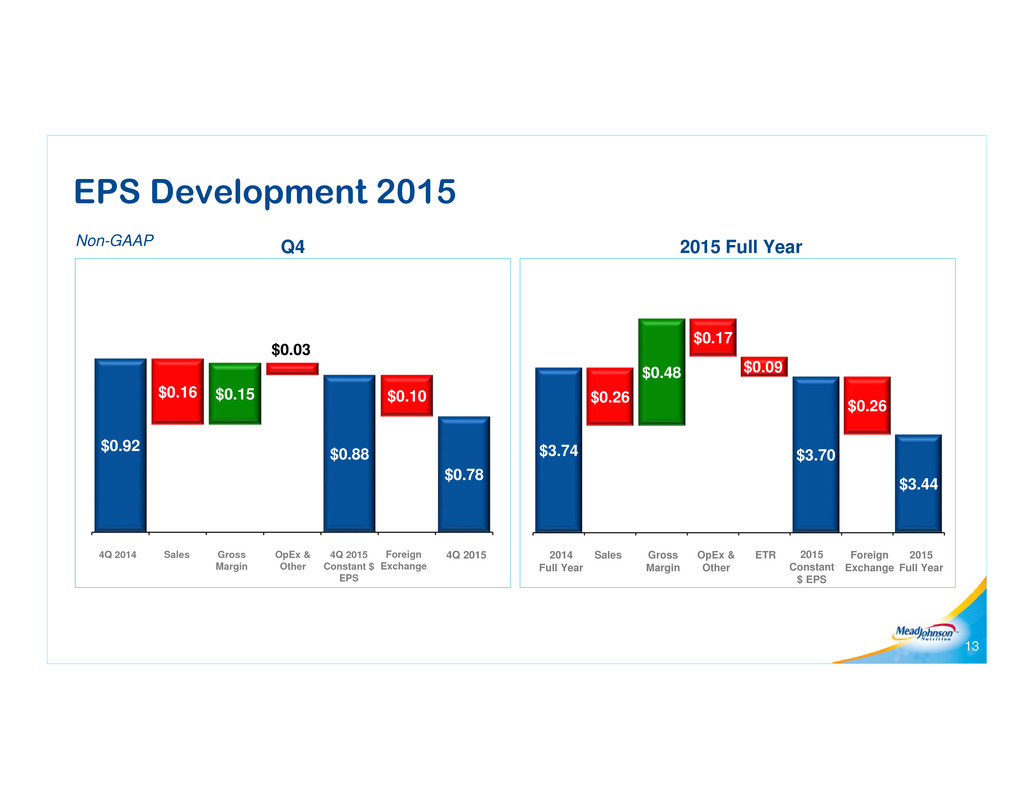
$3.74 $3.70 $3.44 $0.26 $0.48 $0.17 $0.09 $0.26 2014 Full Year Sales Gross Margin OpEx & Other ETR 2015 Constant $ EPS Foreign Exchange 2015 Full Year Q4 2015 Full Year EPS Development 2015 13 $0.92 $0.88 $0.78 $0.78 $0.16 $0.15 $0.03 $0.10 4Q 2014 Sales Gross Margin OpEx & Other 4Q 2015 Constant $ EPS Foreign Exchange 4Q 2015 Non-GAAP
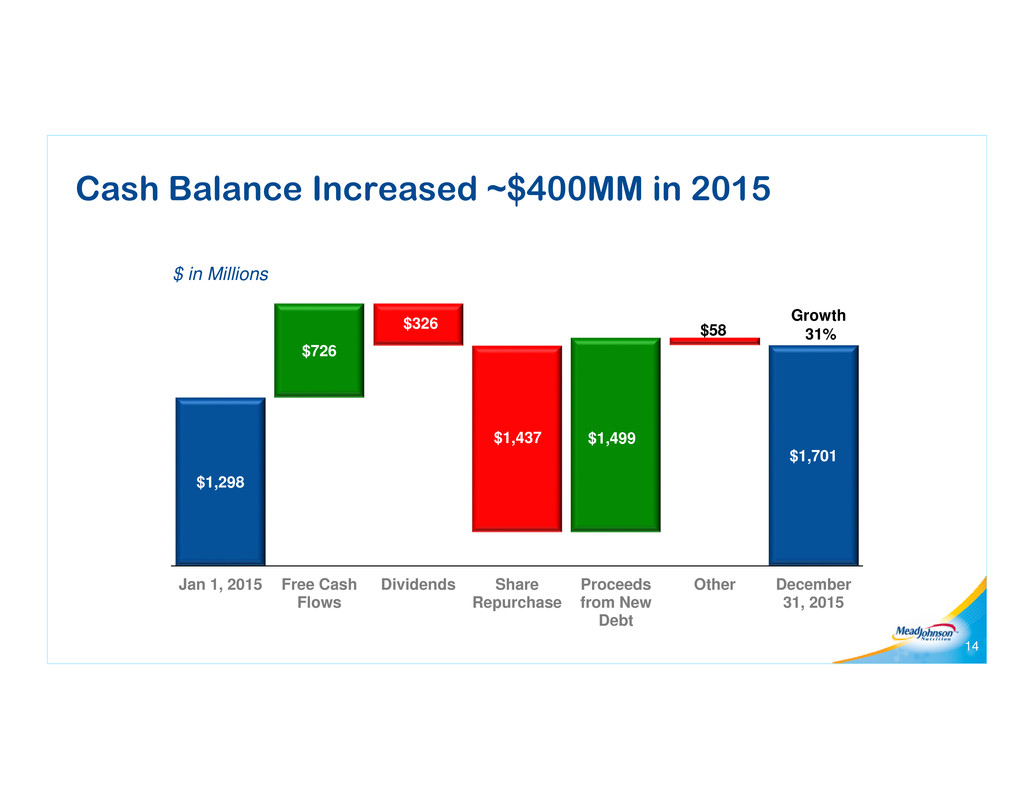
Cash Balance Increased ~$400MM in 2015 14 $1,298 $1,701 $726 $326 $1,437 $1,499 $58 Jan 1, 2015 Free Cash Flows Dividends Share Repurchase Proceeds from New Debt Other December 31, 2015 Growth 31% $ in Millions
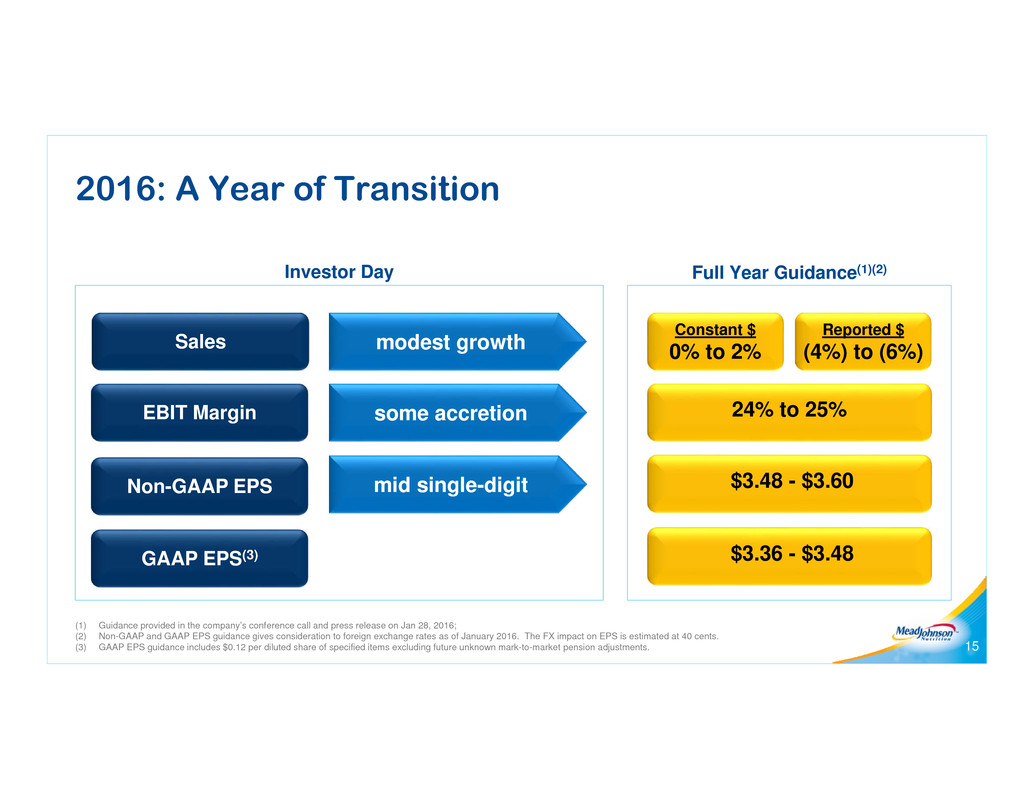
Investor Day Full Year Guidance(1)(2) 2016: A Year of Transition (1) Guidance provided in the company’s conference call and press release on Jan 28, 2016; (2) Non-GAAP and GAAP EPS guidance gives consideration to foreign exchange rates as of January 2016. The FX impact on EPS is estimated at 40 cents. (3) GAAP EPS guidance includes $0.12 per diluted share of specified items excluding future unknown mark-to-market pension adjustments. 15 Constant $ 0% to 2% mid single-digit modest growth some accretion Sales EBIT Margin Non-GAAP EPS 24% to 25% $3.48 - $3.60 GAAP EPS(3) $3.36 - $3.48 Reported $ (4%) to (6%)
16 Appendix
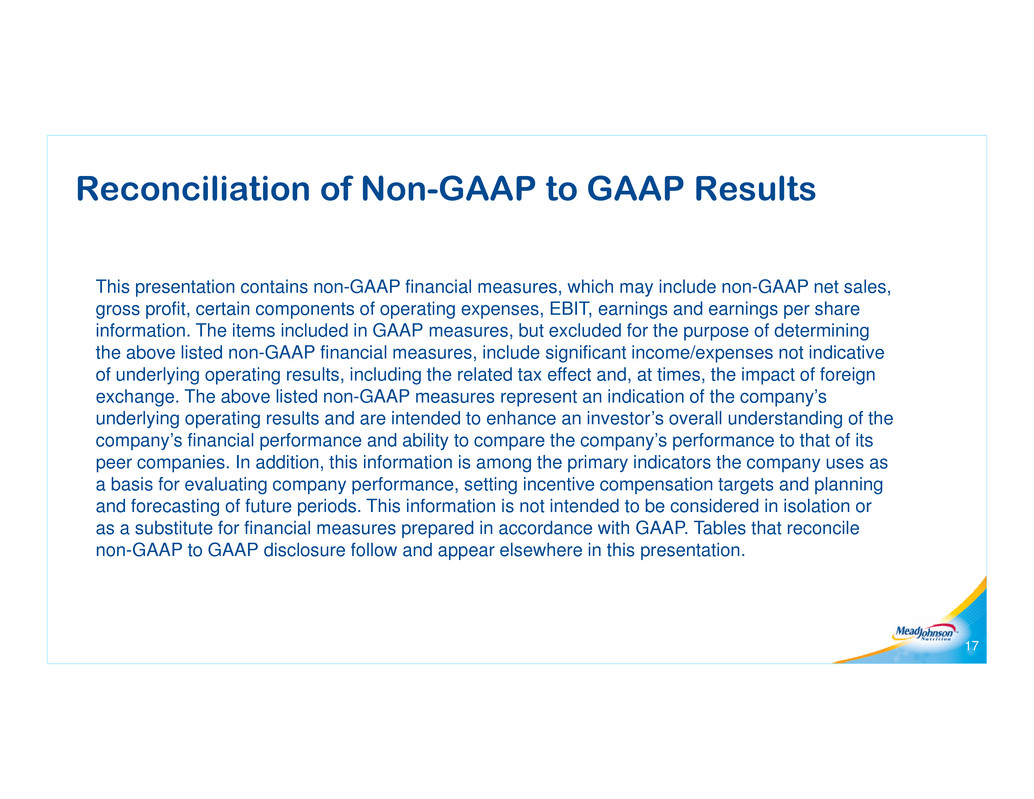
Reconciliation of Non-GAAP to GAAP Results 17 This presentation contains non-GAAP financial measures, which may include non-GAAP net sales, gross profit, certain components of operating expenses, EBIT, earnings and earnings per share information. The items included in GAAP measures, but excluded for the purpose of determining the above listed non-GAAP financial measures, include significant income/expenses not indicative of underlying operating results, including the related tax effect and, at times, the impact of foreign exchange. The above listed non-GAAP measures represent an indication of the company’s underlying operating results and are intended to enhance an investor’s overall understanding of the company’s financial performance and ability to compare the company’s performance to that of its peer companies. In addition, this information is among the primary indicators the company uses as a basis for evaluating company performance, setting incentive compensation targets and planning and forecasting of future periods. This information is not intended to be considered in isolation or as a substitute for financial measures prepared in accordance with GAAP. Tables that reconcile non-GAAP to GAAP disclosure follow and appear elsewhere in this presentation.
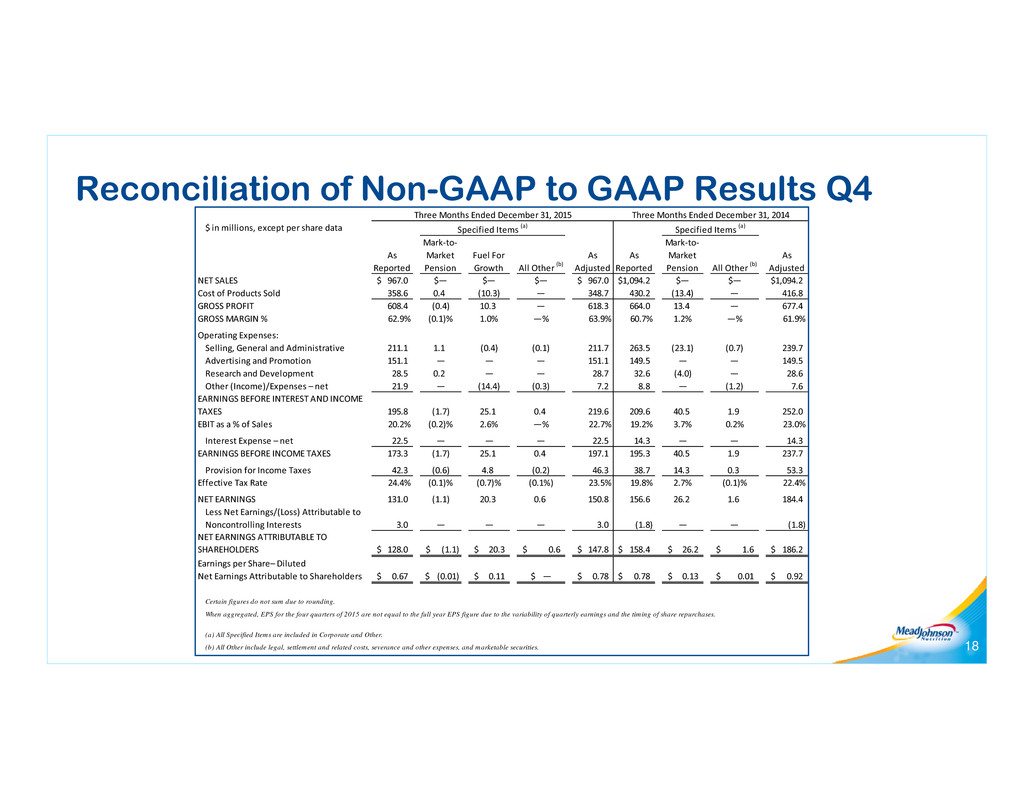
Reconciliation of Non-GAAP to GAAP Results Q4 18 $ in millions, except per share data As Reported Mark‐to‐ Market Pension Fuel For Growth All Other (b) As Adjusted As Reported Mark‐to‐ Market Pension All Other (b) As Adjusted 967.0$ $— $— $— 967.0$ 1,094.2$ $— $— 1,094.2$ 358.6 0.4 (10.3) — 348.7 430.2 (13.4) — 416.8 608.4 (0.4) 10.3 — 618.3 664.0 13.4 — 677.4 62.9% (0.1)% 1.0% —% 63.9% 60.7% 1.2% —% 61.9% Selling, General and Administrative 211.1 1.1 (0.4) (0.1) 211.7 263.5 (23.1) (0.7) 239.7 Advertising and Promotion 151.1 — — — 151.1 149.5 — — 149.5 Research and Development 28.5 0.2 — — 28.7 32.6 (4.0) — 28.6 Other (Income)/Expenses – net 21.9 — (14.4) (0.3) 7.2 8.8 — (1.2) 7.6 195.8 (1.7) 25.1 0.4 219.6 209.6 40.5 1.9 252.0 20.2% (0.2)% 2.6% —% 22.7% 19.2% 3.7% 0.2% 23.0% Interest Expense – net 22.5 — — — 22.5 14.3 — — 14.3 173.3 (1.7) 25.1 0.4 197.1 195.3 40.5 1.9 237.7 Provision for Income Taxes 42.3 (0.6) 4.8 (0.2) 46.3 38.7 14.3 0.3 53.3 24.4% (0.1)% (0.7)% (0.1%) 23.5% 19.8% 2.7% (0.1)% 22.4% 131.0 (1.1) 20.3 0.6 150.8 156.6 26.2 1.6 184.4 Less Net Earnings/(Loss) Attributable to Noncontrolling Interests 3.0 — — — 3.0 (1.8) — — (1.8) 128.0$ (1.1)$ 20.3$ 0.6$ 147.8$ 158.4$ 26.2$ 1.6$ 186.2$ 0.67$ (0.01)$ 0.11$ $ — 0.78$ 0.78$ 0.13$ 0.01$ 0.92$ Certain figures do not sum due to rounding. When aggregated, EPS for the four quarters of 2015 are not equal to the full year EPS figure due to the variability of quarterly earnings and the timing of share repurchases. (a) All Specified Items are included in Corporate and Other. (b) All Other include legal, settlement and related costs, severance and other expenses, and marketable securities. Three Months Ended December 31, 2015 Specified Items (a) Three Months Ended December 31, 2014 Specified Items (a) NET SALES Cost of Products Sold GROSS PROFIT GROSS MARGIN % Operating Expenses: EARNINGS BEFORE INTEREST AND INCOME TAXES Earnings per Share– Diluted Net Earnings Attributable to Shareholders EBIT as a % of Sales EARNINGS BEFORE INCOME TAXES Effective Tax Rate NET EARNINGS NET EARNINGS ATTRIBUTABLE TO SHAREHOLDERS
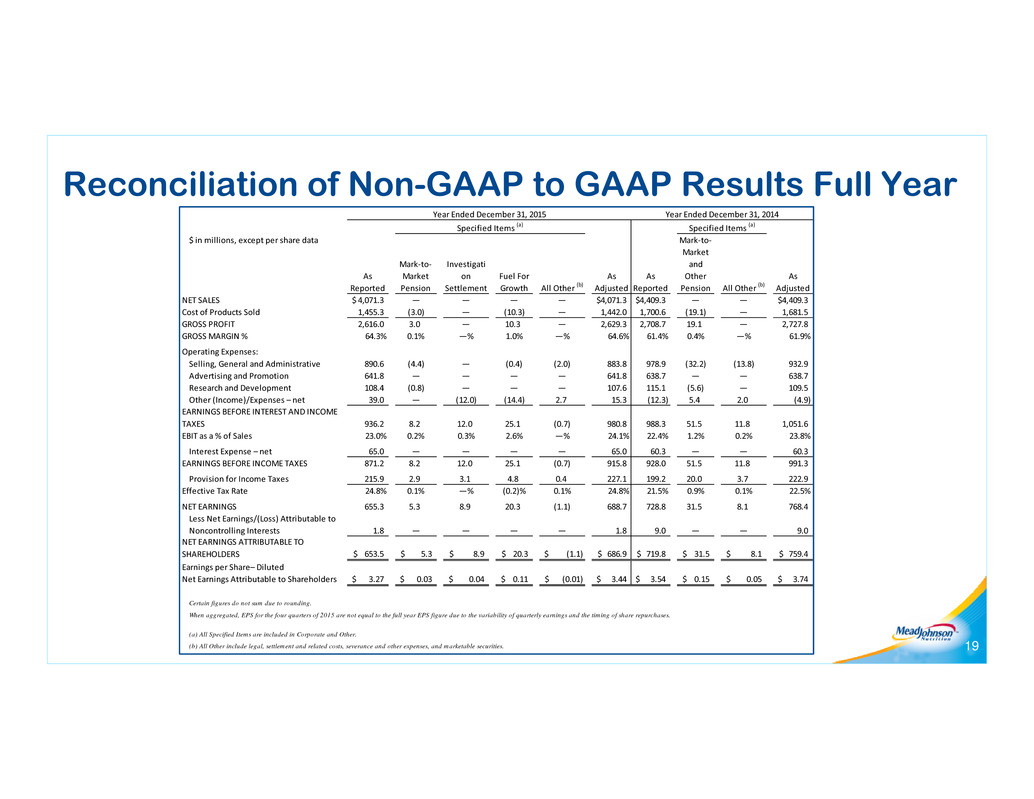
Reconciliation of Non-GAAP to GAAP Results Full Year 19 $ in millions, except per share data As Reported Mark‐to‐ Market Pension Investigati on Settlement Fuel For Growth All Other (b) As Adjusted As Reported Mark‐to‐ Market and Other Pension All Other (b) As Adjusted 4,071.3$ — — — — 4,071.3$ 4,409.3$ — — 4,409.3$ 1,455.3 (3.0) — (10.3) — 1,442.0 1,700.6 (19.1) — 1,681.5 2,616.0 3.0 — 10.3 — 2,629.3 2,708.7 19.1 — 2,727.8 64.3% 0.1% —% 1.0% —% 64.6% 61.4% 0.4% —% 61.9% Selling, General and Administrative 890.6 (4.4) — (0.4) (2.0) 883.8 978.9 (32.2) (13.8) 932.9 Advertising and Promotion 641.8 — — — — 641.8 638.7 — — 638.7 Research and Development 108.4 (0.8) — — — 107.6 115.1 (5.6) — 109.5 Other (Income)/Expenses – net 39.0 — (12.0) (14.4) 2.7 15.3 (12.3) 5.4 2.0 (4.9) 936.2 8.2 12.0 25.1 (0.7) 980.8 988.3 51.5 11.8 1,051.6 23.0% 0.2% 0.3% 2.6% —% 24.1% 22.4% 1.2% 0.2% 23.8% Interest Expense – net 65.0 — — — — 65.0 60.3 — — 60.3 871.2 8.2 12.0 25.1 (0.7) 915.8 928.0 51.5 11.8 991.3 Provision for Income Taxes 215.9 2.9 3.1 4.8 0.4 227.1 199.2 20.0 3.7 222.9 24.8% 0.1% —% (0.2)% 0.1% 24.8% 21.5% 0.9% 0.1% 22.5% 655.3 5.3 8.9 20.3 (1.1) 688.7 728.8 31.5 8.1 768.4 Less Net Earnings/(Loss) Attributable to Noncontrolling Interests 1.8 — — — — 1.8 9.0 — — 9.0 653.5$ 5.3$ 8.9$ 20.3$ (1.1)$ 686.9$ 719.8$ 31.5$ 8.1$ 759.4$ 3.27$ 0.03$ 0.04$ 0.11$ (0.01)$ 3.44$ 3.54$ 0.15$ 0.05$ 3.74$ Certain figures do not sum due to rounding. When aggregated, EPS for the four quarters of 2015 are not equal to the full year EPS figure due to the variability of quarterly earnings and the timing of share repurchases. (a) All Specified Items are included in Corporate and Other. (b) All Other include legal, settlement and related costs, severance and other expenses, and marketable securities. Year Ended December 31, 2015 Specified Items (a) Specified Items (a) Year Ended December 31, 2014 NET SALES Cost of Products Sold GROSS PROFIT GROSS MARGIN % Operating Expenses: EARNINGS BEFORE INTEREST AND INCOME TAXES Earnings per Share– Diluted Net Earnings Attributable to Shareholders EBIT as a % of Sales EARNINGS BEFORE INCOME TAXES Effective Tax Rate NET EARNINGS NET EARNINGS ATTRIBUTABLE TO SHAREHOLDERS
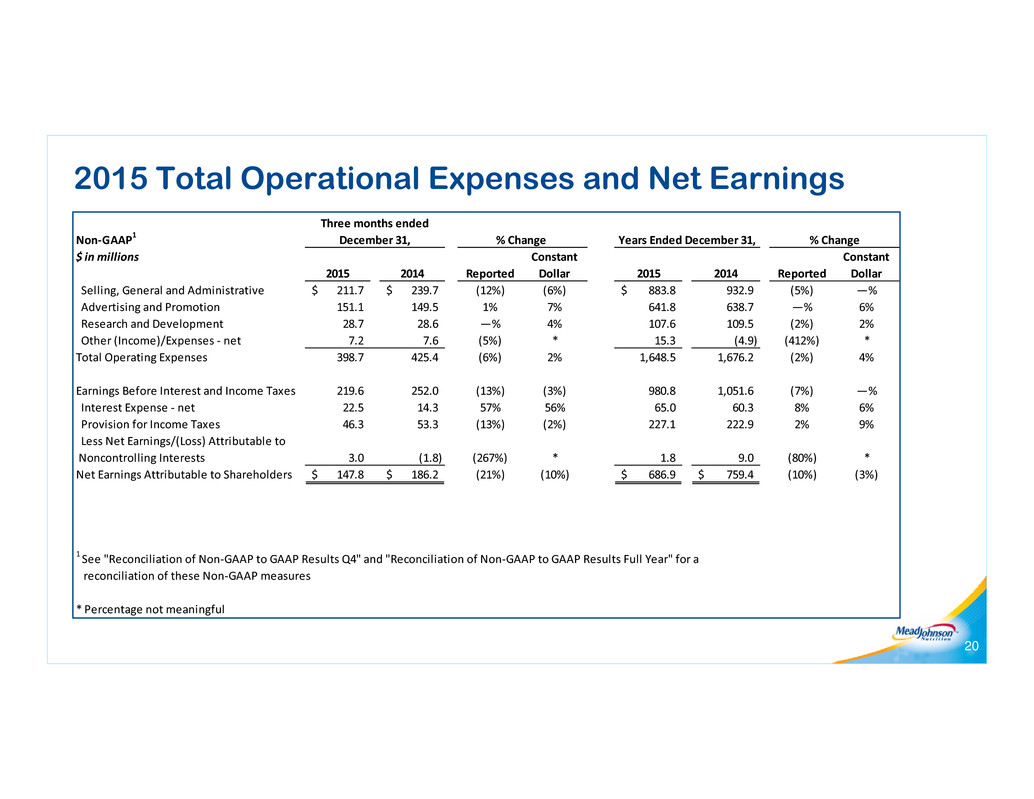
20 2015 Total Operational Expenses and Net Earnings Non‐GAAP1 $ in millions 2015 2014 Reported Constant Dollar 2015 2014 Reported Constant Dollar Selling, General and Administrative 211.7$ 239.7$ (12%) (6%) 883.8$ 932.9 (5%) —% Advertising and Promotion 151.1 149.5 1% 7% 641.8 638.7 —% 6% Research and Development 28.7 28.6 —% 4% 107.6 109.5 (2%) 2% Other (Income)/Expenses ‐ net 7.2 7.6 (5%) * 15.3 (4.9) (412%) * Total Operating Expenses 398.7 425.4 (6%) 2% 1,648.5 1,676.2 (2%) 4% Earnings Before Interest and Income Taxes 219.6 252.0 (13%) (3%) 980.8 1,051.6 (7%) —% Interest Expense ‐ net 22.5 14.3 57% 56% 65.0 60.3 8% 6% Provision for Income Taxes 46.3 53.3 (13%) (2%) 227.1 222.9 2% 9% Less Net Earnings/(Loss) Attributable to Noncontrolling Interests 3.0 (1.8) (267%) * 1.8 9.0 (80%) * Net Earnings Attributable to Shareholders 147.8$ 186.2$ (21%) (10%) 686.9$ 759.4$ (10%) (3%) 1 See "Reconciliation of Non‐GAAP to GAAP Results Q4" and "Reconciliation of Non‐GAAP to GAAP Results Full Year" for a reconciliation of these Non‐GAAP measures * Percentage not meaningful Years Ended December 31, % Change Three months ended December 31, % Change
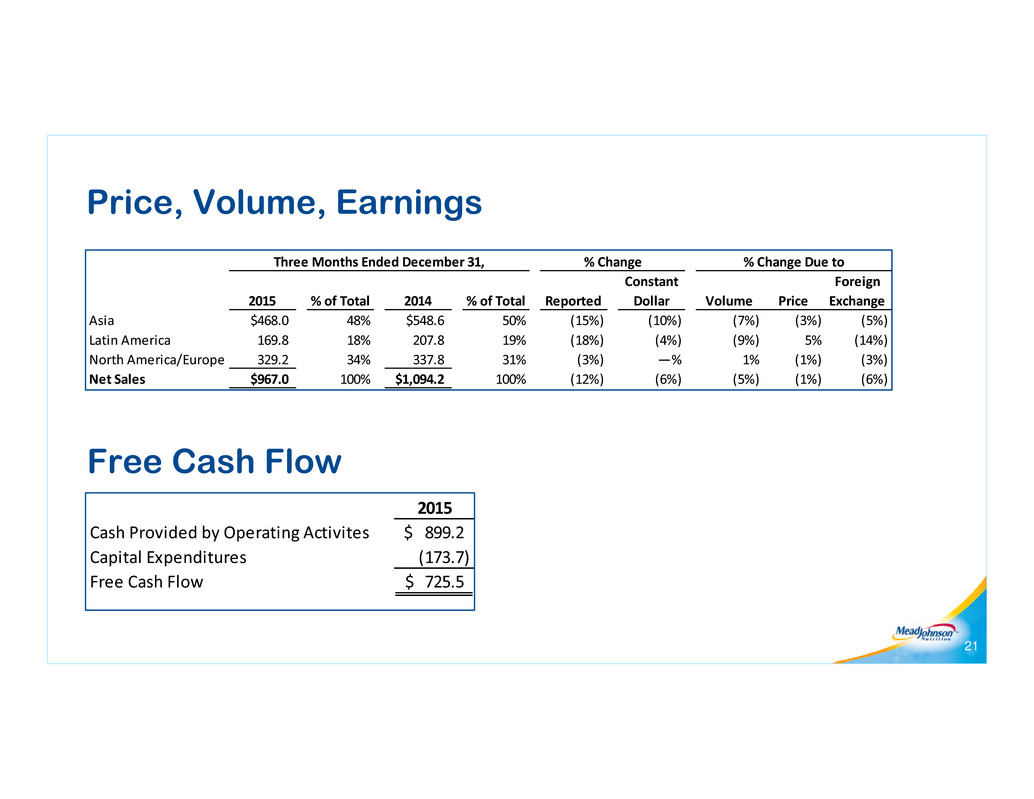
Free Cash Flow 21 Price, Volume, Earnings 2015 Cash Provided by Operating Activites 899.2$ Capital Expenditures (173.7) Free Cash Flow 725.5$ 2015 % of Total 2014 % of Total Reported Constant Dollar Volume Price Foreign Exchange Asia $468.0 48% $548.6 50% (15%) (10%) (7%) (3%) (5%) Latin America 169.8 18% 207.8 19% (18%) (4%) (9%) 5% (14%) North America/Europe 329.2 34% 337.8 31% (3%) —% 1% (1%) (3%) Net Sales $967.0 100% $1,094.2 100% (12%) (6%) (5%) (1%) (6%) Three Months Ended December 31, % Change % Change Due to
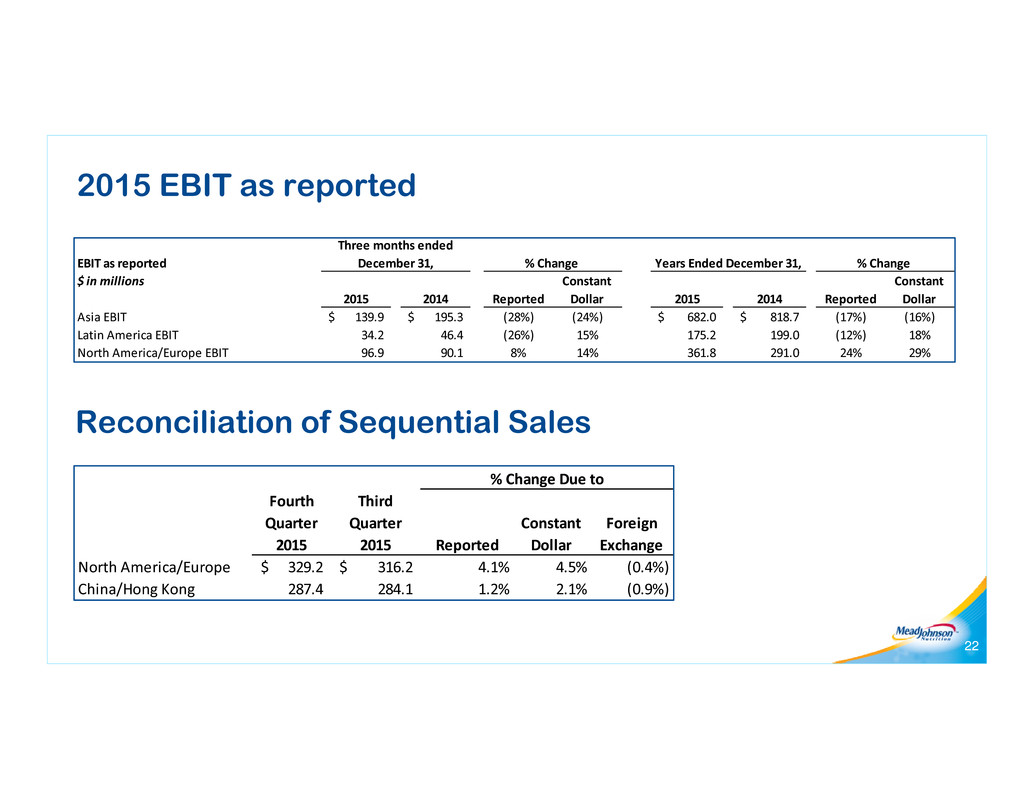
22 2015 EBIT as reported Reconciliation of Sequential Sales EBIT as reported $ in millions 2015 2014 Reported Constant Dollar 2015 2014 Reported Constant Dollar Asia EBIT 139.9$ 195.3$ (28%) (24%) 682.0$ 818.7$ (17%) (16%) Latin America EBIT 34.2 46.4 (26%) 15% 175.2 199.0 (12%) 18% North America/Europe EBIT 96.9 90.1 8% 14% 361.8 291.0 24% 29% % Change Three months ended December 31, % Change Years Ended December 31, Fourth Quarter 2015 Third Quarter 2015 Reported Constant Dollar Foreign Exchange North America/Europe 329.2$ 316.2$ 4.1% 4.5% (0.4%) China/Hong Kong 287.4 284.1 1.2% 2.1% (0.9%) % Change Due to
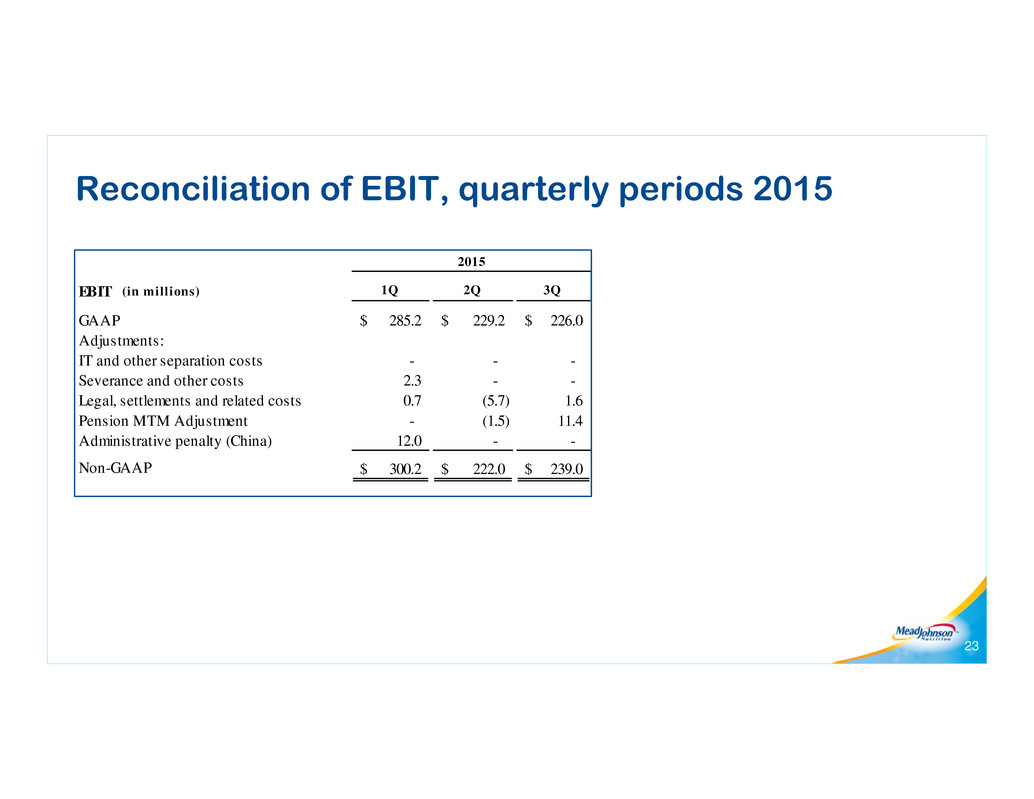
Reconciliation of EBIT, quarterly periods 2015 23 EBIT (in millions) 1Q 2Q 3Q GAAP 285.2$ 229.2$ 226.0$ Adjustments: IT and other separation costs - - - Severance and other costs 2.3 - - Legal, settlements and related costs 0.7 (5.7) 1.6 Pension MTM Adjustment - (1.5) 11.4 Administrative penalty (China) 12.0 - - Non-GAAP 300.2$ 222.0$ 239.0$ 2015
